Embed Size (px)
Citation preview
Hindawi Publishing CorporationInternational Journal of AgronomyVolume 2010, Article ID 863605, 11 pagesdoi:10.1155/2010/863605
Research Article
Effect of Abiotic Stresses on the Nondestructive Estimation ofRice Leaf Nitrogen Concentration
Stephan M. Haefele,1 Joel D. L. C. Siopongco,2 Serafin T. Amarante,1 and To Phuc Tuong1
1 Crop and Environmental Sciences Division, International Rice Research Institute (IRRI), Los Banos, Laguna, DAPO Box 7777,Metro Manila, Philippines
2 Department of Rice Research, National Institute of Crop Science, 2-1-18, Kannondai, Tsukuba, Ibaraki, 305-8518, Japan
Correspondence should be addressed to Stephan M. Haefele, [email protected]
Received 25 December 2009; Revised 17 May 2010; Accepted 17 May 2010
Academic Editor: Rodomiro Ortiz
Copyright © 2010 Stephan M. Haefele et al. This is an open access article distributed under the Creative Commons AttributionLicense, which permits unrestricted use, distribution, and reproduction in any medium, provided the original work is properlycited.
Decision support tools for non-destructive estimation of rice crop nitrogen (N) status (e.g., chlorophyll meter [SPAD] or leafcolor chart [LCC]) are an established technology for improved N management in irrigated systems, but their value in rainfedenvironments with frequent abiotic stresses remains untested. Therefore, we studied the effect of drought, salinity, phosphorus (P)deficiency, and sulfur (S) deficiency on leaf N estimates derived from SPAD and LCC measurements in a greenhouse experiment.Linear relations between chlorophyll concentration and leaf N concentration based on dry weight (Ndw) between SPAD valuesadjusted for leaf thickness and Ndw and between LCC scores adjusted for leaf thickness and Ndw could be confirmed for alltreatments and varieties used. Leaf spectral reflectance measurements did not show a stress-dependent change in the reflectancepattern, indicating that no specific element of the photosynthetic complex was affected by the stresses and at the stress levelapplied. We concluded that SPAD and LCC are potentially useful tools for improved N management in moderately unfavorablerice environments. However, calibration for the most common rice varieties in the target region is recommended to increase theprecision of the leaf N estimates.
1. Introduction
For more than a decade, considerable efforts have been madeto develop and establish improved nutrient managementoptions for rice (Oryza sativa L.). The goals were conceptsand tools allowing site- and season-specific (i.e., real-time)adaptation of nutrient management recommendations [1].These efforts resulted in technologies contributing con-siderably to increased productivity of Asian rice farmers,improved use efficiency of scarce and expensive resources,and reduced detrimental environmental effects [2]. However,these developments are mostly limited to irrigated systemsbecause the improved nutrient management technologiesdid not target rainfed rice systems. But recent develop-ments show that, because of the increasing availability ofinput responsive varieties for rainfed lowlands [3], theseenvironments are characterized by the fastest yield growthrates, often enabled by increasing fertilizer use. Therefore,
improved fertilizer technologies are also needed for rainfedlowlands in order to increase the productivity of rice farmingin these environments to maximize the efficiency of fertilizeruse and to minimize negative environmental side effects ofsuch practices.
Nitrogen (N) as the most commonly used fertilizerelement and the one limiting growth in the majority of envi-ronments is the most adequate target for site- and season-specific nutrient management. In irrigated environments,portable field tools to monitor crop N status are increasinglyused for the fine-tuning of N management throughoutthe season. Widely used tools in rice are the chlorophyllmeter (SPAD) and the leaf color chart (LCC) [4–7]. Bothtools are based on the relation between leaf chlorophyllconcentration, which largely determines leaf color, and isan important parameter determining photosynthetic rateand biomass production and leaf N concentration (e.g.,[8]). However, it is well known from field observations that
2 International Journal of Agronomy
abiotic stresses, which are much more common in rainfedrice environments than in irrigated systems, can affect leafcolor [9]. Widespread abiotic stresses in rainfed lowlands aredrought, submergence, salinity, P deficiency, and soil acidity;less common stresses are K, S, Zn, and Fe deficiency and Fetoxicity [3, 10]. However, little is known whether and howsuch leaf color changes in rice affect estimates of crop Nstatus based on tools such as SPAD or the LCC.
Therefore, the objective of our study was to investigatein a greenhouse trial (i) the effect of selected abioticstresses on chlorophyll and leaf N concentration and (ii) toevaluate whether leaf N estimates based on SPAD or LCCmeasurements would still be reliable under these conditions.A set of different rice varieties were used in the study torepresent typical germplasm grown in rainfed environmentsand also to include potentially different varietal response toabiotic stresses.
2. Materials and Methods
We conducted a greenhouse experiment at the end of the dryseason/beginning of the wet season in 2005 (April to July) atthe International Rice Research Institute (IRRI) in Los Banos,Laguna, Philippines (14◦11′ N, 121◦15′ E; elevation 21 m).Treatments were designed to investigate the effect of fourdifferent abiotic stresses: drought (±W), salinity (±SAL),phosphorus deficiency (±P), and sulfur deficiency (±S). Alltreatments and varieties used are shown in Table 1. Thevarieties used were chosen to represent recently developed,modern germplasm (IR72, IR65192-4B-10-3, PSBRc9) aswell as older or even traditional cultivars (Mahsuri, Swarna,Dular). Two of these cultivars were reported to have a higherstress tolerance, IR65192-4B-10-3 for salinity [11] and Dularfor P deficiency [12]. Each treatment × variety combinationwas replicated three times, and each replication consisted offour pots with three individual rice plants (except for salinitystress, for which only two plants per pot were used). Innerpot diameter was 0.15 m for salinity treatments (includingthe nonsaline control) and 0.25 m for all other treatments.Soil column depth was 0.45 m for the water stress treatments,0.2 m for S and P treatments, and 0.12 m for the salinitytreatments.
Drought stress was applied by lowering the soil waterpotential to around −50 kPa at 15 cm depth from 34 to 46days after seeding (DAS) and from 75 to 84 DAS (monitoreddaily with ceramic cup tensiometers following the protocoldescribed in [13]). According to Bouman and Tuong [14],this soil moisture potential represents considerable droughtstress for most rice varieties. In all nondrought treatments,a water layer of 0.05 m depth was maintained from earlyseedling stage (10 DAS) to harvest. For the salinity treatment,perforated pots were used, and all pots of one replicationwere placed in a large tub. For the saline treatment, waterconductivity in the tub was maintained at 0.3 S m−1 in theearly phase (21 to 40 DAS) and at 0.6 S m−1 in the latergrowth stages (41 DAS to maturity), which was monitoredand adjusted daily (modified from [15]). Soils used forthe experiment were collected from the IRRI experimentalfarm at Los Banos, Laguna, for the drought and salinity
Table 1: Average grain weight, straw weight, and panicle number atmaturity for all treatments and all varieties used in the greenhouseexperiment, including results of the analysis of variance conductedseparately for each stress treatment.
Variety Treatment(b) Grainweight
Strawweight
Paniclenumber
(g per pot) (g per pot) (per pot)
IR72 +W 48.5 69.5 30.7
IR72 –W 65.1 91.9 39.7
Mahsuri +W 46.8 207.4 28.1
Mahsuri –W 60.6 217.2 34.4
PSBRc9 +W 45.4 64.0 17.3
PSBRc9 –W 67.0 91.8 23.1
Swarna +W 52.9 87.5 27.7
Swarna –W 87.6 117.6 38.6
Treatment (a) ∗∗∗ ∗∗∗ ∗∗∗
Variety ∗ ∗∗∗ ∗∗∗
T×V ns ns ns
IR65192-4B-10-3
–Sal 61.2 b 132.9 a 16.2 a
IR65192-4B-10-3
+Sal 1.2 d 90.1 c 5.0 c
IR72 –Sal 71.0 a 113.5 b 15.5 a
IR72 +Sal 12.5 c 82.9 c 11.1 b
Treatment (a) ∗∗∗ ∗∗ ∗∗∗
Variety ∗∗∗ ns Ns
T×V Ns ns Ns
IR72 +S 18.9 ns 31.2 a 13.3 ns
IR72 –S 19.3 ns 28.7 b 12.5 ns
Treatment (a) ns ∗ ns
Dular +P 18.4 23.2 9.7
Dular –P 14.3 16.4 8.5
IR72 +P 21.6 26.1 14.0
IR72 –P 14.6 15.3 11.4
Treatment (a) ∗∗∗ ∗∗∗ ∗∗
Variety ns ns Ns
T×V ns �� Ns(a) Significance levels indicated for the ANOVA are ns: P > .05; ∗: .05 ≤P ≤ .01; ∗∗: .01 ≤ P ≤ .001; ∗∗∗: P < .001.(b)Note that the nonstressed control treatments are indicated by +W, +S, and+P, but by –Sal.
treatments, from a known P-deficient site in Pangil, Laguna(60 km east of IRRI), and from a known S-deficient site inSan Juan, Batangas (70 km southwest of IRRI). Respectiveanalytical soil results are given in Table 2. Inorganic fertilizerquantity per pot was calculated based on the number ofplants per pot, the medium rate of 60-40-40 kg N-P2O5-K2Oper hectare, and the average plant density in the field of20 plants per m2. Fertilizers used were urea (460 g N kg−1),triple superphosphate (460 g P2O5kg−1), muriate of potash(600 g K2O kg−1), and ammonium sulfate (210 g N kg−1,

International Journal of Agronomy 3
Table 2: Some characteristics of the soils used for the four differentabiotic stresses tested.
Soil used for
Soilproperty
UnitDrought
andsalinity
Sulfurdeficiency
Phosphorusdeficiency
pH (1:1) (-) 5.8 7.1 5.1
Corg (g kg−1) 20 16 11
Total N (g kg−1) 2.0 1.5 1.1
Olsen P (mg kg−1) 41 25 2.4
CEC (cmol kg−1) 24.5 34.5 19.6
SO4−2 S (mg kg−1) nd 0.6 nd
Sand (g kg−1) 280 110 30
Silt (g kg−1) 360 430 370
Clay (g kg−1) 360 460 600
240 g SO2 kg−1). The nutrient amount applied per plantwas 300 mg N, 87 mg P, 166 mg K, and 87 mg S (butthe ammonium sulfate fertilizer was only used in the +Streatment). No P and no S were applied in the P-stressand the S-stress treatments, respectively. All fertilizers wereincorporated before seeding.
For P, S, and salinity treatments, leaf chlorophyll andleaf N parameters were determined at 29, 50, and 68DAS. For the drought treatment, the same parameters weredetermined before the stress period (34 and 75 DAS), atthe end (47 and 85 DAS), and 10 days after the stressperiod (57 and 95 DAS). At each sampling date and for eachtreatment, measurements started with a chlorophyll meter(SPAD-502, Minolta) and a leaf color chart reading (LCC,IRRI standard). SPAD and LCC readings were conductedfor 12 leaves (one youngest fully expanded leaf [Y-leaf]of each plant in a pot); for measurement procedures seePeng et al. [16] and Balasubramanian [17]. All measuredY-leaf blades were detached and immediately stored on ice.Six of these Y-leaves were used for further determinationof leaf spectral reflectance (spectrophotometer CM-3700d,Minolta), leaf area (LI-3000, LiCOR, Lincoln, NE, USA),dry weight, and total N. Reflectance was measured in 10-nm bandwidths from 400 to 700 nm wavelength (three scansper leaf blade). Dry weight was determined after oven-drying at 70◦C to constant weight. Specific leaf weight(SLW) was calculated as the ratio of dry weight to leaf area.Total leaf N was analyzed by micro-Kjeldahl digestion anddistillation [18]. Leaf N concentration was expressed on adry weight (Ndw) and leaf area (Na) basis. The other six Y-leaves were used for the determination of chlorophyll contentaccording to Mackinney [19]. Chlorophyll concentration wasalso expressed on a dry weight (Chdw) and leaf area (Cha)basis. At maturity, all above-ground biomass was harvestedand analyzed for panicle number, grain yield, grain moisturecontent, and straw yield.
For each stress, all pots with a different treatment xvariety combination were clustered in a block, and all blockswere oriented perpendicular to the southern side of the
greenhouse to ensure a homogeneous exposure to the lightgradient along the greenhouse wall. Distance between thepots was about 0.15 m. The experimental layout withineach block represented a randomized complete block design.Standard ANOVA and linear regression analysis, includingthe F-test for homogeneity of regression coefficients, wereapplied for the statistical analysis using Jandel ScientificSoftware SigmaStat 2.0 (SPSS Science, Chicago, IL, USA).
3. Results
3.1. General Indicators and Effects of the Applied Stresses.In the drought stress treatment (−W), the water tensionat 0.15 m depth was fluctuating slightly around the targetof −50 kPa, and the observed average soil water tensionwas −47 kPa during both drought phases. But, contrary toexpectations, drought stress consistently and significantlyincreased grain yield, straw yield, and tiller number per pot(Table 1). Mahsuri had a significantly higher straw yield, andSwarna had the highest average grain yield. Salinity (+Sal) aswell as P deficiency (−P) significantly reduced grain yield,straw yield, and tiller number, but only straw weight wassignificantly affected by the sulfur treatments (±S). AverageP concentrations of the Y-leaf measured at 29, 50, and 68DAS in both P treatments differed significantly only at 29DAT (1.1 g kg−1 and 1.3 g kg−1 for IR72 and the –P and+P treatment, resp.; 0.9 g kg−1 and 1.1 g kg−1 for Dular andthe –P and +P treatment resp.), but all P concentrationvalues were close to the critical lower value of 1 g kg−1
P, a threshold suggested by Dobermann and Fairhurst in[9]. Y-leaf S concentrations also differed significantly at 29DAS (2.4 g kg−1 and 2.6 g kg−1 for IR72 and the –S and +Streatment, resp.), but both values were above the criticallower value of 1.6 g kg−1 S [9]. However, the observed Sconcentrations were at or even below this threshold at latersamplings (1.6 g kg−1 at 50 DAS, 1.3 g kg−1 at 68 DAS) but nodifferences between treatments could be detected anymore.
3.2. Stress Effect on Non-Destructive Leaf-N Estimation. Therelationship between Y-leaf chlorophyll and N concentrationbased on dry weight (Chdw and Ndw) for all individualmeasurements is shown in Figure 1, which includes datafrom samplings of all treatments, varieties, and crop growthstages (n = 210). Although the values cover a considerablerange, a linear relationship is strongly indicated and highlysignificant. Linear regression analysis for the individualtreatments (average of all varieties in one treatment) showedhomogeneity of regression coefficients with the exception ofthe +W treatment. Because the latter was caused only by afew early measurements for variety Swarna (low Ndw andhigh CHdw values, see Figure 1), the regression was calculatedfor the complete data set. In Figure 2, SPAD and LCC valueswere adjusted for leaf thickness (specific leaf weight (SLW))because of the previously described effect of leaf thicknesson the relation between leaf color measured by SPAD orthe LCC and leaf N based on dry weight [20]. Data fromall samplings (including all treatments, varieties, and cropgrowth stages; n = 210) were used for calculating the linear

4 International Journal of Agronomy
10
15
20
25
30
35
40
45
50
Ndw
(mg
g−1)
2 4 6 8 10 12 14 16
Chdw (mg g−1)
−W+W−Sal+Sal
−S+S−P+P
y = 11.18 + 2.17×r2 = 0.64;P < .001
Figure 1: Leaf chlorophyll concentration (Chdw) versus leaf N con-centration (Ndw), both based on dry weight, in a 2005 greenhousetrial. Data from all samplings and treatments (n = 210) wereincluded for the linear regression analysis.
regression of SPAD/SLW versus Ndw in Figure 2(a) whereasvalue pairs from measurements at very early crop growthstages (≤31 DAS) in Figure 2(b) (LCC/SLW versus Ndw) werenot included based on a significant difference indicated bythe F-test for homogeneity of regression coefficients. Thesemeasurements constituted a distinct group of outliers in therelation presented (Figure 2(b)) and when comparing LCCwith SPAD values (data not shown). With this exception,Ndw was linearly related to SPAD and LCC measurementsadjusted for SLW given the conditions of the experiment.
Leaf spectral reflectance scans were conducted to verifywhether the reflectance patterns were influenced by theapplied stresses. Figure 3 shows representative scans forall stress and control treatments at 29 DAS (for salinity,P and S deficiency) and at 47 DAS (at the end of thefirst drought phase for the water stress setup). Althoughthere were differences in reflectance between treatments andvarieties, the reflectance pattern over the scanned wavelengthinterval remained stable. The same observation appliedto all other scans conducted at the other sampling dates(data not shown). The field observation of a comparativelydark leaf color for the variety Swarna was confirmed bythe observed low reflectance values (Figure 3). Darker leafcolors were also indicated by the low reflectance valuesfor the stress treatments +Sal and –P, which also confirmsfield observations of darker leaf colors for stressed plants.In contrast, S deficiency is characterized by lighter leafcolors, fitting to the high reflectance values at 550 nm forthis treatment. To test the hypothesis that reflectance is abetter indicator of leaf N than SPAD or LCC because itis less influenced by leaf thickness [21], we compared thereflectance at 550 nm (maximum reflectance for all scansconducted) with leaf Ndw for all treatments, varieties, andcrop growth stages (n = 210). Reflectance does increase
10
15
20
25
30
35
40
45
50
Ndw
(mg
g−1)
0.4 0.6 0.8 1 1.2 1.4
SPAD value/SLW
−W+W−Sal+Sal
−S+S−P+P
y = 0.73 + 28.96×r2 = 0.6;P < .001
(a)
10
15
20
25
30
35
40
45
50
Ndw
(mg
g−1)
0.04 0.06 0.08 0.1 0.12 0.14 0.16 0.18 0.2
LCC value/SLW
−W+W−Sal+Sal
−S+S−P
+P< 31 DAS
y = 3.55 + 191.31×r2 = 0.58;P < .001
(b)
Figure 2: Leaf N concentration based on dry weight (Ndw) versus(a) chlorophyll meter (SPAD) and (b) leaf color chart (LCC)values, both adjusted for specific leaf weight (SLW). Data fromall samplings and treatments (n = 210) were used for the linearregression in (a) whereas value pairs from measurements at veryearly crop growth stages (≤31 DAS) in (b) were not included.
with decreasing Ndw, but the same reflectance indicates muchhigher Ndw values in early plant development compared withlater development stages (Figure 4). Within each samplingperiod, no significant effects of applied stresses on reflectanceversus Ndw relations could be detected using the F-test forhomogeneity of regression coefficients.
3.3. Abiotic Stresses and Their Effect on the Dynamics ofLeaf N Characteristics. Tables 3 and 4 show the results ofthe analysis of variance and mean treatment values for

International Journal of Agronomy 5
4
6
8
10
12
14
16
18R
eflec
tan
ce(%
)
450 500 550 600 650 700
Wavelength (nm)
IR72 + WIR72 −WPSBCRc9 + WPSBCRc9 −W
Mahsuri + WMahsuri −WSwarna + WSwarna −W
(a)
4
6
8
10
12
14
16
18
Refl
ecta
nce
(%)
450 500 550 600 650 700
Wavelength (nm)
IR72 − SalIR72 + SalIR65192 − SalIR65192 + Sal
(b)
4
6
8
10
12
14
16
18
Refl
ecta
nce
(%)
450 500 550 600 650 700
Wavelength (nm)
IR72 − SIR72 + S
(c)
4
6
8
10
12
14
16
18
Refl
ecta
nce
(%)
450 500 550 600 650 700
Wavelength (nm)
IR72 − PIR72 + P
Dular − PDular + P
(d)
Figure 3: Leaf spectral reflectance scans for all stress and control treatments at 29 DAS (for salinity [±Sal], phosphorus [±P] deficiency,and sulfur [±S] deficiency) and at 47 DAS (at the end of the first drought phase for the water stress setup [±W]). Each curve represents theaverage of three replications.
the parameters chlorophyll and leaf N concentration basedon leaf area (Cha and Na) and dry weight (Chdw andNdw). Although not always statistically significant, somegeneral trends can be observed. Stress treatments influenced
chlorophyll concentration (Cha and Chdw) significantly inalmost all cases whereas the effects on N concentration wereharder to detect. Drought caused a lower mean chlorophyllconcentration and a stable or increased leaf N concentration

6 International Journal of Agronomy
10
15
20
25
30
35
40
45
50
Ndw
(mg
g−1)
10 12 14 16 18 20 22
Reflectance at 550 nm (%)
29-46 DAS47-57 DAS68-95 DAS
Figure 4: Reflectance at 550 nm versus leaf N concentration basedon dry weight (Ndw) for all samplings and treatments (n = 210).Linear regression was conducted separately for three samplingperiods: 29 to <47 days after seeding (DAS), 47 to 57 DAS, and 68to 95 DAS.
Table 3: Analysis of variance for the effect of water treatment,variety, and sampling date on specific leaf weight (SLW) and on leafchlorophyll and N concentration (Cha and Na: area based; Chdw andNdw: dry weight based). Included are mean treatment values acrossvarieties and sampling dates for the two water treatments (±W).
SLWg m−2
Cha
g m−2Na
g m−2Chdw
mg g−1Ndw
mg g−1
Source ofvariation(a)
Treatment (T) ns ∗∗∗ ∗ ∗∗∗ ∗
Variety (V) ∗∗∗ ∗∗∗ ∗∗∗ ∗∗∗ ∗∗∗
Sampling (S) ∗∗∗ ∗∗∗ ∗∗∗ ∗∗∗ ∗∗∗
T×V ns ns ns ns ns
T×S ns ∗ ∗∗∗ ∗ ∗∗∗
V×S ns ∗∗ ∗∗∗ ∗ ∗∗∗
T×V×S ns ns ∗∗ ns ∗
Treatmentmean(b)
+W 42.2 a 0.35 a 1.20 b 8.48 a 28.8 b
–W 42.9 a 0.33 b 1.24 a 7.89 b 29.5 a(a) Significance levels indicated for the ANOVA are ns: P > .05; ∗: .05 ≤ P ≤.01; ∗∗: .01 ≤ P ≤ .001; ∗∗∗: P < .001.(b) Values in a column followed by the same letter are not significantlydifferent at P > .05 according to the Tukey test.
for all varieties (Table 3). Contrary to this observation,the other stresses increased both chlorophyll and leaf Nconcentration (Table 4). Although there was a considerablevarietal effect on the parameters presented, treatment ×
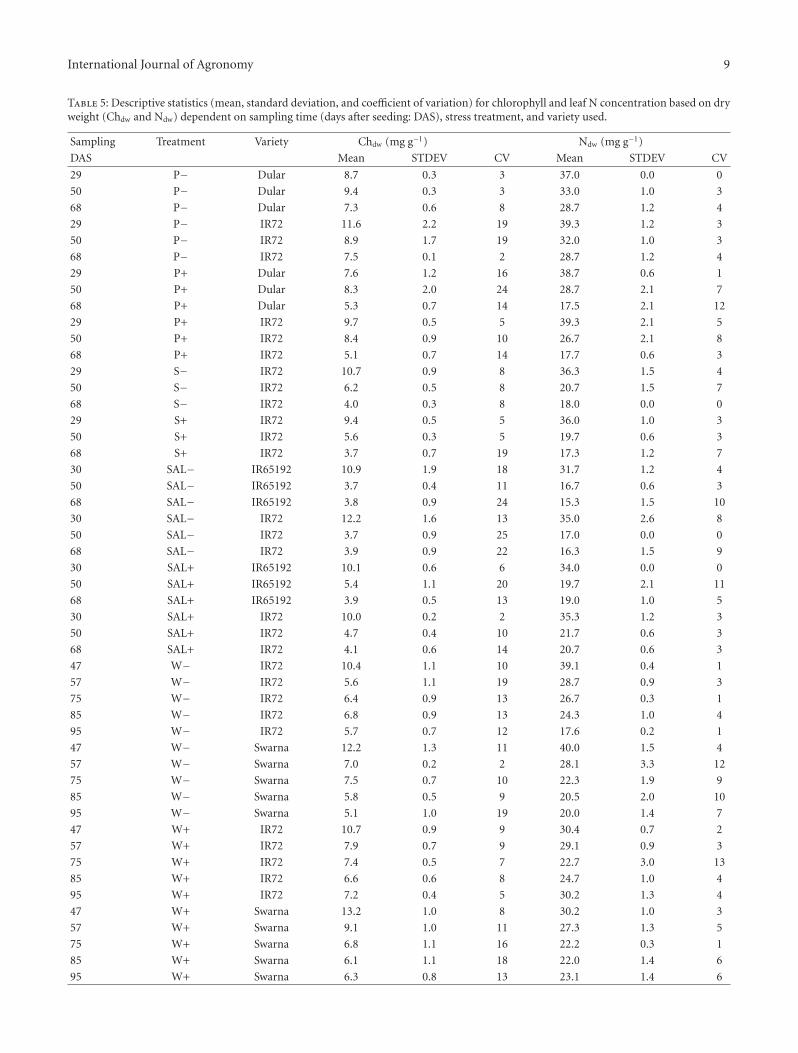
variety effects were, with only one exception (SLW in theP treatments), never significant, indicating that varietiesreacted in the same way to each particular stress applied. Thealways significant effect of sampling time illustrates that allparameters are dynamic during crop development. ObservedSLW values did differ between varieties and sampling timesbut stress treatments caused only very small and inconsistentSLW changes (Table 4). The trends for chlorophyll and leafN concentration based on dry weight (Chdw and Ndw)are presented in detail in Table 5. This clearly shows theconsiderable range both values take across all samplingsalthough all plants received the same amount of N. However,it also indicates that most of the variability is explained bysampling time whereas a smaller part is due to the stresstreatment and variety used (data for the varieties Mahsuriand PSBRc9 are not shown).
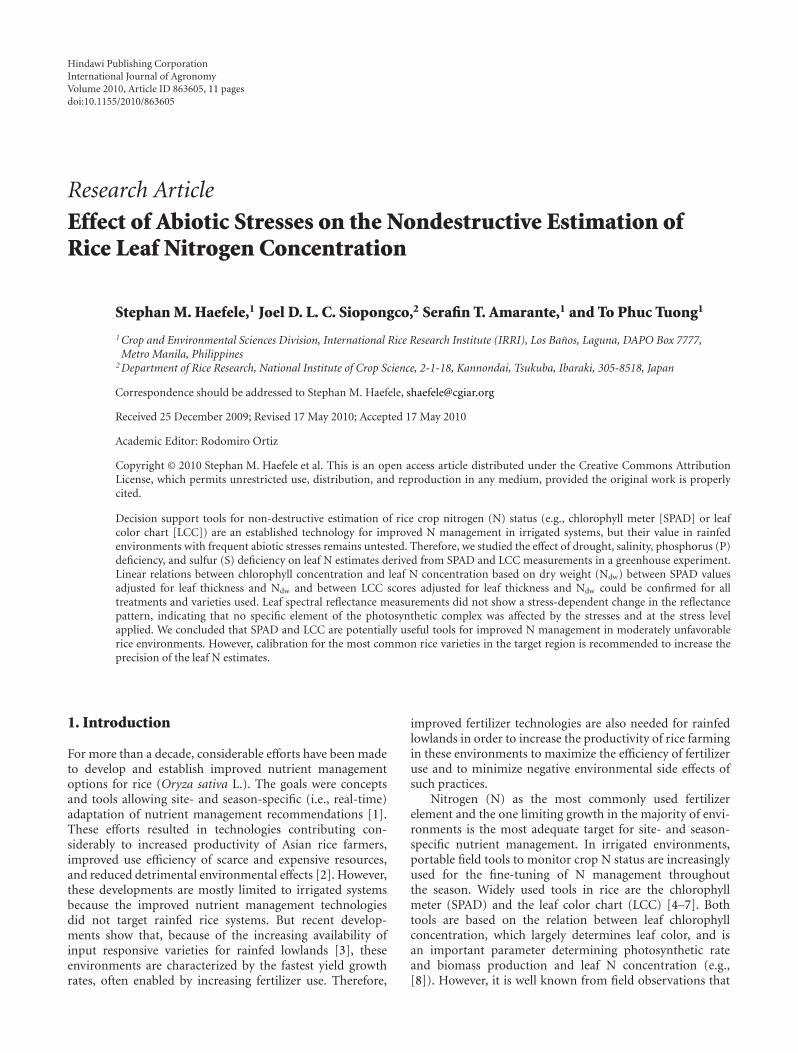
The dynamics of Cha and Na for all four stresses is shownin Figure 5. Because varieties reacted largely in the sameway to the stresses (no significant T×V interaction; Tables3 and 4), only treatment means across varieties are shown.According to Peng et al. [5], Na decreases only a little inearly crop development and tends to be stable thereafter.For the treatments +W, ±Sal, and ±S, we observed a similardynamics although the initial drop in Na is considerable forthe ±S treatments. Contrary to this development, drought-stressed plants were characterized by constantly decreasingNa values and both P treatments by continuously high Na
concentrations. Chlorophyll concentration (Cha) dynamicswere similar to the dynamics of Na, except for both Ptreatments, in which Cha peaked at the sampling 50 DAS.Figure 5 also shows that the stresses applied increase Na andCha simultaneously in all treatments except for drought,which has opposite effects on Na and Cha.
4. Discussion
Different indicators were used to verify successful stressapplication in the various treatments. The stress level inthe drought phases of the –W treatment was establishedby maintaining an average soil water potential of −47 kPaat 15 cm soil depth. According to Bouman and Tuong[14], this represents considerable water stress and usuallycauses rice yield reductions of 10% to 40% if occurringregularly throughout the cropping season. The applieddrought stress had significant effects on leaf chlorophylland N concentrations (Table 3) and influenced leaf N con-centration dynamics over time (Figure 5). But, in contrastto the expected consequences the –W treatment increasedbiomass production at harvest, similar to reports in whichmidseason drainage increased yields in field experiments[14, 22]. Possible explanations are that the temporary aerobicconditions increased the average soil N supply or inducedincreased root development, or both, thus compensating forreduced growth during drought phases. Unlike for drought,biomass at harvest was a good indicator for the appliedstress in the salinity (+Sal) and P-deficiency (–P) treatment(Table 1). Additional evidence for the applied stress in the–P treatment was the low soil P availability (Table 2) andthe low leaf P concentration. But, the latter indicated that
International Journal of Agronomy 7
0.15
0.2
0.25
0.3
0.35
0.4
0.45
Ch
a(g
m−2
)
T : ∗∗∗
T× S : ∗
20 40 60 80 100
DAS
(a)
0.15
0.2
0.25
0.3
0.35
0.4
0.45
Ch
a(g
m−2
)
T : ∗
T× S : ns
20 40 60 80
DAS
(b)
0.15
0.2
0.25
0.3
0.35
0.4
0.45
Ch
a(g
m−2
)
T : ∗
T× S : ns
20 40 60 80
DAS
(c)
0.15
0.2
0.25
0.3
0.35
0.4
0.45
Ch
a(g
m−2
)
T : ∗∗∗
T× S : ns
20 40 60 80
DAS
(d)
0.6
0.8
1
1.2
1.4
1.6
Na
(gm−2
)
T : ∗
T× S : ∗∗∗
+W−W
20 40 60 80 100
DAS
(e)
0.6
0.8
1
1.2
1.4
1.6
Na
(gm−2
)
T : ∗∗∗
T× S : ns
−Sal+Sal
20 40 60 80
DAS
(f)
0.6
0.8
1
1.2
1.4
1.6
Na
(gm−2
)
T : ns
T× S : ns
+S−S
20 40 60 80
DAS
(g)
0.6
0.8
1
1.2
1.4
1.6
Na
(gm−2
)
T : nsT× S : ns
+P−P
20 40 60 80
DAS
(h)
Figure 5: Seasonal dynamic of area-based leaf chlorophyll concentration (Cha) and leaf N concentration (Na) for all treatments. Stresstreatments applied were drought (–W), salinity (+Sal), sulfur deficiency (–S), and phosphorus deficiency (–P). Shown are mean treatmentvalues for three replications and all varieties used because no significant interaction was detected. Significance levels for treatment (T) effectsand treatment by sampling time interaction (T×S) are ns = P > .05; ∗ : .05 ≤ P ≤ .01; ∗∗ : .01 ≤ P ≤ .001; ∗∗∗ : P < .001 (further detailsin Tables 3 and 4).
even the +P treatment was still limited by P, explaining thecomparatively low biomass production (Table 1). The domi-nant P limitation also explains the continuously high leaf Na
(Table 4, Figure 5). Because P limited growth, it was dilutedas much as possible in the plant tissue (source limitation)whereas sufficient N was available for the limited growth,causing plant N accumulation due to the sink limitation[23]. High stress in the salinity treatment was clearly shownby the almost complete yield loss in the +Sal treatments.Less obvious was the stress level in the ±S treatments. LeafS concentrations at the early sampling (29 DAS) did notindicate S deficiency, but the observed values were at or belowthe threshold value at later samplings. Sulfur deficiency wasalso suggested by the significant treatment differences forthe Y-leaf S concentrations at 29 DAS, for straw weight atharvest, and for the leaf chlorophyll concentration (Tables1 and 4). However, the comparatively low total biomass forboth S treatments and the low leaf S concentration at bothlater samplings indicated that most of the applied S in the+S treatment was not plant available, causing considerable Sdeficiency in both S treatments. The reason for the missingS response in the +S treatment remained unclear. Limitedresponse to S application was reported for alkaline soils and
when the S was applied too late in the season but bothconditions do not really apply in this experiment.
Leaf photosynthetic rate and leaf N concentration areclosely related (e.g., [8]), as most of the leaf N is bound inenzymes associated with chlorophyll. Because it was unclearwhether and to what extent the applied stresses could affectthe close interaction between chlorophyll and leaf N concen-tration, both parameters were determined for all treatments.Figure 1 indicates a linear relation between both parameterswithin the observed range but the values scatter considerablyaround the linear regression line. This might be mostlycaused by the measurement of these parameters from twodifferent leaf samples (both measurements were destructiveand not possible for the same sample) and imprecision of theanalysis. However, a small and not significant effect of theapplied stresses on the chlorophyll versus N-concentrationratio cannot be excluded. Especially for drought stress, suchan uncoupling of both parameters is strongly suggested bythe stress-induced decrease in chlorophyll (in mg g−1) andthe simultaneously stable or slightly increasing Ndw (Table 3,Figure 5). Nang [24] described the same phenomenon forstress phases with −80 kPa soil water tension but found noeffect at−20 kPa soil water tension (both measured at 0.15 m
8 International Journal of Agronomy
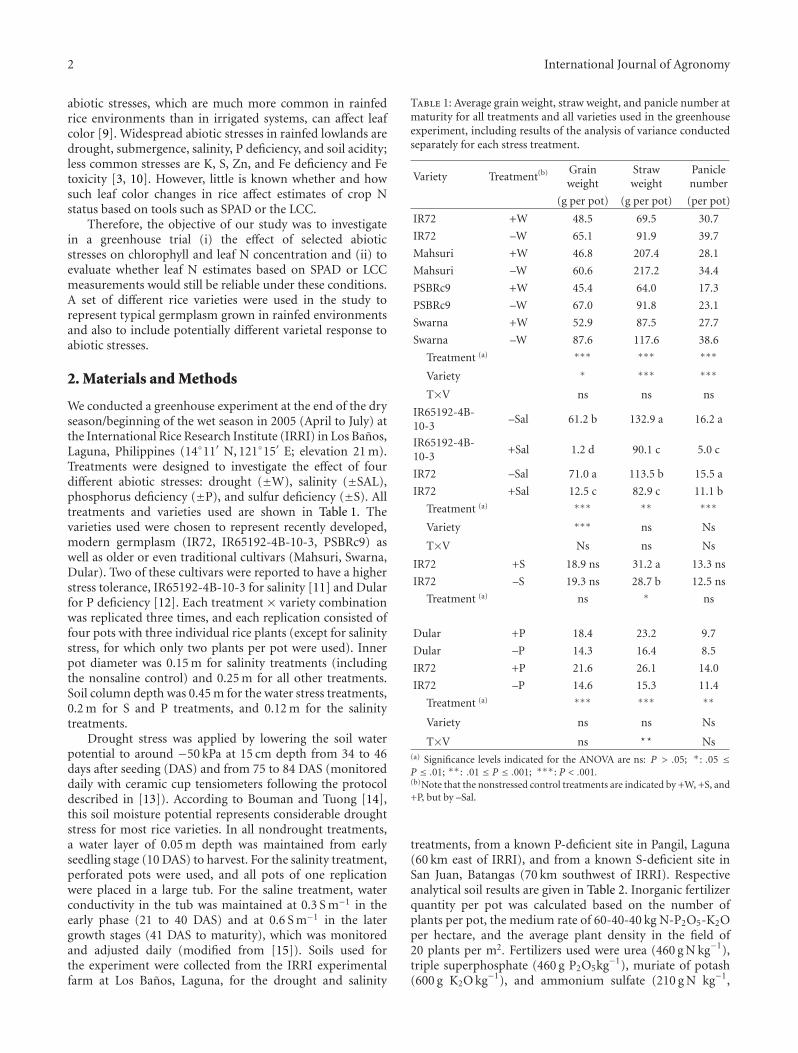
Table 4: Analysis of variance for specific leaf weight (SLW), chlorophyll concentration, and leaf N concentration (Cha and Na: area based;Chdw and Ndw: dry weight based). The analysis was conducted separately for salinity (±SAL), sulfur (±S), and phosphorus (±P) treatments.Included are mean treatment values across varieties and sampling dates, separated for each stress treatment.
SLW g m−2 Cha g m−2 Na g m−2 Chdw mg g−1 Ndw mg g−1
Salinity
Treatment (T)(a) ns ∗ ∗∗∗ ns ∗∗∗
Variety (V) ∗∗∗ ns ∗∗∗ ns ∗∗∗
Sampling (S) ∗∗∗ ∗∗∗ ∗∗∗ ∗∗∗ ∗∗∗
T×V ns ns ns ns ns
T×S ns ns ns ∗∗ ∗
V×S ns ns ns ns ns
T×V×S ns ns ns ns ns
Treatment mean(b)
–SAL 44.9 a 0.24 b 0.90 b 6.34 a 22.0 b
+SAL 44.3 a 0.26 a 1.06 a 6.37 a 25.1 a
Sulfur
Treatment (T)(a) ns ∗ ns ∗∗∗ ns
Sampling (S) ∗∗∗ ∗∗∗ ∗∗∗ ∗∗∗ ∗∗∗
T x S ns ns ns ns ns
Treatment mean(b)
+S 46.6 a 0.28 b 1.08 a 6.22 b 24.3 a
–S 44.7 a 0.31 a 1.12 a 6.97 a 25.0 a
Phosphorus
Treatment (T)(a) ns ∗∗∗ ns ∗∗∗ ∗∗
Variety (V) ns ∗ ns ns ns
Sampling (S) ∗∗∗ ∗∗∗ ∗ ∗∗∗ ∗∗∗
T×V ∗∗ ns ns ns ns
T×S ns ns ns ns ∗∗∗
V×S ∗ ns ns ∗ ∗
T×V×S ns ns ns ns ns
Treatment mean(b)
+P 45.0 a 0.33 b 1.42 a 7.39 b 31.7 b
–P 44.0 a 0.39 a 1.44 a 8.89 a 33.1 a(a) Significance levels indicated for the ANOVA are ns: P > .05; ∗:.05 ≤ P ≤.01; ∗∗:.01 ≤ P ≤.001; ∗∗∗: P < .001.(b) Values in a column followed by the same letter are not significantly different at P > .05 according to the Tukey test.
depth). A similar effect was not detected for any of the otherstresses applied (Table 4).
Past research on the relation between Y-leaf Ndw andSPAD readings in rice showed repeatedly that the linearregression equation describing this relation was influencedconsiderably by growth stage and genotype [20, 21, 25].Peng et al. [20] demonstrated that these differences werelargely due to differences in leaf thickness (SLW) and thatthe prediction of Ndw from SPAD readings across genotypesand growth stages was improved markedly by adjustingSPAD values for SLW. Yang et al. [6] confirmed the samemechanism for LCC measurements. Accordingly, acceptableregression coefficients were achieved for our data set whenSPAD and LCC readings were adjusted for SLW (Figure 2),but closer relations (i.e., higher regression coefficients) wererepeatedly reported in studies using fewer varieties or more
homogeneous trial conditions [6, 16]. Lower precision wasalso reported by Witt et al. [21], who included a largenumber of different varieties in their study. It is most likelythat, in our study, varietal differences and abiotic stressescontributed to a larger scatter even though an uncoupling ofchlorophyll and leaf N was indicated only for the droughtstress. Peng et al. [26] described slightly increased SPADvalues at the same Ndw level resulting from P deficiency inearly growth stages, but the same study could not confirmany effect of K nutrition. Why the LCC failed to predict Ndw
at early growth stages (≤ 30 DAS) in our study (Figure 2(b))remained unclear; Shukla et al. [7] previously reported goodcorrelation between SPAD values and LCC scores even at veryearly growth stages.
Leaf spectral reflectance was measured for two reasons.First, we hypothesized that any damage to the photosynthetic
International Journal of Agronomy 9
Table 5: Descriptive statistics (mean, standard deviation, and coefficient of variation) for chlorophyll and leaf N concentration based on dryweight (Chdw and Ndw) dependent on sampling time (days after seeding: DAS), stress treatment, and variety used.
Sampling Treatment Variety Chdw (mg g−1) Ndw (mg g−1)
DAS Mean STDEV CV Mean STDEV CV
29 P− Dular 8.7 0.3 3 37.0 0.0 0
50 P− Dular 9.4 0.3 3 33.0 1.0 3
68 P− Dular 7.3 0.6 8 28.7 1.2 4
29 P− IR72 11.6 2.2 19 39.3 1.2 3
50 P− IR72 8.9 1.7 19 32.0 1.0 3
68 P− IR72 7.5 0.1 2 28.7 1.2 4
29 P+ Dular 7.6 1.2 16 38.7 0.6 1
50 P+ Dular 8.3 2.0 24 28.7 2.1 7
68 P+ Dular 5.3 0.7 14 17.5 2.1 12
29 P+ IR72 9.7 0.5 5 39.3 2.1 5
50 P+ IR72 8.4 0.9 10 26.7 2.1 8
68 P+ IR72 5.1 0.7 14 17.7 0.6 3
29 S− IR72 10.7 0.9 8 36.3 1.5 4
50 S− IR72 6.2 0.5 8 20.7 1.5 7
68 S− IR72 4.0 0.3 8 18.0 0.0 0
29 S+ IR72 9.4 0.5 5 36.0 1.0 3
50 S+ IR72 5.6 0.3 5 19.7 0.6 3
68 S+ IR72 3.7 0.7 19 17.3 1.2 7
30 SAL− IR65192 10.9 1.9 18 31.7 1.2 4
50 SAL− IR65192 3.7 0.4 11 16.7 0.6 3
68 SAL− IR65192 3.8 0.9 24 15.3 1.5 10
30 SAL− IR72 12.2 1.6 13 35.0 2.6 8
50 SAL− IR72 3.7 0.9 25 17.0 0.0 0
68 SAL− IR72 3.9 0.9 22 16.3 1.5 9
30 SAL+ IR65192 10.1 0.6 6 34.0 0.0 0
50 SAL+ IR65192 5.4 1.1 20 19.7 2.1 11
68 SAL+ IR65192 3.9 0.5 13 19.0 1.0 5
30 SAL+ IR72 10.0 0.2 2 35.3 1.2 3
50 SAL+ IR72 4.7 0.4 10 21.7 0.6 3
68 SAL+ IR72 4.1 0.6 14 20.7 0.6 3
47 W− IR72 10.4 1.1 10 39.1 0.4 1
57 W− IR72 5.6 1.1 19 28.7 0.9 3
75 W− IR72 6.4 0.9 13 26.7 0.3 1
85 W− IR72 6.8 0.9 13 24.3 1.0 4
95 W− IR72 5.7 0.7 12 17.6 0.2 1
47 W− Swarna 12.2 1.3 11 40.0 1.5 4
57 W− Swarna 7.0 0.2 2 28.1 3.3 12
75 W− Swarna 7.5 0.7 10 22.3 1.9 9
85 W− Swarna 5.8 0.5 9 20.5 2.0 10
95 W− Swarna 5.1 1.0 19 20.0 1.4 7
47 W+ IR72 10.7 0.9 9 30.4 0.7 2
57 W+ IR72 7.9 0.7 9 29.1 0.9 3
75 W+ IR72 7.4 0.5 7 22.7 3.0 13
85 W+ IR72 6.6 0.6 8 24.7 1.0 4
95 W+ IR72 7.2 0.4 5 30.2 1.3 4
47 W+ Swarna 13.2 1.0 8 30.2 1.0 3
57 W+ Swarna 9.1 1.0 11 27.3 1.3 5
75 W+ Swarna 6.8 1.1 16 22.2 0.3 1
85 W+ Swarna 6.1 1.1 18 22.0 1.4 6
95 W+ Swarna 6.3 0.8 13 23.1 1.4 6

10 International Journal of Agronomy
complex by abiotic stress would change the reflectancepattern. But, the results indicated that, although there weredifferences in the intensity of reflectance between varietiesand treatments (see Figure 3), the basic reflectance patterndid not change. This confirms results of Witt et al. [21] andindicates that the applied stresses affected photosynthesis asa whole rather than affecting individual components of thephotosynthetic complex. But, the finding of Witt et al. [21]that SLW had no influence on light reflectance measurementscould not be confirmed (Figure 4). By using all spectraldata for the prediction of leaf N content as was done byWitt et al. [21], this influence became smaller. However ifonly the wavelength with maximum reflectance was used(550 nm ± 5 nm in Figure 4), sampling date, and therebySLW, did affect the reflectance versus Ndw relations. Themost likely explanation is that leaf thickness did affect theratio of reflected and penetrating light during the scan, thatis, younger, thinner leaves had a higher reflectance valueat the same N/chlorophyll content because of lower lightpenetration/transmission.
Compared with Ndw, rice leaf N concentration basedon area (Na) is much more stable throughout the growingperiod because the decreasing leaf Ndw is compensated forby increasing leaf thickness. Nevertheless, Peng et al. [5]showed that Na decreases slightly in early crop development(until about 45 DAS) and increases slightly in later cropdevelopment (from about 75 DAS). This pattern was largelyreconfirmed in the treatments +W, ±Sal, and ±S (Figure 5).However, leaf N concentration was continuously high forboth P treatments perhaps, as indicated above, because bothtreatments were P deficient (Figure 5, Table 4). Peng et al.[26] also observed increased leaf N concentration underP deficiency at midtillering, and the higher leaf N andchlorophyll concentration could also explain the dark greencolor of P-deficient plants/leaves. Drought seemed to disruptthe above-described normal Na development, leading to anirregular decrease in Na from the first drought phase onward.More detailed samplings by Nang [24] demonstrated thesame effect, but his study did not continue measurementsbeyond 50 DAS and used only a single stress phase.
We concluded that abiotic stresses affected leaf Nand chlorophyll concentrations but did not change leafreflectance patterns or the general linear correlation betweenleaf N and leaf chlorophyll concentration at the stress levelstested. Observed SPAD and LCC measurements adjustedfor leaf thickness were linearly correlated with leaf N andchlorophyll concentration, but applied abiotic stresses andvarietal differences decreased the precision of the relation-ship. Therefore, both measurement tools could not be usedto accurately estimate leaf N. However, less precision isneeded for the use of SPAD or the LCC as decision supporttools for N management. In addition, calibration for themost commonly used varieties in a target region shouldbe used to increase the predictive value of the leaf colormeasurements. Severe abiotic stresses in the target area forSPAD/LCC technologies are unlikely because farmers willusually not apply significant fertilizer quantities in fieldswhich repeatedly experienced, for example, strong droughtor serious other limitations (e.g., strong P deficiency). Thus,
abiotic stresses are likely to be limited, and their effect onthe accuracy of leaf N predictions based on SPAD or LCCmeasurements will be small in most cases. We thereforebelieve that both tools can help to improve N managementof rice crops in moderately unfavorable environments. Thenext steps towards such a technology are on-farm trialsdetermining the agro-economic value and feasibility of thesetools in rainfed rice systems.
References
[1] A. Dobermann and P. F. White, “Strategies for nutrient man-agement in irrigated and rainfed lowland rice systems,” Nutri-ent Cycling in Agroecosystems, vol. 53, no. 1, pp. 1–18, 1999.
[2] A. Dobermann, C. Witt, and D. Dawe, Increasing Productivityof Intensive Rice Systems through Site-Specific Nutrient Man-agement, Science Publishers, Enfield, NH, USA; InternationalRice Research Institute (IRRI), Los Banos, Philippines, 2004.
[3] S. M. Haefele, G. Atlin, S. P. Kam, and D. E. Johnson,“Improving farmers’ livelihood in rainfed rice-basedlowlands of Asia,” in Proceedings of the Deutscher Tropentag,Humboldt University, Berlin, Germany, October 2004,www.tropentag.de/2004/abstracts/full/128.pdf.
[4] F. T. Turner and M. F. Jund, “Chlorophyll meter to predictnitrogen topdress requirement for semidwarf rice,” AgronomyJournal, vol. 83, pp. 926–928, 1991.
[5] S. Peng, F. V. Garcia, R. C. Laza, A. L. Sanico, R. M. Visperas,and K. G. Cassman, “Increased N-use efficiency using achlorophyll meter on high-yielding irrigated rice,” Field CropsResearch, vol. 47, no. 2-3, pp. 243–252, 1996.
[6] W.-H. Yang, S. Peng, J. Huang, A. L. Sanico, R. J. Buresh, andC. Witt, “Using leaf color charts to estimate leaf nitrogen statusof rice,” Agronomy Journal, vol. 95, no. 1, pp. 212–217, 2003.
[7] A. K. Shukla, J. K. Ladha, V. K. Singh et al., “Calibratingthe leaf color chart for nitrogen management in differentgenotypes of rice and wheat in a systems perspective,”Agronomy Journal, vol. 96, no. 6, pp. 1606–1621, 2004.
[8] S. Yoshida and V. Coronel, “Nitrogen nutrition, leaf resistance,and leaf photosynthetic rate of the rice plant,” Soil Science andPlant Nutrition, vol. 22, no. 1, pp. 207–211, 1976.
[9] A. Dobermann and T. Fairhurst, Rice: Nutrient Disorders andNutrient Management, Potash and Phosphate Institute ofCanada and International Rice Research Institute, Los Banos,Philippines, 2000.
[10] S. M. Haefele and R. J. Hijmans, “Soil quality in rice-basedrainfed lowlands of Asia: characterization and distribution,”in Science, Technology, and Trade for Peace and Prosperity.Proceedings of the 26th International Rice Conference, P. K.Aggarwal, J. K. Ladha, R. K. Singh, C. Devakumar, and B.Hardy, Eds., pp. 297–308, International Rice Research Insti-tute, Indian Council of Agricultural Research, and NationalAcademy of Agricultural Sciences, Manila, Philippines, 2007.
[11] F. Moradi and A. M. Ismail, “Responses of photosynthesis,chlorophyll fluorescence and ROS-scavenging systems to saltstress during seedling and reproductive stages in rice,” Annalsof Botany, vol. 99, no. 6, pp. 1161–1173, 2007.
[12] M. Wissuwa, N. Ae, and S. S. Jones, “Genotypic variation fortolerance to phosphorus deficiency in rice and the potentialfor its exploitation in rice improvement,” Plant Breeding, vol.120, no. 1, pp. 43–48, 2001.
[13] J. C. O’Toole and M. A. Maguling, “Greenhouse selection fordrought resistance in rice,” Crop Science, vol. 21, pp. 325–327,1981.
International Journal of Agronomy 11
[14] B. A. M. Bouman and T. P. Tuong, “Field water managementto save water and increase its productivity in irrigated lowlandrice,” Agricultural Water Management, vol. 49, no. 1, pp.11–30, 2001.
[15] L. Zeng, J. A. Poss, C. Wilson, A.-S. E. Draz, G. B. Gregorio,and C. M. Grieve, “Evaluation of salt tolerance in ricegenotypes by physiological characters,” Euphytica, vol. 129,no. 3, pp. 281–292, 2003.
[16] S. Peng, M. R. Laza, F. V. Garcia, and K. G. Cassman,“Chlorophyll meter estimates leaf area-based nitrogenconcentration of rice,” Communications in Soil Science andPlant Analysis, vol. 26, no. 5-6, pp. 927–935, 1995.
[17] V. Balasubramanian, “Use of the leaf color chart (LCC) for Nmanagement in rice,” in CREMNET Technology Brief No. 2,International Rice Research Institute, Los Banos, Philippines,1999.
[18] J. M. Bremner, “Nitrogen-total,” in Methods of Soil Analysis:Chemical Methods. Part 3, D. L. Sparks, Ed., Soil ScienceSociety of America Book Series No. 5, pp. 1085–1122,Soil Science Society of America and American Society ofAgronomy, Madison, Wis, USA, 1996.
[19] G. Mackinney, “Absorption of light by chlorophyll solutions,”The Journal of Biological Chemistry, vol. 140, pp. 315–322,1941.
[20] S. Peng, F. V. Garcia, R. C. Laza, and K. G. Cassman,“Adjustment for specific leaf weight improves chlorophyllmeter’s estimate of rice leaf nitrogen concentration,”Agronomy Journal, vol. 85, no. 5, pp. 987–990, 1993.
[21] C. Witt, J. M. C. A. Cabrera-Pasuquin, R. Mutters, and S.Peng, “Nitrogen content of rice leaves as predicted by SPAD,NIR, spectral reflectance and leaf color charts,” in Proceedingsof the ASA-CSSA-SSSA Annual Meetings on Changing Sciencesfor a Changing World: Building a Broader Vision, Denver, Colo,USA, November 2003.
[22] S. K. De Datta, Principles and Practices of Rice Production,IRRI, Los Banos, Philippines, 1981.
[23] B. H. Janssen, F. C. T. Guiking, D. van der Eijk, E. M. A.Smaling, J. Wolf, and H. van Reuler, “A system for quantitativeevaluation of the fertility of tropical soils (QUEFTS),”Geoderma, vol. 46, no. 4, pp. 299–318, 1990.
[24] N. D. Nang, Nitrogen uptake, leaf nitrogen, chlorophyll contentand leaf color of rice (Oryza sativa L.) as affected by droughtstress, thesis, University of the Philippines, Los Banos,Philippines, 2004.
[25] M. Takebe and T. Yoneyama, “Measurement of leaf chlorophyllscores and its implication to nitrogen nutrition of rice plants,”Japan Agricultural Research Quarterly, vol. 23, pp. 86–93, 1989.
[26] S. Peng, A. L. Sanica, F. V. Garcia, et al., “Effect of leafphosphorus and potassium concentration on chlorophyllmeter reading in rice,” Plant Production Science, vol. 2, no. 4,pp. 227–231, 1999.


![79: ' # '6& *#7 & 8 · to new rice varieties with high resistance to biotic stresses and preferred agronomic traits [3]. However, abiotic stresses, especially drought stress remained](https://img.pdfslide.net/doc/110x75/5fb4914d02ddd760a16eac3c/79-6-7-8-to-new-rice-varieties-with-high-resistance-to-biotic.jpg)