Embed Size (px)
Citation preview

Accenture Life SciencesRethink Reshape Restructure…for better patient outcomes
Affordability and Value—The Economics of Pharma’sNew ScienceAccenture High Performance Business Research

Investors continue to reward new science.
Copyright © 2016 Accenture All Rights Reserved. 2
Key Findings Summary: New Science – New ChallengesHigh Performers in pharma today are all about new science, but achieving high performance will also require adapting operating models to better deliver patient and economic value.
Affordability and market access will challenge new science as a growth driver.
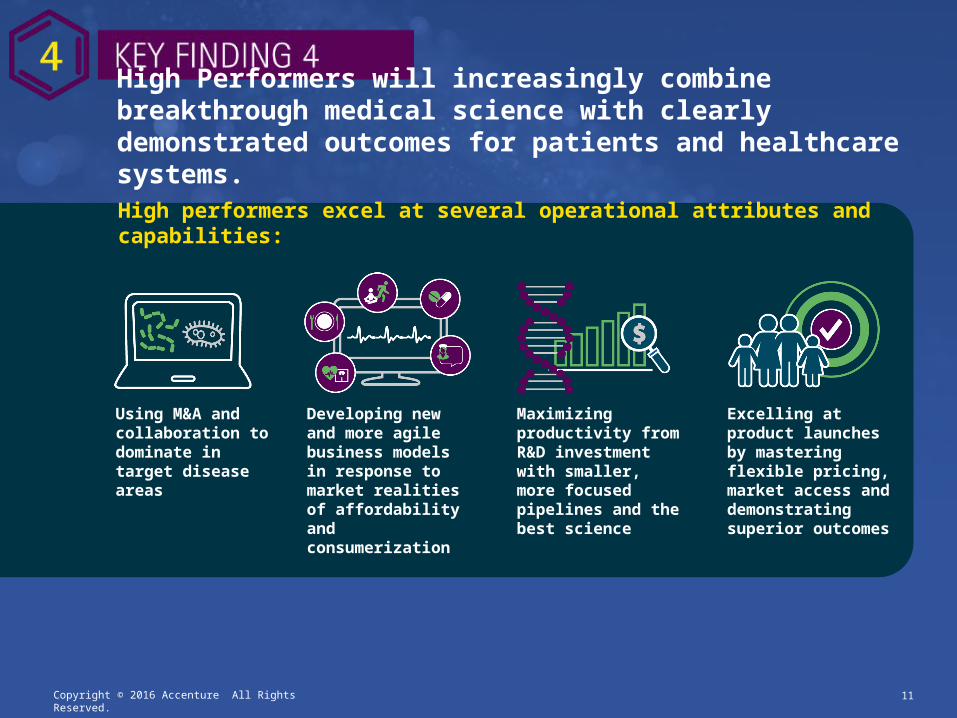
High Performers will increasingly combine breakthrough medical science with clearly demonstrated outcomes for patients and healthcare systems.
Growth has returned and is forecast to accelerate while margins have improved—but growth continues to be polarized at a company level.

Copyright © 2016 Accenture All Rights Reserved. 3
The Pipeline Replacement Revenue Ratio has shifted markedly—back to levels not seen since before the patent cliff of 2012.
Enterprise Value (EV) rose six percent in 2015.
There were 45 NMEs approved in 2015, the highest number since 1996.
In 2015, the industry saw mixed performance at a company level as well as declines since Q4-15, but overall performed five percent above the S&P500 across the year.
Investors continue to reward new science.

Enterprise Value ($ Billion) for “Pure Plays” 2008-15
Key Finding #1: Key Finding #1:
Enterprise Value grows for the 5th year in a row.
$1,140 $1,372$1,263
$1,501$1,703
$1,632$1,714
$2,155
-$207 -$190-$323 -$405 -$347
1178.226328800041298.43548474998
1712.602417425721808.30533410821
$69.1
$85.4$76.8
$85.1$80.2 $79.9 $76.3
-$95
2010
+12%
Nov-152008
$1,046
2012
-$2
$1,538
20142013
+6%
2011
$1,073
2009
$1,165
-$94
FVNOPLAT CVEV
Note: 16 pure play biopharma companies only. Japanese companies have March year end (YE14 = Mar-15). Constant USD FOREX used from Oct 2015. Nov 19 th 2015 share price used in latest EV and Q3-15 NOPLAT.Source: Accenture Research, Dec 2015.
-9% -18% -18.0% -27% -31% -6% 0% -19%FV/EV =
Copyright © 2016 Accenture All Rights Reserved. 4

Patent expiries rose markedly in 2015 as did new drug approvals and pipeline replacement ratio.
$8.5
$15.6 $13.4$11.7
$18.8$22.7
$27.8$31.6
$16.8 $24.9
$28.4
$19.4
$22.6
$16.3
$21.9
$16.1
$12.1
$5.7
$19.0$16.0
$3.9
$17.0
$23.7
$8.9
4.6
5.5
3.6
2.72.3
1.0 1.1
1.9
2.52.8
3.2
4.0
5.2
4.4
5.7
$8.9
$0.5
$45.6
2018
$33.3
2017
$26.5
2016
$35.5
2015
$47.4
2020
$25.0
20192014
$30.6
2013
$28.9
2012
$31.6
$0.0
2011
$29.0
$1.2
2010
$24.1
$1.5
2009
$18.8
$0.0
2008
$12.6
$0.9
2007
$14.8
$1.4
2.7
2006
$15.7
$0.1
2005
Sales Losing Exclusivity (Biotech Rx)Sales Losing Exclusivity (Conventional Rx)Pipeline Replacement Ratio
LantusNeulastaGleevecAbilifyNexiumEpogen
HumiraAdvairCrestorZetia
ZytigaCialis
RituxanRemicadeLyricaSpiriva
RevlimidAvastinHerceptinGilenyaLevimirInvega Sus
BotoxTysabri
Source: Accenture Research Nov-15, based on Evaluate Pharma and FDA CDER Statistics.
Key Patent Upcoming Expiries:
5 year Average FDA NME Approvals2006-10
22.4
5 year Average FDA NME Approvals2011-15
36.4
Patent Exposure & Pipeline ReplacementPharma Industry 2005-20E
Copyright © 2016 Accenture All Rights Reserved. 5

Copyright © 2016 Accenture All Rights Reserved. 6
Growth has returned and is forecast to accelerate while margins have improved—but growth continues to be polarized at a company level.
After three years of negative revenue growth, the peer set overall has returned to positive growth and is forecasted to accelerate.
Six companies are outperforming their peers, with Eli Lilly joining the High Performers for the first time.
These High Performers are also growing faster than the rest of their peers.
After four years of falling Core Operating Margins, the peer set saw a one percentage point improvement in 2015.
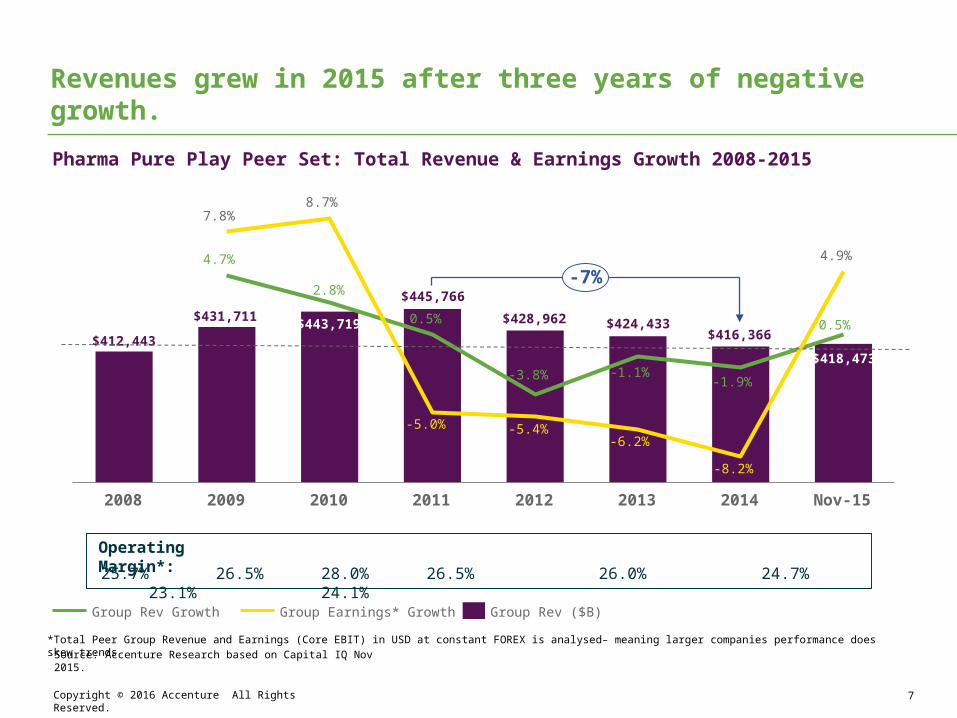
Revenues grew in 2015 after three years of negative growth.Pharma Pure Play Peer Set: Total Revenue & Earnings Growth 2008-2015
$412,443
$431,711$445,766
$428,962 $424,433$416,366
4.7%
0.5%
-3.8% -1.1%-1.9%
0.5%
7.8%8.7%
-5.0% -5.4%-6.2%
-8.2%
4.9%
$443,719
2008 Nov-15
-7%
20142009 20132012
2.8%
2010 2011
$418,473
Group Rev Growth Group Earnings* Growth Group Rev ($B)
25.7% 26.5% 28.0% 26.5% 26.0% 24.7% 23.1% 24.1%
Source: Accenture Research based on Capital IQ Nov 2015.
Operating Margin*:
*Total Peer Group Revenue and Earnings (Core EBIT) in USD at constant FOREX is analysed– meaning larger companies performance does skew trends
Copyright © 2016 Accenture All Rights Reserved. 7

High Performers have stronger forecast growth and pipeline replacement revenue ratio as well as higher operating margins.
1.0 2.0 3.0 4.0 5.0 6.0 7.0 8.0
12%
10%
8%
6%
4%
2%
0%
-2%
Novo Nordisk
Astellas
Amgen
BMS
Pipeline Replacement Ratio 2015-20
CA
GR
201
5-18
Roche
EliLilly
Avg 3.4%
Avg 2.8x
RestHigh
-15.0% -10.0% -5.0% 0.0% 5.0% 10.0%5%
10%
15%
20%
25%
30%
35%
40%
45%
∆ 2013-15*
2015
* Cor
e EB
IT /
Rev
Astellas
Novo Nordisk
BMS
Eli Lilly
Roche
Amgen
Avg 22.2%
Avg -0.1%
Revenue Growth Forecast vs. Pipeline Replacement Revenue Ratio
Core Operating Margin vs. Change in last 2 years
Source: Accenture Research Nov-15, based on Evaluate Pharma & Capital IQ.
*Core EBIT Margin is based on Trailing 12 months to Q3-2015. Pipeline Replacement Revenue Ratio reflects Revenue growth from patented products divided by Revenue lost to unpatented products (and those with undefined patent status).
Copyright © 2016 Accenture All Rights Reserved. 8
Copyright © 2016 Accenture All Rights Reserved. 9
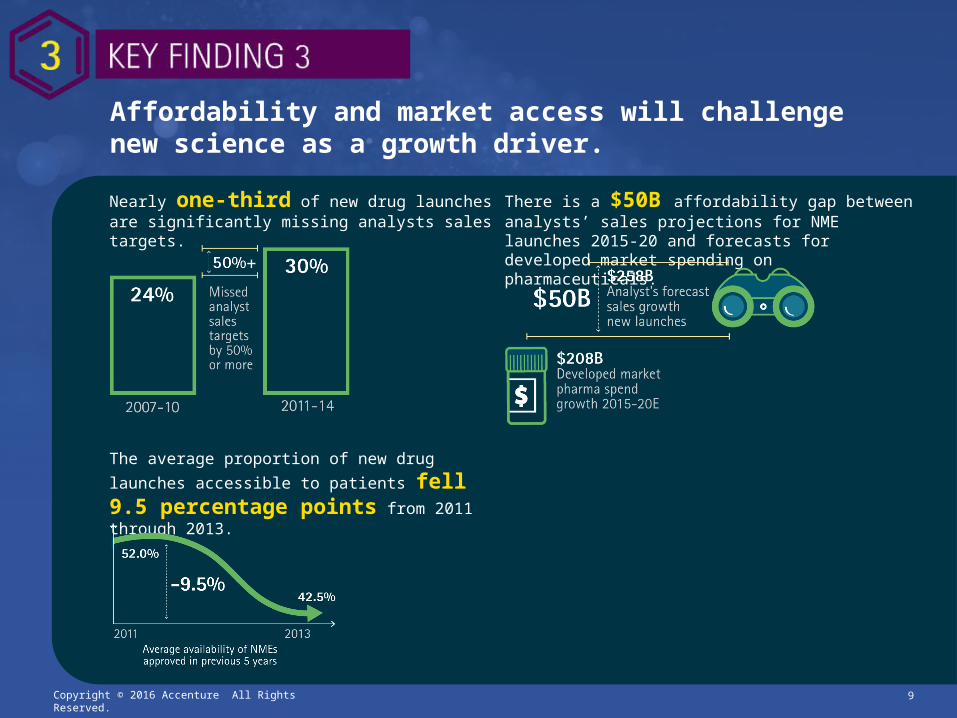
Affordability and market access will challenge new science as a growth driver.
Nearly one-third of new drug launches are significantly missing analysts sales targets.
There is a $50B affordability gap between analysts’ sales projections for NME launches 2015-20 and forecasts for developed market spending on pharmaceuticals.
The average proportion of new drug launches accessible to patients fell 9.5 percentage points from 2011 through 2013.

Accessibility and affordability are under pressure.
2011 2012 201325%
30%
35%
40%
45%
50%
55%
60%
65%
70%
-18.3%
FR
Average
SK
SP
CA
UK
US
JP
52.0%
GY
IT
Availability of NMEs Approved in Previous 5 Years - Selected Developed Markets 2011-13
Source: Accenture Research based on Evaluate Pharma Dec-15 and IMS Health Global Outlook for Medicines publications 2012-14.
87.0000000000099
121.000000000014
$136
$122
Net GenericsSavings
Pharma Net Spending Growth ($B)
Recent & Upcoming Launches - Growth
2015-20E
+$50
$258
Dev Markets Forecast growth
2015-20E
$208
Recent Launches 2011-15
Upcoming Launches 2016-20
Affordability of Recent and Upcoming NME approvals 2015-20E ($ Billion)
Copyright © 2016 Accenture All Rights Reserved. 10
“TheAffordabilityGap”
Copyright © 2016 Accenture All Rights Reserved. 11
High Performers will increasingly combine breakthrough medical science with clearly demonstrated outcomes for patients and healthcare systems.
Using M&A and collaboration to dominate in target disease areas
Developing new and more agile business models in response to market realities of affordability and consumerization
Maximizing productivity from R&D investment with smaller, more focused pipelines and the best science
Excelling at product launches by mastering flexible pricing, market access and demonstrating superior outcomes
High performers excel at several operational attributes and capabilities:
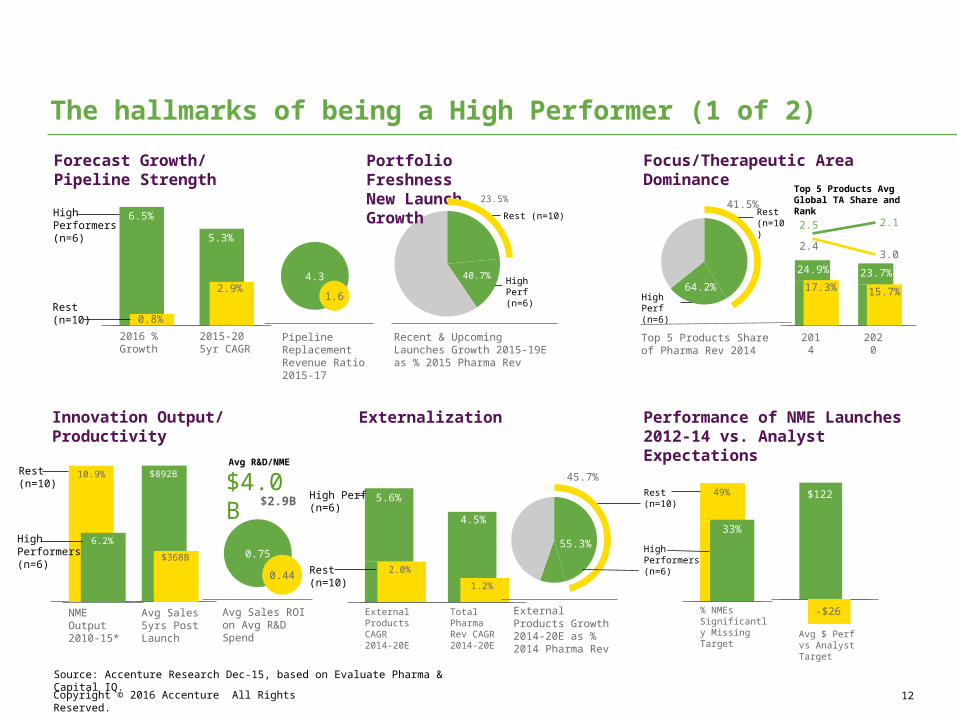
NME Output 2010-15*
Rest (n=10)
10.9%
The hallmarks of being a High Performer (1 of 2)Forecast Growth/Pipeline Strength
Portfolio FreshnessNew Launch Growth
High Performers(n=6)
2015-20 5yr CAGR
5.3%
2016 % Growth
6.5%
4.3
1.6
Pipeline Replacement Revenue Ratio 2015-17
High Perf (n=6)
40.7%
Rest (n=10)
23.5%
Recent & Upcoming Launches Growth 2015-19E as % 2015 Pharma Rev
Focus/Therapeutic Area Dominance
64.2%
41.5%
Top 5 Products Share of Pharma Rev 2014
2020
15.7%
23.7%
3.0
2.1
2014
17.3%
24.9%
2.5
2.4
Top 5 Products Avg Global TA Share and Rank
Innovation Output/Productivity
Externalization Performance of NME Launches2012-14 vs. Analyst Expectations
High Performers(n=6)
6.2%0.75
0.44
Avg Sales ROI on Avg R&D Spend
$4.0B$2.9B
Avg R&D/NME
55.3%
45.7%
External Products Growth 2014-20E as % 2014 Pharma Rev
5.6%
2.0%
4.5%
1.2%
Rest (n=10)
High Perf (n=6)
Total Pharma Rev CAGR 2014-20E
External Products CAGR 2014-20E
% NMEs Significantly Missing Target
49%Rest (n=10)
High Performers(n=6)
Source: Accenture Research Dec-15, based on Evaluate Pharma & Capital IQ.
Avg $ Perf vs Analyst Target
$122
33%
2.9%
Rest (n=10) 0.8%
$892B
Avg Sales 5yrs Post Launch
$368B
Copyright © 2016 Accenture All Rights Reserved. 12
High Perf (n=6)
Rest (n=10)
-$26

The hallmarks of being a High Performer (2 of 2)
Source: Accenture Research Dec-15, based on Evaluate Pharma & Capital IQ.
Core Operating Margin
Pipeline Replacement Rev Ratio 2015-20
28.9%High Performers(n=6)
15%
20%
25%
30%
20102008 2012 Nov-15
18.1%Rest (n=10)
High Performers – Key Attributes:1) Faster Growth, Higher Pipeline Replacement Ratio
• Already back to growth & faster growth forecast• Stronger Pipeline covering IP Exposure
2) Fresher Portfolio driving Growth• Stronger $ Growth potential from Recent & Upcoming
Launches
3) Focus and Therapy Area Dominance• Top 5 products larger share of Group Rev• Higher Avg Global Rank/Mkt Share of Top 5 Products
4) Innovation Output & Productivity• Fewer NME launches, and higher R&D spend on each• But Higher Sales at 5 years, and Sales ROI on R&D
5) Greater and more effective Externalisation• Higher $ Forecast from externally originated products• Externally derived products growth faster for company
6) New Launch - Commercial Traction years 1 & 2• Fewer NME launches significantly missing Analyst
Targets• Average $ performance beating analyst expectations
7) More Profitable• Higher Core Operating Margin, holding up better in
recent years
Copyright © 2016 Accenture All Rights Reserved. 13

Our HPB study ranks the long term performance of a peer set of 16 of the largest pure-play biopharma companies* over an eight-year period based on year-end trailing 12 month Q4-2014 financials. These results have been compared with our previous 2014 and 2013 studies, to identify relative movements in the performance rankings. A detailed analysis over one, three, five and seven years is combined with equity analyst consensus forecasts to gain a view of forecast revenue growth from portfolio and new product launches, as well as the potential impact of patent expiries and mature products.
About Accenture’s High Performance Business Study:Methodology
*Pure Biopharma defined as companies having more than 75% of revenue coming from pharmaceutical products
14
HPB Metrics • Longevity• Profitability• Historical Growth• Future Value Component of
Enterprise Value• Consistency• Pipeline Growth/IP Risk
Contact UsAnne O’RiordanSenior Managing DirectorAccenture Life Sciences, [email protected]
Tom SchwengerSenior Managing DirectorAccenture Life Sciences, North [email protected]
Andrea BruecknerManaging DirectorAccenture Life Sciences, [email protected]
Copyright © 2016 Accenture All Rights Reserved.

Copyright © 2016 Accenture All Rights Reserved. 15
To learn more, visit:accenture.com/PharmaHPB
AuthorPhilip J. DavisHead of Life Sciences & Healthcare ResearchAccenture [email protected]
Stay Connectedlinkedin.com/company/accenture_life_sciences
twitter.com/AccentureLifSci
accenture.com/lifesciencesblog