Embed Size (px)
Citation preview
1
Commac
k High School HL
Biology
Topic Six:
Genetics
Seven
Quest
3. Genetics
Name:
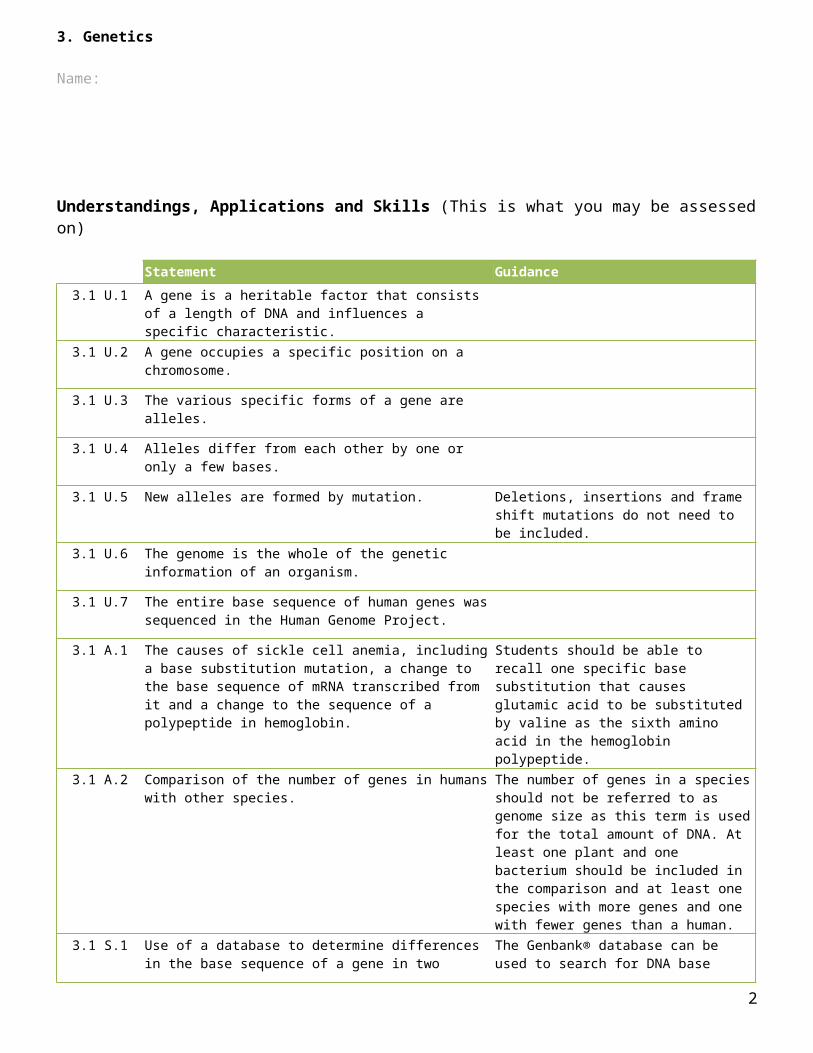
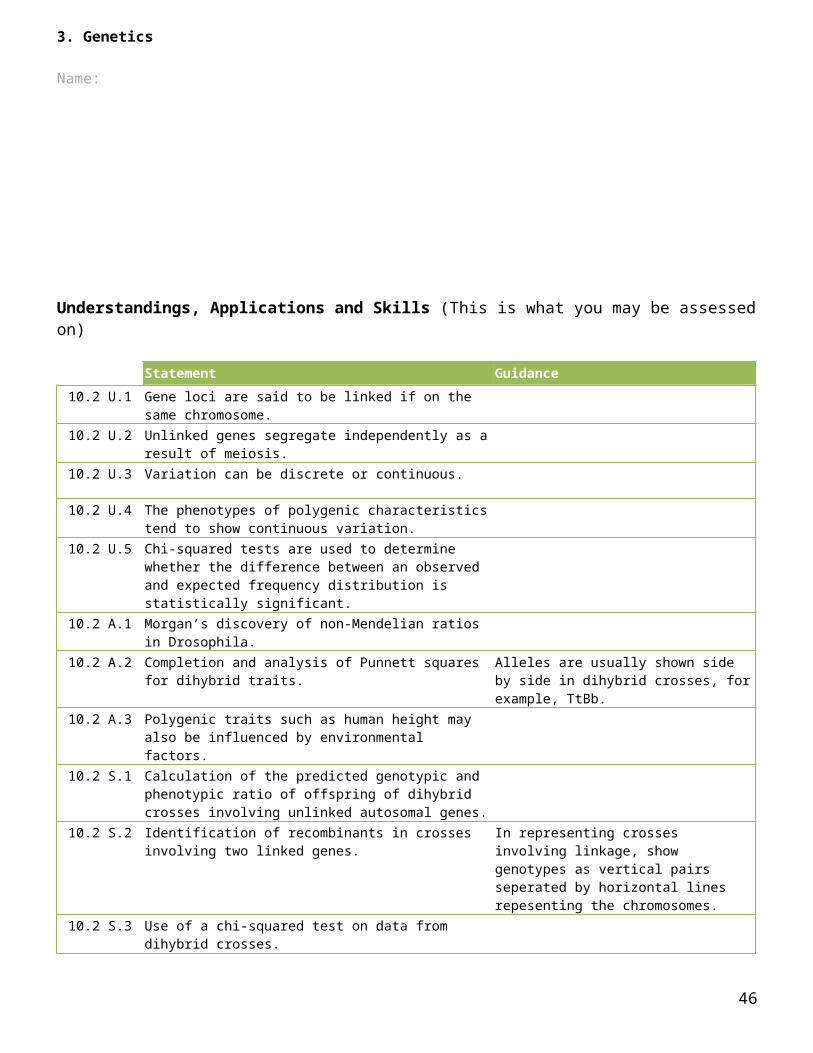
Understandings, Applications and Skills (This is what you may be assessed on)
Statement Guidance3.1 U.1 A gene is a heritable factor that consists of a length of DNA
and influences a specific characteristic.
3.1 U.2 A gene occupies a specific position on a chromosome.
3.1 U.3 The various specific forms of a gene are alleles.
3.1 U.4 Alleles differ from each other by one or only a few bases.
3.1 U.5 New alleles are formed by mutation. Deletions, insertions and frame shift mutations do not need to be included.
3.1 U.6 The genome is the whole of the genetic information of an organism.
3.1 U.7 The entire base sequence of human genes was sequenced in the Human Genome Project.
3.1 A.1 The causes of sickle cell anemia, including a base substitution mutation, a change to the base sequence of mRNA transcribed from it and a change to the sequence of a polypeptide in hemoglobin.
Students should be able to recall one specific base substitution that causes glutamic acid to be substituted by valine as the sixth amino acid in the hemoglobin polypeptide.
3.1 A.2 Comparison of the number of genes in humans with other species.
The number of genes in a species should not be referred to as genome size as this term is used for the total amount of DNA. At least one plant and one bacterium should be included in the comparison and at least one species with more genes and one with fewer genes than a human.
3.1 S.1 Use of a database to determine differences in the base sequence of a gene in two species.
The Genbank® database can be used to search for DNA base sequences. The cytochrome C gene sequence is available for many different organisms and is of particular interest because of its use in reclassifying organisms into three domains.
2

3. Genetics
Name:
3.1 U.1 A gene is a heritable factor that consists of a length of DNA and influences a specific characteristic. AND 3.1 U.2 A gene occupies a specific position on a chromosome. AND 3.1 U.3 The various specific forms of a gene are alleles. AND 3.1 U.4 Alleles differ from each other by one or only a few bases.
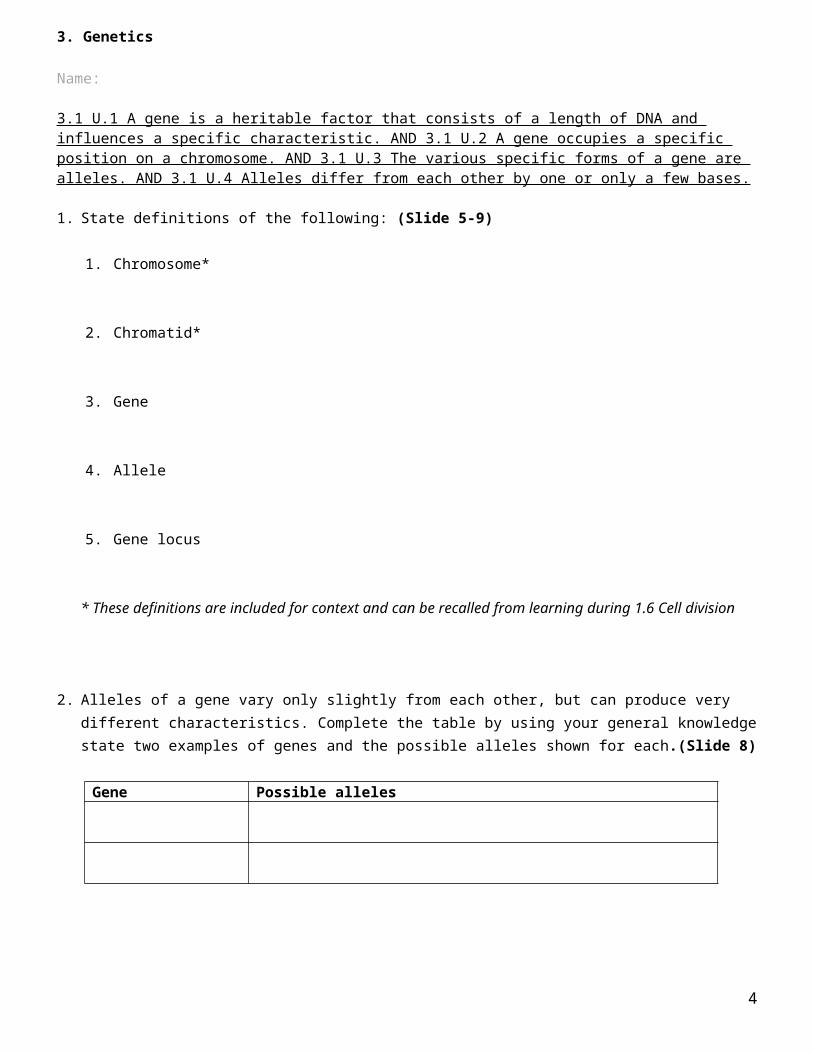
1. State definitions of the following: (Slide 5-9)
1. Chromosome*
2. Chromatid*
3. Gene
4. Allele
5. Gene locus
* These definitions are included for context and can be recalled from learning during 1.6 Cell division
2. Alleles of a gene vary only slightly from each other, but can produce very different characteristics. Complete the table by using your general knowledge state two examples of genes and the possible alleles shown for each.(Slide 8)
Gene Possible alleles
3
3. Genetics
Name:
3.1 A.2 Comparison of the number of genes in humans with other species.
3. Although the genetic code is universal the number of genes held by different species varies greatly. State the name and approximate number of genes held by: (Slide 9)
1. Humans
2. Mouse
3. Plant
4. Roundworm
5. Bacteria
3.1. U.6 The genome is the whole of the genetic information of an organism. AND 3.1. U.7 The entire base sequence of human genes was sequenced in the Human Genome Project. AND Nature of Science: Developments in scientific research follow improvements in technology - gene sequencers are used for the sequencing of genes. (1.8)
4. State the definitions of the genome? (Slide 12)
5. The Human Genome* Project (HGP) was an international 13-year effort, 1990 to 2003. State it’s primary goals. (Slide 16)
6. Key to the success of the Human Genome* Project (HGP) was the use of gene sequencers. List the key advances in technology made their use possible.(Slides 14-15 & 17)
4
3. Genetics
Name:
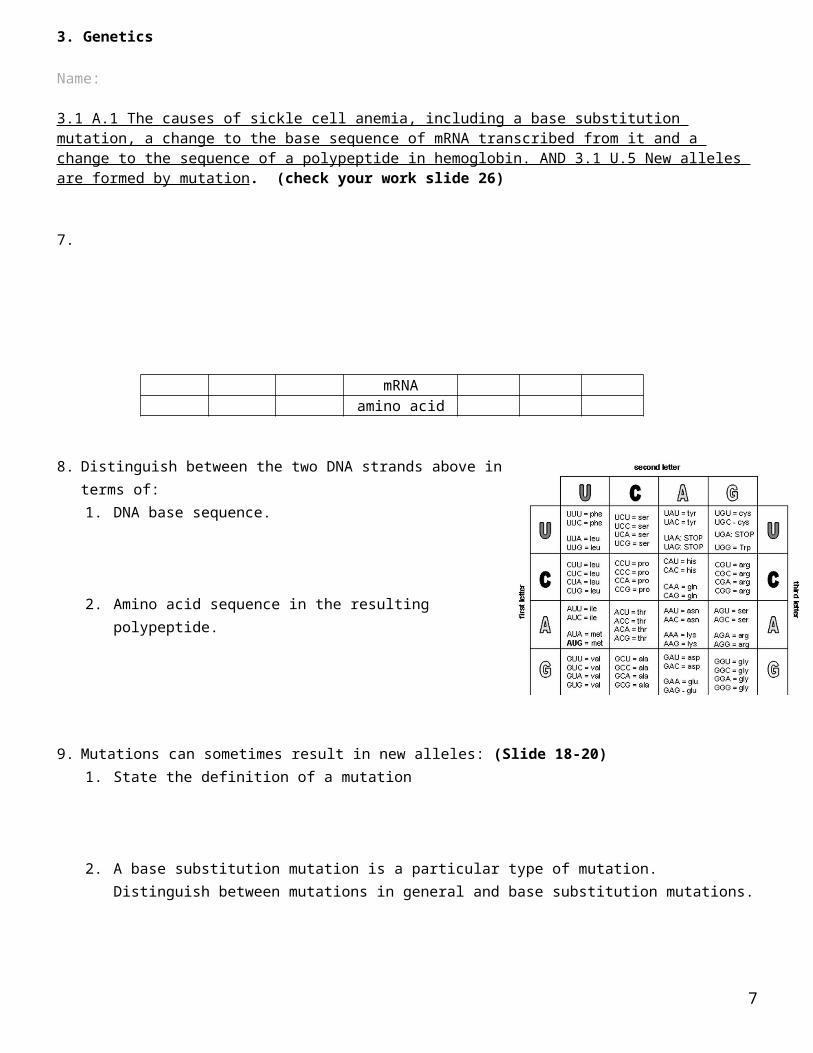
3.1 A.1 The causes of sickle cell anemia, including a base substitution mutation, a change to the base sequence of mRNA transcribed from it and a change to the sequence of a polypeptide in hemoglobin. AND 3.1 U.5 New alleles are formed by mutation. (check your work slide 26)
7.
mRNAamino acid
8. Distinguish between the two DNA strands above in terms of:1. DNA base sequence.
2. Amino acid sequence in the resulting polypeptide.
9. Mutations can sometimes result in new alleles: (Slide 18-20)1. State the definition of a mutation
2. A base substitution mutation is a particular type of mutation. Distinguish between mutations in general and base substitution mutations.
3. Outline how a base substitution mutation can result in a new allele.
5

3. Genetics
Name:
10. Describe the effects of sickle cell disease on sufferers in terms of: (Slide 22)1. Hemoglobin production
2. Symptoms and mortality
11. Some people inherit both a normal allele (Hb A) and a sickle cell (Hb S) allele. Such people do show very few symptoms of sickle cell disease. (Slide 27-28)1. Identify parts of the world this genotype could be beneficial.
2. Explain your answer
3.1 S.1 Use of a database to determine differences in the base sequence of a gene in two species.
GenBank is the NIH genetic sequence database, an annotated collection of all publicly available DNA sequences. Use it to find and extract base sequences by following the below steps: Go to GenBank website http://www.ncbi.nlm.nih.gov/genbank Select ‘Gene’ from the search bar Enter the name of a gene (e.g. AMY1A for salivary amylase 1A or COX1 for cytochrome oxidase 1)
AND the organism (use the binomial) and press ‘Search’n.b. if you are comparing species the gene chosen needs to be the same for each species
Select the ‘Name/Gene ID’ to get a detailed view Scroll down to the ‘Genomic regions, transcripts, and products’ section and click on ‘FASTA’ Copy the entire sequence from ‘>’ onwards Save the sequence – you will need to align with the other species next
6
3. Genetics
Name:
12. Your task is to analyse the differences between three or more species (the skill asks for two species, but the online Clustal tool works better with a minimum of three). List the three species chosen and the gene you are choosing to work with:
1. Species (give common names and the binomial)
2. Gene (give both the name and the code)
To align the sequences: Go to the Clustal Omega website http://www.ebi.ac.uk/Tools/msa/clustalo/ In STEP 1 Select ‘DNA’ under ‘a set of’ Paste the chosen sequences into the box (each sequence must start on a new line) Press ‘Submit’ (and wait – depending on the size of the sequences you may have to wait for a
couple of minutes)
Analysis: ‘Alignments’ allows you to visually check the results – this is easier if the chosen gene has a short
base sequence Under ‘Results Summary’ use the ‘Percent Identity Matrix’ to quantify the overall similarity (0 = no
similarity, 100 = identical) Under ‘Phylogenic Tree’ chose the ‘Real’ option for the Phylogram to get a visual representation of
how similar the species are (based on the chosen gene).
13. Align the sequences, analyse the results and outline your findings below:
7

3. Genetics
Name:
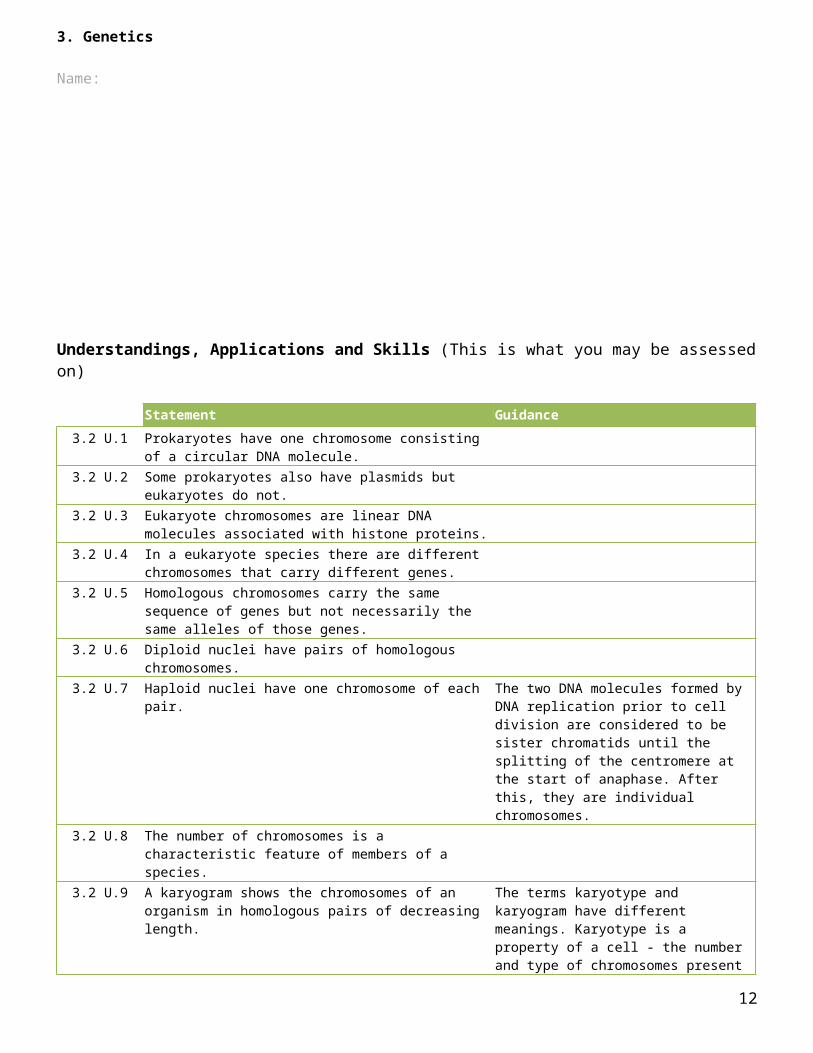
Understandings, Applications and Skills (This is what you may be assessed on)
Statement Guidance3.2 U.1 Prokaryotes have one chromosome consisting of a circular
DNA molecule.3.2 U.2 Some prokaryotes also have plasmids but eukaryotes do
not.3.2 U.3 Eukaryote chromosomes are linear DNA molecules
associated with histone proteins.
3.2 U.4 In a eukaryote species there are different chromosomes that carry different genes.
3.2 U.5 Homologous chromosomes carry the same sequence of genes but not necessarily the same alleles of those genes.
3.2 U.6 Diploid nuclei have pairs of homologous chromosomes.
3.2 U.7 Haploid nuclei have one chromosome of each pair. The two DNA molecules formed by DNA replication prior to cell division are considered to be sister chromatids until the splitting of the centromere at the start of anaphase. After this, they are individual chromosomes.
3.2 U.8 The number of chromosomes is a characteristic feature of members of a species.
3.2 U.9 A karyogram shows the chromosomes of an organism in homologous pairs of decreasing length.
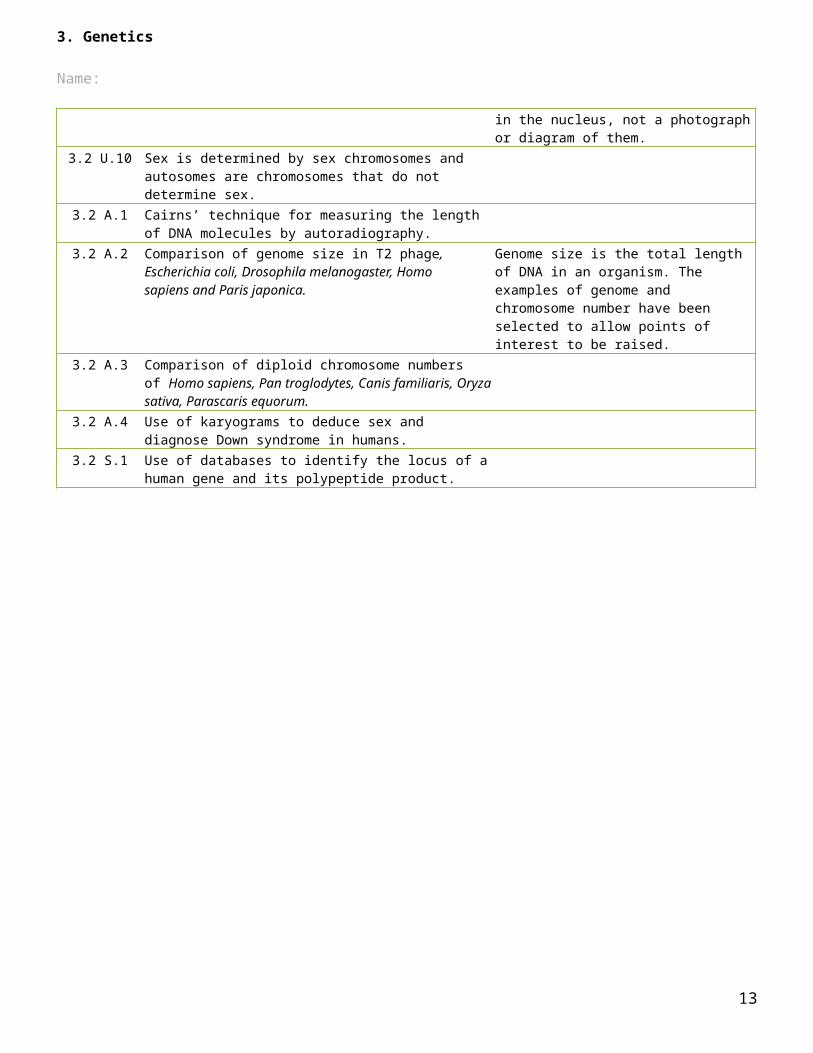
The terms karyotype and karyogram have different meanings. Karyotype is a property of a cell - the number and type of chromosomes present in the nucleus, not a photograph or diagram of them.
3.2 U.10 Sex is determined by sex chromosomes and autosomes are chromosomes that do not determine sex.
3.2 A.1 Cairns’ technique for measuring the length of DNA molecules by autoradiography.
3.2 A.2 Comparison of genome size in T2 phage, Escherichia coli, Drosophila melanogaster, Homo sapiens and Paris japonica.
Genome size is the total length of DNA in an organism. The examples of genome and chromosome number have been selected to allow points of interest to be raised.
3.2 A.3 Comparison of diploid chromosome numbers of Homo sapiens, Pan troglodytes, Canis familiaris, Oryza sativa, Parascaris equorum.
3.2 A.4 Use of karyograms to deduce sex and diagnose Down syndrome in humans.
3.2 S.1 Use of databases to identify the locus of a human gene and its polypeptide product.
8
3. Genetics
Name:
3.2 U.1 Prokaryotes have one chromosome consisting of a circular DNA molecule. AND 3.2.U2 Some prokaryotes also have plasmids but eukaryotes do not. (Slides 34-36)
14. Distinguish between the two types of DNA present in a generalized prokaryote cell.
3.2.U3 Eukaryote chromosomes are linear DNA molecules associated with histone proteins.
15. Describe the attraction of histones to DNA and explain the role it plays in the nucleus. (slide 38)
3.2 U.4 In a eukaryote species there are different chromosomes that carry different genes.
16. Outline the three ways in which chromosomes can vary: (Slide 39)
17. If chromosomes vary, describe how individuals of a species are similar in terms of their DNA. (Slide 40)
3.2 U.5 Homologous chromosomes carry the same sequence of genes but not necessarily the same alleles of those genes.
18. State what is meant by the term homologous chromosome and the pairs origin. (Slide 41)
9
3. Genetics
Name:
3.2 U.6 Diploid nuclei have pairs of homologous chromosomes. AND 3.2.U7 Haploid nuclei have one chromosome of each pair. (Slide 43 & 44)
19. Eukaryotic nuclei can be described as being haploid or diploid. Describe what is meant by these terms.1. Haploid2. Diploid
20. List the types of cell in humans that are haploid and state the number of chromosomes present in the nuclei of a human.
21. List the types of cell in humans that are diploid and state the number of chromosomes present in the nuclei.
22. Extension: give a type of human cell that is neither haploid nor diploid.
3.2 U.8 The number of chromosomes is a characteristic feature of members of a species. (slide 45)
23. The number of chromosomes possessed by a species is known as the N number. State what the N number is for humans.
24. Give two reasons why the chromosome number can be used to characterize a species.
3.2 U.9 A karyogram shows the chromosomes of an organism in homologous pairs of decreasing length.
25. Distinguish between a karyogram and a karyotype. (slide 46 & 47)
10
3. Genetics
Name:
26. State three visual aspects of homologous chromosomes which can be used to identify them for the purpose of a karyotype?
1. Banding patterns2.
3.
3.2 U.10 Sex is determined by sex chromosomes and autosomes are chromosomes that do not determine sex.
27. One pair of chromosomes in human cells is not always homologous. (Slide 48)1. State which pair
2. Explain why the identified pair is not always homologous.
28. State the gene, if expressed that causes the development of male characteristics and the chromosome it is located on. (Slide 49)
29. Explain why there is a 50:50 chance of human offspring being male or female. (Slide 49)
3.2 A.1 Cairns’ technique for measuring the length of DNA molecules by autoradiography. AND Nature of Science: Developments in research follow improvements in techniques - autoradiography was used to establish the length of DNA molecules in chromosomes. (1.8)
30. John Cairn technique.are essential for the use of? (Slide 50)
11
3. Genetics
Name:
3.2 A.2 Comparison of genome size in T2 phage, Escherichia coli, Drosophila melanogaster, Homo sapiens and Paris japonica.
31. Complete the table to compare genome size in the selected organisms. (Slide 49)
Organism Genome size(million base pairs)
Genome SizeNumber of Chromosomes
Virus - T2 phage
Bacterium - Escherichia coli
Fruit fly(Drosophila melanogaster)Humans(Homo sapiens)Canopy plant(Paris japonica)
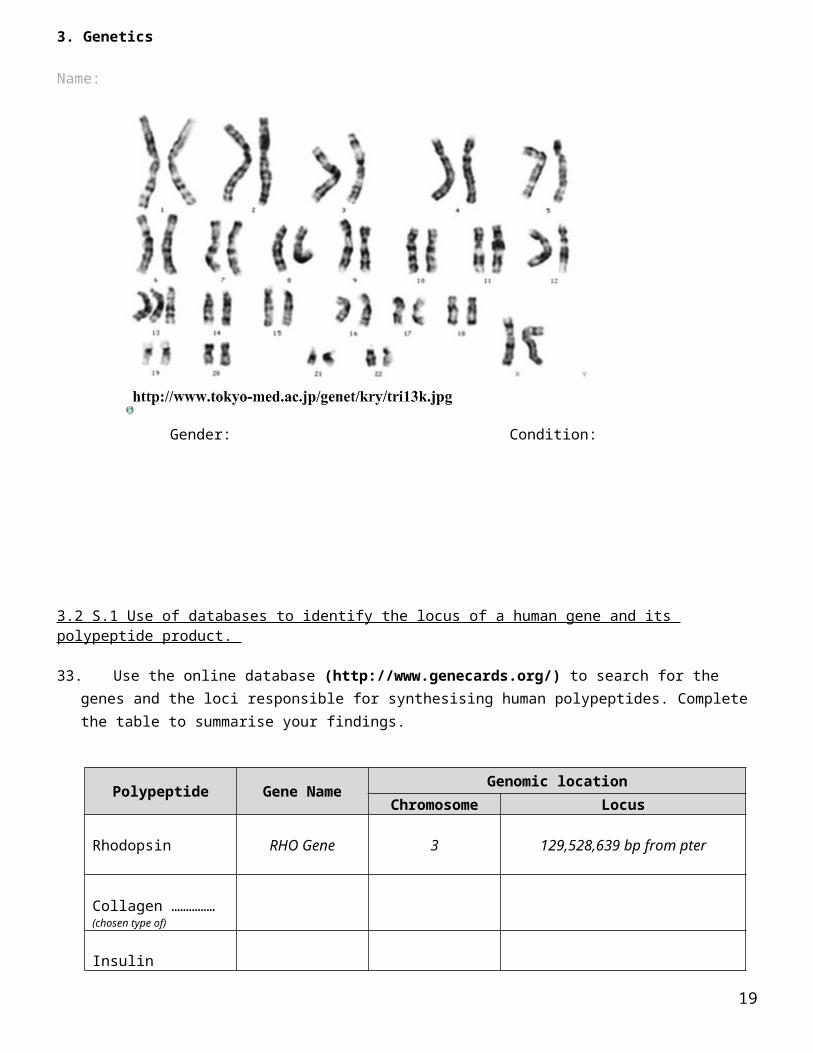
3.2 A.4 Use of karyograms to deduce sex and diagnose Down syndrome in humans. (Slides 57-59)
32. Analyse the karyogram below:
Gender: Condition:
12
3. Genetics
Name:
3.2 S.1 Use of databases to identify the locus of a human gene and its polypeptide product.
33. Use the online database (http://www.genecards.org/) to search for the genes and the loci responsible for synthesising human polypeptides. Complete the table to summarise your findings.
Polypeptide Gene Name Genomic locationChromosome Locus
Rhodopsin RHO Gene 3 129,528,639 bp from pter
Collagen ……………(chosen type of)
Insulin
(polypeptide of choice)
n.b. pter is the end (terminus) of the short arm of the chromosome and qter is the end of the long arm of the chromosome.
13
3. Genetics
Name:
Understandings, Applications and Skills (This is what you may be assessed on)
Statement Guidance3.3 U.1 One diploid nucleus divides by meiosis to produce four
haploid nuclei.3.3 U.2 The halving of the chromosome number allows a sexual
life cycle with fusion of gametes.3.3 U.3 DNA is replicated before meiosis so that all chromosomes
consist of two sister chromatids.3.3 U.4 The early stages of meiosis involve pairing of homologous
chromosomes and crossing over followed by condensation.
The process of chiasmata formation need not be explained.
3.3 U.5 Orientation of pairs of homologous chromosomes prior to separation is random.
3.3 U.6 Separation of pairs of homologous chromosomes in the first division of meiosis halves the chromosome number.
3.3 U.7 Crossing over and random orientation promotes genetic variation.
3.3 U.8 Fusion of gametes from different parents promotes genetic variation.
3.3 A.1 Non-disjunction can cause Down syndrome and other chromosome abnormalities.
3.3 A.2 Studies showing age of parents influences chances of non-disjunction.
3.3 A.3 Description of methods used to obtain cells for karyotype analysis e.g. chorionic villus sampling and amniocentesis and the associated risks.
3.3 S.1 Drawing diagrams to show the stages of meiosis resulting in the formation of four haploid cells.
Drawings of the stages of meiosis do not need to include chiasmata. Preparation of microscope slides showing meiosis is challenging and permanent slides should be available in case no cells in meiosis are visible in temporary mounts.
Understandings, Applications and Skills (This is what you may be assessed on)
Statement Guidance10.1 U.1 Chromosomes replicate in interphase before meiosis.
10.1 U.2 Crossing over is the exchange of DNA material between non-sister homologous chromatids.
10.1 U.3 Crossing over produces new combinations of alleles on the chromosomes of the haploid cells.
10.1 U.4 Chiasmata formation between non-sister chromatids can result in an exchange of alleles.
10.1 U.5 Homologous chromosomes separate in meiosis I.
14
3. Genetics
Name:
10.1 U.6 Sister chromatids separate in meiosis II.
10.1 U.7 Independent assortment of genes is due to the random orientation of pairs of homologous chromosomes in meiosis I.
10.1 S.1 Drawing diagrams to show chiasmata formed by crossing over.
Diagrams of chiasmata should show sister chromatids still closely aligned, except at the point where crossing over occurred and a chiasma was formed.
Nature of Science: Making careful observations - meiosis was discovered by microscope examination of dividing germ-line cells. (1.8)
In the 19th century was very difficult to observe the behaviour of chromosomes in cell: the choice of organism and tissue, slide preparation and interpreting microscope images are all difficult to do successfully. It therefore it took years of careful examination by Scientists to discover and fully understand meiosis.
3.3 U.1 One diploid nucleus divides by meiosis to produce four haploid nuclei. (Slides 66-70)
34. State the function of meiosis.
35. State the definition of the term homologous chromosome.
36. Explain why meiosis is described as a reduction division.
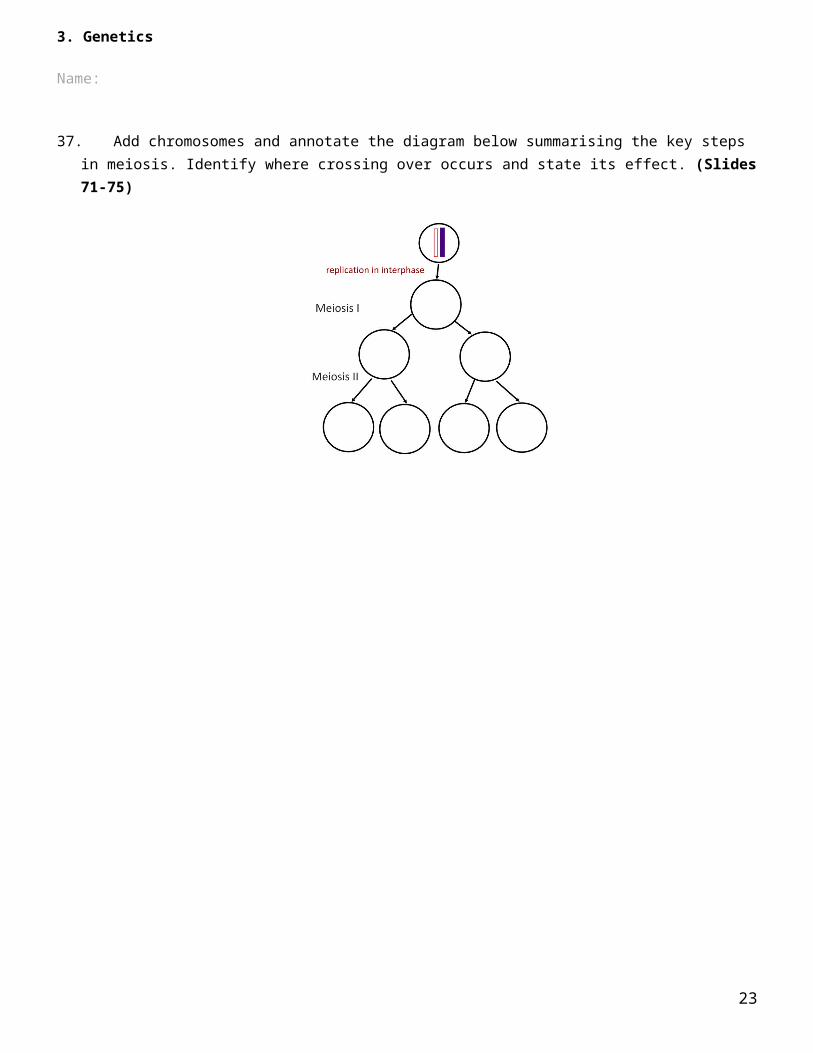
37. Add chromosomes and annotate the diagram below summarising the key steps in meiosis. Identify where crossing over occurs and state its effect. (Slides 71-75)
15
3. Genetics
Name:
3.3 U.2 The halving of the chromosome number allows a sexual life cycle with fusion of gametes.
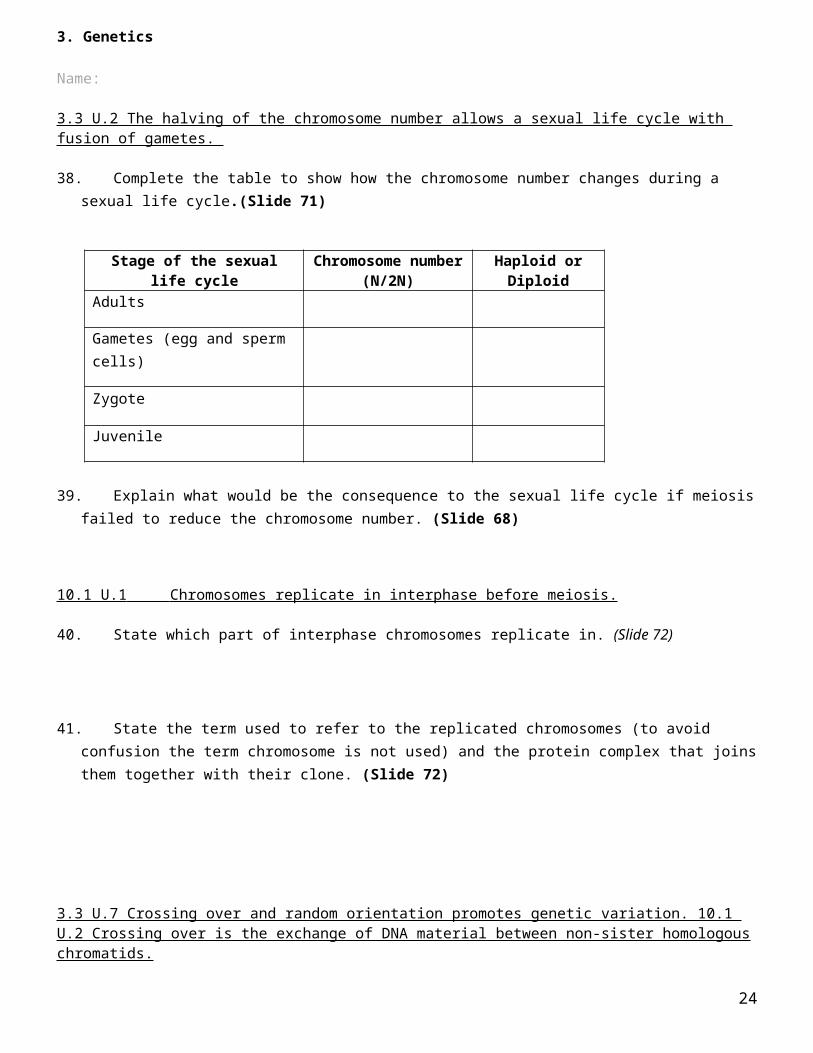
38. Complete the table to show how the chromosome number changes during a sexual life cycle.(Slide 71)
Stage of the sexual life cycle Chromosome number (N/2N)
Haploid or Diploid
Adults
Gametes (egg and sperm cells)
Zygote
Juvenile
39. Explain what would be the consequence to the sexual life cycle if meiosis failed to reduce the chromosome number. (Slide 68)
10.1 U.1 Chromosomes replicate in interphase before meiosis.
40. State which part of interphase chromosomes replicate in. (Slide 72)
41. State the term used to refer to the replicated chromosomes (to avoid confusion the term chromosome is not used) and the protein complex that joins them together with their clone. (Slide 72)
3.3 U.7 Crossing over and random orientation promotes genetic variation. 10.1 U.2 Crossing over is the exchange of DNA material between non-sister homologous chromatids.10.1 U.4 Chiasmata formation between non-sister chromatids can result in an exchange of alleles. 10.1 U.3 Crossing over produces new combinations of alleles on the chromosomes of the haploid cells.
42. Crossing over occurs in Prophase I. State the result of the process and explain how this increases the genetic variation found in gametes. Include the Synapsis & Chiasma formation (Slides 75-78)
16
3. Genetics
Name:
43. Outline how random orientation in Metaphase I leads to further genetic variation and state the number of possible orientations in human cells. (Slides 77 & 83)
10.1 0.U5 Homologous chromosomes separate in meiosis I. 10.1 U.6 Sister chromatids separate in meiosis II. (Slides 87-96)
47. In each part of meiosis (I and II) the amount of DNA in the nucleus is reduced, but in different ways.a. State the phase of meiosis does reduction division take place, i.e. when are the number
chromosomes reduced.
b. Explain why Meiosis II is not classed as being a reduction division.
10.1 U.7 Independent assortment of genes is due to the random orientation of pairs of homologous chromosomes in meiosis I.
48. Mendel made many advances in genetics through careful observation and statistical analysis.a. State Mendel’s Law of Independent Assortment (Slide 97)
3.3 U.8 Fusion of gametes from different parents promotes genetic variation.
49. Outline how sexual reproduction leads to even further genetic variation within a species. (Slide 98)
17
3. Genetics
Name:
3.3 S.1 Drawing diagrams to show the stages of meiosis resulting in the formation of four haploid cells. AND 3.3 U.3 DNA is replicated before meiosis so that all chromosomes consist of two sister chromatids. AND 3.3 U.4 The early stages of meiosis involve pairing of homologous chromosomes and crossing over followed by condensation. AND 3.3 U.5 Orientation of pairs of homologous chromosomes prior to separation is random. AND 3.3 U.6 Separation of pairs of homologous chromosomes in the first division of meiosis halves the chromosome number.
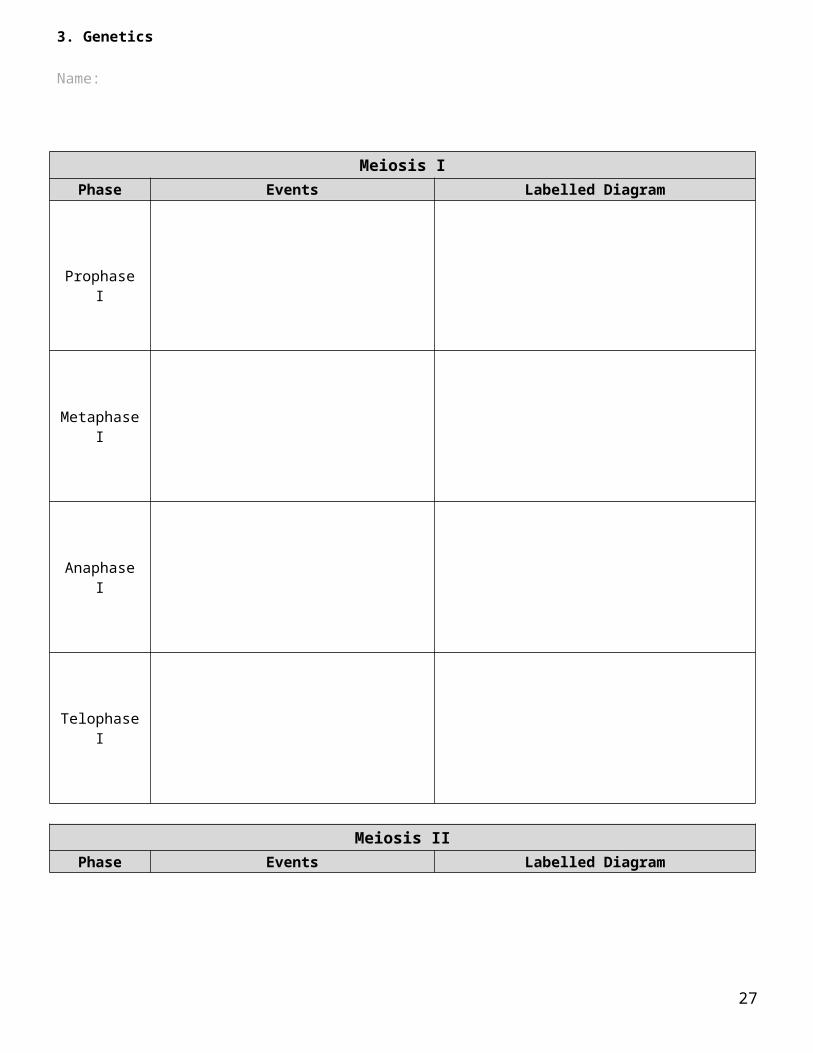
50. Outline the events and movements of chromosomes occurring during the different stages of meiosis (Slides 88-96)
Meiosis IPhase Events Labelled Diagram
Prophase I
Metaphase I
Anaphase I
Telophase I
18
3. Genetics
Name:
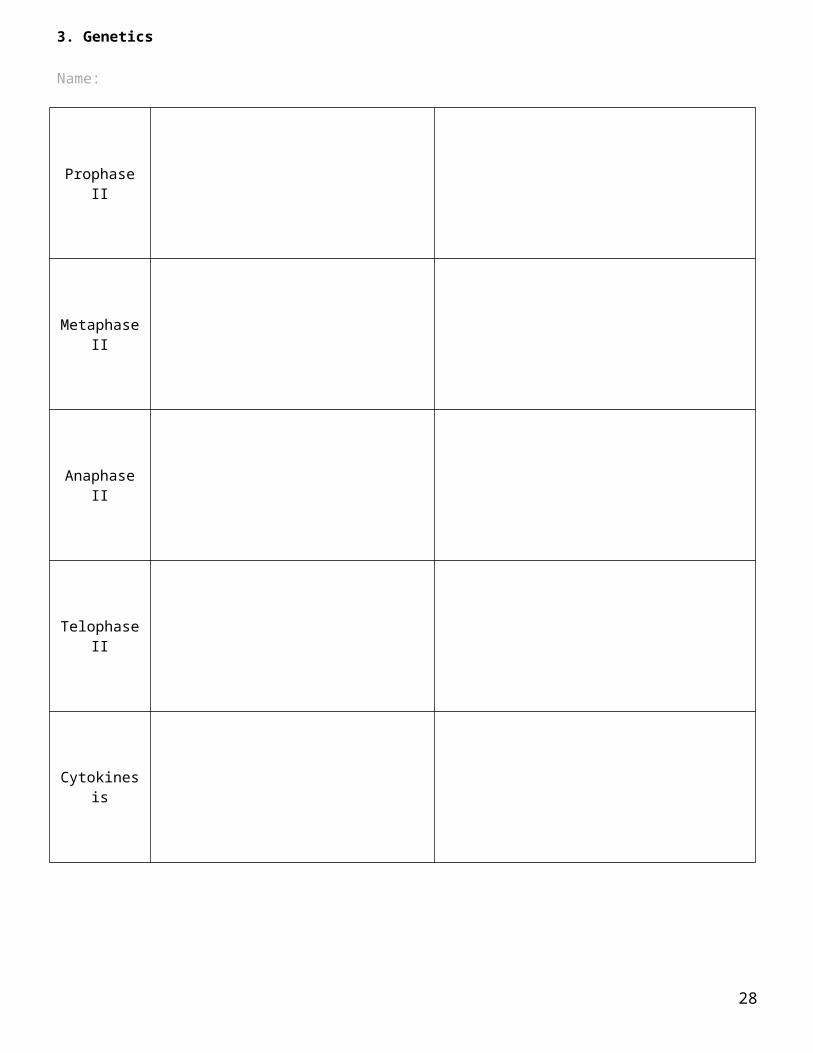
Meiosis IIPhase Events Labelled Diagram
Prophase II
Metaphase II
Anaphase II
Telophase II
Cytokinesis
19
3. Genetics
Name:
Knowledge review questions
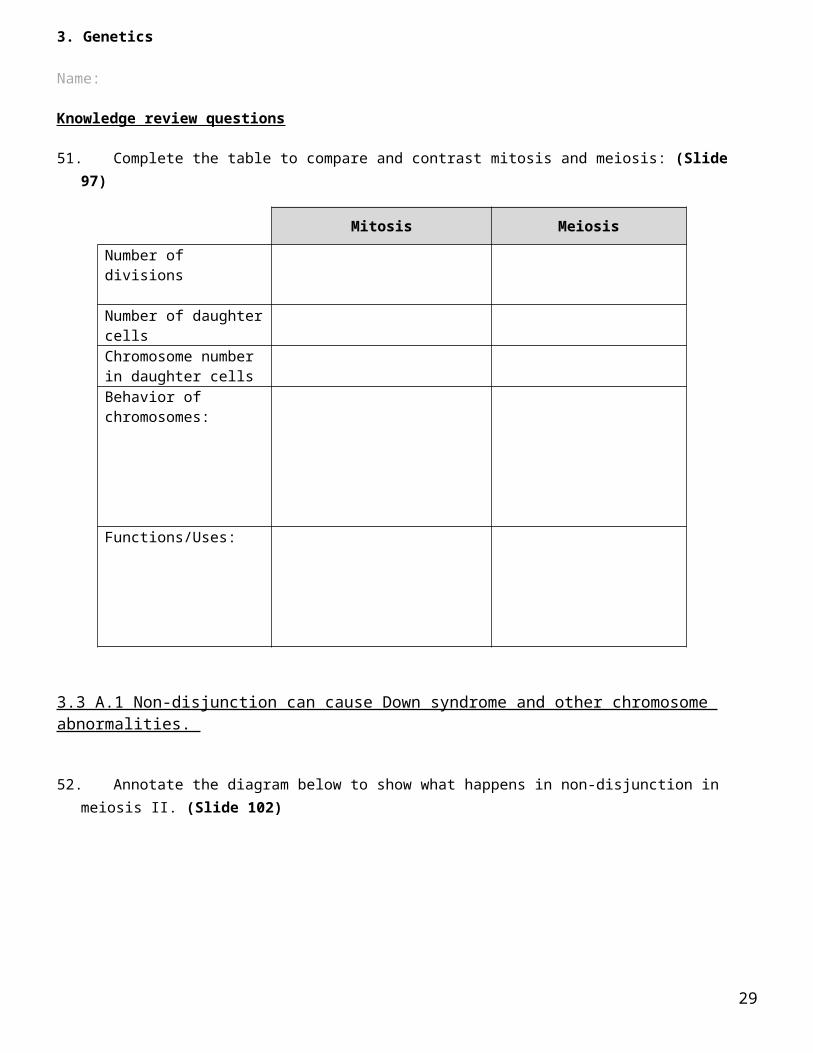
51. Complete the table to compare and contrast mitosis and meiosis: (Slide 97)
Mitosis Meiosis
Number of divisions
Number of daughter cellsChromosome number in daughter cellsBehavior of chromosomes:
Functions/Uses:
3.3 A.1 Non-disjunction can cause Down syndrome and other chromosome abnormalities.
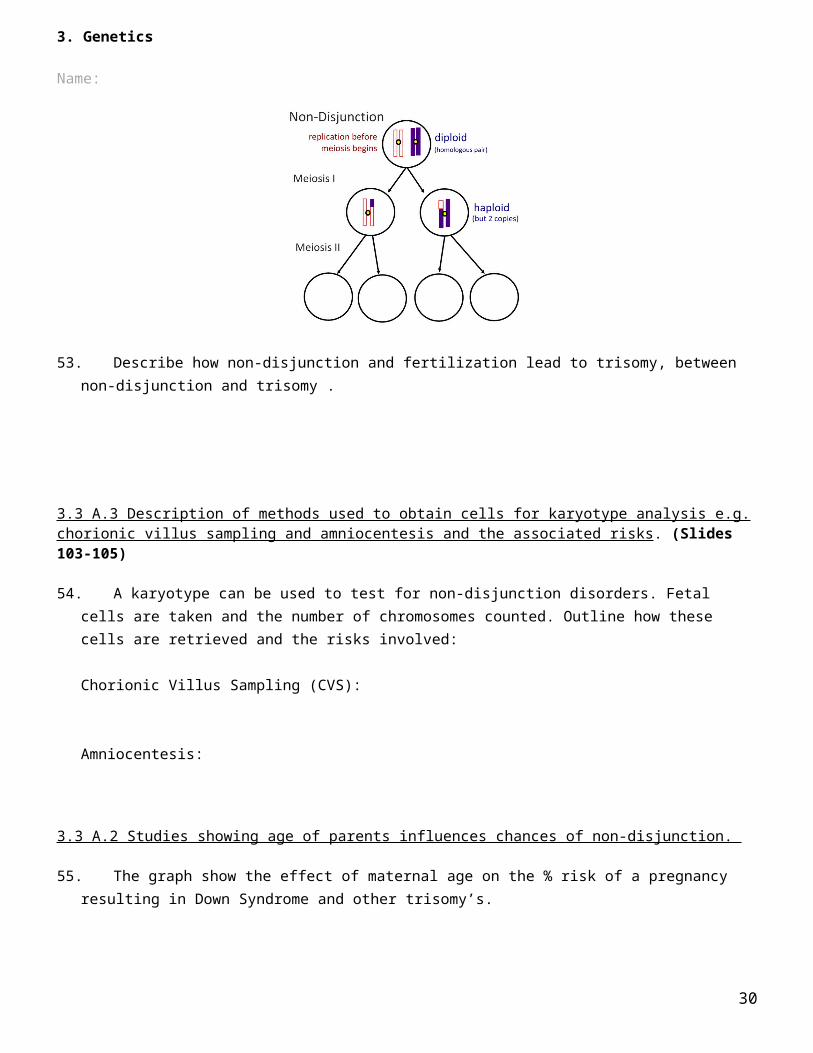
52. Annotate the diagram below to show what happens in non-disjunction in meiosis II. (Slide 102)
53. Describe how non-disjunction and fertilization lead to trisomy, between non-disjunction and trisomy .
20
3. Genetics
Name:
3.3 A.3 Description of methods used to obtain cells for karyotype analysis e.g. chorionic villus sampling and amniocentesis and the associated risks. (Slides 103-105)
54. A karyotype can be used to test for non-disjunction disorders. Fetal cells are taken and the number of chromosomes counted. Outline how these cells are retrieved and the risks involved:
Chorionic Villus Sampling (CVS):
Amniocentesis:
3.3 A.2 Studies showing age of parents influences chances of non-disjunction.
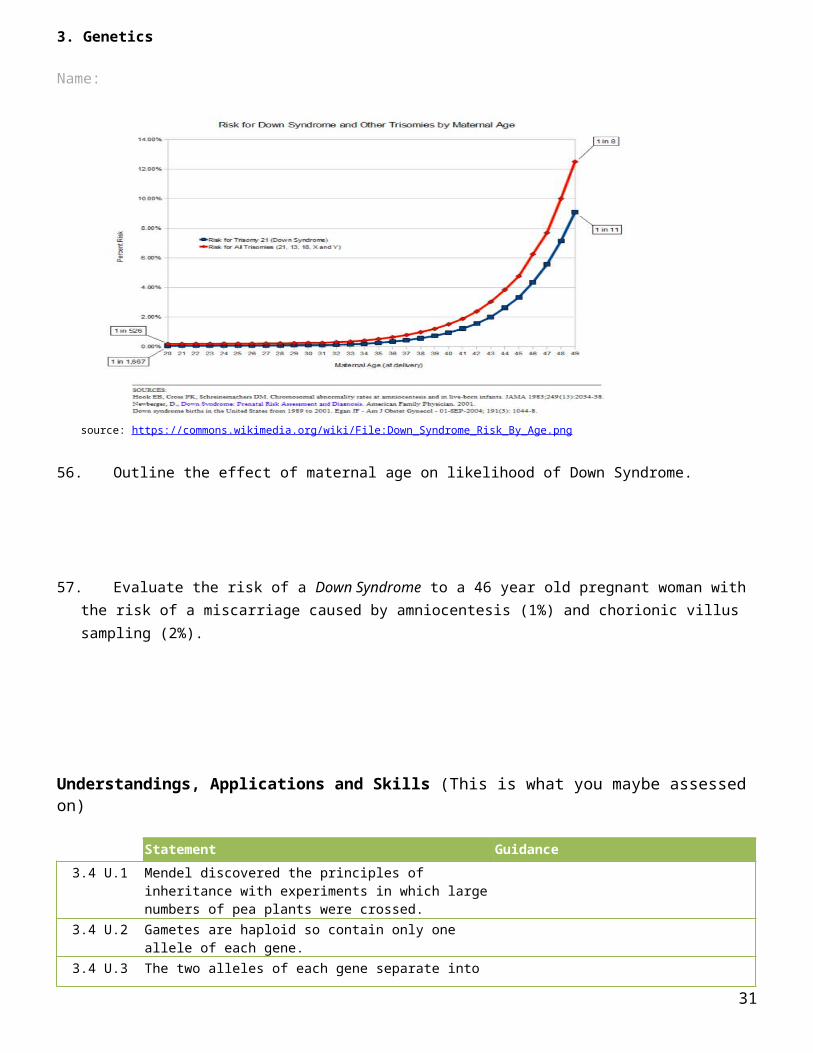
55. The graph show the effect of maternal age on the % risk of a pregnancy resulting in Down Syndrome and other trisomy’s.
source: https://commons.wikimedia.org/wiki/ File:Down_Syndrome_Risk_By_Age.png
56. Outline the effect of maternal age on likelihood of Down Syndrome.
57. Evaluate the risk of a Down Syndrome to a 46 year old pregnant woman with the risk of a miscarriage caused by amniocentesis (1%) and chorionic villus sampling (2%).
21
3. Genetics
Name:
Understandings, Applications and Skills (This is what you maybe assessed on)
Statement Guidance3.4 U.1 Mendel discovered the principles of inheritance with
experiments in which large numbers of pea plants were crossed.
3.4 U.2 Gametes are haploid so contain only one allele of each gene.
3.4 U.3 The two alleles of each gene separate into different haploid daughter nuclei during meiosis.
3.4 U.4 Fusion of gametes results in diploid zygotes with two alleles of each gene that may be the same allele or different alleles.
3.4 U.5 Dominant alleles mask the effects of recessive alleles but co-dominant alleles have joint effects.
3.4 U.6 Many genetic diseases in humans are due to recessive alleles of autosomal genes, although some genetic diseases are due to dominant or co-dominant alleles.
3.4 U.7 Some genetic diseases are sex-linked. The pattern of inheritance is different with sex-linked genes due to their location on sex chromosomes.
Alleles carried on X chromosomes should be shown as superscript letters on an upper case X, such as Xh.
3.4 U.8 Many genetic diseases have been identified in humans but most are very rare.
3.4 U.9 Radiation and mutagenic chemicals increase the mutation rate and can cause genetic diseases and cancer.
3.4 A.1 Inheritance of ABO blood groups. The expected notation for ABO blood group alleles: O = i, A=IA, B = IB.
3.4 A.2 Red-green colour blindness and hemophilia as examples of sex-linked inheritance.
3.4 A.3 Inheritance of cystic fibrosis and Huntington’s disease.
3.4 A.4 Consequences of radiation after nuclear bombing of Hiroshima and accident at Chernobyl.
3.4 S.1 Construction of Punnett grids for predicting the outcomes of monohybrid genetic crosses.
3.4 S.2 Comparison of predicted and actual outcomes of genetic crosses using real data.
3.4 S.3 Analysis of pedigree charts to deduce the pattern of inheritance of genetic diseases.
22
3. Genetics
Name:
3.4 U.1 Mendel discovered the principles of inheritance with experiments in which large numbers of pea plants were crossed.
42. Mendel is known as the father of genetics for his extensive experimental work with peas. His findings enabled him to form the principles of inheritance. Use the DNA Interactive animations) to find out about Mendel:
https://www.dnalc.org/view/16002-Gregor-Mendel-and-pea-plants.html https://www.dnalc.org/view/16170-Animation-3-Gene-s-don-t-blend-.html
1. State the approximate number of seeds used in each trial.
2. List three examples of traits Mendel investigated.
3. Explain what is meant by the term ‘pure-bred’.
4. Describe the key experimental finding that led to the establishment of the principles of inheritance.
Nature of science: Making quantitative measurements with replicates to ensure reliability. Mendel’s genetic crosses with pea plants generated numerical data. (3.2)
43. To reach valid conclusions often statistical tests are used to help analyse the data collected. Outline why large sample sizes are preferable to smaller ones.
23
3. Genetics
Name:
3.4 U.2 Gametes are haploid so contain only one allele of each gene. 3.4 U.3 The two alleles of each gene separate into different haploid daughter nuclei during meiosis. 3.4 U.4 Fusion of gametes results in diploid zygotes with two alleles of each gene that may be the same allele or different alleles.
44. State definitions of the following: (Slides 111-116)
Genotype
Phenotype
Dominant allele
Recessive allele
Codominant alleles
Homozygous
Heterozygous
Carrier
Test Cross
3.4 A.1 Inheritance of ABO blood groups. AND 3.4.U5 Dominant alleles mask the effects of recessive alleles but co-dominant alleles have joint effects.
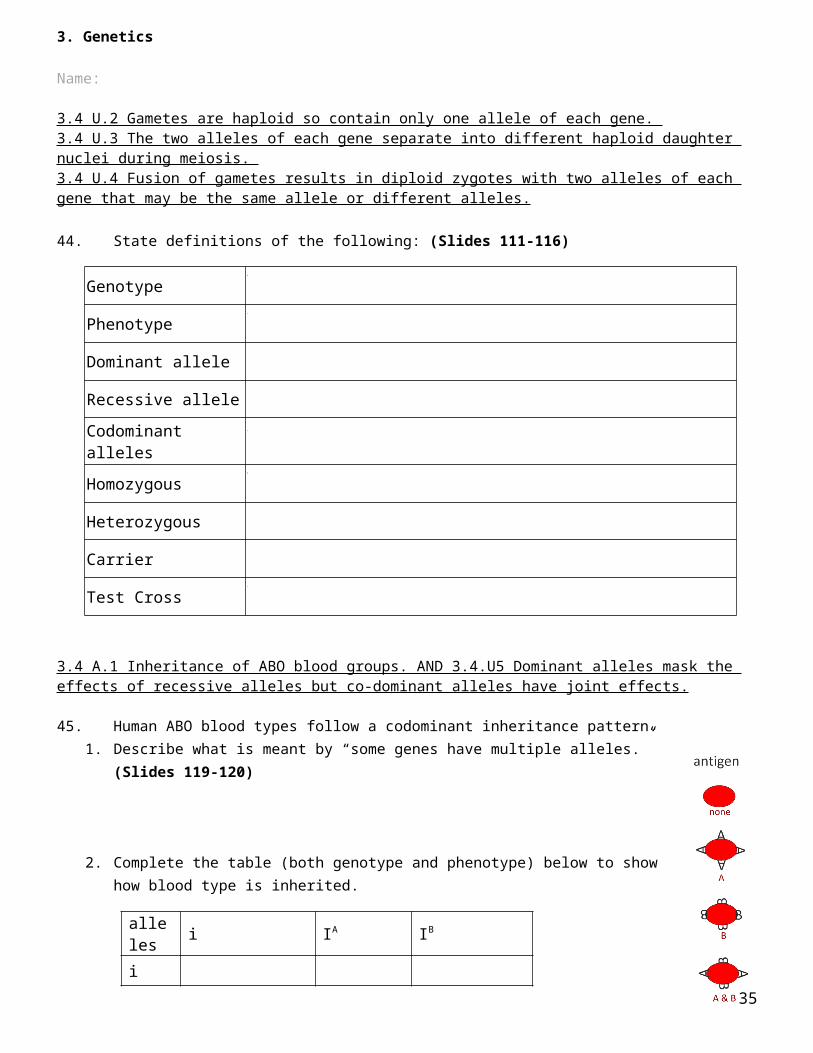
45. Human ABO blood types follow a codominant inheritance pattern.1. Describe what is meant by “some genes have multiple alleles.” (Slides 119-120)
2. Complete the table (both genotype and phenotype) below to show how blood type is inherited.
alleles i IA IB
i
IA
IB
24
3. Genetics
Name:
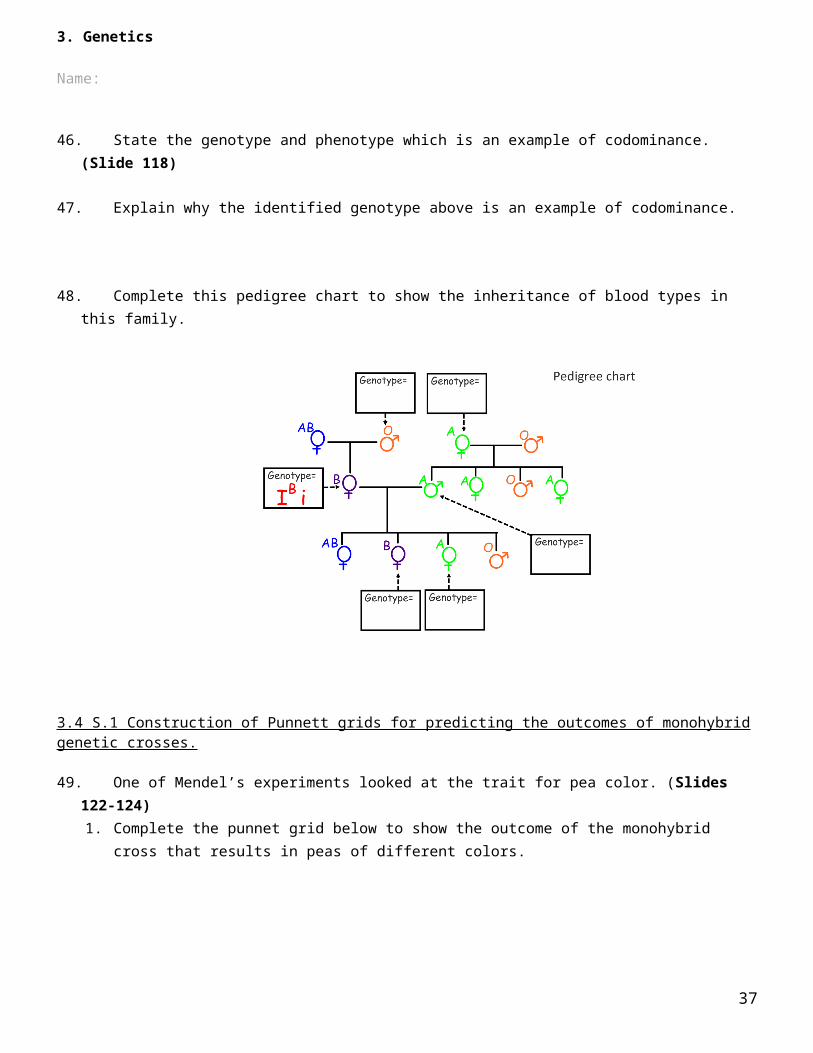
46. State the genotype and phenotype which is an example of codominance. (Slide 118)
47. Explain why the identified genotype above is an example of codominance.
48. Complete this pedigree chart to show the inheritance of blood types in this family.
3.4 S.1 Construction of Punnett grids for predicting the outcomes of monohybrid genetic crosses.
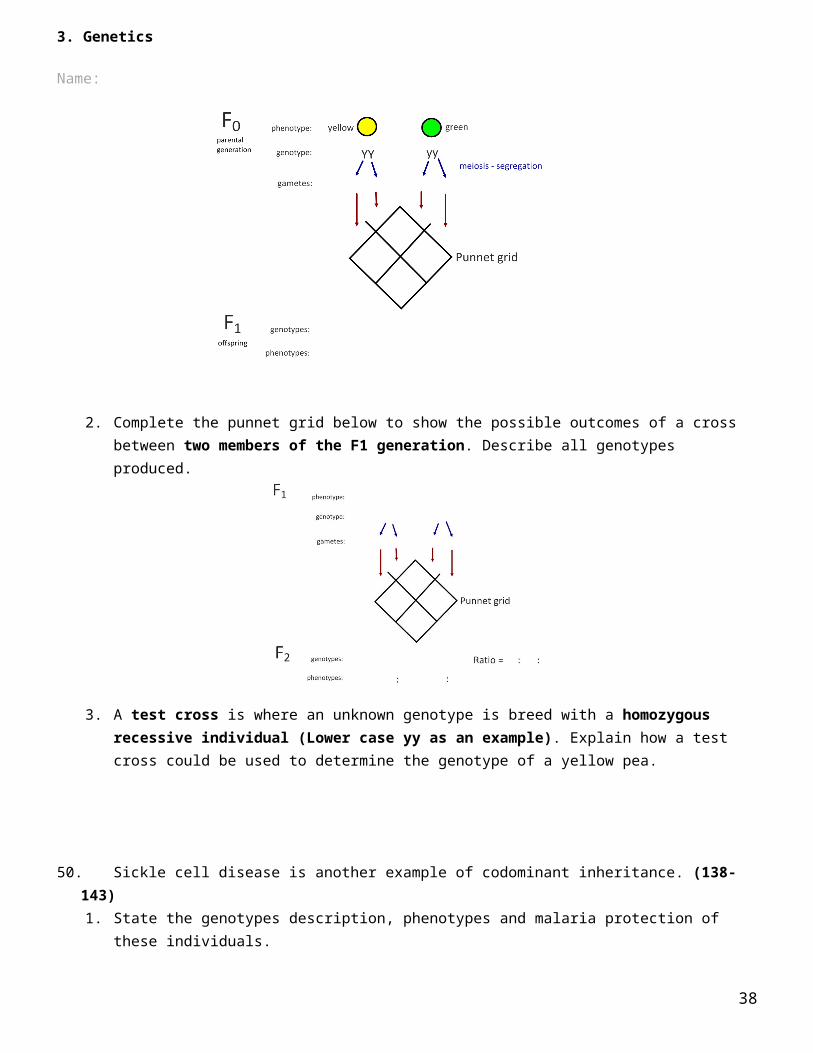
49. One of Mendel’s experiments looked at the trait for pea color. (Slides 122-124)1. Complete the punnet grid below to show the outcome of the monohybrid cross that results in peas
of different colors.
25
3. Genetics
Name:
2. Complete the punnet grid below to show the possible outcomes of a cross between two members of the F1 generation. Describe all genotypes produced.
3. A test cross is where an unknown genotype is breed with a homozygous recessive individual (Lower case yy as an example). Explain how a test cross could be used to determine the genotype of a yellow pea.
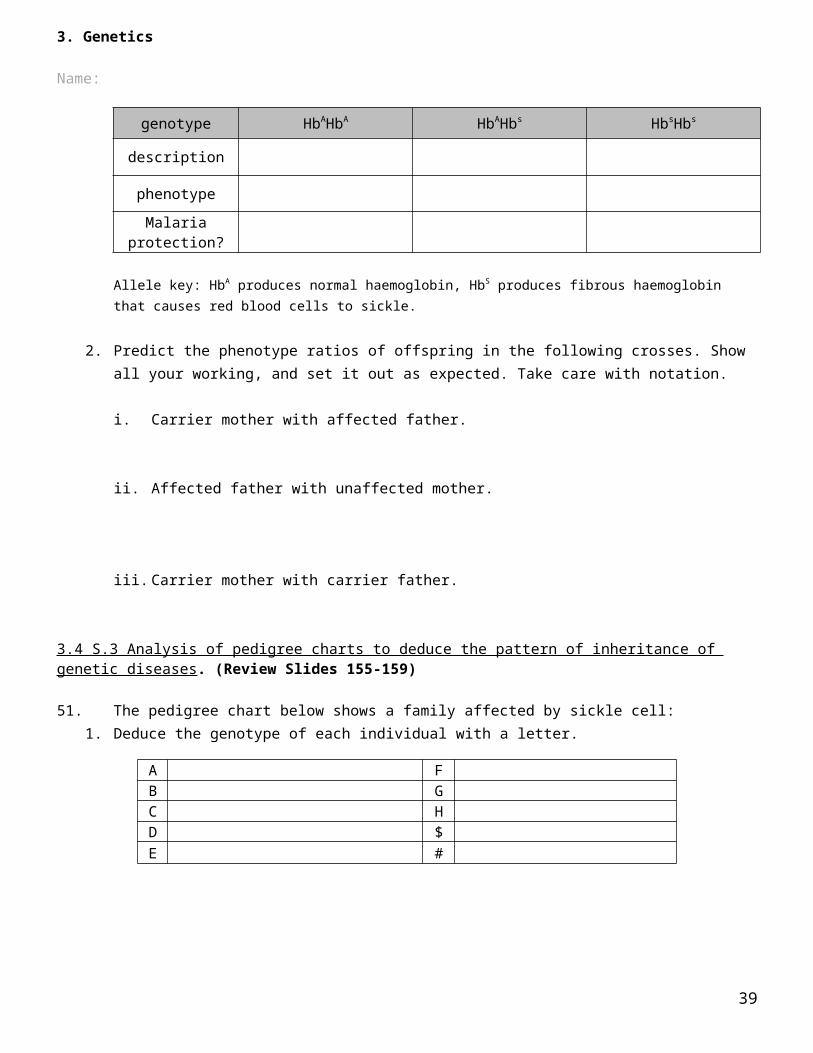
50. Sickle cell disease is another example of codominant inheritance. (138-143)1. State the genotypes description, phenotypes and malaria protection of these individuals.
genotype HbAHbA HbAHbs HbsHbs
description
phenotype
Malaria protection?
Allele key: HbA produces normal haemoglobin, HbS produces fibrous haemoglobin that causes red blood cells to sickle.
2. Predict the phenotype ratios of offspring in the following crosses. Show all your working, and set it out as expected. Take care with notation.
i. Carrier mother with affected father.
ii. Affected father with unaffected mother.
iii. Carrier mother with carrier father.
26
3. Genetics
Name:
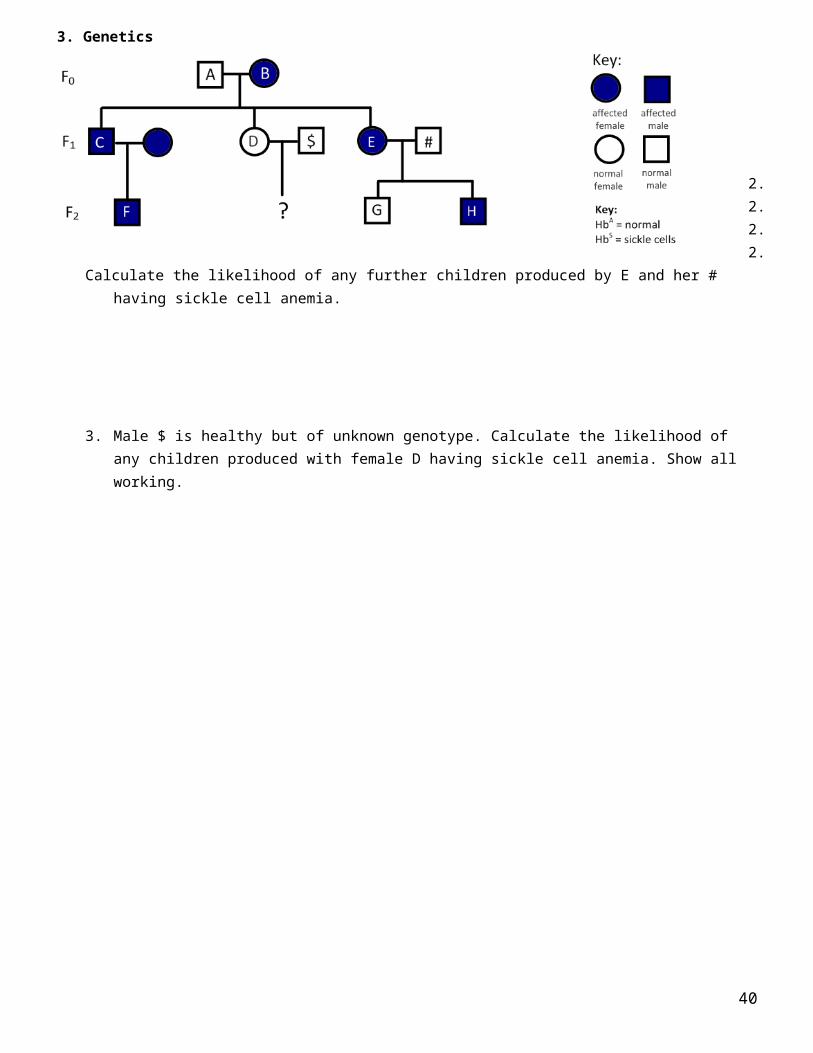
3.4 S.3 Analysis of pedigree charts to deduce the pattern of inheritance of genetic diseases. (Review Slides 155-159)
51. The pedigree chart below shows a family affected by sickle cell:1. Deduce the genotype of each individual with a letter.
A FB GC HD $E #
2.2.2.2.2.
Calculate the likelihood of any further children produced by E and her # having sickle cell anemia.
3. Male $ is healthy but of unknown genotype. Calculate the likelihood of any children produced with female D having sickle cell anemia. Show all working.
27
3. Genetics
Name:
3.4 U.8 Many genetic diseases have been identified in humans but most are very rare.
52. Explain why genetic diseases are very rare in humans. (Slide 159)
3.4 U.6 Many genetic diseases in humans are due to recessive alleles of autosomal genes, although some genetic diseases are due to dominant or co-dominant alleles. AND 3.4 A.3 Inheritance of cystic fibrosis and Huntington’s disease. (Review Slides 155-160)
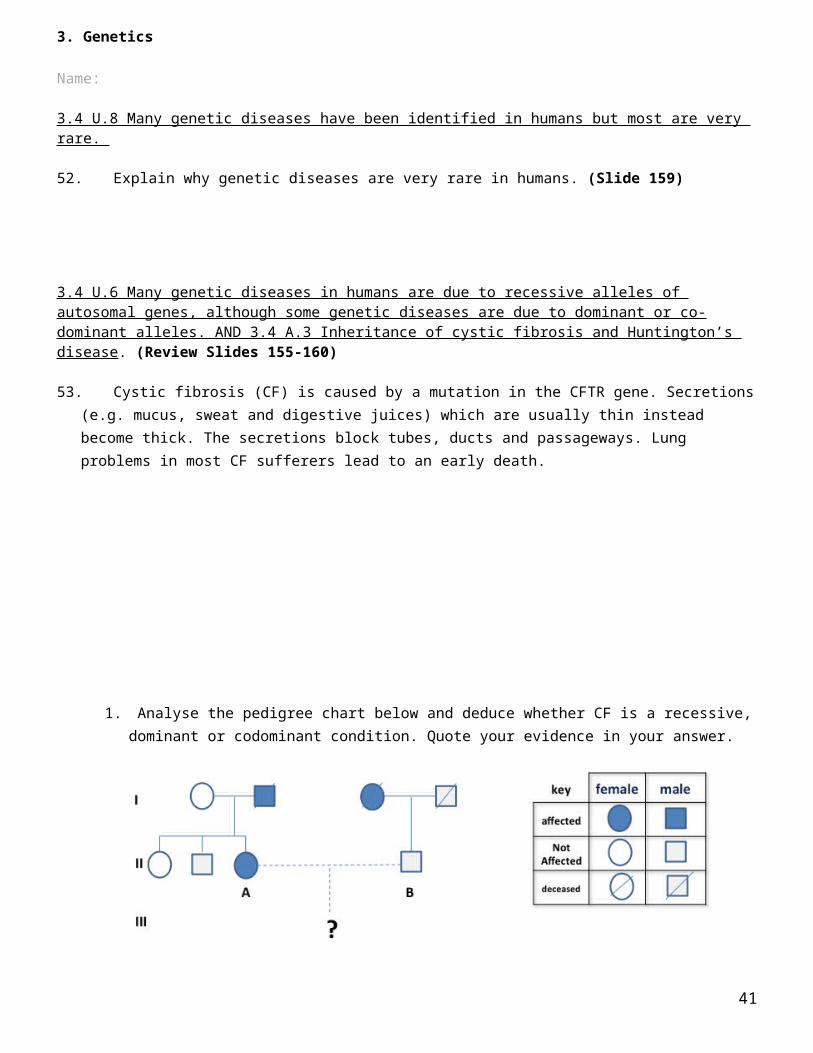
53. Cystic fibrosis (CF) is caused by a mutation in the CFTR gene. Secretions (e.g. mucus, sweat and digestive juices) which are usually thin instead become thick. The secretions block tubes, ducts and passageways. Lung problems in most CF sufferers lead to an early death.
1. Analyse the pedigree chart below and deduce whether CF is a recessive, dominant or codominant condition. Quote your evidence in your answer.
2. What is the probability of two parents who are both carriers of (one copy of) the recessive allele producing children affected by CF? Show your workings.
28
3. Genetics
Name:
54. Huntington's Disease (HD) is a brain disorder that affects a person's ability to think, talk, and move. HD is caused by a mutation in a gene on chromosome 4. (Slide 161)
55. Is this a dominant or recessive condition?
56. Produce a punnett grid to explain the inheritance pattern seen in the offspring of a normal mother and a heterozygous affected father. Don’t forget to use a key to explain the genotypes and allele symbols used.
3.4 U.7 Some genetic diseases are sex-linked. The pattern of inheritance is different with sex-linked genes due to their location on sex chromosomes. AND 3.4 A.2 Red-green color blindness and hemophilia as examples of sex-linked inheritance. (Slides 144-152)
57. Some inherited disorders are associated with gender. 1. State two examples of sex-linked genetic disorders.
2. Explain why sex-linked disorders are more common in males than females.
3. Explain why human females can be homozygous or heterozygous for sex-linked genes, where males cannot.
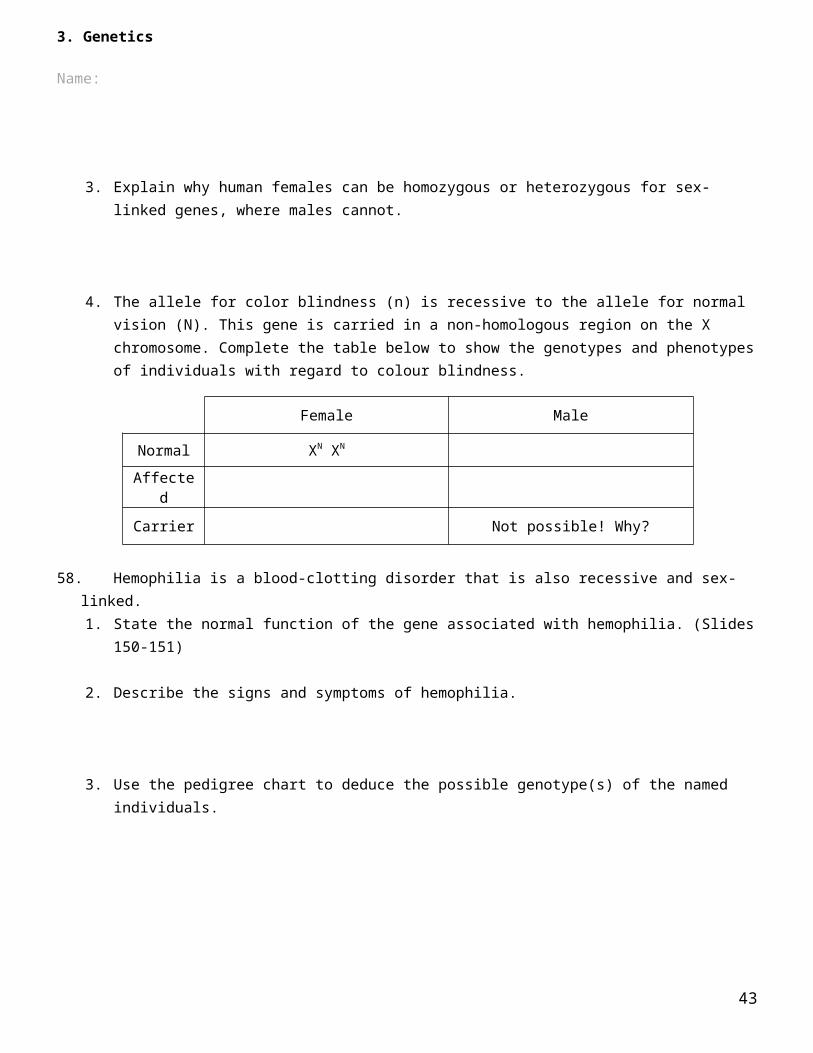
4. The allele for color blindness (n) is recessive to the allele for normal vision (N). This gene is carried in a non-homologous region on the X chromosome. Complete the table below to show the genotypes and phenotypes of individuals with regard to colour blindness.
Female Male
Normal XN XN
Affected
Carrier Not possible! Why?
29
3. Genetics
Name:
58. Hemophilia is a blood-clotting disorder that is also recessive and sex-linked. 1. State the normal function of the gene associated with hemophilia. (Slides 150-151)
2. Describe the signs and symptoms of hemophilia.
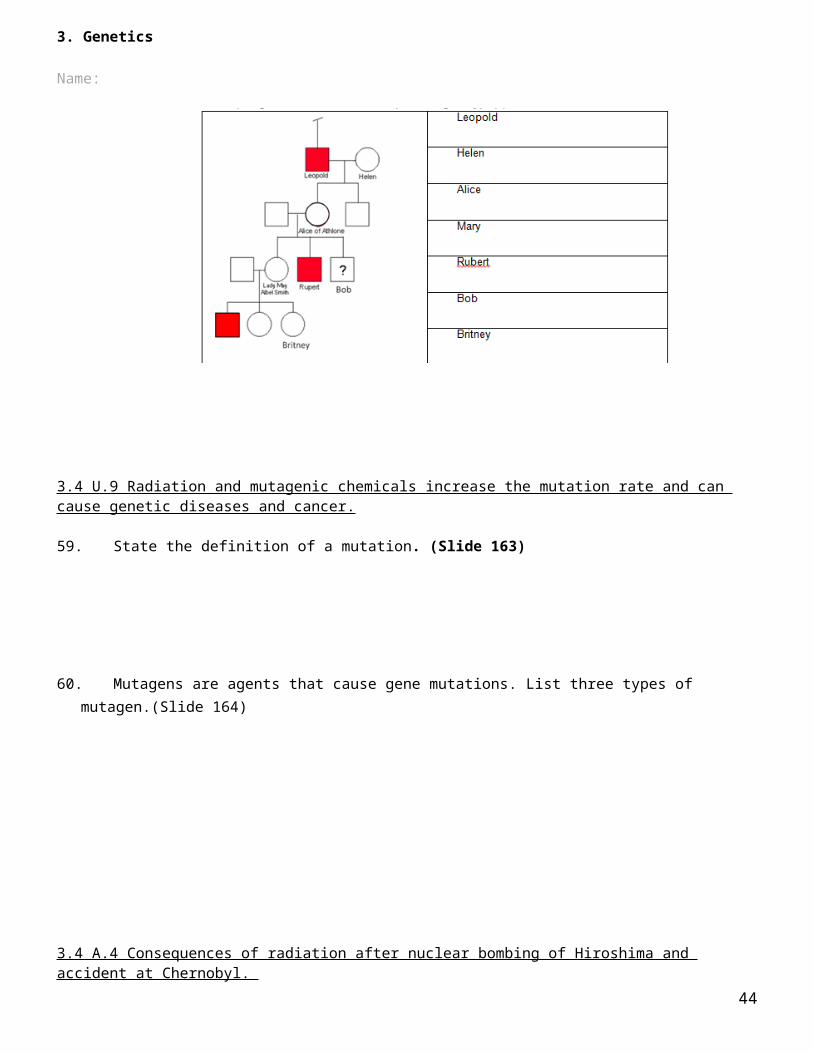
3. Use the pedigree chart to deduce the possible genotype(s) of the named individuals.
3.4 U.9 Radiation and mutagenic chemicals increase the mutation rate and can cause genetic diseases and cancer.
59. State the definition of a mutation. (Slide 163)
60. Mutagens are agents that cause gene mutations. List three types of mutagen.(Slide 164)
30
3. Genetics
Name:
3.4 A.4 Consequences of radiation after nuclear bombing of Hiroshima and accident at Chernobyl.
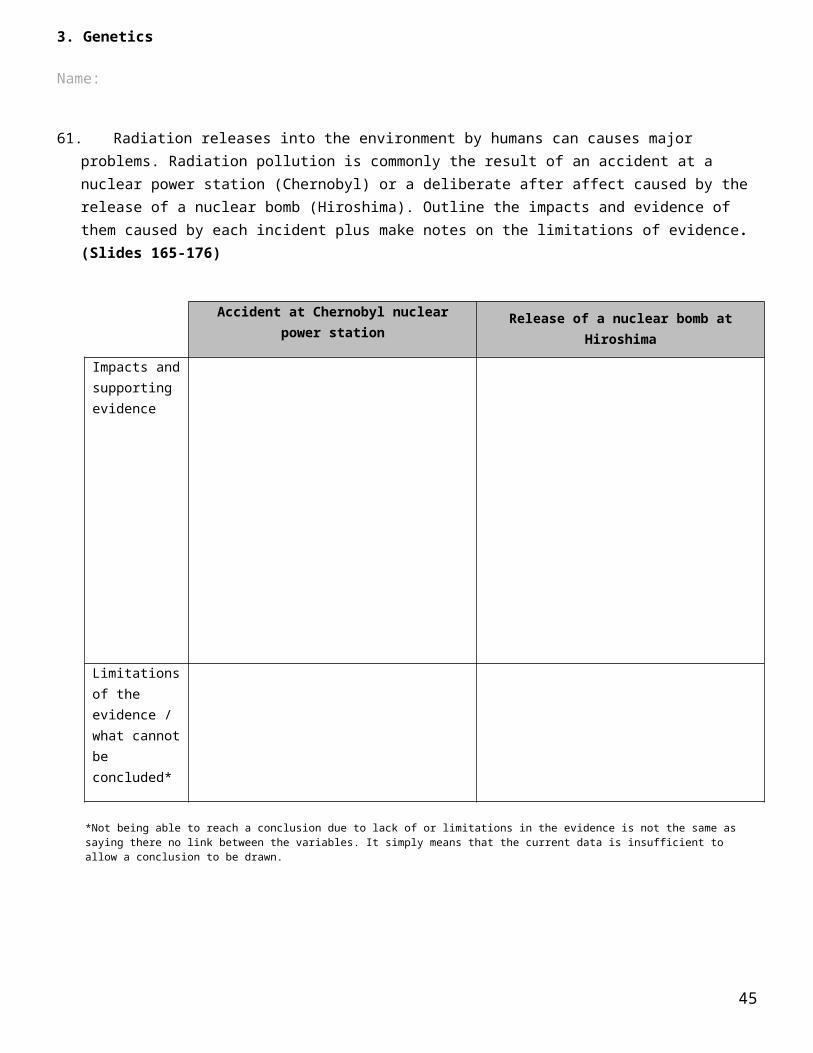
61. Radiation releases into the environment by humans can causes major problems. Radiation pollution is commonly the result of an accident at a nuclear power station (Chernobyl) or a deliberate after affect caused by the release of a nuclear bomb (Hiroshima). Outline the impacts and evidence of them caused by each incident plus make notes on the limitations of evidence. (Slides 165-176)
Accident at Chernobyl nuclear power station Release of a nuclear bomb at Hiroshima
Impacts and supporting evidence
Limitations of the evidence / what cannot be concluded*
*Not being able to reach a conclusion due to lack of or limitations in the evidence is not the same as saying there no link between the variables. It simply means that the current data is insufficient to allow a conclusion to be drawn.
31

3. Genetics
Name:
Understandings, Applications and Skills (This is what you may be assessed on)
Statement Guidance10.2 U.1 Gene loci are said to be linked if on the same
chromosome.10.2 U.2 Unlinked genes segregate independently as a result of
meiosis.10.2 U.3 Variation can be discrete or continuous.
10.2 U.4 The phenotypes of polygenic characteristics tend to show continuous variation.
10.2 U.5 Chi-squared tests are used to determine whether the difference between an observed and expected frequency distribution is statistically significant.
10.2 A.1 Morgan’s discovery of non-Mendelian ratios in Drosophila.
10.2 A.2 Completion and analysis of Punnett squares for dihybrid traits.
Alleles are usually shown side by side in dihybrid crosses, for example, TtBb.
10.2 A.3 Polygenic traits such as human height may also be influenced by environmental factors.
10.2 S.1 Calculation of the predicted genotypic and phenotypic ratio of offspring of dihybrid crosses involving unlinked autosomal genes.
10.2 S.2 Identification of recombinants in crosses involving two linked genes.
In representing crosses involving linkage, show genotypes as vertical pairs seperated by horizontal lines repesenting the chromosomes.
10.2 S.3 Use of a chi-squared test on data from dihybrid crosses.
10.2 U.2 Unlinked genes segregate independently as a result of meiosis.
62. Mendel’s Law of Independent Assortment (Slide 181)
10.2 A.2 Completion and analysis of Punnett squares for dihybrid traits. AND 10.2.S1 Calculation of the predicted genotypic and phenotypic ratio of offspring of dihybrid crosses involving unlinked autosomal genes.
63. Distinguish between dihybrid and monohybrid crosses. (Slides 123 & 190)
32
3. Genetics
Name:
10.2 U.3 Variation can be discrete or continuous. AND 10.2 U.4 The phenotypes of polygenic characteristics tend to show continuous variation. (Slides 182-185)
64. Polygenic inheritance gives rise to continuous variation.1. Define polygenic inheritance.
2. Distinguish between polygenic inheritance and multiple alleles.
3. List one human and one plant example of polygenic inheritance.
4. Define contributing allele.
5. Explain how polygenic inheritance gives rise to continuous variation within a population using skin colour as an example.
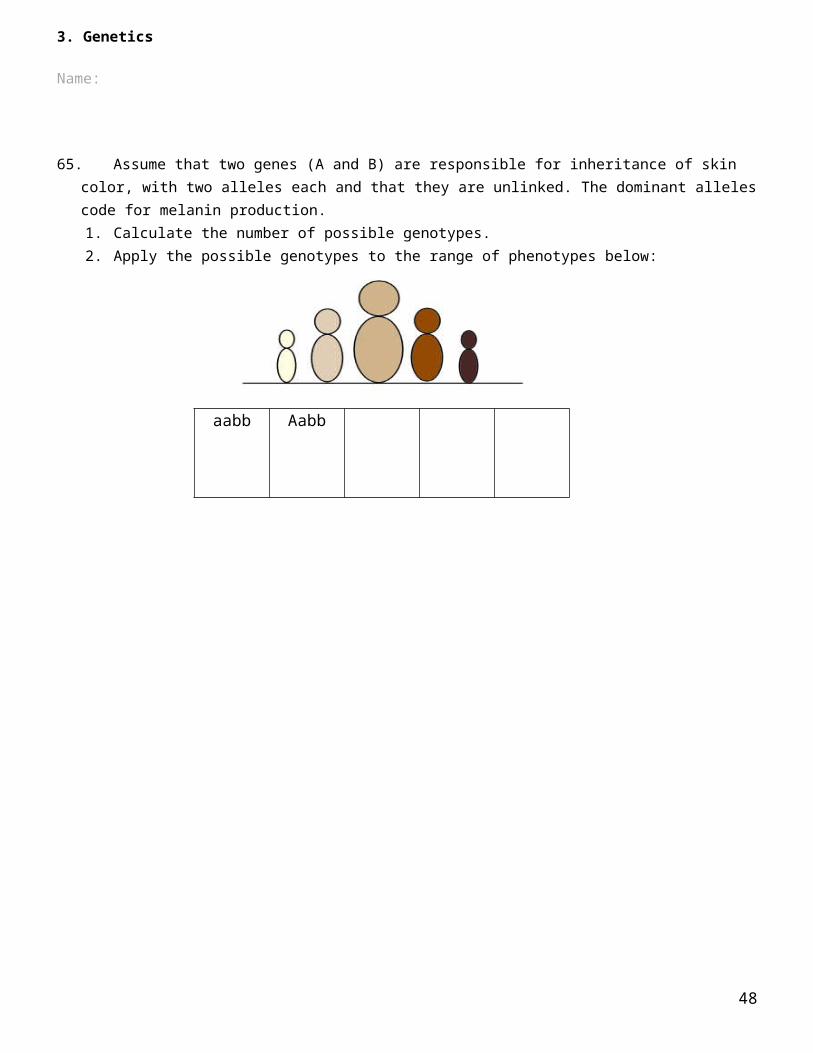
65. Assume that two genes (A and B) are responsible for inheritance of skin color, with two alleles each and that they are unlinked. The dominant alleles code for melanin production. 1. Calculate the number of possible genotypes. 2. Apply the possible genotypes to the range of phenotypes below:
aabb Aabb
33

3. Genetics
Name:
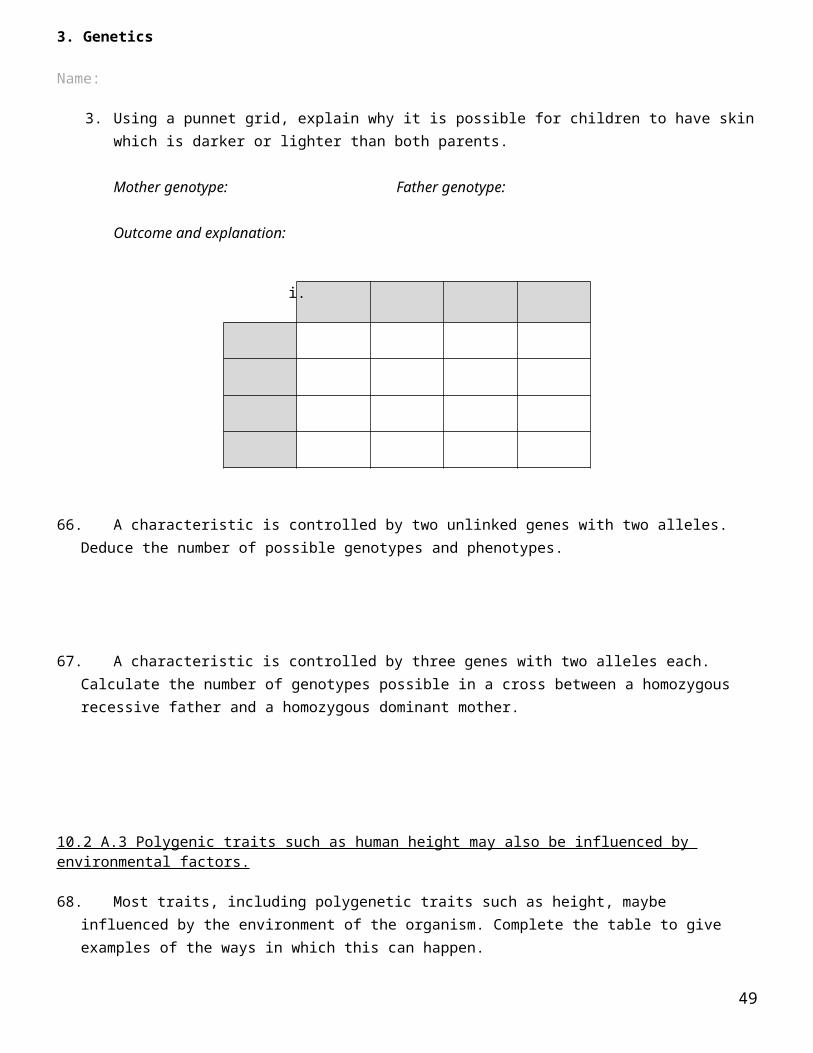
3. Using a punnet grid, explain why it is possible for children to have skin which is darker or lighter than both parents.
Mother genotype: Father genotype:
Outcome and explanation:
i.
66. A characteristic is controlled by two unlinked genes with two alleles. Deduce the number of possible genotypes and phenotypes.
67. A characteristic is controlled by three genes with two alleles each. Calculate the number of genotypes possible in a cross between a homozygous recessive father and a homozygous dominant mother.
10.2 A.3 Polygenic traits such as human height may also be influenced by environmental factors.
68. Most traits, including polygenetic traits such as height, maybe influenced by the environment of the organism. Complete the table to give examples of the ways in which this can happen.
Human Trait Influencing Environment factors
Height
Skin color
34
3. Genetics
Name:
Data analysis
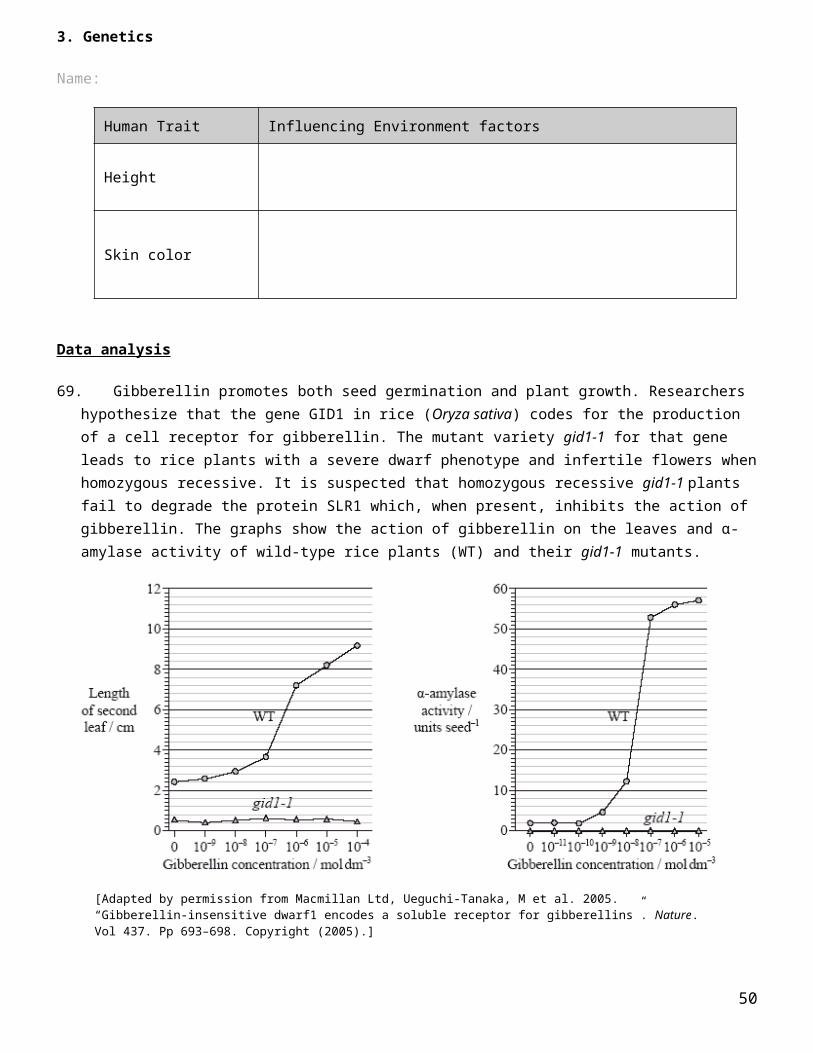
69. Gibberellin promotes both seed germination and plant growth. Researchers hypothesize that the gene GID1 in rice (Oryza sativa) codes for the production of a cell receptor for gibberellin. The mutant variety gid1-1 for that gene leads to rice plants with a severe dwarf phenotype and infertile flowers when homozygous recessive. It is suspected that homozygous recessive gid1-1 plants fail to degrade the protein SLR1 which, when present, inhibits the action of gibberellin. The graphs show the action of gibberellin on the leaves and α-amylase activity of wild-type rice plants (WT) and their gid1-1 mutants.
[Adapted by permission from Macmillan Ltd, Ueguchi-Tanaka, M et al. 2005. “Gibberellin-insensitive dwarf1 encodes a soluble receptor for gibberellins”. Nature. Vol 437. Pp 693–698. Copyright (2005).]
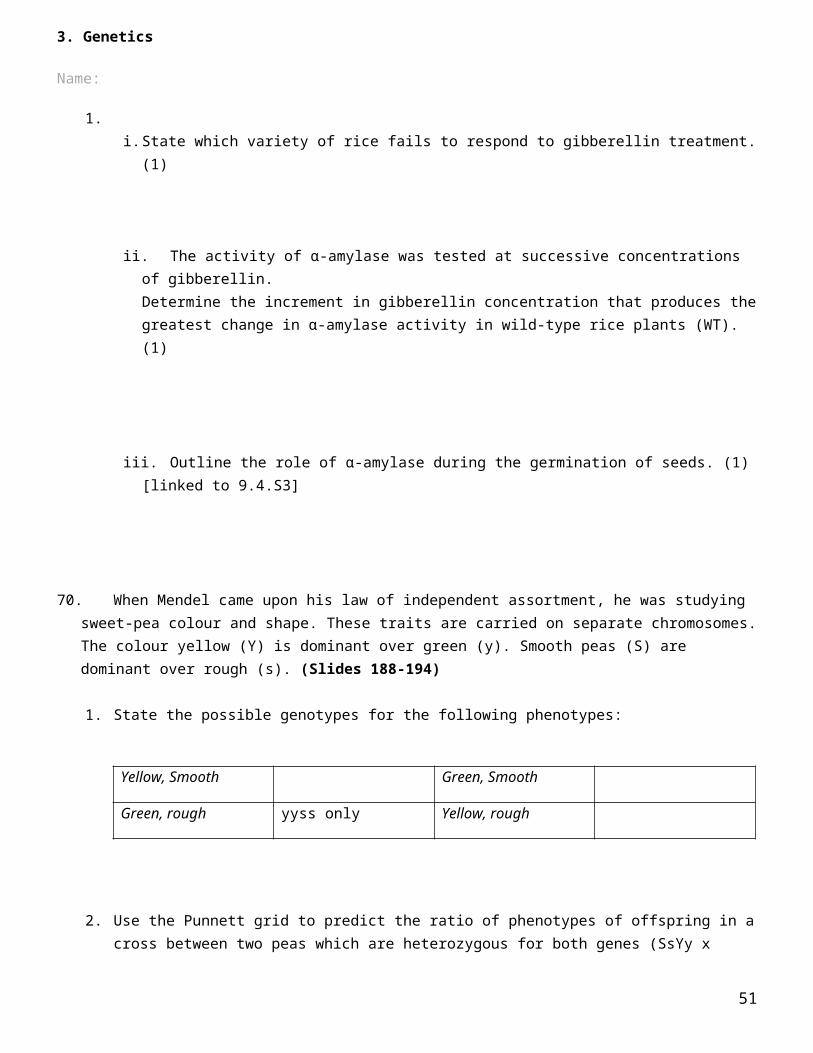
1.
i. State which variety of rice fails to respond to gibberellin treatment. (1)
ii. The activity of α-amylase was tested at successive concentrations of gibberellin.Determine the increment in gibberellin concentration that produces the greatest change in α-amylase activity in wild-type rice plants (WT). (1)
iii. Outline the role of α-amylase during the germination of seeds. (1) [linked to 9.4.S3]
35

3. Genetics
Name:
70. When Mendel came upon his law of independent assortment, he was studying sweet-pea colour and shape. These traits are carried on separate chromosomes. The colour yellow (Y) is dominant over green (y). Smooth peas (S) are dominant over rough (s). (Slides 188-194)
1. State the possible genotypes for the following phenotypes:
Yellow, Smooth Green, Smooth
Green, rough yyss only Yellow, rough
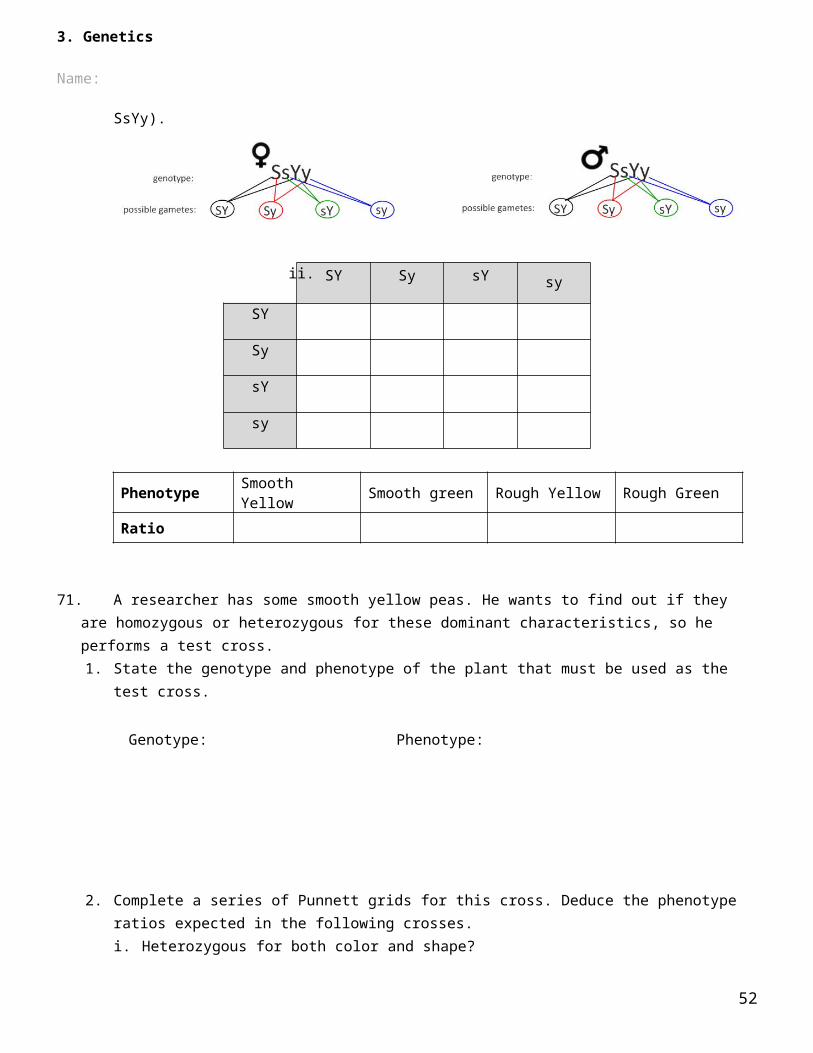
2. Use the Punnett grid to predict the ratio of phenotypes of offspring in a cross between two peas which are heterozygous for both genes (SsYy x SsYy).
ii. SY Sy sY sy
SY
Sy
sY
sy
Phenotype Smooth Yellow Smooth green Rough Yellow Rough Green
Ratio
71. A researcher has some smooth yellow peas. He wants to find out if they are homozygous or heterozygous for these dominant characteristics, so he performs a test cross.1. State the genotype and phenotype of the plant that must be used as the test cross.
Genotype: Phenotype:
36
3. Genetics
Name:
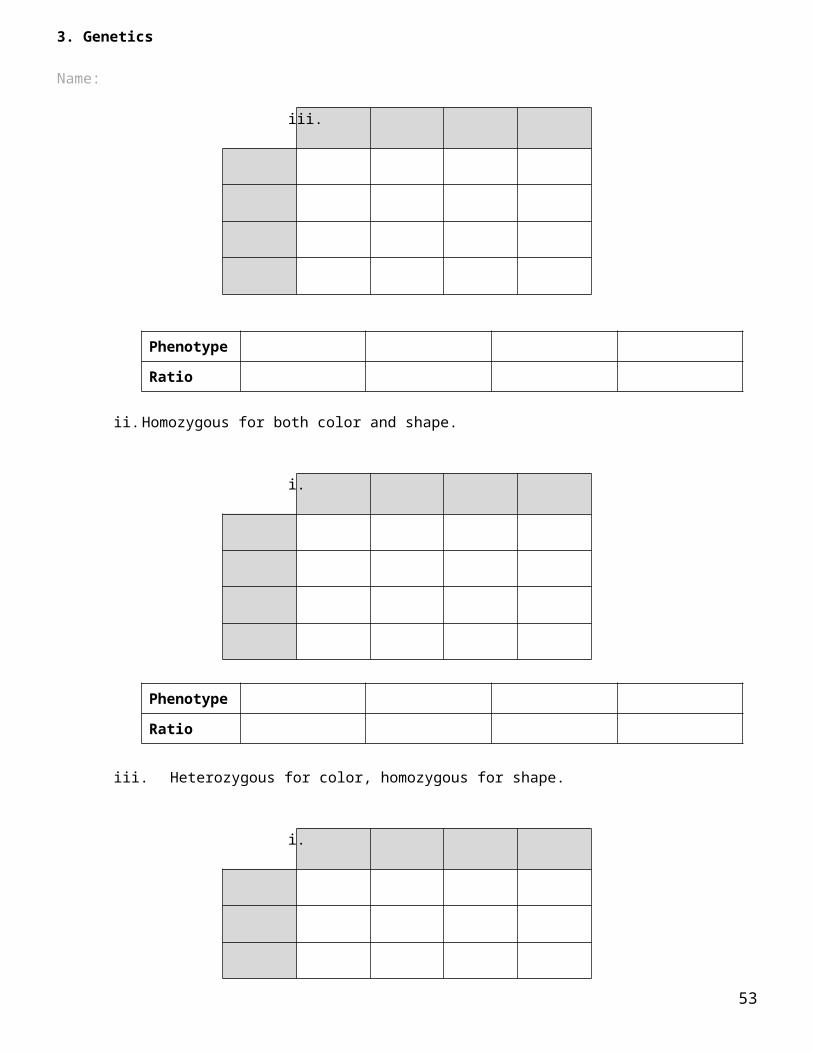
2. Complete a series of Punnett grids for this cross. Deduce the phenotype ratios expected in the following crosses.i. Heterozygous for both color and shape?
iii.
Phenotype
Ratio
ii. Homozygous for both color and shape.
i.
Phenotype
Ratio
iii. Heterozygous for color, homozygous for shape.
i.
37
3. Genetics
Name:
Phenotype
Ratio
iv. Homozygous for color, heterozygous for shape.
i.
Phenotype
Ratio
Nature of science: Looking for patterns, trends and discrepancies - Mendel used observations of the natural world to find and explain patterns and trends. Since then, scientists have looked for discrepancies and asked questions based on further observations to show exceptions to the rules. For example, Morgan discovered non-Mendelian ratios in his experiments with Drosophila. 10.2 A.1 Morgan’s discovery of non-Mendelian ratios in Drosophila.
72. Morgan’s experiments (1909-1914) with fruit flies produced results that could not be explained by Mendel’s work on heredity as it stood. Morgan’s key insight came after breeding a white-eyed male mutant with red eyed female flies. Complete the table to outline his observations and where the explain the conclusion: (slides 217-218)
Observation Deduction – consistent or inconsistent with Mendelian theory?
The 1st generation offspring all had red eyes
38
3. Genetics
Name:
The 2nd generation contained a small number (roughly 25% of flies) with white eyes
However all the white-eyed flies were male
10.2 U.1 Gene loci are said to be linked if on the same chromosome. AND 10.2.S2 Identification of recombinants in crosses involving two linked genes. (Slides 219-226)
73. Mendel’s law of independent assortment makes the assumption that genes for a pair or group of traits are being carried on separate chromosomes, and therefore the presence of one allele in a gamete is not connected to the presence of another. However, with hundreds of genes per chromosome, it is likely that some genes will be physically linked and therefore alleles will be inherited together.1. Define linkage groups.
2. State the consequence of gene linkage in terms of the movement of alleles in anaphase I.
Linkage groups will not …
3. The term linkage is used in various ways in genetics. Distinguish between autosomes and sex chromosomes.
4. Distinguish between gene linkage and sex linkage.
5. The notation shows genes of Zea mays (corn). It is described as “heterozygous at both loci”. These are both traits related to the corn kernels.
Key: C = color, c = no color; W = waxy, w = no wax.
6. Draw some other possible combinations of these linked genes:
Homozygous dominant at both loci
Homozygous recessive at locus 1.
39
3. Genetics
Name:
your choice
7. Complete a punnet grid to show the possible phenotypes produced by a cross between the corn that is heterozygous at both loci. Use correct notations and show your working.
i.
Phenotype
Ratio
8. List the combinations of alleles which are not possible in the cross above (unless recombination takes place at Prophase I).
9. State the stage of meiosis during which crossing over and exchange of alleles can occur.
10. Complete the punnet grid below:
40
3. Genetics
Name:
P L p l
p l PpLl
p l
no recombination with crossing over (recombinants)
10.2 U.5 Chi-squared tests are used to determine whether the difference between an observed and expected frequency distribution is statistically significant. AND 10.2 S.3 Use of a chi-squared test on data from dihybrid crosses. (Slides 227-233)
74. In corn ears there are four main phenotypes: purple and smooth, purple and shrunken, yellow and smooth, yellow and shrunken. You will examine an ear of corn and determine the type of cross and genes responsible for the coloration and texture of the corn kernels and also whether the corn kernel colour and texture follows the expected pattern of dihybrid inheritance. Use the image below to take the sample for your investigation.(activity based on: http://www.biologycorner.com/worksheets/ corn_chi.html )
1. Select five rows on the corn ear to sample for coloration (purple or yellow) and texture (smooth or shrunken) and record your findings in the tables below. The sample used must be the same for both characteristics.
Kernel Colouration
Number of Kernels Kernel Percentage (%)
Purple
Yellow
Total
Kernel Texture
Number of Kernels Kernel Percentage (%)
41
3. Genetics
Name:
Smooth
Shrunken
Total
2. Deduce the probable colouration phenotypes of the parents.
3. Deduce the probable texture phenotypes of the parents.
4. Assuming that purple (P) is dominant to yellow (p) and smooth (S) is dominant to shrunken (s) complete a dihybrid cross between two heterozygous parents and calculate the expected phenotype ratio.
i.
Phenotype
Ratio
5. Using the same five rows as earlier count the phenotypes present and calculate the percentage frequency of each.
Observed phenotype frequency
Number of Kernels Kernel Percentage (%)
Purple and Smooth
Purple and shrunken
yellow and Smooth
yellow and shrunken
42
3. Genetics
Name:
Total
Did you obtain a 9:3:3:1 ratio? To determine if the deviations between expected frequencies and the observed data are due to natural variation or whether the difference is statistically significant use a chi-squared test.
43
3. Genetics
Name:
6. Calculate the chi-squared value using the table below:
Chi-squared calculations
Expected(number of kernels)
Observed(number of kernels)
(Observed – Expected) 2 Expected
Purple and Smooth total x 9/16 =
Purple and shrunken total x 3/16 =
yellow and Smooth total x 3/16 =
yellow and shrunken total x 1/16 =
Total Chi-squared =sum of (O-E)2/E
7. Calculate the degrees of freedom.
df = Number of classes (phenotypes) – 1 =
8. Is the (expected) theory of dihybrid corn kernel colouration and texture inheritance supported by the (observed) data?(is Chi-square value < critical value)
44
df critical values at 5%
1 3.84
2 5.99
3 7.82
4 9.49
5 11.07
3. Genetics
Name:
Understandings, Applications and Skills (This is what you may be assessed on)
Statement Guidance3.5 U.1 Gel electrophoresis is used to separate proteins or
fragments of DNA according to size.3.5 U.2 PCR can be used to amplify small amounts of DNA.
3.5 U.3 DNA profiling involves comparison of DNA.
3.5 U.4 Genetic modification is carried out by gene transfer between species.
3.5 U.5 Clones are groups of genetically identical organisms, derived from a single original parent cell.
3.5 U.6 Many plant species and some animal species have natural methods of cloning.
3.5 U.7 Animals can be cloned at the embryo stage by breaking up the embryo into more than one group of cells.
3.5 U.8 Methods have been developed for cloning adult animals using differentiated cells.
3.5 A.1 Use of DNA profiling in paternity and forensic investigations.
3.5 A.2 Gene transfer to bacteria using plasmids makes use of restriction endonucleases and DNA ligase.
3.5 A.3 Assessment of the potential risks and benefits associated with genetic modification of crops.
3.5 A.4 Production of cloned embryos produced by somatic-cell nuclear transfer.
Dolly can be used as an example of somatic-cell transfer.
3.5 S.1 Design of an experiment to assess one factor affecting the rooting of stem-cuttings.*
A plant species should be chosen for rooting experiments that forms roots readily in water or a solid medium.
3.5 S.2 Analysis of examples of DNA profiles. Students should be able to deduce whether or not a man could be the father of a child from the pattern of bands on a DNA profile.
3.5 S.3 Analysis of data on risks to monarch butterflies of Bt crops.
3.5 U.2 PCR can be used to amplify small amounts of DNA.
75. The polymerase chain reaction (PCR) is used where DNA samples are too small to be useful. (Slides 237-238)1. State the purpose of PCR in labs and investigations.
2. Identify the cellular process which PCR mimics. (Think cell cycle)
45
3. Genetics
Name:
3. State the role of high temperatures in PCR.
4. State the role of complementary base pairing in PCR.
5. Describe why it is called a chain reaction.
3.5 U.1 Gel electrophoresis is used to separate proteins or fragments of DNA according to size. AND 3.5.U3 DNA profiling involves comparison of DNA.
76. State two main uses of DNA profiling by electrophoresis.(Slides 242-244)
77. State the roles of the following components of gel electrophoresis: (239-240)
Component Role
Restriction enzymes
Gel
Electric current
Fluorescent DNA markers
78. Annotate the image below to outline briefly how gel electrophoresis works, including how the size of fragments affects their position on the final gel.
46
3. Genetics
Name:
3.5 A.1 Use of DNA profiling in paternity and forensic investigations.
79. Outline why DNA profiling is useful in forensic investigations. (Slide 244)
80. DNA profiling can exclude certain candidates and give evidence to suggest the most likely father, or mother, of a child. List the circumstances in which DNA profiling is useful to a paternity investigation:
3.5 S.2 Analysis of examples of DNA profiles.
81. Use the gel electrophoresis results below to answer these questions. In this case, a DNA sample was taken from a cigarette found at a crime scene (smoking in a no-smoking zone):
1. State the process used to amplify the small amounts of DNA collected at the crime scene to an amount big enough to be used in DNA profiling.
2. Deduce which criminal, Rob McCarr or Nick Allott, left their cigarette-end at the crime scene. Explain your answer.
Criminal:Explanation:
3. Draw bands to show where the standard fragments would be observed. State the role of the standard fragment.
4. Outline the evidence in the DNA profile that suggests Nick and Rob are related.
47
3. Genetics
Name:
3.5 U.4 Genetic modification is carried out by gene transfer between species. AND 3.5.A2 Gene transfer to bacteria using plasmids makes use of restriction endonucleases and DNA ligase.
82. Genetically modified organisms (GMOs) are created using gene transfer. 1. Outline gene transfer.(Slide 252)
2. Explain how the universality of the genetic code is central to gene transfer applications.(Hint: Think central dogma)
3. Define transgenic organism. (Slide 261)
4. State the role of the following in gene transfer: (slide 255-258)i. Restriction enzymes
ii. E. coli plasmids
iii. Ligase
iv. Vector
5. Annotate the diagram below to outline the process of gene transfer:(Slide 256)
48
3. Genetics
Name:
6. Give four examples of genetically modified (GM) organisms and the effects of their new genes.(Slide 261)
Genetically modified organism New property Advantages
Golden Rice
Salt tolerant tomato plants
Goats producing milk containing
spider silk protein
Human insulin producing bacteria
3.5 A.3 Assessment of the potential risks and benefits associated with genetic modification of crops. AND Nature of science: assessing risks associated with scientific research - scientists attempt to assess the risks associated with genetically modified crops or livestock. (4.8) AND 3.5 S.3 Analysis of data on risks to monarch butterflies of Bt crops. (Slides 260-265)
83. Bt corn is an example of the genetic modification of crop. Bacillus thuringiensis (Bt) is a soil bacterium that produces insecticidal toxins. Genes from Bt have been inserted into maize so GM plants can produce an insecticidal toxin and therefore be resistant to pests, e.g. European Corn Borer.
1. Identify which potential benefits apply when assessing the usefulness of Bt corn and outline how the introduced trait is a benefit.
Potential benefit Applicable to Bt Corn? If so outline the benefit
49
3. Genetics
Name:
2. Assess the risks of using Bt corn by evaluate the evidence for each of the potential risks.
potential risk Evidence and evaluation
Could be toxic to or cause allergic reactions in humans
Transferred genes could mutate after testing
Non-target organisms affected by toxins
Increases resistance to toxin evolves in pestsAccidental release may result in competition with native plant speciesSuper weeds - through cross-breeding the introduced gene could be transferred to wild varieties
Biodiversity reduced – both plant populations by direct competition and animal populations directly and indirectly could be affected
3. Patent laws prevent farmers producing locally suitable varieties. Which reduces the usefulness of GM crops? Explain why this is done.
84. The ecological impact of Bt corn upon monarch butterflies has been studied by scientists.1. Explain why monarch butterflies could be at risk from Bt corn. (Slide 263-265)
50
3. Genetics
Name:
The bar chart (left) shows survival of second to third-instar monarch larvae in a lab study. Three milkweed leaf treatments were conducted: leaves with no pollen (lavender), leaves treated with untransformed corn pollen (blue), and leaves dusted with pollen from Bt corn (black). The mean survival rate is based on the proportion of larvae surviving in five replicates of each treatment (from Losey, H. E., L. S. Rayor, and M. E. Carter. 1999. Transgenic pollen harms monarch larvae. Nature 399: 214, © 1999 Nature Publishing Group www.nature.com). n.b. the error bars represent the standard error from the mean, i.e. the range within which the true mean is likely to be found.
The graphs (right) give the findings from field studies. They show Survival curves for monarch larvae placed in and near Bt and non-Bt corn fields. Survival curve (a) is based on data from Iowa and survival curve (b) is based on data from New York (from Stanley-Horn, D. E. et al. 2001. Assessing the impact of Cry1Ab-expressing corn pollen on monarch butterfly larvae in field studies. Proceedings of the National Academy of Sciences 98: 11931-11936, © 2001 National Academy of Sciences, U.S.A.).
2. Explain why untransformed corn was included in the studies.
To act as a control – eliminate major biotic (predation) and abiotic (weather) impacts and natural mortality.
3. Describe the trends seen in the lab study.
4. Discuss whether there is evidence of Bt corn pollen affecting Monarch caterpillar survival. Are the error bars useful to the discussion?
51
3. Genetics
Name:
5. Describe the trends seen in the field studies.
6. Suggest reasons why Monarch caterpillars’ Bt toxicity is easier to detect in laboratory studies.
Rain/Wind/etc. washes away corn pollen;Dosage/pollen exposure levels variable/lower in the field;Other acceptable suggestions;
7. Evaluate the hypothesis that Bt Corn adversely affects Monarch butterfly populations.
3.5 U.5 Clones are groups of genetically identical organisms, derived from a single original parent cell. AND 3.5 U.6 Many plant species and some animal species have natural methods of cloning. AND 3.5.U7 Animals can be cloned at the embryo stage by breaking up the embryo into more than one group of cells.
85. State the Definition of the term clone.(Slide 269)
86. Complete the table to describe four examples of naturally occurring clones. (Slide 269)
Natural clone example Description
Starfish
Bacteria(Binary fission)
(plant) Runners
(plant) Tubers
87. Natural cloning is rare in animals, but is common in many plant species. Explain why natural cloning is common in plants.(Slide 271)
52
3. Genetics
Name:
88. Outline how embryos can be cloned artificially and explain why this process is of limited use.(Slides 275-278)
3.5 U.8 Methods have been developed for cloning adult animals using differentiated cells. AND 3.5.A4 Production of cloned embryos produced by somatic-cell nuclear transfer. (Slides 280-281)
89. Cloning by somatic-cell nuclear transfer (SCNT) allows the creation of a genetically identical organism through transfer of a differentiated diploid nucleus. 1. State the definition of the term differentiated diploid nucleus.
2. Outline the steps involved in SCNT.
3. Dolly the sheep was the first successful cloning of a mammal from a differentiated somatic cell. Suggest one reason why Dolly died younger than normal, but of an age-related illness.
4. Differentiate between the process of SCNT and therapeutic cloning.
5. Cloning of a whole organism has limited use, but there are many potential uses of uses of therapeutic cloning in medicine. List the uses of therapeutic cloning.
Citations:Allott, Andrew. Biology: Course Companion. S.l.: Oxford UP, 2014. Print.
Taylor, Stephen. "Essential Biology Genetics.docx" Web. 19 Sep. 2015. < http://www.slideshare.net/gurustip/genetic-engineering-and-biotechnology-presentation>.
53