Embed Size (px)
Citation preview
International Competitiveness of Botswana’s beef industry
Tebogo B. Seleka
Pinkie G. KebakileBotswana Institute for Development Policy Analysis
Conference on Policies for Competitive Smallholder Livestock ProductionGaborone, Botswana, 4-6 March 2015
Outline
• Introduction
• Measuring international Competitiveness
• Results
- Against SADC countries
- Against leading beef exporters
• Factors underlying Botswana’s beef industry competitiveness
Introduction
• Beef industry in Botswana plays a key role in the economy.
- It accounts for a large proportion of agricultural value added.
- It is the second leading source of export revenue after minerals.
- It is one of the key sources of livelihood among rural dwellers – as a source of income and employment (including self-employment).
• However;
- Its share of agricultural value added has declined over time.
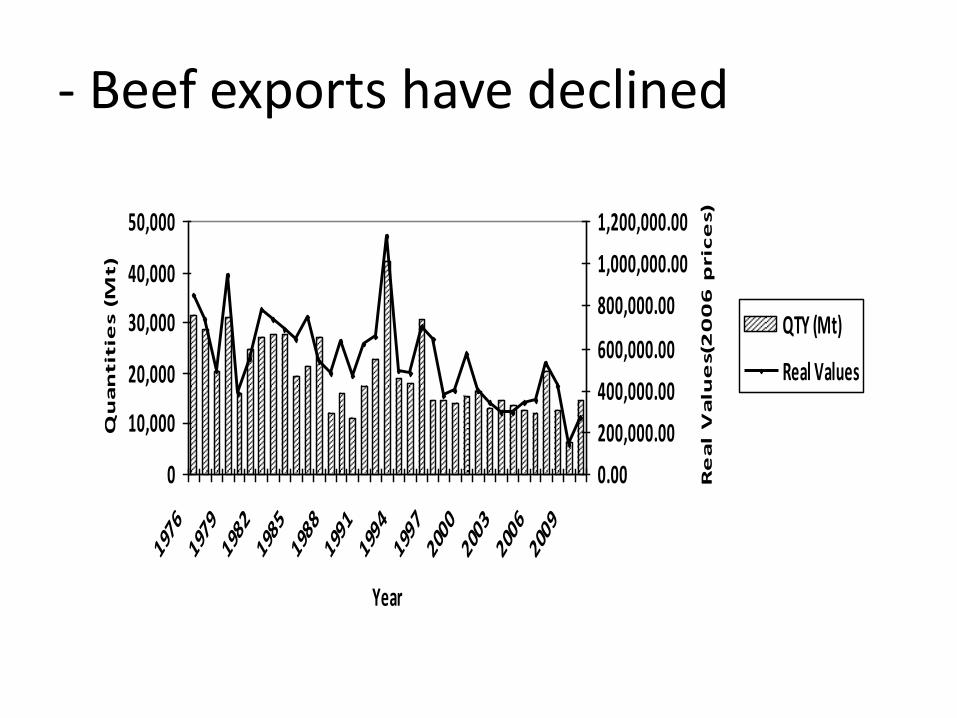
- Beef exports have declined
0
10,000
20,000
30,000
40,000
50,000
1976
1979
1982
1985
1988
1991
1994
1997
2000
2003
2006
2009
Year
Qu
an
tit
ies (
Mt)
0.00
200,000.00
400,000.00
600,000.00
800,000.00
1,000,000.00
1,200,000.00
Re
al
Va
lue
s(2
00
6 p
ric
es)
QTY (Mt)
Real Values
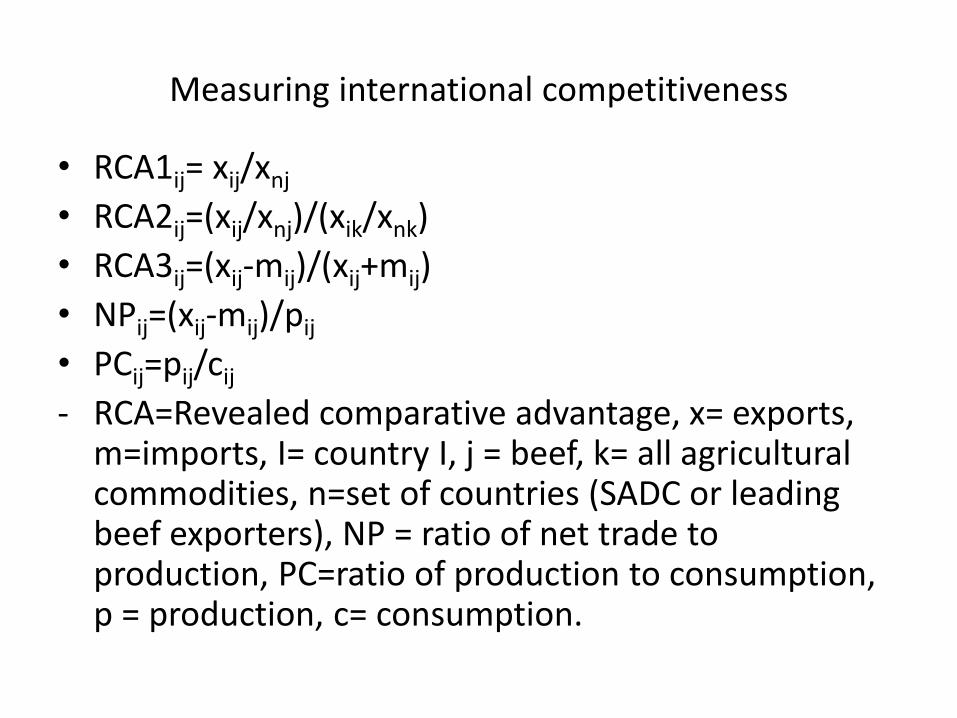
Measuring international competitiveness
• RCA1ij= xij/xnj
• RCA2ij=(xij/xnj)/(xik/xnk)
• RCA3ij=(xij-mij)/(xij+mij)
• NPij=(xij-mij)/pij
• PCij=pij/cij
- RCA=Revealed comparative advantage, x= exports, m=imports, I= country I, j = beef, k= all agricultural commodities, n=set of countries (SADC or leading beef exporters), NP = ratio of net trade to production, PC=ratio of production to consumption, p = production, c= consumption.
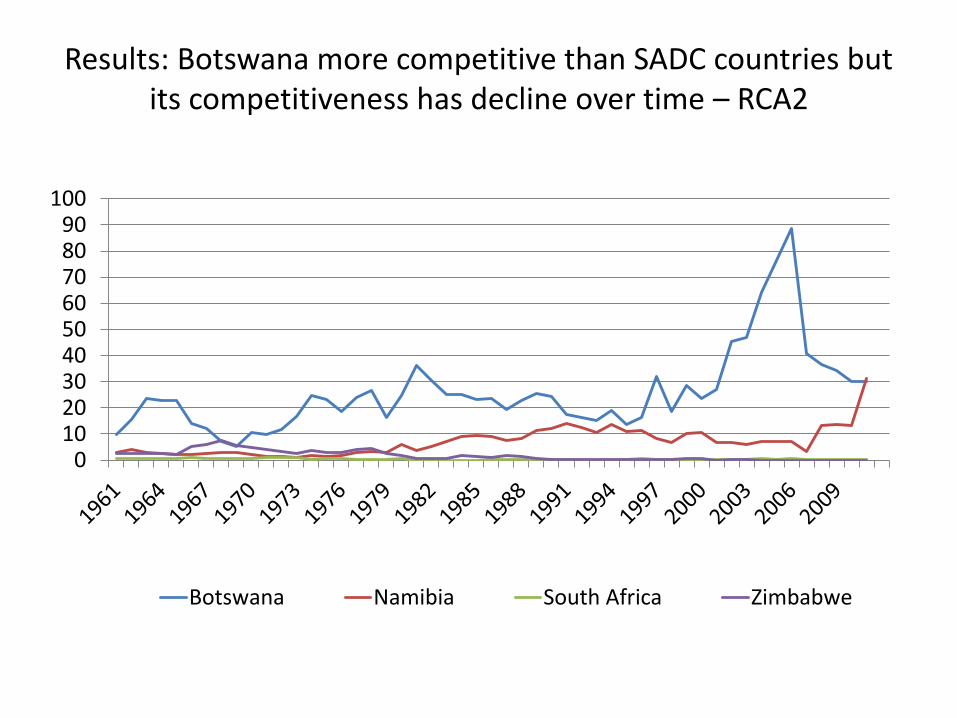
Results: Botswana more competitive than SADC countries but its competitiveness has decline over time – RCA2
0102030405060708090
100
Botswana Namibia South Africa Zimbabwe
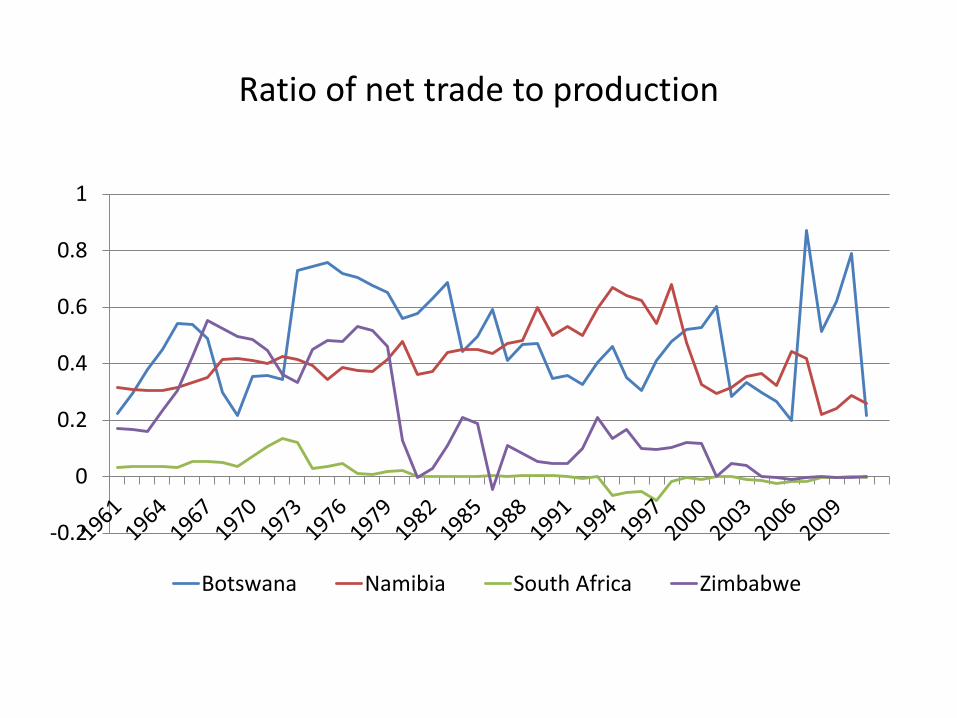
Ratio of net trade to production
-0.2
0
0.2
0.4
0.6
0.8
1
Botswana Namibia South Africa Zimbabwe
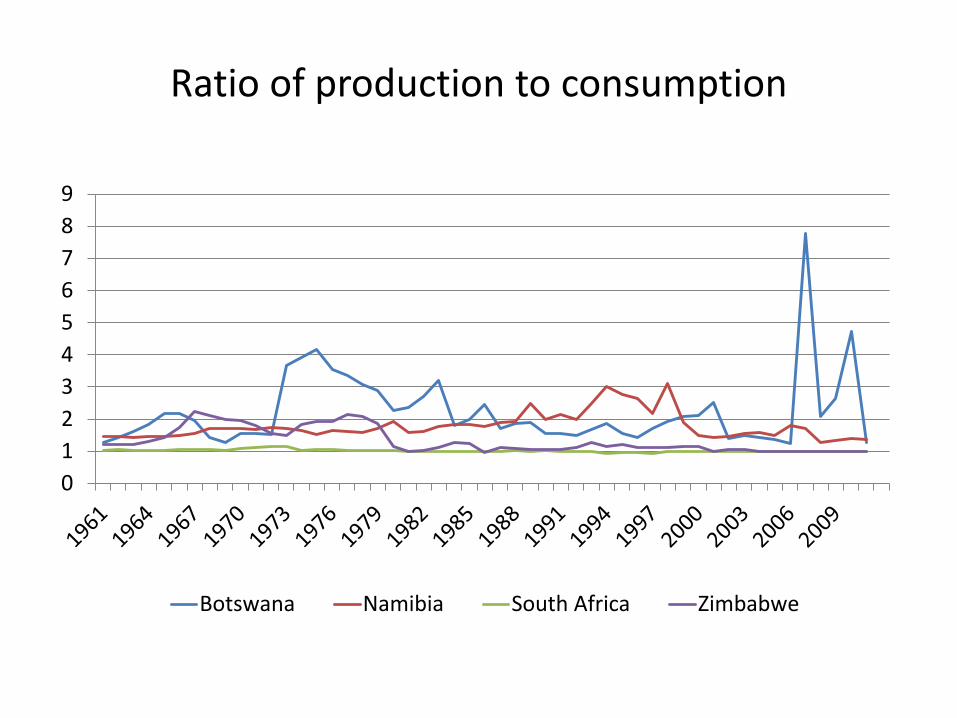
Ratio of production to consumption
0
1
2
3
4
5
6
7
8
9
Botswana Namibia South Africa Zimbabwe
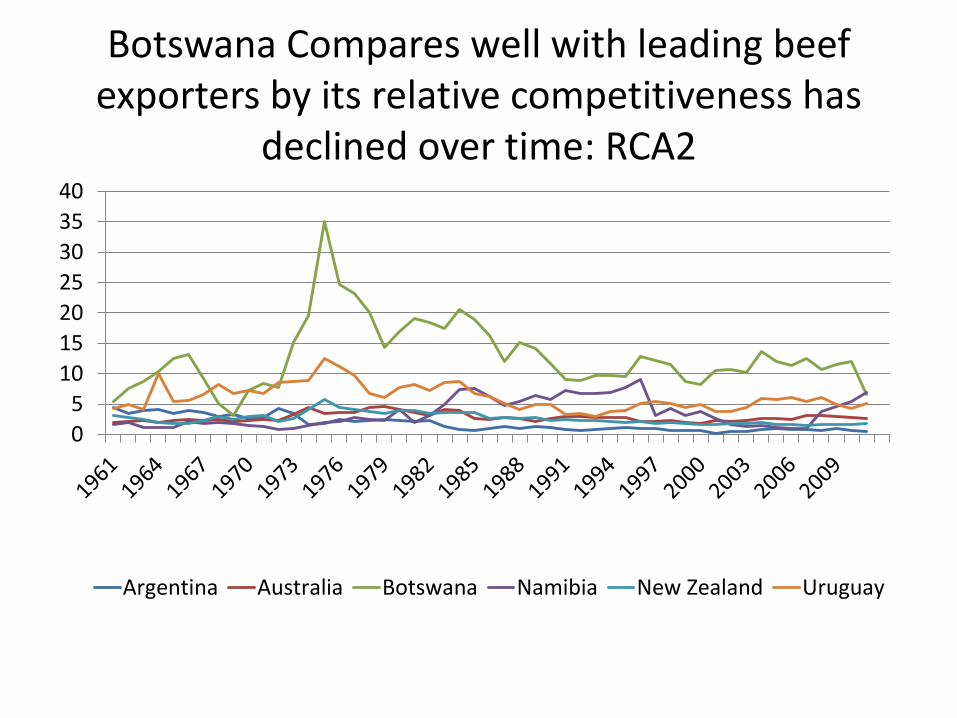
Botswana Compares well with leading beef exporters by its relative competitiveness has
declined over time: RCA2
0
5
10
15
20
25
30
35
40
Argentina Australia Botswana Namibia New Zealand Uruguay
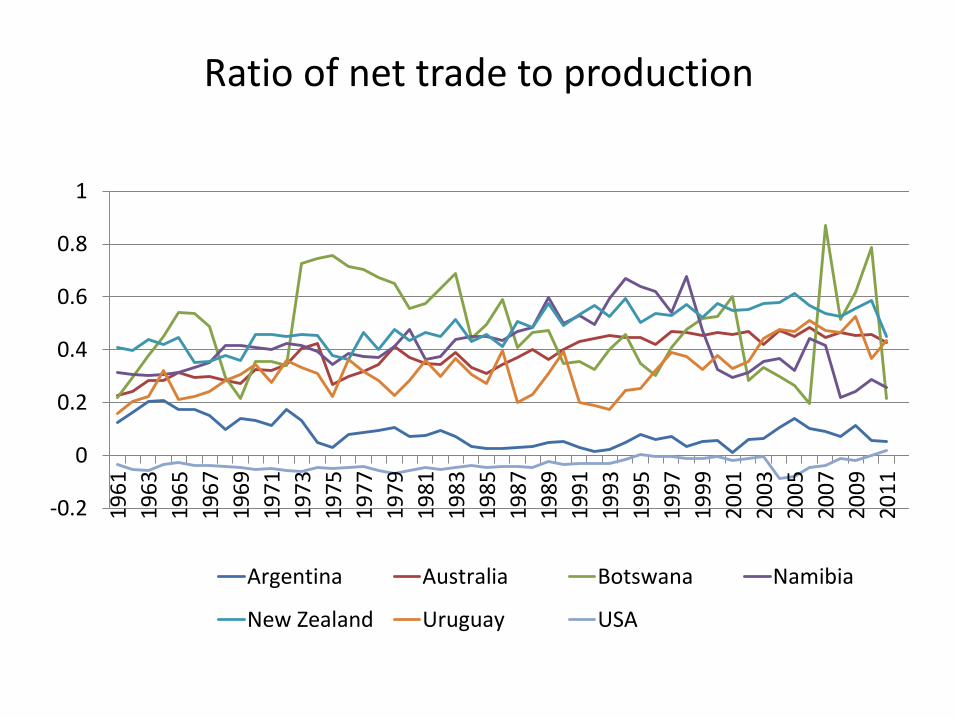
Ratio of net trade to production
-0.2
0
0.2
0.4
0.6
0.8
1
19
61
19
63
19
65
19
67
19
69
19
71
19
73
19
75
19
77
19
79
19
81
19
83
19
85
19
87
19
89
19
91
19
93
19
95
19
97
19
99
20
01
20
03
20
05
20
07
20
09
20
11
Argentina Australia Botswana Namibia
New Zealand Uruguay USA
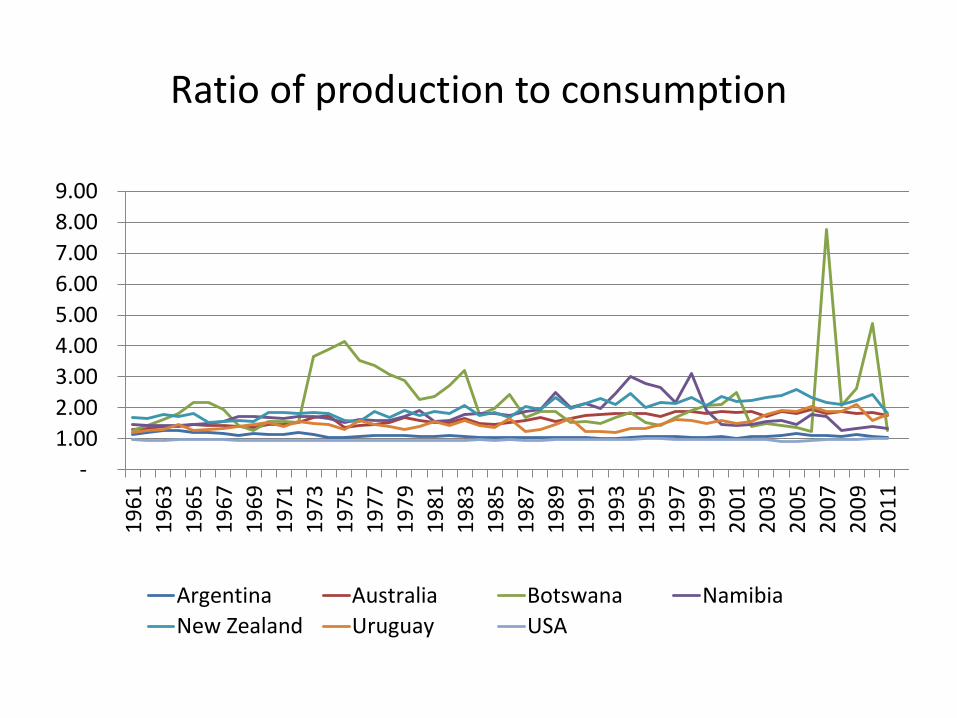
Ratio of production to consumption
-
1.00
2.00
3.00
4.00
5.00
6.00
7.00
8.00
9.00
19
61
19
63
19
65
19
67
19
69
19
71
19
73
19
75
19
77
19
79
19
81
19
83
19
85
19
87
19
89
19
91
19
93
19
95
19
97
19
99
20
01
20
03
20
05
20
07
20
09
20
11
Argentina Australia Botswana Namibia
New Zealand Uruguay USA
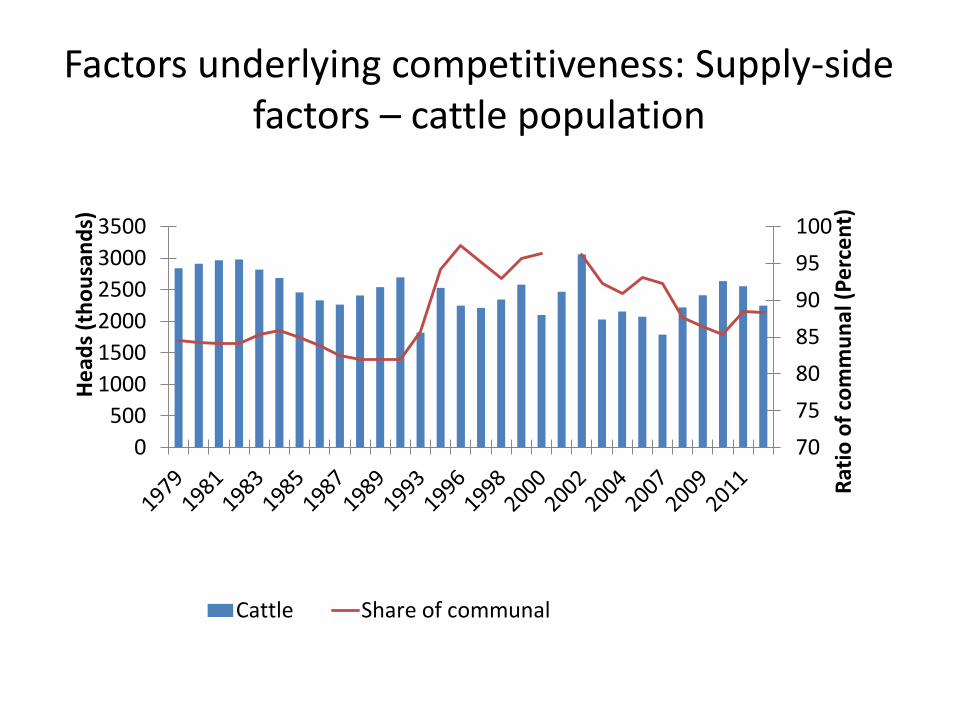
Factors underlying competitiveness: Supply-side factors – cattle population
70
75
80
85
90
95
100
0
500
1000
1500
2000
2500
3000
3500
Rat
io o
f co
mm
un
al (
Pe
rce
nt)
He
ads
(th
ou
san
ds)
Cattle Share of communal
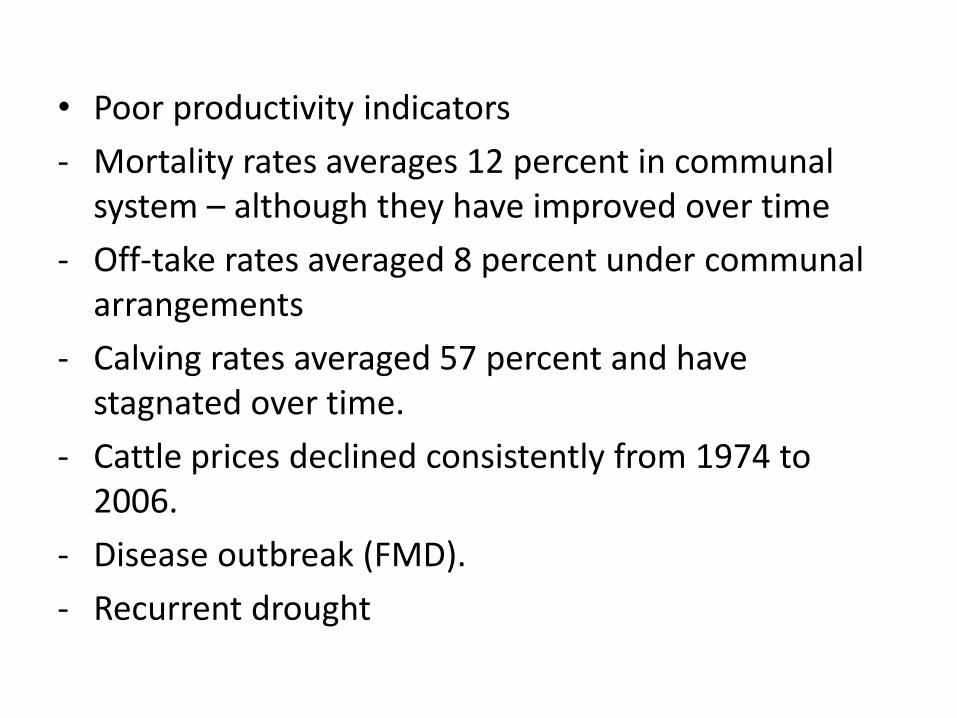
• Poor productivity indicators
- Mortality rates averages 12 percent in communal system – although they have improved over time
- Off-take rates averaged 8 percent under communal arrangements
- Calving rates averaged 57 percent and have stagnated over time.
- Cattle prices declined consistently from 1974 to 2006.
- Disease outbreak (FMD).
- Recurrent drought
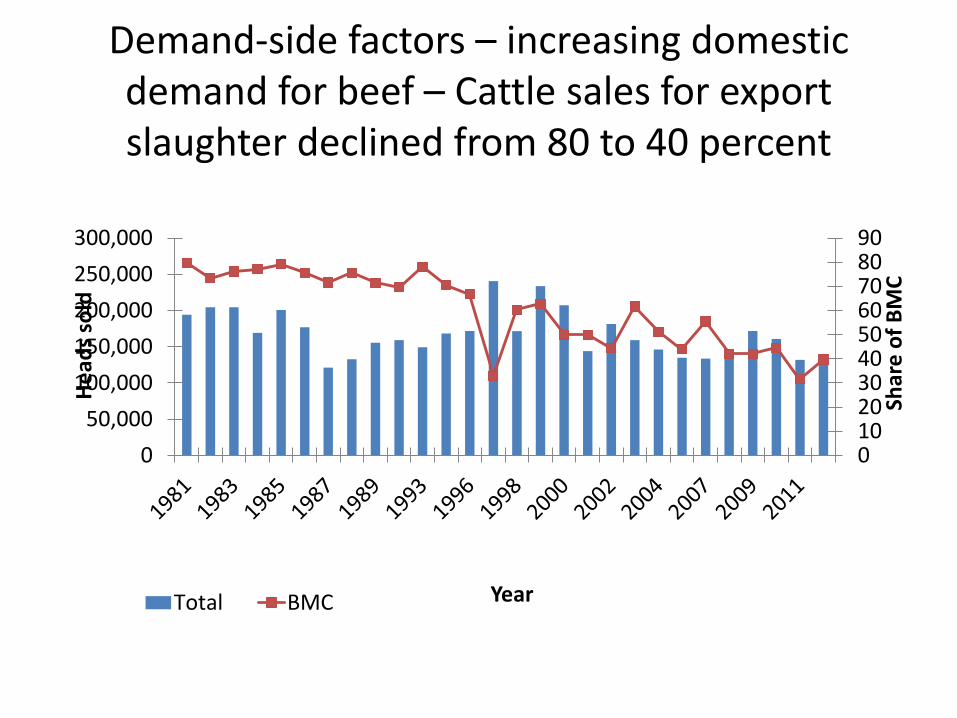
Demand-side factors – increasing domestic demand for beef – Cattle sales for export slaughter declined from 80 to 40 percent
0102030405060708090
0
50,000
100,000
150,000
200,000
250,000
300,000
Shar
e o
f B
MC
He
ads
sold
YearTotal BMC
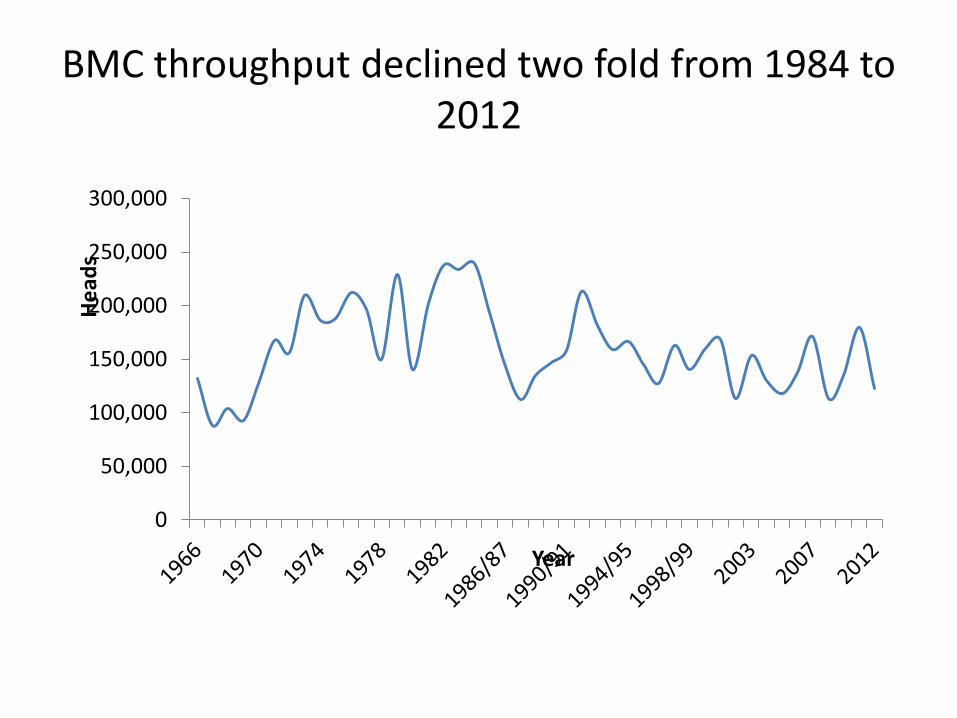
BMC throughput declined two fold from 1984 to 2012
0
50,000
100,000
150,000
200,000
250,000
300,000
He
ads
Year
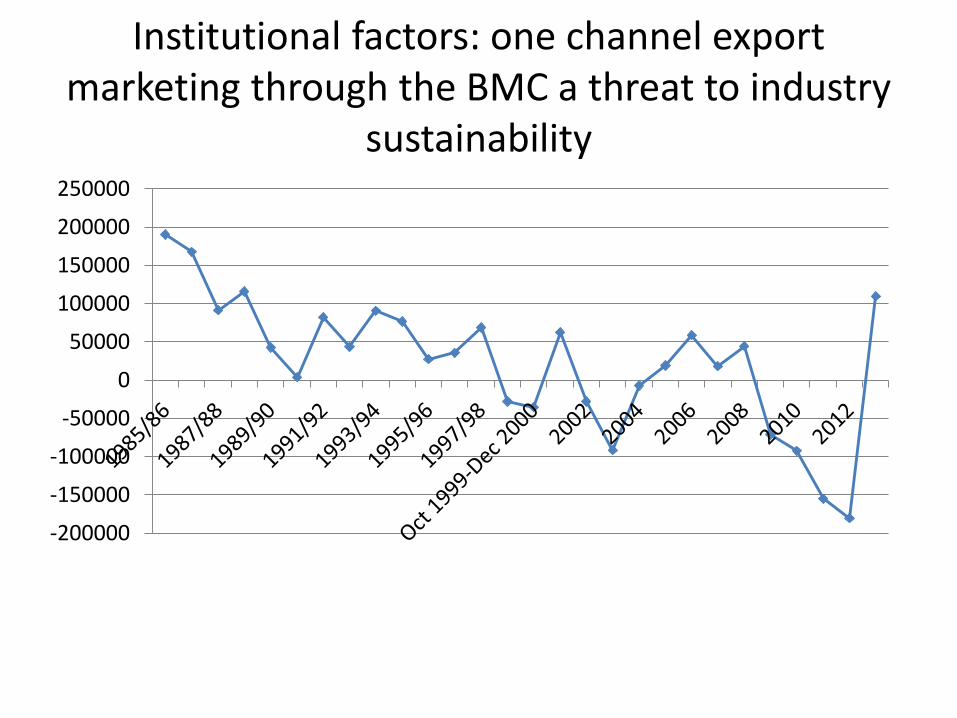
Institutional factors: one channel export marketing through the BMC a threat to industry
sustainability
-200000
-150000
-100000
-50000
0
50000
100000
150000
200000
250000
• Preference erosion in the EU market due to future policy reforms.
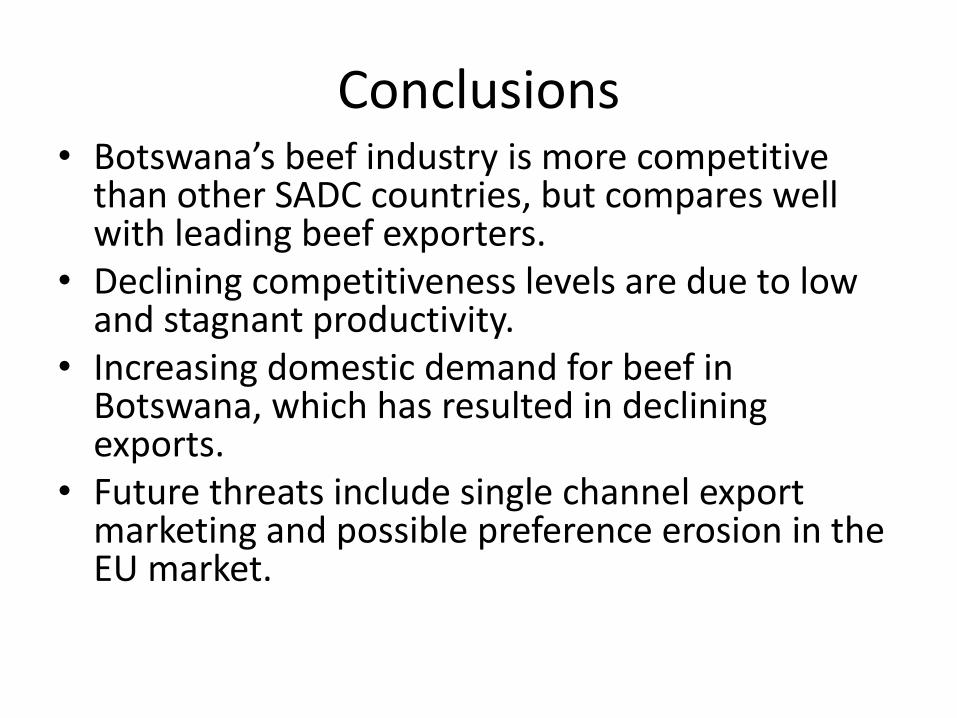
Conclusions• Botswana’s beef industry is more competitive
than other SADC countries, but compares well with leading beef exporters.
• Declining competitiveness levels are due to low and stagnant productivity.
• Increasing domestic demand for beef in Botswana, which has resulted in declining exports.
• Future threats include single channel export marketing and possible preference erosion in the EU market.