Embed Size (px)
Citation preview
MNRAS (2016) doi:10.1093/mnras/stw077
Large-scale mass distribution in the Illustris simulation
M. Haider,1‹ D. Steinhauser,1 M. Vogelsberger,2 S. Genel,3† V. Springel,4,5
P. Torrey2,6 and L. Hernquist71Institute for Astro- and Particle Physics, University of Innsbruck, Technikerstraße 25/8, A-6020 Innsbruck, Austria2Kavli Institute for Astrophysics and Space Research, Massachusetts Institute of Technology, Cambridge, MA 02139, USA3Department of Astronomy, Columbia University, 550 West 120th Street, New York, NY 10027, USA4Heidelberg Institute for Theoretical Studies, Schloss-Wolfsbrunnenweg 35, D-69118 Heidelberg, Germany5Zentrum fur Astronomie der Universitat Heidelberg, Astronomisches Recheninstitut, Monchhofstr. 12-14, D-69120 Heidelberg, Germany6TAPIR, California Institute of Technology, Mailcode 350-17, Pasadena, CA 91125, USA7Harvard-Smithsonian Center for Astrophysics, 60 Garden Street, Cambridge, MA 02138, USA
Accepted 2016 January 8. Received 2015 December 21; in original form 2015 August 6
ABSTRACTObservations at low redshifts thus far fail to account for all of the baryons expected in theUniverse according to cosmological constraints. A large fraction of the baryons presumablyresides in a thin and warm–hot medium between the galaxies, where they are difficult to ob-serve due to their low densities and high temperatures. Cosmological simulations of structureformation can be used to verify this picture and provide quantitative predictions for the distri-bution of mass in different large-scale structure components. Here we study the distributionof baryons and dark matter at different epochs using data from the Illustris simulation. Weidentify regions of different dark matter density with the primary constituents of large-scalestructure, allowing us to measure mass and volume of haloes, filaments and voids. At redshiftzero, we find that 49 per cent of the dark matter and 23 per cent of the baryons are withinhaloes more massive than the resolution limit of 2 × 10⁸ M⊙. The filaments of the cosmicweb host a further 45 per cent of the dark matter and 46 per cent of the baryons. The remaining31 per cent of the baryons reside in voids. The majority of these baryons have been transportedthere through active galactic nuclei feedback. We note that the feedback model of Illustrisis too strong for heavy haloes, therefore it is likely that we are overestimating this amount.Categorizing the baryons according to their density and temperature, we find that 17.8 per centof them are in a condensed state, 21.6 per cent are present as cold, diffuse gas, and 53.9 per centare found in the state of a warm–hot intergalactic medium.
Key words: galaxies: haloes – dark matter – large-scale structure of Universe.
1 IN T RO D U C T I O N
The large-scale structure of the Universe is determined by the dom-inant dark matter, which makes up 26 per cent of today’s mass–energy content of the Universe. As dark matter is not detectable di-rectly, the large-scale structure must be inferred from the baryons.Recent analysis (Planck Collaboration XIII 2015) of the cosmicmicrowave background fluctuations by the Planck mission foundthat baryons amount to !b = 4.8 per cent of the present-day criticaldensity of the Universe. This corresponds to a mean baryon densityof ρb = 4.1 × 10⁻³¹ g cm−3. An independent measurement of thebaryon content of the Universe is possible through the theory of
⋆E-mail: [email protected]†Hubble fellow.
big bang nucleosynthesis, as it allows one to infer the baryon con-tent from the abundance ratio of light elements. The measurementsof the abundance ratio of deuterium to hydrogen (D/H) (Kirkmanet al. 2003) are in very good agreement with the baryon contentderived from the cosmic microwave background fluctuations. Athigher redshifts, the baryons were not fully ionized. This allowstheir detection in denser regions through H I absorption lines in thespectrum of background quasars, the so-called Lyman α (Ly α) for-est. The amount of gas needed to produce the observed absorptionlines in the Ly α forest is in good agreement with the cosmic baryonfraction !b (Weinberg et al. 1997).
At low redshifts, however, observations fail to account for allthe baryons detected at higher redshifts (Fukugita & Peebles 2004;Bregman 2007). While X-ray observations of galaxy clusters dofind baryon contents close to the primordial value (Simionescuet al. 2011), and O VII absorption line measurements at X-ray
C⃝ 2016 The AuthorsPublished by Oxford University Press on behalf of the Royal Astronomical Society
2 M. Haider et al.
energies hint at large reservoirs of hot gas around spiral galax-ies (Gupta et al. 2012), approximately 30 per cent of the baryonsare still not accounted for in the local Universe (Shull, Smith &Danforth 2012). The baryons are not only missing on cosmologicalscales, but the baryon-to-dark matter ratio in galaxies also falls shortof the primordial ratio (Bell et al. 2003; McGaugh et al. 2010).
Based on hydrodynamical simulations (Dave et al. 2001), weexpect that a significant amount of the baryons are hidden in thestate of a thin warm–hot intergalactic medium (WHIM) with tem-peratures between 105 and 107 K. Through H I and O VI surveys(Danforth & Shull 2008), it is possible to probe the colder partsof the low-redshift intergalactic medium. However, the gas is toodiffuse and the temperatures are insufficient to be detectable withthe current generation of X-ray satellites (Kaastra et al. 2013), ex-cept in the densest regions between galaxy clusters (Nicastro et al.2005, 2013). The question of how the baryons are distributed andwhether they follow the filaments of the cosmic web is not wellconstrained observationally, and consequently, cosmological simu-lations of structure formation are important tools for making predic-tions about the large-scale distribution of baryons (Cen & Ostriker1999, 2006; Dave et al. 1999, 2001; Smith et al. 2010). In this paper,we investigate the distribution of baryons and dark matter usingdata from the Illustris simulation (Vogelsberger et al. 2014b). InSection 2, we give a short overview of the simulation and discussthe methods we used. Our results are presented in Section 3. Specif-ically, in 3.1, we investigate the amount of matter inside haloes andcompute the baryon fraction for haloes of different masses. In Sec-tion 3.2, we examine the distribution of matter with respect to thedark matter density. This allows us to decompose the simulationvolume into haloes, filaments and voids, and measure the mass,volume and redshift evolution of these components. In Section 3.3,we look at the distribution of the baryons in the temperature–densityspace and compute the mass fraction and redshift evolution of thecondensed, diffuse, hot and WHIM phases. We discuss the resultsin Section 4 and close with a summary in Section 5.
2 SI M U L ATI O N A N D M E T H O D S
We analyse data from the Illustris simulation, which is a cos-mological hydrodynamics simulation of galaxy formation in a(106.5 Mpc)3 volume [corresponding to a (75 Mpc h−1)3 periodicbox]. The gas and dark matter were evolved using the AREPO moving-mesh code (Springel 2010). In addition to gravity and hydrodynam-ics, the simulation includes subgrid models for star formation, activegalactic nuclei (AGN) feedback and gas cooling [see Vogelsbergeret al. (2013) and Torrey et al. (2014) for details on the implementedfeedback models and the parameter selection]. Dark matter andgas are represented by 18203 resolution elements each, resultingin an initial mass resolution of 1.26× 10⁶ M⊙ for gas and 6.26×10⁶ M⊙ for dark matter. The simulation uses a standard %cold darkmatter model with H = 70.4, !0 = 0.2726, !% = 0.7274 and !b=0.0456. It was started at redshift z = 127 and evolved all the way tothe present epoch. The Illustris simulation produced a galaxy massfunction and a star formation history which are in reasonably goodagreement with observations. Remarkably, it also yielded a realis-tic morphological mix of galaxies. An overview of basic results isgiven in Vogelsberger et al. (2014b), Vogelsberger et al. (2014a)and Genel et al. (2014), and recently, all of the simulation data hasbeen made publicly available (Nelson et al. 2015).
In Section 3.1, we use the halo catalogue of the Illustris sim-ulation, which has been generated using the SUBFIND halo-findingalgorithm (Springel et al. 2001). SUBFIND searches for gravitation-
ally bound overdensities and computes the dark matter, gas andstellar mass which is bound to a halo or subhalo. In the subsequentanalysis, we compute the density fields of gas, stars, baryonic matterand dark matter on a uniform grid with 10243 cells. To this end, thedark matter and gas particles are mapped conservatively to the gridusing smoothed particle hydrodynamics (SPH) kernel technique.For the dark matter, we set the smoothing length to be the radiusof a sphere containing the 64 nearest dark matter particles, as isdone also in SUBFIND. The gas cells are mapped using three timesrc = (3Vcell/4π)1/3, where Vcell is the volume of a Voronoi cell. Thestellar and black hole particles have been mapped using the particlein cell method with a nearest grid point assignment, as they are nottracers of an extended density field. We should note that the densi-ties given in this analysis are thus average densities over the volumeof individual cells, which are 104 kpc on a side.
The baryon densities and temperatures used in Section 3.3 havebeen computed directly from the Voronoi cells of the simulation anddo not involve any additional smoothing. For comparison, we alsouse a variant of the Illustris simulation where cooling, star formationand feedback have been switched off. This simulation, which wewill refer to as non-radiative run, has only half the resolution of thefull physics simulation.
3 R ESULTS
In Section 3.1, we investigate the mass fraction of baryons and darkmatter in haloes and compute the baryon to halo mass ratio. InSection 3.2, we examine the mass distribution with respect to thedark matter density. With the help of cuts in dark matter density,we divide the simulation volume into haloes, filaments and voids.In Section 3.3, we analyse the baryon distribution in temperature–density space.
3.1 Mass in haloes
In Table 1, we give the mass fraction of dark matter and baryonsresiding inside the identified SUBFIND haloes. The mass fractions arecalculated using the mass of all particles which are gravitationallybound to haloes. Only main haloes were considered, with the massof genuine subhaloes being added to their parent halo. The tablealso shows the decomposition of the baryonic mass into gas andstars. We should note that the mass found in haloes depends on theresolution of a simulation, therefore Table 1 only gives the fractionof mass in haloes which can be resolved in the Illustris simulation.The resolution limit in terms of mass is primarily given by themass of a single dark matter particle which is 6.26 × 10⁶ M⊙. Todetect gravitationally bound haloes, a minimum of about 30 particlesare required. Thus, the threshold for halo detection in Illustris isapproximately 2 × 10⁸ M⊙. A resolution study using a run withone-eighth of the mass resolution leads to similar results as the onespresented in Table 1. This suggests that the results are numericallyrobust. How much of the dark matter is expected to reside in haloesbelow the resolution limit also depends on the physical nature ofthe dark matter particle. Angulo & White (2010) find that for a100 GeV neutralino dark matter particle only 5–10 per cent of thedark matter should not be part of a clump at redshift zero, and thatthe most abundant haloes have masses around 10−6 M⊙.
We find that about half of the total dark matter mass in the sim-ulation volume is contained within haloes, while only 21 per centof the baryonic mass resides within haloes. This evidently meansthat in the Illustris simulation, the mass ratio between baryons and
Large-scale mass distribution 3
Table 1. Mass fraction of dark matter and baryons inside haloes at z = 0. The mass fractions are given with respect to thetotal mass inside the simulation volume. The first row shows the fractions for all haloes in the Illustris full physics simulation.The second row gives the mass contribution of haloes with a total mass higher than 5 × 10⁹ M⊙ and the third and fourthrows show the respective values for haloes more massive than 1012 M⊙ and 1013 M⊙, respectively. The last row gives themass fraction for all haloes of the non-radiative Illustris run (no star formation, feedback or cooling).
Per cent of total Per cent of total baryonic mass Per cent of totaldark matter mass baryons gas stars mass
All haloes 50.4 per cent 21.3 per cent 14.7 per cent 6.6 per cent 45.5 per centMtot > 5× 10⁹ M⊙ 44.6 per cent 21.3 per cent 14.7 per cent 6.6 per cent 40.7 per centMtot > 1012 M⊙ 29.3 per cent 9.8 per cent 4.8 per cent 5.0 per cent 26.0 per centMtot > 1013 M⊙ 20.1 per cent 7.2 per cent 4.0 per cent 3.2 per cent 18.0 per centMtot > 1014 M⊙ 11.8 per cent 6.0 per cent 3.7 per cent 2.3 per cent 10.8 per centAll haloes, non-radiative run 49.8 per cent 39.1 per cent – 48.0 per cent
dark matter is on average lower in haloes than the primordial mix-ture, !b/!dm. The latter would be the expected value if baryonstraced dark matter perfectly. The second row of Table 1 shows thatnearly all the halo baryons are in haloes with a total mass higherthan 5× 10⁹ M⊙. Less massive haloes in Illustris consist mainly ofdark matter and are hence truly dark. We should note though thata 109 M⊙ halo is made up of only 160 dark matter particles, andthe results will be less accurate at this scale than for haloes withhigher numbers of particles (Vogelsberger et al. 2014a, see Trentiet al. (2010) for a discussion of the influence of particle numberon the quality of halo properties). For haloes more massive than5 × 109 M⊙, we again see that the baryon/dark matter ratio isonly half of the primordial ratio, and in the mass range between1012 and 1013 M⊙, it drops to about one-third. Towards the mostmassive haloes of cluster size, this rises again to about 50 per centand beyond of the expected primordial value.
Comparing these mass fractions bound in haloes with the resultsof the non-radiative run of the Illustris initial conditions, we findthat the amount of dark matter in haloes is very similar. However,in the non-radiative run, the fraction of baryons in haloes is muchhigher and reaches about 40 per cent, which is roughly double thevalue of the full physics run. As the overall dark matter structureis very similar for the full physics and the non-radiative run, thedifference in baryonic mass is a consequence of the feedback pro-cesses included in the full physics simulation (see also Sections 3.2and 4).
The mass fraction in haloes also depends on the definition of halomass. The values presented in Table 1 are the total gravitationallybound masses. Another common way to define the mass of haloes isto count the mass inside a sphere whose radius is set so that the meanenclosed density equals a reference density. If we measure the massaround the primary haloes of the SUBFIND friend-of-friend groups,and use as a reference density 200 × ρmean (where ρmean denotes themean matter density of the Universe) we find a total mass fractionof 48.1 per cent in haloes. Using the higher reference density 500 ×ρcrit, this value reduces to 26 per cent. We also want to note thatfor high-mass haloes, it makes a difference if the mass includes thecontribution of subhaloes or not. In Illustris, 19.2 per cent of thehaloes are subhaloes. They make up for 13.7 per cent of the totalmass and 29.7 per cent of the stellar mass. Thus, if we neglectedthe contribution of subhaloes, the haloes with a mass higher than1014 M⊙ would be found to host only 4.4 per cent of the total matter,4.9 per cent of the dark matter and 1.9 per cent of the baryons.
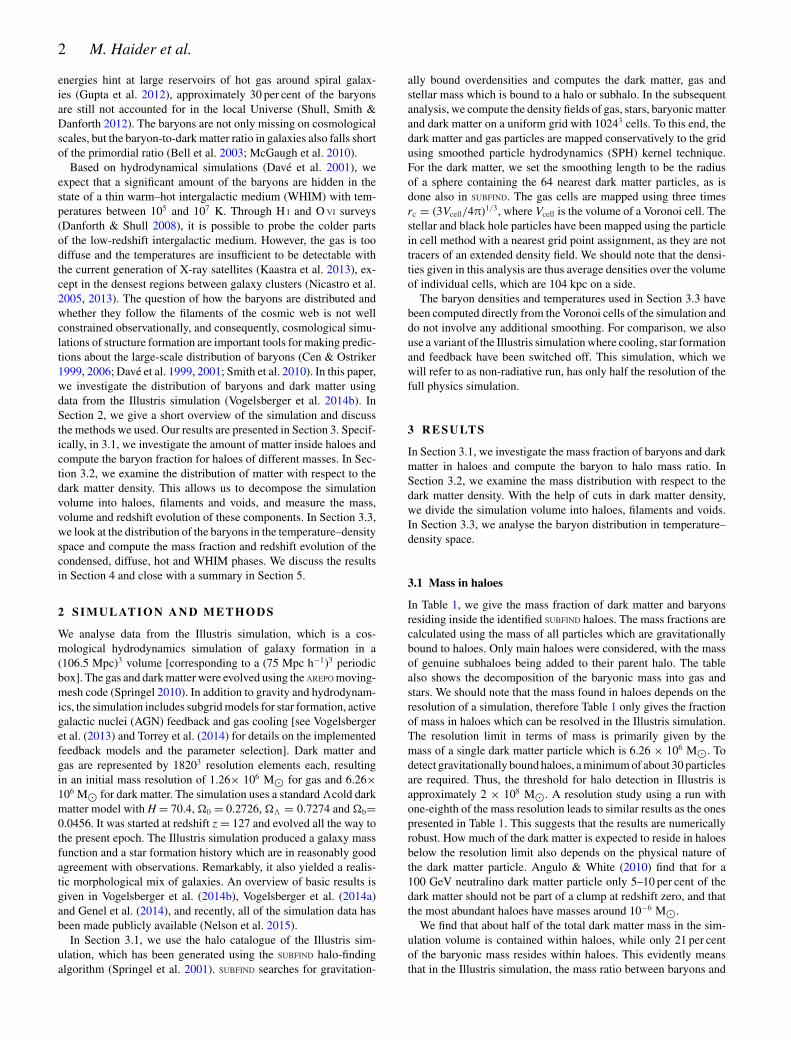
We further illustrate the baryon to dark matter ratio in Fig. 1,where we plot the ratio of the baryon content Mbaryon/Mtotal tothe primordial baryon fraction !b/!0 against the halo mass. Thebaryon fraction is broken down into components of cold gas, hot gas,
Figure 1. Baryon to total matter ratio inside central haloes of the Illustrissimulation divided by the primordial ratio !b/!0 (solid black line). Thex-axis gives the total mass of haloes inside a sphere with a mean density of500 times the critical density. The dashed black line shows the contributionof stars, the solid grey line the contribution of gas warmer than 105 K,the dashed grey line gas colder than 105 K and the dotted grey line theamount of neutral hydrogen. The black squares and grey triangles representobservational data, taken from table 2 of McGaugh et al. (2010).
neutral hydrogen and stars, and the plot includes observational datacompiled by McGaugh et al. (2010) for comparison. Only centralhaloes (those which are not subhaloes) have been used for this plotand only the mass inside R500c (the radius inside of which the meandensity is 500 times the critical density) is taken into account. Aresolution study using data from a run with one-eighth of the massresolution produced results very similar to Fig. 1.
In the regime of galaxy clusters, X-ray observations find a baryonto dark matter ratio between 70 and 100 per cent of the primordialvalue (Vikhlinin et al. 2006). For cluster sized haloes, Illustris finds aratio around 40–50 per cent, but only small clusters are present in thelimited simulations volume. This disagreement with observationshas already been noted (see fig. 10 in Genel et al. 2014) and has beenattributed to a too violent radio-mode AGN feedback model. Theradio-mode feedback model is used when the black hole accretionrates are low. It is most effective at removing gas from the haloes inthe mass range from 1012.5 to 1013.5 M⊙, as at lower halo masses,the black holes are less massive and at higher halo masses, thepotential wells are deeper. The model and the used parametersresult in too large mass outflows from group-sized haloes and poorclusters (see Section 4 for a more detailed discussion of the model).

4 M. Haider et al.
Figure 2. Redshift evolution of the mass inside haloes. The values for darkmatter and baryons are normalized to the total dark matter and baryon massin the simulation volume, respectively. The dashed and dotted grey linesshow the contribution of gas and stars to the baryon fraction.
As a considerable amount of mass is within group-sized haloesand clusters, the results about the distribution of baryons, whichwe present in the following sections, will be affected by the massoutflows.
Between 1010 M⊙ and 1011 M⊙, the baryon fraction is close tothe primordial value !b/!0. In this mass regime, the radio-modeAGN feedback plays only minor role as the black holes are lessmassive. The applied supernova feedback model is removing gasfrom the star-forming phase through galactic winds. However, thevelocity of these winds is lower than the escape velocity and thus thesupernova feedback model does not remove gas from the haloes. Wefind that most of the baryons in this mass range are at relatively lowtemperatures, and a large fraction of the gas is in neutral hydrogen.We should note though, that Illustris does not simulate the effects ofthe stellar radiation field on the gas, and therefore we cannot predictthe ionization state exactly. The baryon fraction we find is higherthan the fraction of detected baryons in McGaugh et al. (2010).However, these observations should be thought of as lower limits.A large fraction of the baryonic content of galaxies is expected toreside within the circumgalactic medium, which is subject to largeobservational uncertainties and is depending on model assumptions.Recent studies (Tumlinson et al. 2013; Bordoloi et al. 2014; Werket al. 2014) suggest that galaxies can have substantial amounts ofcold gas in their circumgalactic medium. In particular, we notethat the baryon fraction we find in Illustris is compatible with theallowed range determined by Werk et al. (2014) (see their fig. 11).The high baryon fraction in this mass range might also be connectedto the finding that the galaxy stellar mass function in Illustris is toohigh for low-mass galaxies (Genel et al. 2014; Vogelsberger et al.2014a). We also recall that AREPO leads to more cooling than SPH-based codes for the same physics implementation (Vogelsbergeret al. 2012).
In Fig. 2, we show the redshift evolution of the fraction of totalmass, dark matter and baryon mass bound inside haloes. We seethat the total mass inside haloes is monotonically increasing withtime, reaching 45.5 per cent at redshift z = 0. Between redshift z
= 2 and 1, the mass gain for the baryonic halo component is lesspronounced than for dark matter, and from redshift z = 1 to 0 thefraction of baryons inside haloes even decreases. The onset of this
decrease coincides with the radio mode AGN feedback becomingimportant (see Sijacki et al. 2015, for the evolution of the black holeaccretion rate in the Illustris simulation). The figure also shows thatthe dominant contribution to the baryonic halo budget is from gasat all redshift. While the fractional contribution of stars to the totalbaryon budget increases with time, it reaches only a final value of6.6 per cent at redshift z = 0.
3.2 Mass distribution in different dark matter densityenvironments
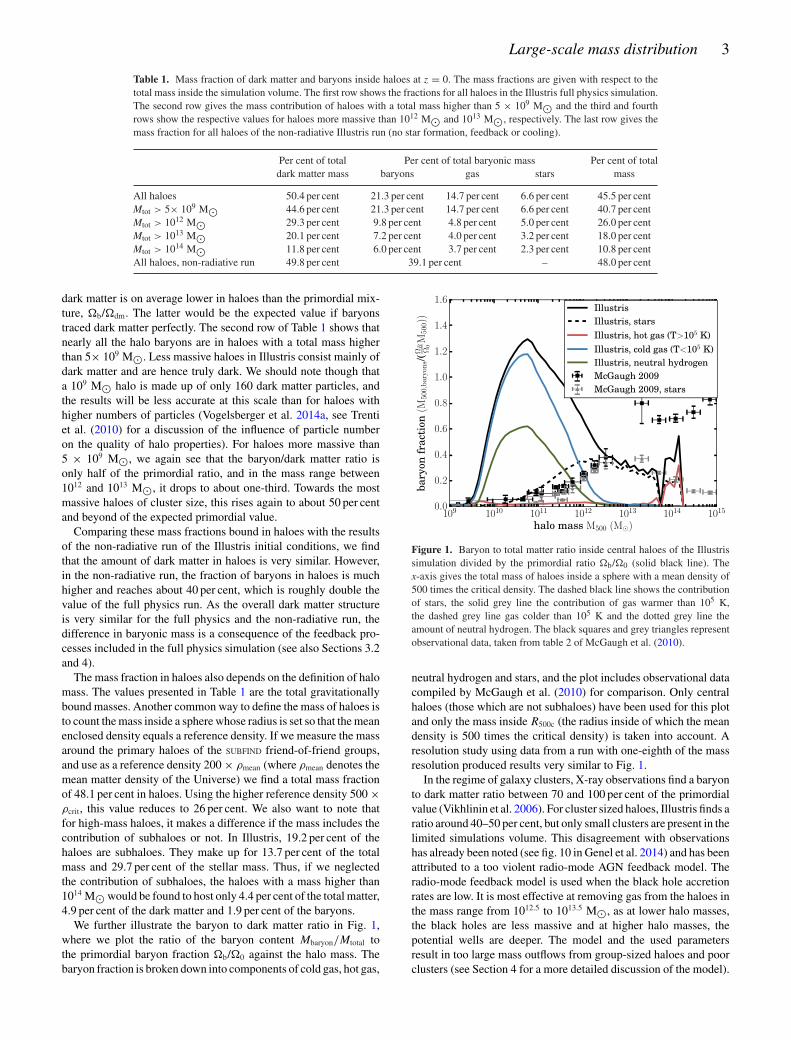
The formation of large-scale structure is dominated by dark matter.Therefore, in this section we analyse the mass distribution withrespect to different dark matter density environments. We computethe dark matter density through mapping the Illustris data on to a(1024)3 grid covering the whole simulation volume. In Fig. 3(a), weshow a plot of the dark matter density and in Fig. 3(b) of the baryondensity in a slice through the simulation at redshift zero. The slicehas an extent corresponding to the full 106.5 × 106.5 Mpc, and athickness of one cell (104 kpc). For both the dark matter and thebaryon slice we use a logarithmic colourmap with a range of 4.5dex. The colourmap boundaries for the baryons have been set anorder of magnitude lower than for the dark matter.
We note that the baryons appear more extended than the darkmatter distribution, especially around high dark matter density re-gions. It is interesting to compare this to Fig. 4, where we showthe corresponding baryon density of the non-radiative run. Clearly,in the absence of feedback, the baryons are tracing the dark matterwell on large scales.
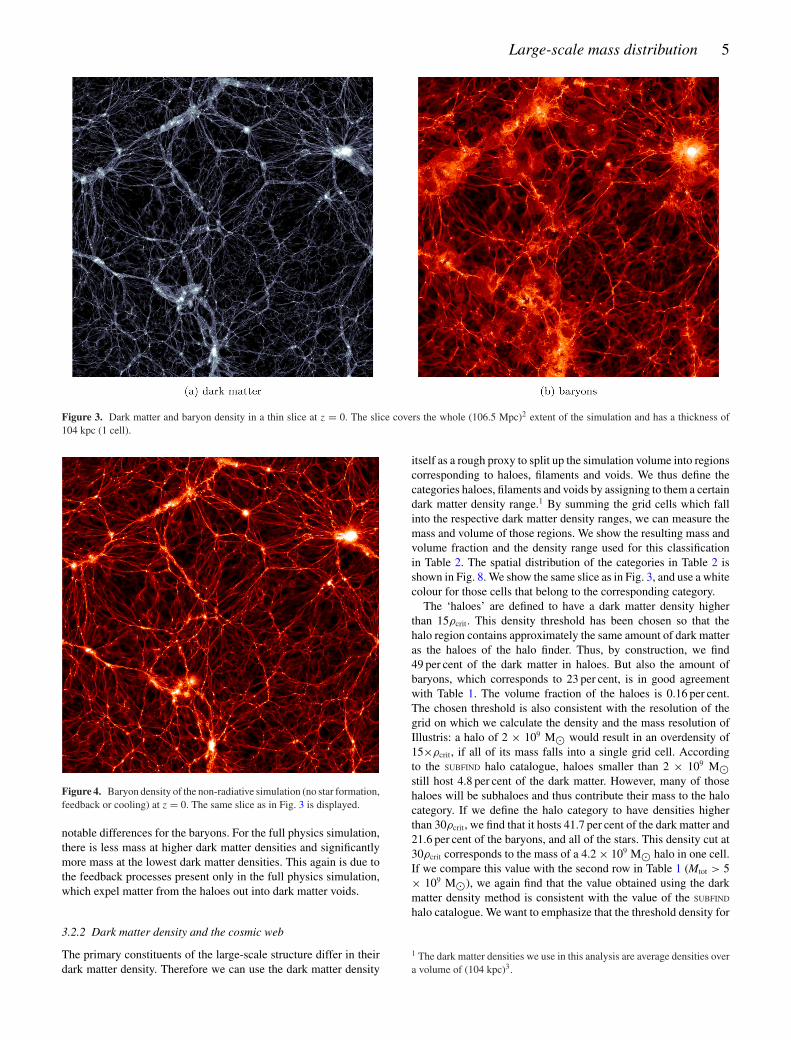
Comparing the baryon distributions at different redshifts (Figs 5and 3), one can see that the extended baryon distributions aroundhigh dark matter density areas are less prominent at z = 0.5 andvirtually absent at z = 2. The diameter of these regions is alsoincreasing from z = 0.5 to 0. We conclude that the extended gasshells originate in gas which has been expelled from their hosthaloes due to radio-mode feedback, which becomes active at lowredshift. A rough estimate from the diameter of these shells atdifferent redshifts suggests that their expansion speed is between500 and 1000 comoving km s−1.
3.2.1 Mass distribution according to dark matter density
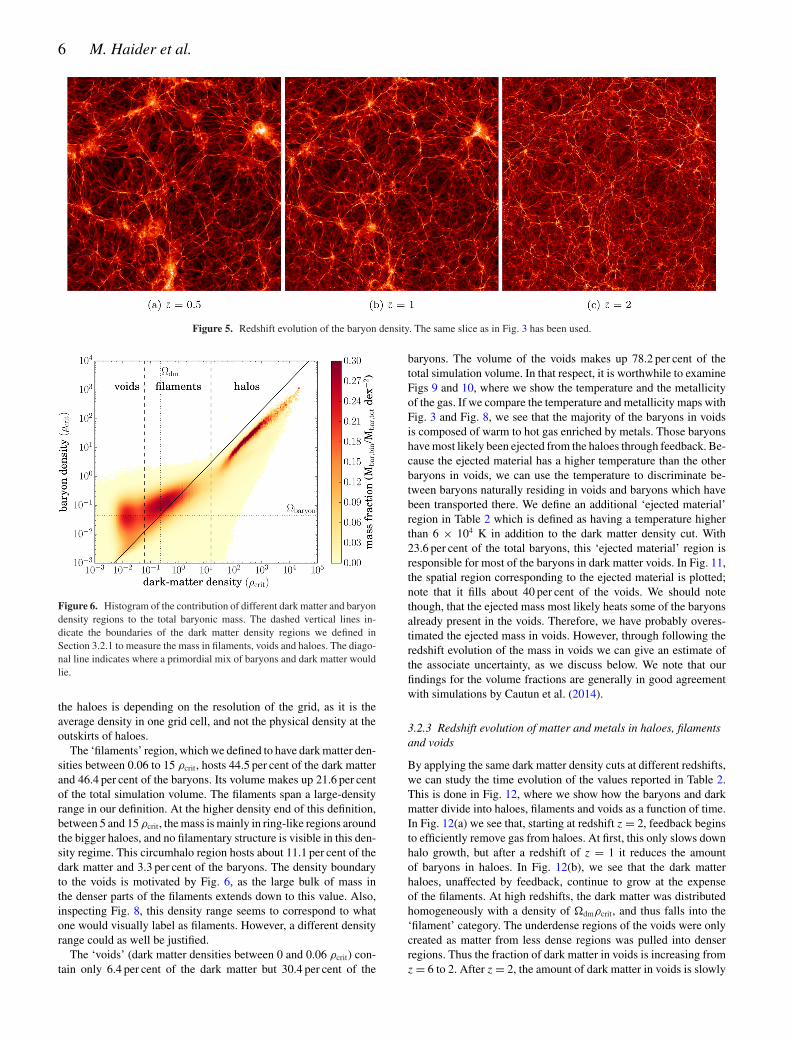
In Fig. 6, we present the fraction of the baryons at a given baryon anddark matter density. We binned the data in baryon and dark matterdensity using 200 × 200 bins. The diagonal line gives !b/!dm×ρdm,which is where the baryons would lie if they traced dark matterperfectly.
The colourmap shows the contribution of a bin to the total baryonmass. We find that there is a significant fraction of mass at highdark matter and high baryon densities, which corresponds to gas inhaloes. A large fraction of baryons is at intermediate dark matterdensities around the primordial dark matter density !dmρcrit. How-ever, there are also many baryons at the lowest dark matter densities,the region we labelled ‘voids’.
It is interesting to observe the differences between the full physicsand the non-radiative runs in Fig. 7, which shows the distributionof mass according to the dark matter density. We binned the datain dark matter density and then measured the mass contributionof a bin to the total baryonic or dark matter mass in the simulationvolume. We see that the dark matter distribution in (b) is very similarfor the full physics and the non-radiative run. However, there are
Large-scale mass distribution 5
Figure 3. Dark matter and baryon density in a thin slice at z = 0. The slice covers the whole (106.5 Mpc)2 extent of the simulation and has a thickness of104 kpc (1 cell).
Figure 4. Baryon density of the non-radiative simulation (no star formation,feedback or cooling) at z = 0. The same slice as in Fig. 3 is displayed.
notable differences for the baryons. For the full physics simulation,there is less mass at higher dark matter densities and significantlymore mass at the lowest dark matter densities. This again is due tothe feedback processes present only in the full physics simulation,which expel matter from the haloes out into dark matter voids.
3.2.2 Dark matter density and the cosmic web
The primary constituents of the large-scale structure differ in theirdark matter density. Therefore we can use the dark matter density
itself as a rough proxy to split up the simulation volume into regionscorresponding to haloes, filaments and voids. We thus define thecategories haloes, filaments and voids by assigning to them a certaindark matter density range.1 By summing the grid cells which fallinto the respective dark matter density ranges, we can measure themass and volume of those regions. We show the resulting mass andvolume fraction and the density range used for this classificationin Table 2. The spatial distribution of the categories in Table 2 isshown in Fig. 8. We show the same slice as in Fig. 3, and use a whitecolour for those cells that belong to the corresponding category.
The ‘haloes’ are defined to have a dark matter density higherthan 15ρcrit. This density threshold has been chosen so that thehalo region contains approximately the same amount of dark matteras the haloes of the halo finder. Thus, by construction, we find49 per cent of the dark matter in haloes. But also the amount ofbaryons, which corresponds to 23 per cent, is in good agreementwith Table 1. The volume fraction of the haloes is 0.16 per cent.The chosen threshold is also consistent with the resolution of thegrid on which we calculate the density and the mass resolution ofIllustris: a halo of 2 × 10⁹ M⊙ would result in an overdensity of15×ρcrit, if all of its mass falls into a single grid cell. Accordingto the SUBFIND halo catalogue, haloes smaller than 2 × 10⁹ M⊙still host 4.8 per cent of the dark matter. However, many of thosehaloes will be subhaloes and thus contribute their mass to the halocategory. If we define the halo category to have densities higherthan 30ρcrit, we find that it hosts 41.7 per cent of the dark matter and21.6 per cent of the baryons, and all of the stars. This density cut at30ρcrit corresponds to the mass of a 4.2 × 10⁹ M⊙ halo in one cell.If we compare this value with the second row in Table 1 (Mtot > 5× 10⁹ M⊙), we again find that the value obtained using the darkmatter density method is consistent with the value of the SUBFIND
halo catalogue. We want to emphasize that the threshold density for
1 The dark matter densities we use in this analysis are average densities overa volume of (104 kpc)3.
6 M. Haider et al.
Figure 5. Redshift evolution of the baryon density. The same slice as in Fig. 3 has been used.
Figure 6. Histogram of the contribution of different dark matter and baryondensity regions to the total baryonic mass. The dashed vertical lines in-dicate the boundaries of the dark matter density regions we defined inSection 3.2.1 to measure the mass in filaments, voids and haloes. The diago-nal line indicates where a primordial mix of baryons and dark matter wouldlie.
the haloes is depending on the resolution of the grid, as it is theaverage density in one grid cell, and not the physical density at theoutskirts of haloes.
The ‘filaments’ region, which we defined to have dark matter den-sities between 0.06 to 15 ρcrit, hosts 44.5 per cent of the dark matterand 46.4 per cent of the baryons. Its volume makes up 21.6 per centof the total simulation volume. The filaments span a large-densityrange in our definition. At the higher density end of this definition,between 5 and 15 ρcrit, the mass is mainly in ring-like regions aroundthe bigger haloes, and no filamentary structure is visible in this den-sity regime. This circumhalo region hosts about 11.1 per cent of thedark matter and 3.3 per cent of the baryons. The density boundaryto the voids is motivated by Fig. 6, as the large bulk of mass inthe denser parts of the filaments extends down to this value. Also,inspecting Fig. 8, this density range seems to correspond to whatone would visually label as filaments. However, a different densityrange could as well be justified.
The ‘voids’ (dark matter densities between 0 and 0.06 ρcrit) con-tain only 6.4 per cent of the dark matter but 30.4 per cent of the
baryons. The volume of the voids makes up 78.2 per cent of thetotal simulation volume. In that respect, it is worthwhile to examineFigs 9 and 10, where we show the temperature and the metallicityof the gas. If we compare the temperature and metallicity maps withFig. 3 and Fig. 8, we see that the majority of the baryons in voidsis composed of warm to hot gas enriched by metals. Those baryonshave most likely been ejected from the haloes through feedback. Be-cause the ejected material has a higher temperature than the otherbaryons in voids, we can use the temperature to discriminate be-tween baryons naturally residing in voids and baryons which havebeen transported there. We define an additional ‘ejected material’region in Table 2 which is defined as having a temperature higherthan 6 × 10⁴ K in addition to the dark matter density cut. With23.6 per cent of the total baryons, this ‘ejected material’ region isresponsible for most of the baryons in dark matter voids. In Fig. 11,the spatial region corresponding to the ejected material is plotted;note that it fills about 40 per cent of the voids. We should notethough, that the ejected mass most likely heats some of the baryonsalready present in the voids. Therefore, we have probably overes-timated the ejected mass in voids. However, through following theredshift evolution of the mass in voids we can give an estimate ofthe associate uncertainty, as we discuss below. We note that ourfindings for the volume fractions are generally in good agreementwith simulations by Cautun et al. (2014).
3.2.3 Redshift evolution of matter and metals in haloes, filamentsand voids
By applying the same dark matter density cuts at different redshifts,we can study the time evolution of the values reported in Table 2.This is done in Fig. 12, where we show how the baryons and darkmatter divide into haloes, filaments and voids as a function of time.In Fig. 12(a) we see that, starting at redshift z = 2, feedback beginsto efficiently remove gas from haloes. At first, this only slows downhalo growth, but after a redshift of z = 1 it reduces the amountof baryons in haloes. In Fig. 12(b), we see that the dark matterhaloes, unaffected by feedback, continue to grow at the expenseof the filaments. At high redshifts, the dark matter was distributedhomogeneously with a density of !dmρcrit, and thus falls into the‘filament’ category. The underdense regions of the voids were onlycreated as matter from less dense regions was pulled into denserregions. Thus the fraction of dark matter in voids is increasing fromz = 6 to 2. After z = 2, the amount of dark matter in voids is slowly
Large-scale mass distribution 7
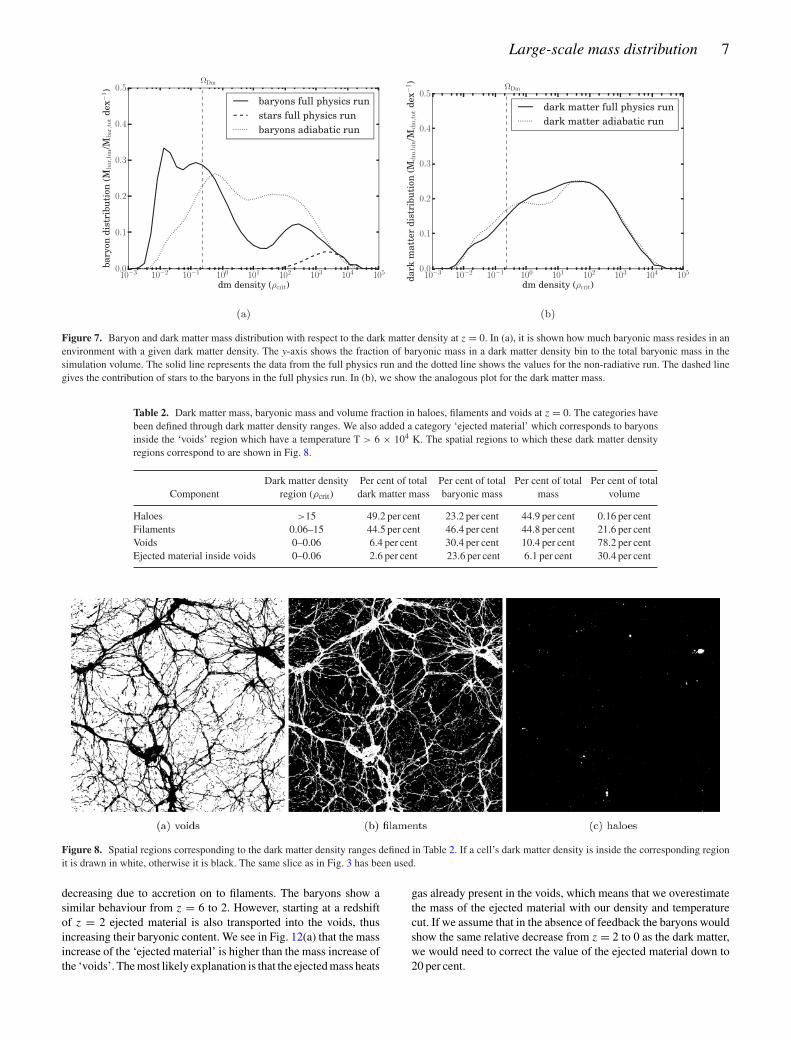
Figure 7. Baryon and dark matter mass distribution with respect to the dark matter density at z = 0. In (a), it is shown how much baryonic mass resides in anenvironment with a given dark matter density. The y-axis shows the fraction of baryonic mass in a dark matter density bin to the total baryonic mass in thesimulation volume. The solid line represents the data from the full physics run and the dotted line shows the values for the non-radiative run. The dashed linegives the contribution of stars to the baryons in the full physics run. In (b), we show the analogous plot for the dark matter mass.
Table 2. Dark matter mass, baryonic mass and volume fraction in haloes, filaments and voids at z = 0. The categories havebeen defined through dark matter density ranges. We also added a category ‘ejected material’ which corresponds to baryonsinside the ‘voids’ region which have a temperature T > 6 × 10⁴ K. The spatial regions to which these dark matter densityregions correspond to are shown in Fig. 8.
Dark matter density Per cent of total Per cent of total Per cent of total Per cent of totalComponent region (ρcrit) dark matter mass baryonic mass mass volume
Haloes >15 49.2 per cent 23.2 per cent 44.9 per cent 0.16 per centFilaments 0.06–15 44.5 per cent 46.4 per cent 44.8 per cent 21.6 per centVoids 0–0.06 6.4 per cent 30.4 per cent 10.4 per cent 78.2 per centEjected material inside voids 0–0.06 2.6 per cent 23.6 per cent 6.1 per cent 30.4 per cent
Figure 8. Spatial regions corresponding to the dark matter density ranges defined in Table 2. If a cell’s dark matter density is inside the corresponding regionit is drawn in white, otherwise it is black. The same slice as in Fig. 3 has been used.
decreasing due to accretion on to filaments. The baryons show asimilar behaviour from z = 6 to 2. However, starting at a redshiftof z = 2 ejected material is also transported into the voids, thusincreasing their baryonic content. We see in Fig. 12(a) that the massincrease of the ‘ejected material’ is higher than the mass increase ofthe ‘voids’. The most likely explanation is that the ejected mass heats
gas already present in the voids, which means that we overestimatethe mass of the ejected material with our density and temperaturecut. If we assume that in the absence of feedback the baryons wouldshow the same relative decrease from z = 2 to 0 as the dark matter,we would need to correct the value of the ejected material down to20 per cent.
8 M. Haider et al.
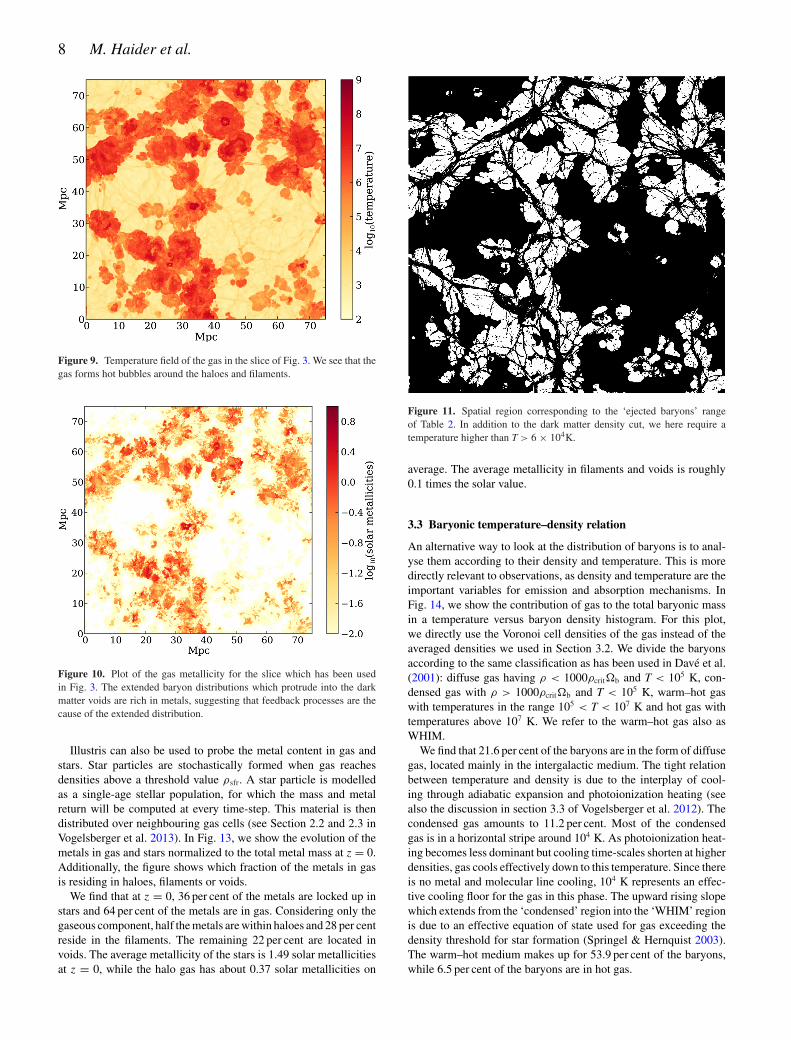
Figure 9. Temperature field of the gas in the slice of Fig. 3. We see that thegas forms hot bubbles around the haloes and filaments.
Figure 10. Plot of the gas metallicity for the slice which has been usedin Fig. 3. The extended baryon distributions which protrude into the darkmatter voids are rich in metals, suggesting that feedback processes are thecause of the extended distribution.
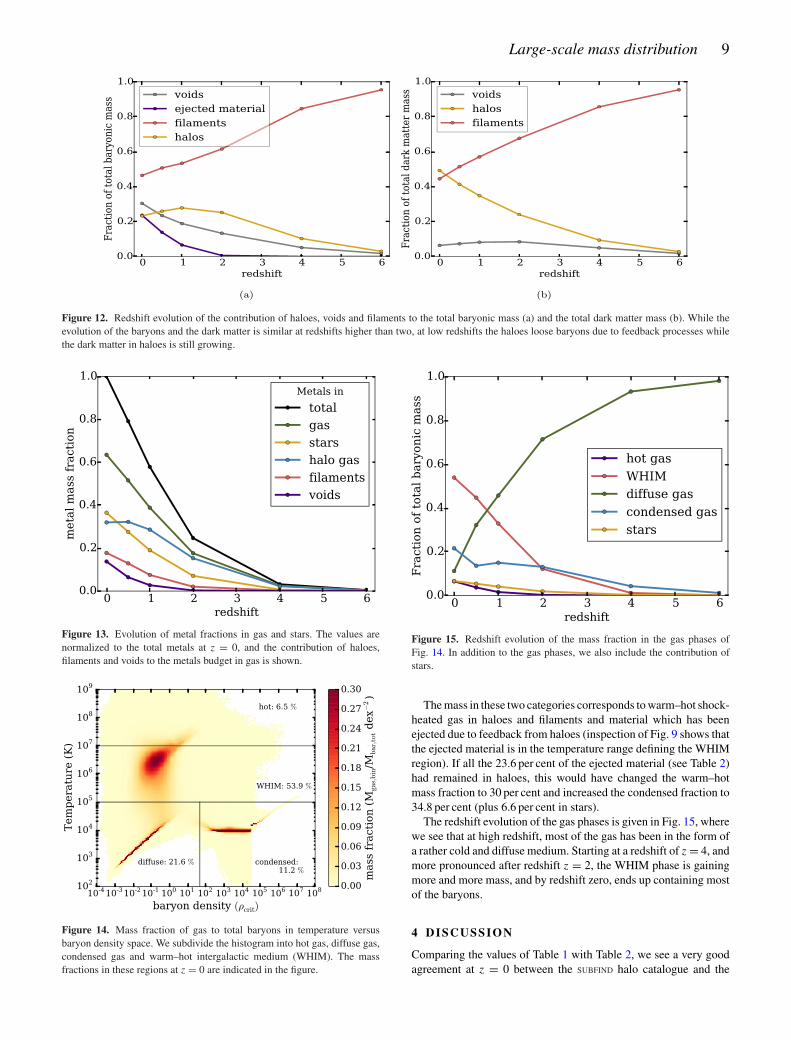
Illustris can also be used to probe the metal content in gas andstars. Star particles are stochastically formed when gas reachesdensities above a threshold value ρsfr. A star particle is modelledas a single-age stellar population, for which the mass and metalreturn will be computed at every time-step. This material is thendistributed over neighbouring gas cells (see Section 2.2 and 2.3 inVogelsberger et al. 2013). In Fig. 13, we show the evolution of themetals in gas and stars normalized to the total metal mass at z = 0.Additionally, the figure shows which fraction of the metals in gasis residing in haloes, filaments or voids.
We find that at z = 0, 36 per cent of the metals are locked up instars and 64 per cent of the metals are in gas. Considering only thegaseous component, half the metals are within haloes and 28 per centreside in the filaments. The remaining 22 per cent are located invoids. The average metallicity of the stars is 1.49 solar metallicitiesat z = 0, while the halo gas has about 0.37 solar metallicities on
Figure 11. Spatial region corresponding to the ‘ejected baryons’ rangeof Table 2. In addition to the dark matter density cut, we here require atemperature higher than T > 6 × 10⁴K.
average. The average metallicity in filaments and voids is roughly0.1 times the solar value.
3.3 Baryonic temperature–density relation
An alternative way to look at the distribution of baryons is to anal-yse them according to their density and temperature. This is moredirectly relevant to observations, as density and temperature are theimportant variables for emission and absorption mechanisms. InFig. 14, we show the contribution of gas to the total baryonic massin a temperature versus baryon density histogram. For this plot,we directly use the Voronoi cell densities of the gas instead of theaveraged densities we used in Section 3.2. We divide the baryonsaccording to the same classification as has been used in Dave et al.(2001): diffuse gas having ρ < 1000ρcrit!b and T < 105 K, con-densed gas with ρ > 1000ρcrit!b and T < 105 K, warm–hot gaswith temperatures in the range 105 < T < 107 K and hot gas withtemperatures above 107 K. We refer to the warm–hot gas also asWHIM.
We find that 21.6 per cent of the baryons are in the form of diffusegas, located mainly in the intergalactic medium. The tight relationbetween temperature and density is due to the interplay of cool-ing through adiabatic expansion and photoionization heating (seealso the discussion in section 3.3 of Vogelsberger et al. 2012). Thecondensed gas amounts to 11.2 per cent. Most of the condensedgas is in a horizontal stripe around 104 K. As photoionization heat-ing becomes less dominant but cooling time-scales shorten at higherdensities, gas cools effectively down to this temperature. Since thereis no metal and molecular line cooling, 104 K represents an effec-tive cooling floor for the gas in this phase. The upward rising slopewhich extends from the ‘condensed’ region into the ‘WHIM’ regionis due to an effective equation of state used for gas exceeding thedensity threshold for star formation (Springel & Hernquist 2003).The warm–hot medium makes up for 53.9 per cent of the baryons,while 6.5 per cent of the baryons are in hot gas.
Large-scale mass distribution 9
Figure 12. Redshift evolution of the contribution of haloes, voids and filaments to the total baryonic mass (a) and the total dark matter mass (b). While theevolution of the baryons and the dark matter is similar at redshifts higher than two, at low redshifts the haloes loose baryons due to feedback processes whilethe dark matter in haloes is still growing.
Figure 13. Evolution of metal fractions in gas and stars. The values arenormalized to the total metals at z = 0, and the contribution of haloes,filaments and voids to the metals budget in gas is shown.
Figure 14. Mass fraction of gas to total baryons in temperature versusbaryon density space. We subdivide the histogram into hot gas, diffuse gas,condensed gas and warm–hot intergalactic medium (WHIM). The massfractions in these regions at z = 0 are indicated in the figure.
Figure 15. Redshift evolution of the mass fraction in the gas phases ofFig. 14. In addition to the gas phases, we also include the contribution ofstars.
The mass in these two categories corresponds to warm–hot shock-heated gas in haloes and filaments and material which has beenejected due to feedback from haloes (inspection of Fig. 9 shows thatthe ejected material is in the temperature range defining the WHIMregion). If all the 23.6 per cent of the ejected material (see Table 2)had remained in haloes, this would have changed the warm–hotmass fraction to 30 per cent and increased the condensed fraction to34.8 per cent (plus 6.6 per cent in stars).
The redshift evolution of the gas phases is given in Fig. 15, wherewe see that at high redshift, most of the gas has been in the form ofa rather cold and diffuse medium. Starting at a redshift of z = 4, andmore pronounced after redshift z = 2, the WHIM phase is gainingmore and more mass, and by redshift zero, ends up containing mostof the baryons.
4 D ISCUSSION
Comparing the values of Table 1 with Table 2, we see a very goodagreement at z = 0 between the SUBFIND halo catalogue and the

10 M. Haider et al.
haloes defined by a dark matter density cut. This suggests thatour method of measuring the mass using the average dark matterdensity in a cell of our grid works reasonably well. However, we seedeviations of 5–7 per cent for the mass in haloes at redshifts higherthan 1. The reason for these deviations is that at higher redshiftsthe haloes are less massive, and thus some fall below the resolutionlimit of our grid.
Using the temperature-baryon density classification in Section3.3, we find that 53.9 per cent of the baryons reside in the WHIMregion. This is higher than the 30–40 per cent found in the work ofDave et al. (2001), or the work of Cen & Ostriker (2006), whoreported between 40 and 50 per cent in the WHIM phase. Thisdiscrepancy is most likely due to the use of different feedbackmodels. The importance of the feedback model is further underlinedby the differences between the full physics and the non-radiativeruns, which produce a nearly identical dark matter distribution butvery different baryon distributions (see Fig. 7). In the full physicsrun, only half the baryons are within haloes compared to the non-radiative simulation (see Table 1). This difference is even moresignificant when we consider that the non-radiative run containsno radiative cooling and therefore the baryons cannot condense aseasily into haloes as in the full physics run.
As stated in Section 3.2.1, it is interesting to note that we find30 per cent of the baryons residing in voids. The reason for this is thestrong radio-mode AGN feedback model, which is expelling bary-onic matter from haloes and is responsible for nearly 80 per cent ofthe baryons ending up in voids. In a recent survey, Shull et al. (2012)find that 30 per cent of the baryons are missing in the low-redshiftUniverse. It would be tempting to explain these missing baryonswith the baryons we find in voids. However, we have to be cautiousin reaching this conclusion, as it is not clear whether the radio-modefeedback model implemented in Illustris is reliable. An indicationthat the feedback model of Illustris is too strong comes from thegas content of massive haloes. Observations of galaxy cluster sizedhaloes find baryon fractions between 70 and 100 per cent of theprimordial value (Vikhlinin et al. 2006). In contrast, we find (seeTable 1) that the Illustris simulation produces a baryon fraction ofonly 50 per cent for haloes more massive than 1014 M⊙. The low-gas content of massive haloes in the simulation has been attributedto the strong AGN radio-mode feedback (Genel et al. 2014). Theradio mode is used when the accretion rate on to a black hole islow, and thus is strongest at low redshifts. Therefore, our results atlow redshifts would most likely change if a weaker AGN feedbackmodel was used.
Do the missing baryons in massive haloes explain the baryonswe find in voids? The 149 haloes with a total mass higher than1013 M⊙ contain 20.1 per cent of the total dark matter but only7.2 per cent of the baryonic mass. Thus, 13 per cent of the totalbaryons are missing in these haloes. It therefore seems that themissing mass cannot explain the full 24 per cent of ejected materialin voids. However, it is possible that material which is pushed outfrom the haloes might remove gas from the filaments. We shouldalso note that the 24 per cent we quote is only the ejected massinside voids. The actually ejected mass might be higher as some ofthe ejected material would still be in the filaments.
Other simulations of structure formation which include AGNfeedback have produced baryon fractions in massive haloes in agree-ment with observations [McCarthy et al. (2011), Le Brun et al.(2014), Schaye et al. (2014), Planelles et al. (2013) or Khandaiet al. (2015)]. It is beyond the scope of this paper to give a detailedcomparison of different approaches. However, as the AGN feed-back has a large impact on our results, we want to highlight some
differences in the models. Most current cosmological simulations,including Illustris, include AGN feedback through modificationsand extensions of the approach introduced in Springel, Di Matteo& Hernquist (2005). There, black holes are seeded when the hostinghalo passes a threshold mass (5 × 10¹⁰ h−1 M⊙ for Illustris), andthen Eddington-limited Bondi–Hoyle accretion is assumed. As theactual accretion region cannot be resolved, and the medium thereis usually a mixture of hot gas and cold clouds, the Bondi–Hoyleaccretion is sometimes enhanced by a factor α, which is invokedto compensate for the lack of resolution. In Illustris, this accretionenhancement parameter is set to α = 100. It is further assumed thata fraction ϵr (set to 0.2 in Illustris) of the rest mass energy of the ac-creted mass is converted into energy, and a fraction of this energy inturn couples to the surrounding material. In Illustris, a modificationof the model by Sijacki et al. (2007) is used, where a distinctionbetween a quasar mode and a radio mode has been introduced. Thequasar mode is assumed to be active if the accretion rate is above5 per cent of the Eddington rate, and the radio mode, is used belowthis threshold. In the quasar mode, a fraction ϵf = 0.05 of the AGNluminosity is coupled thermally to cells around the black hole. Inthe radio mode, the AGN is assumed to inject energy into bubbles,whose radius and distance to the black hole are computed accord-ing to Sijacki et al. (2007). The radio mode is assumed to have ahigher coupling efficiency of ϵm = 0.35. The radio mode bubblesare not formed continuously, but only after the mass of the blackhole increased by a specified value δBH (15 per cent in Illustris).If the fractional mass increase, (M/M surpasses δBH, the energyϵmϵr(Mc2 is put into a bubble. Thus, δBH controls the frequencyand energy of bubbles.
Among the recent hydrodynamical simulations of galaxy forma-tion mentioned above, Illustris is the only simulation which makesa distinction between radio and quasar mode in this way. Planelleset al. (2013) also use different efficiencies for radio and quasarmode, but the energy is coupled to surrounding particles in thesame way for both modes. The model of Booth & Schaye (2009),which is used in McCarthy et al. (2010), Le Brun et al. (2014) andSchaye et al. (2014) does not discern between radio and quasarmode. A further difference between Illustris and Booth & Schaye(2009) is that they use a different accretion model. Instead of a con-stant value for the accretion enhancement, α is set to 1 at low-gasdensities and varies as a power law of density at higher densities (seeBooth & Schaye 2009, for a discussion). In addition to this, Schayeet al. (2014) include a model which can lower the accretion rate inorder to account for the angular momentum of accreting gas (seeRosas-Guevara et al. 2015). Also, they use a radiation efficiency ofϵr = 0.1 and a coupling efficiency of ϵf = 0.15. In order to preventthat the injected energy is cooled away immediately, the feedbackenergy is not emitted continuously, but only once enough energyhas accumulated to lead to a heating (T of 108 K. The energy inthen injected into one particle close to the black hole (or multipleparticles if the energy produced per time-step is high enough to heatseveral particles to 108 K).
There are also differences with respect to the used hydrodynam-ical scheme. Vogelsberger et al. (2012) found that the SPH codeGADGET3 produces higher temperatures in haloes than the moving-mesh code AREPO, which has been employed in Illustris. They arguethat this higher temperature has to do with spurious dissipation inSPH related to the higher numerical noise in this method. This mightpartly explain why the AGN feedback efficiency parameters had tobe set higher in Illustris than in a comparable SPH simulation inorder to reach the same suppression of star formation in massivehaloes. Also, the mass resolution in McCarthy et al. (2010) and
Large-scale mass distribution 11
Le Brun et al. (2014) is very low compared to Illustris, which couldlead to different density estimates at the black hole and thus in-fluence the accretion rates significantly, even if the same accretionmodel was used.
For lower mass haloes, AGN feedback is less important, as lowermass haloes typically have less massive black holes and the AGNluminosity scales with the square of black hole mass. Therefore, atlow to medium masses, the dominant feedback process regulatingstar formation is stellar feedback. A part of the stellar feedback isalready implicitly included through the effective equation of statefor star-forming gas (Springel & Hernquist 2003). In addition to this,Illustris uses a non-local ‘wind’ feedback scheme (see Vogelsbergeret al. 2013), where a part of the star forming gas can be stochasticallyconverted into wind particles. These wind particles are allowed totravel freely for some time (or until a density threshold is reached)before their mass and energy is deposited into the appropriate gascell. Without these feedback processes, galaxies would form toomany stars (the so called overcooling problem). Thus the parametersof this models will also influence the results we presented (especiallythe region below 1012 M⊙ in Fig. 1). The Illustris stellar massfunction is a bit too high in this mass range, suggesting that thefeedback should be more effective in preventing star formation.Similarly, we find a high baryon fraction around unity in thesehaloes. As stated in Section 3, there are substantial observationaluncertainties for the baryon fraction in this mass range, and theobservations we included in Fig. 1 are to be thought of as lowerlimits.
We should caution however that while the feedback of Illustrisis so strong that it depletes the massive haloes of their gas, thestellar mass function of Illustris is still too high for haloes with astellar mass above 1012 M⊙ (see fig. 3 in Genel et al. 2014). Thisindicates that the feedback is not efficient enough in suppressing starformation at this mass scale. Simply tuning the energy parameters ofthe feedback model cannot resolve the tension between the low-gascontent in massive haloes on one hand and the too high stellar massfunction on the other hand. Either the AGN feedback model hasto be modified (Genel et al. 2014, suggests making the duty cyclelonger and thus avoiding short strong bursts) or this is a hint thatother, so far neglected processes are important. It will be interestingto see if improved feedback models, which reproduce the baryonfraction in massive haloes correctly, will continue to find such asignificant amount of baryons in dark matter voids.
5 SU M M A RY
We investigated the global mass distribution of baryons and darkmatter in different structural components of the Illustris simulation.By attributing dark matter density regions to the constituents of thecosmic web, we could measure the mass and volume of haloes,filaments and voids, as summarized in Table 2.
At redshift z = 0, we find that the haloes host 44.9 per cent ofthe total mass, 49.2 per cent of the dark matter and 23.2 per cent ofthe baryons. Their volume fraction amounts to only 0.16 per centof the total simulation volume. The filaments host 44.5 per cent ofthe dark matter and 46.4 per cent of the baryons and correspond to21.6 per cent of the simulation volume. The dark matter voids con-tain 6.4 per cent of the dark matter but 30.4 per cent of the baryons,and the volume fraction of the voids amounts to 78.2 per cent. About80 per cent of the baryons inside voids correspond to gas which hasbeen ejected from haloes due to feedback processes. Most of thismaterial, which occupies one third of the volume of the voids, hasbeen ejected at redshifts lower than z = 1.
An analysis of a comparison run, in which star formation, coolingand feedback had been switched off, showed that the baryons tracedark matter well in a non-radiative model, which is not the casefor the full physics simulation. This demonstrates that the feedbackmodel has significant consequences for the global mass distribution.While the feedback model of Illustris succeeds in reproducing arealistic stellar mass function, the low baryon fraction in massivehaloes suggests that the feedback model is not correctly reproducingtheir gas content. At the moment it is still unclear whether ouranalysis would produce similar results with a different feedbackmodel. Work on improved feedback models is ongoing, and it willbe interesting to clarify this question in future studies based on anext generation of simulation models.
ACK NOW L E DG E ME NT S
MH and DS thank their colleagues at the Institute for Astro- and Par-ticle Physics at the University of Innsbruck for usefull discussions,especially Francine Marleau, Dominic Clancy, Rebecca Habas andMatteo Bianconi. DS acknowledges the research grant from the of-fice of the vice rector for research of the University of Innsbruck(project DB: 194272) and the doctoral school – Computational In-terdisciplinary Modelling FWF DK-plus (W1227). This work wassupported by the Austrian Federal Ministry of Science, Researchand Economy as part of the UniInfrastrukturprogramm of the FocalPoint Scientific Computing at the University of Innsbruck. SG ac-knowledges support provided by NASA through Hubble Fellowshipgrant HST-HF2-51341.001-A awarded by the STScI, which is oper-ated by the Association of Universities for Research in Astronomy,Inc., for NASA, under contract NAS5-26555. VS acknowledgessupport through the European Research Council through ERC-StGgrant EXAGAL-308037.
R E F E R E N C E S
Angulo R. E., White S. D. M., 2010, MNRAS, 401, 1796Bell E. F., McIntosh D. H., Katz N., Weinberg M. D., 2003, ApJ, 585, L117Booth C. M., Schaye J., 2009, MNRAS, 398, 53Bordoloi R. et al., 2014, ApJ, 796, 136Bregman J. N., 2007, ARA&A, 45, 221Cautun M., Van De Weygaert R., Jones B. J. T., Frenk C. S., 2014, MNRAS,
441, 2923Cen R., Ostriker J. P., 1999, ApJ, 514, 1Cen R., Ostriker J. P., 2006, ApJ, 650, 560Danforth C. W., Shull J. M., 2008, ApJ, 679, 194Dave R., Hernquist L., Katz N., Weinberg D. H., 1999, ApJ, 511, 521Dave R. et al., 2001, ApJ, 552, 473Fukugita M., Peebles P. J. E., 2004, ApJ, 616, 643Genel S. et al., 2014, MNRAS, 445, 175Gupta A., Mathur S., Krongold Y., Nicastro F., Galeazzi M., 2012, ApJ, 756,
L8Kaastra J. et al., 2013, preprint (arXiv:1306.2324)Khandai N., Di Matteo T., Croft R., Wilkins S., Feng Y., Tucker E., DeGraf
C., Liu M.-S., 2015, MNRAS, 450, 1349Kirkman D., Tytler D., Suzuki N., O’Meara J. M., Lubin D., 2003, ApJS,
149, 1Le Brun a. M. C., McCarthy I. G., Schaye J., Ponman T. J., 2014, MNRAS,
441, 1270McCarthy I. G. et al., 2010, MNRAS, 406, 822McCarthy I. G., Schaye J., Bower R. G., Ponman T. J., Booth C. M., Vecchia
C. D., Springel V., 2011, MNRAS, 412, 1965McGaugh S. S., Schombert J. M., de Blok W. J. G., Zagursky M. J., 2010,
ApJ, 708, L14Nelson D. et al., 2015, Astron. Comput., 13, 12
12 M. Haider et al.
Nicastro F., Elvis M., Fiore F., Mathur S., 2005, Adv. Space Res., 36, 721Nicastro F. et al., 2013, ApJ, 769, 90Planck Collaboration XIII, 2015, preprint (arXiv:1502.01589)Planelles S., Borgani S., Dolag K., Ettori S., Fabjan D., Murante G.,
Tornatore L., 2013, MNRAS, 431, 1487Rosas-Guevara Y. M. et al., 2015, MNRAS, 454, 1038Schaye J. et al., 2014, MNRAS, 446, 521Shull J. M., Smith B. D., Danforth C. W., 2012, ApJ, 759, 23Sijacki D., Springel V., Di Matteo T., Hernquist L., 2007, MNRAS, 380,
877Sijacki D., Vogelsberger M., Genel S., Springel V., Torrey P., Snyder G. F.,
Nelson D., Hernquist L., 2015, MNRAS, 452, 575Simionescu A. et al., 2011, Science, 331, 1576Smith B. D., Hallman E. J., Shull J. M., O’Shea B. W., 2010, ApJ, 731, 6Springel V., 2010, MNRAS, 401, 791Springel V., Hernquist L., 2003, MNRAS, 339, 289Springel V., White S., Tormen G., Kauffmann G., 2001, MNRAS, 328,
726Springel V., Di Matteo T., Hernquist L., 2005, MNRAS, 361, 776
Torrey P., Vogelsberger M., Genel S., Sijacki D., Springel V., Hernquist L.,2014, MNRAS, 438, 1985
Trenti M., Smith B. D., Hallman E. J., Skillman S. W., Shull J. M., 2010,ApJ, 711, 1198
Tumlinson J. et al., 2013, ApJ, 777, 59Vikhlinin A., Kravtsov A., Forman W., Jones C., Markevitch M., Murray S.
S., Van Speybroeck L., 2006, ApJ, 640, 691Vogelsberger M., Sijacki D., Keres D., Springel V., Hernquist L., 2012,
MNRAS, 425, 3024Vogelsberger M., Genel S., Sijacki D., Torrey P., Springel V., Hernquist L.,
2013, MNRAS, 436, 3031Vogelsberger M. et al., 2014a, MNRAS, 444, 1518Vogelsberger M. et al., 2014b, Nature, 509, 177Weinberg D. H., Miralda-Escude J., Hernquist L., Katz N., 1997, ApJ, 490,
564Werk J. K. et al., 2014, ApJ, 792, 8
This paper has been typeset from a TEX/LATEX file prepared by the author.