Embed Size (px)
Citation preview

K-mers in Metagenomicsby donovan parks
2 of 27
metagenomicsenvironmental
sample
extract and sequence DNA
QC and errorcorrect reads
(K-mers!)
assemble(K-mers!)
bin genomes(K-mers!)
assign taxonomy(and function)
(K-mers!)
refine genomes(K-mers!)
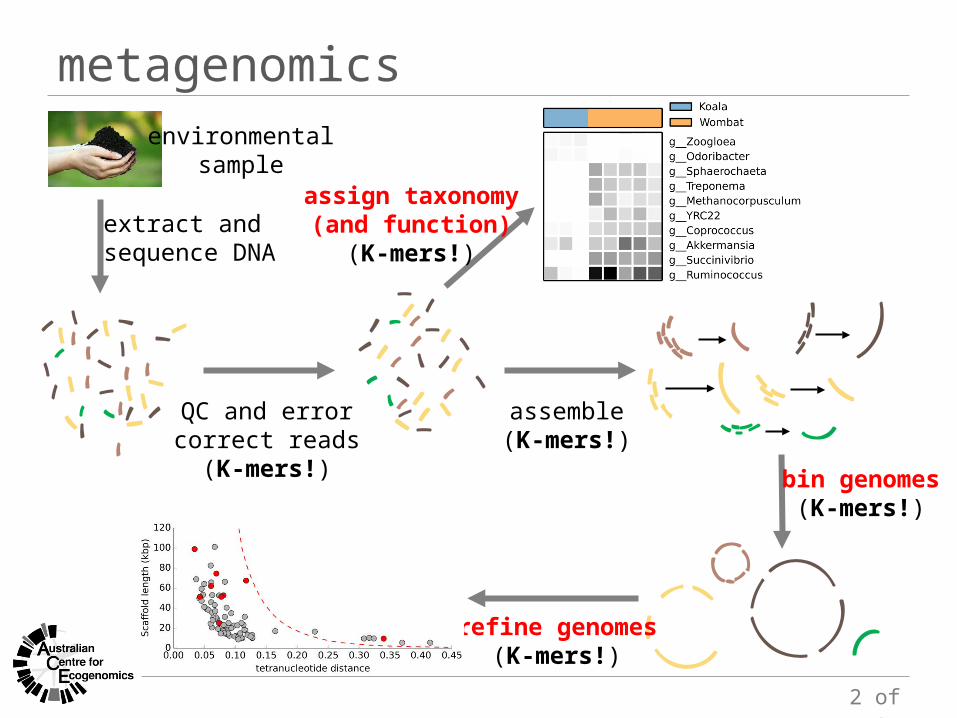
Assigning Taxonomic Labels to Metagenomic DNA Sequences
4 of 27
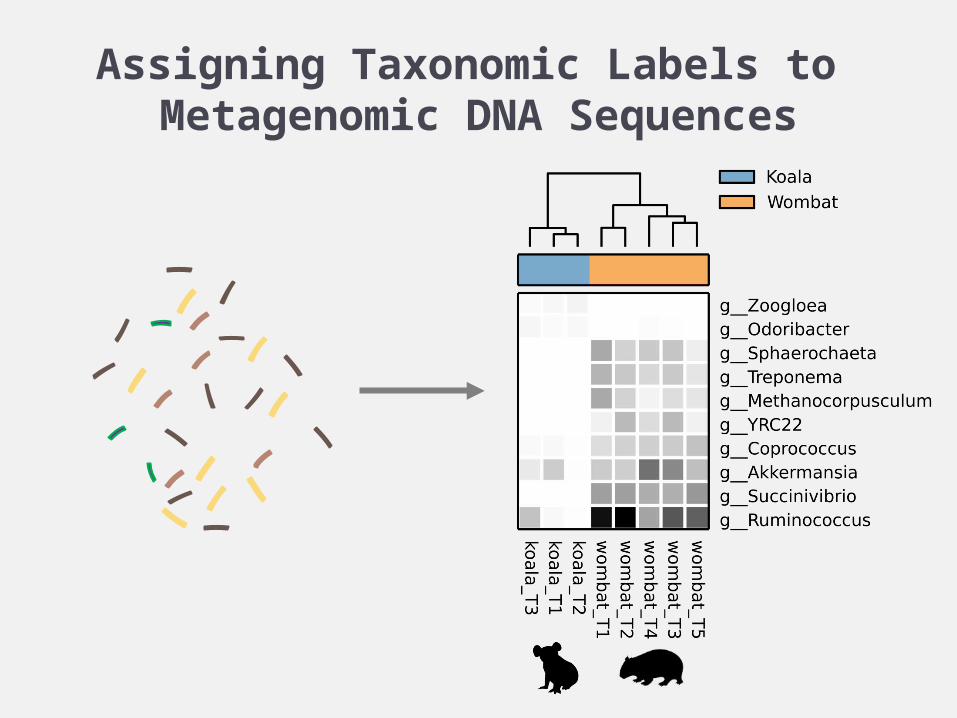
a plethora of approaches Homology: BLAST, MEGAN
Composition: Kraken, CLARK, Naïve Bayes
Hybrid: PhymmBL, FCP, PhyloPythia
Phylogenetic: Treephyler, AMPHORA, GraftM
Marker genes: 16S profiling, MetaPhlAn, PhyloSift
class
ify a
ll re
ads
class
ify
subs
et

5 of 27
exploiting genomic (K-mer) signatures PhymmBL (K≤8): interpolated Markov model
PhyloPythia (K ≈6): multiclass support vector machine
Naïve Bayes (K ≈15): probability of observing a K-mer
Kraken (K ≈31): exact K-mer matching
CLARK (K ≈31): exact matching of discriminative K-mers
dens
e pr
ofile
ssp
arse
pro
files
6 of 27
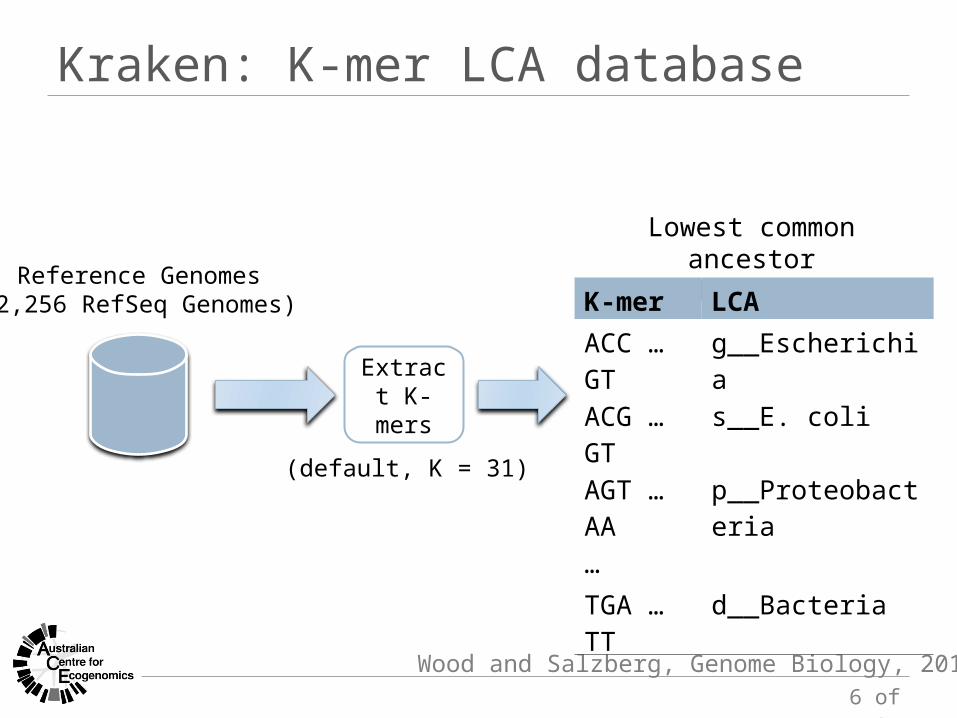
Kraken: K-mer LCA database
Wood and Salzberg, Genome Biology, 2014
Reference Genomes(2,256 RefSeq Genomes)
Lowest common ancestordatabase
K-mer LCAACC … GT g__EscherichiaACG … GT s__E. coliAGT … AA p__Proteobacteria…TGA … TT d__Bacteria
Extract K-mers
(default, K = 31)
7 of 27
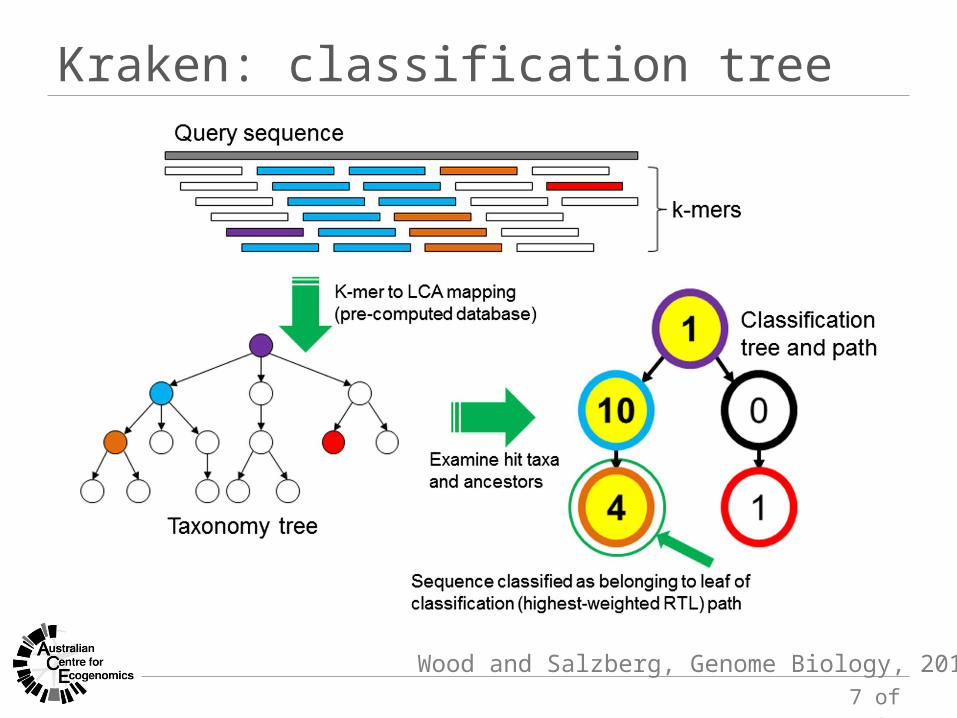
Kraken: classification tree
Wood and Salzberg, Genome Biology, 2014
8 of 27
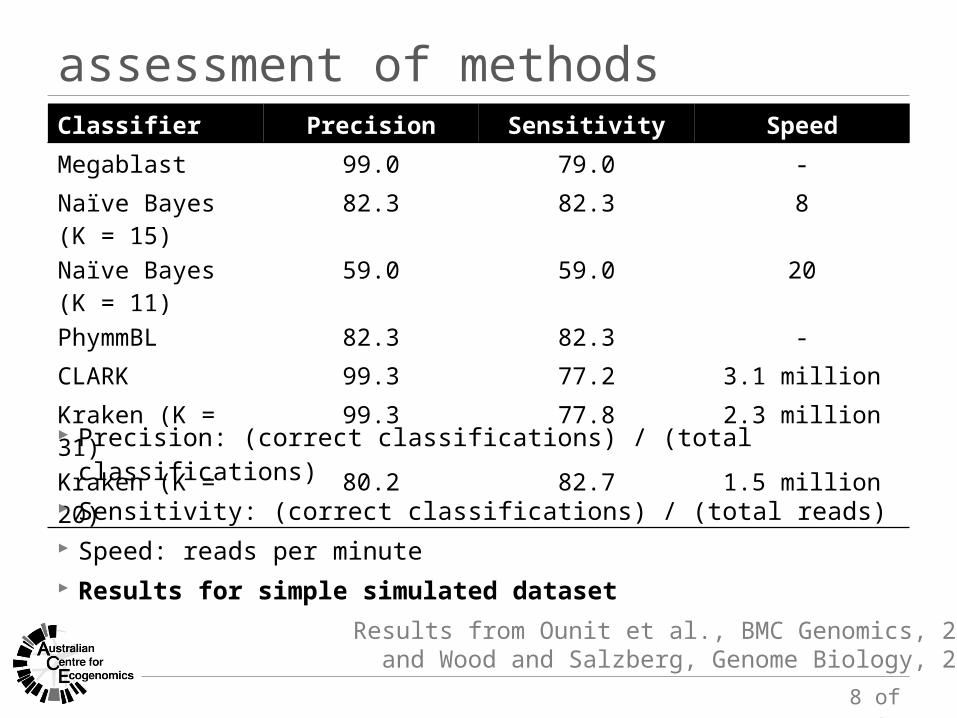
assessment of methods
Results from Ounit et al., BMC Genomics, 2015and Wood and Salzberg, Genome Biology, 2014
Classifier Precision Sensitivity Speed
Megablast 99.0 79.0 -Naïve Bayes (K = 15) 82.3 82.3 8Naïve Bayes (K = 11) 59.0 59.0 20PhymmBL 82.3 82.3 -CLARK 99.3 77.2 3.1 millionKraken (K = 31) 99.3 77.8 2.3 millionKraken (K = 20) 80.2 82.7 1.5 million Precision: (correct classifications) / (total classifications) Sensitivity: (correct classifications) / (total reads) Speed: reads per minute Results for simple simulated dataset
9 of 27
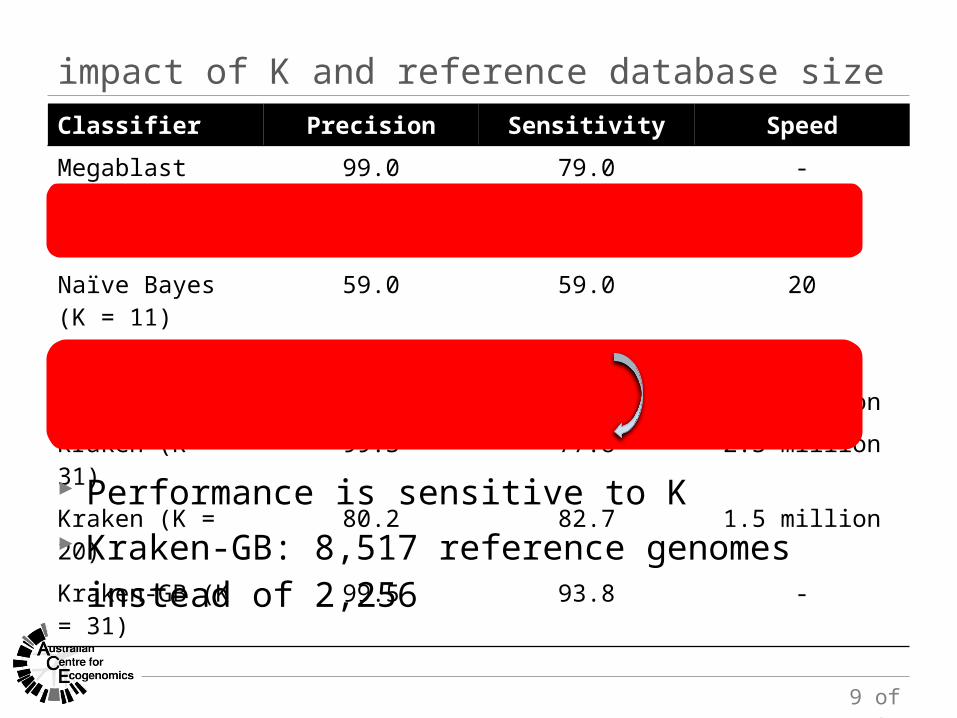
impact of K and reference database sizeClassifier Precision Sensitivity Speed
Megablast 99.0 79.0 -
Naïve Bayes (K = 15) 82.3 82.3 8
Naïve Bayes (K = 11) 59.0 59.0 20
PhymmBL 82.3 82.3 -
CLARK 99.3 77.2 3.1 million
Kraken (K = 31) 99.3 77.8 2.3 million
Kraken (K = 20) 80.2 82.7 1.5 million
Kraken-GB (K = 31) 99.5 93.8 -
Performance is sensitive to K Kraken-GB: 8,517 reference genomes instead of 2,256
10 of 27
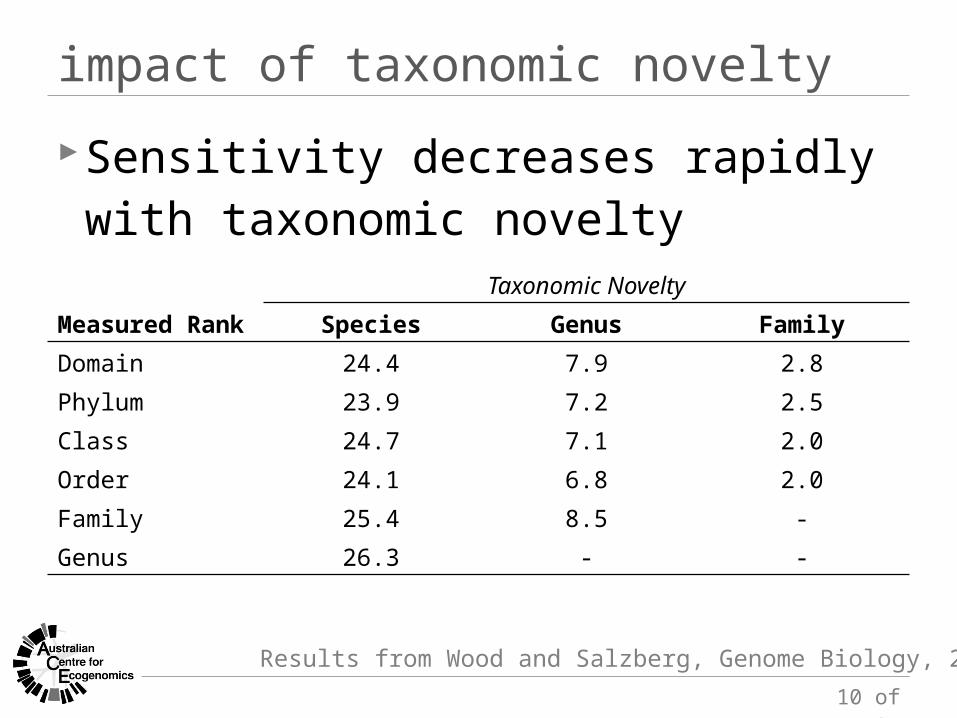
impact of taxonomic novelty
Results from Wood and Salzberg, Genome Biology, 2014
Taxonomic Novelty
Measured Rank Species Genus Family
Domain 24.4 7.9 2.8Phylum 23.9 7.2 2.5Class 24.7 7.1 2.0Order 24.1 6.8 2.0Family 25.4 8.5 -Genus 26.3 - -
Sensitivity decreases rapidly with taxonomic novelty
11 of 27
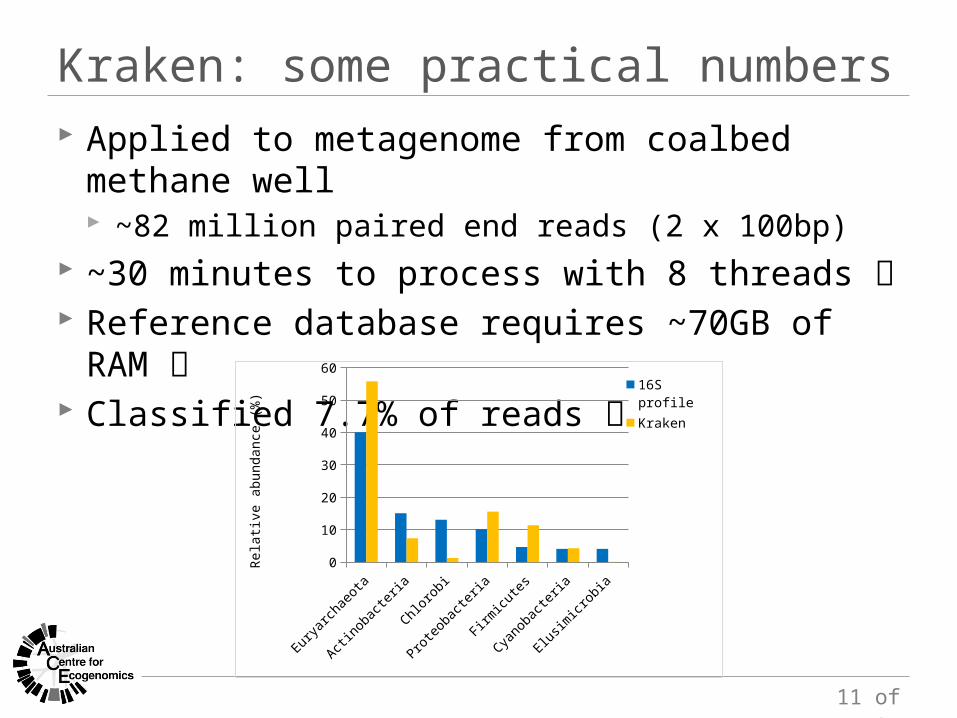
Kraken: some practical numbers Applied to metagenome from coalbed methane well
~82 million paired end reads (2 x 100bp) ~30 minutes to process with 8 threads Reference database requires ~70GB of RAM Classified 7.7% of reads
Eurya
rchae
ota
Actino
bacter
ia
Chlor
obi
Proteo
bacte
ria
Firmicu
tes
Cyan
obacte
ria
Elusim
icrob
ia0
10
20
30
40
50
6016S profileKraken
Rela
tive
abun
danc
e (%
)
12 of 27
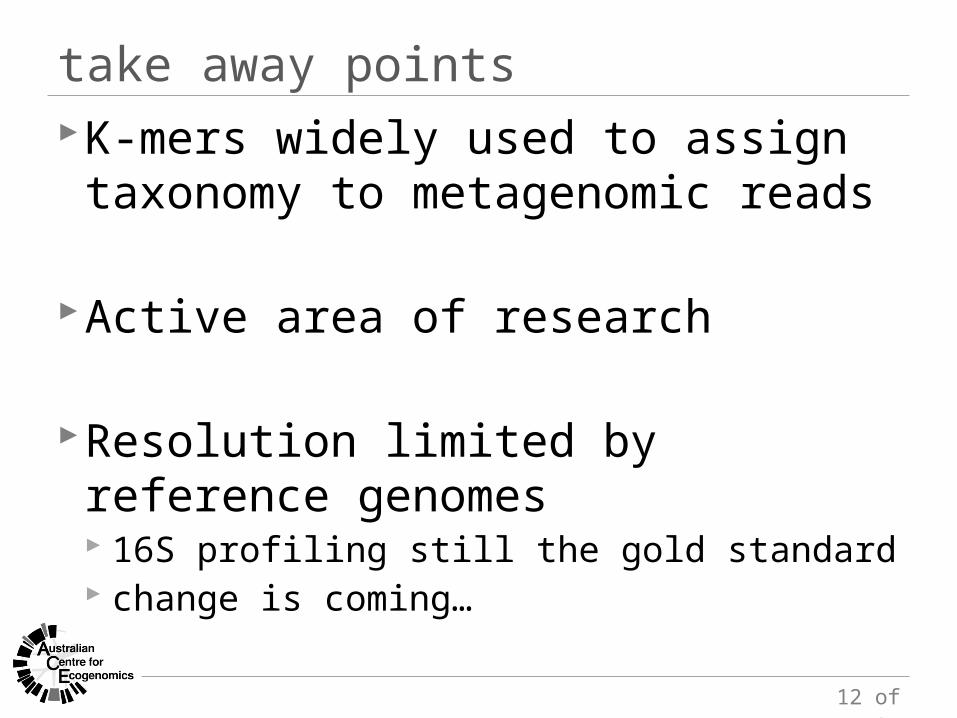
take away pointsK-mers widely used to assign taxonomy to
metagenomic reads
Active area of research
Resolution limited by reference genomes 16S profiling still the gold standard change is coming…
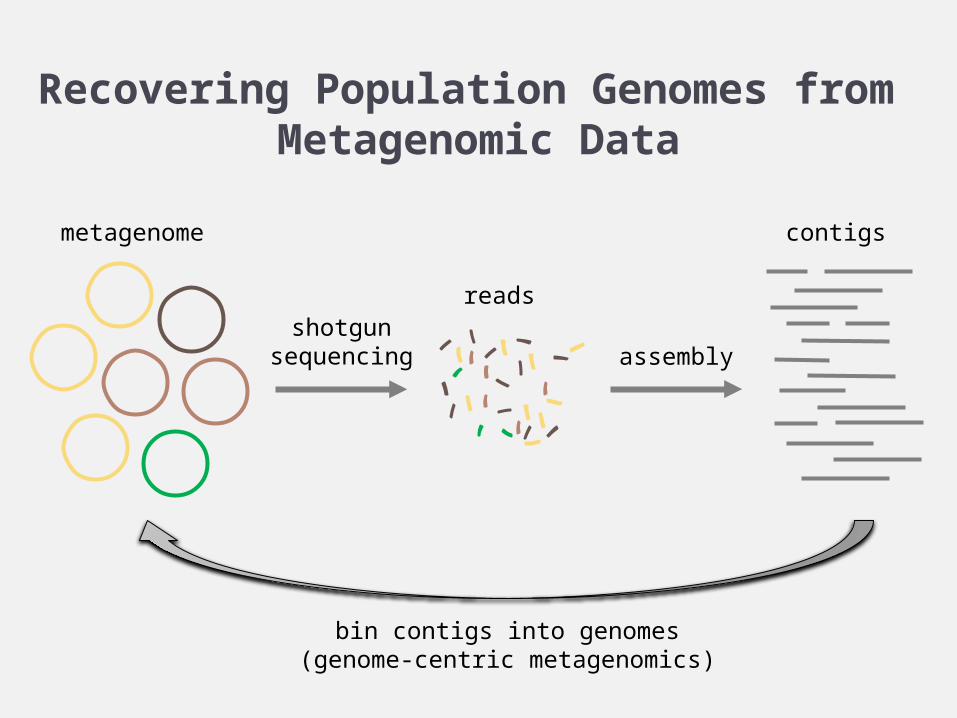
Recovering Population Genomes from Metagenomic Data
shotgunsequencing assembly
bin contigs into genomes(genome-centric metagenomics)
metagenome
reads
contigs
14 of 27
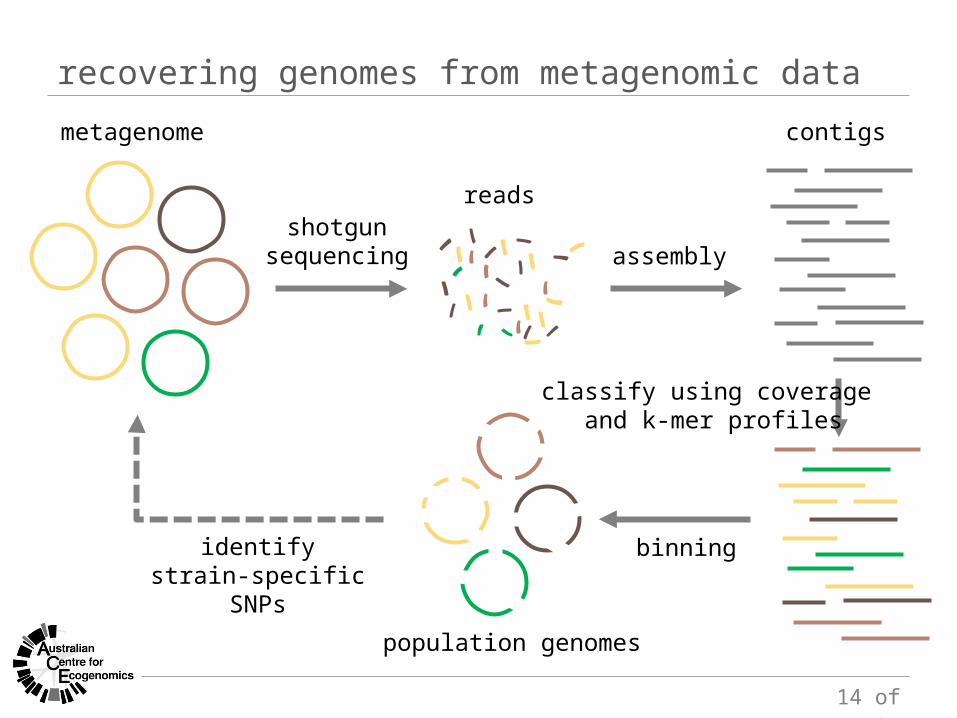
recovering genomes from metagenomic data
shotgunsequencing assembly
metagenome
reads
contigs
population genomes
identifystrain-specific SNPs
binning
classify using coverage and k-mer profiles
15 of 27
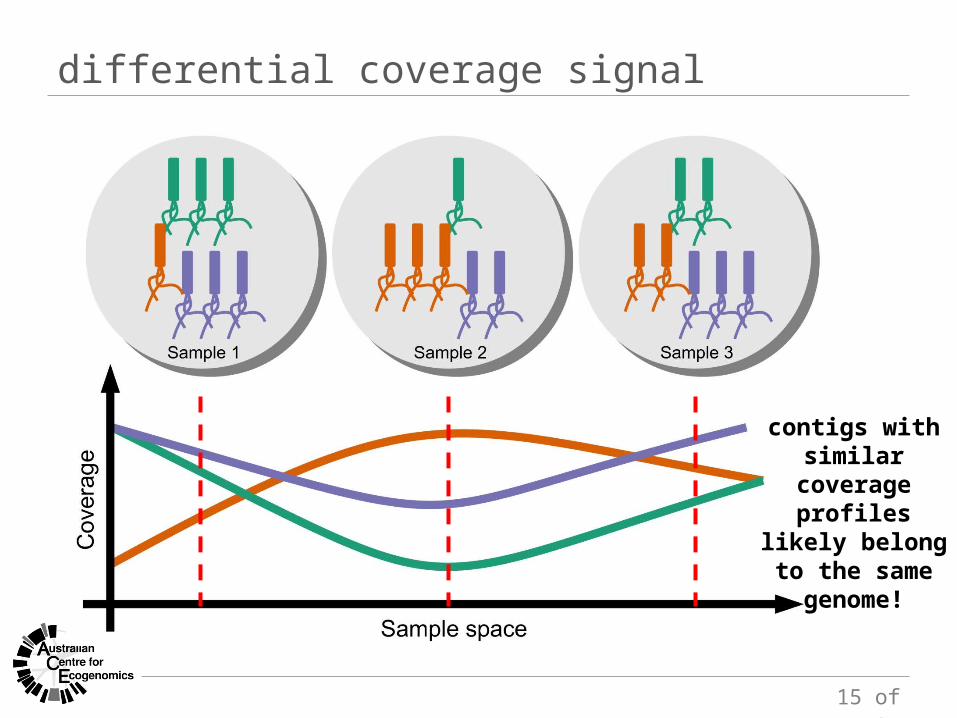
differential coverage signal
contigs with similar coverage
profiles likely belong to the
same genome!
16 of 27
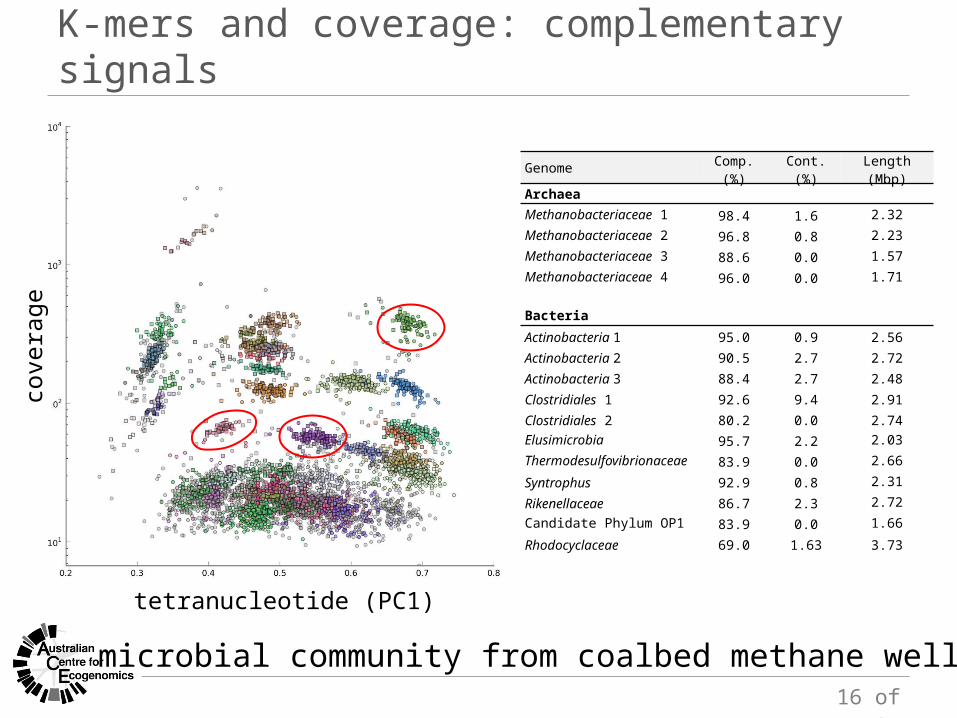
K-mers and coverage: complementary signals
microbial community from coalbed methane well
cove
rage
tetranucleotide (PC1)
Genome Comp. (%) Cont. (%) Length (Mbp)ArchaeaMethanobacteriaceae 1 98.4 1.6 2.32Methanobacteriaceae 2 96.8 0.8 2.23Methanobacteriaceae 3 88.6 0.0 1.57Methanobacteriaceae 4 96.0 0.0 1.71
BacteriaActinobacteria 1 95.0 0.9 2.56Actinobacteria 2 90.5 2.7 2.72Actinobacteria 3 88.4 2.7 2.48
Clostridiales 1 92.6 9.4 2.91Clostridiales 2 80.2 0.0 2.74Elusimicrobia 95.7 2.2 2.03Thermodesulfovibrionaceae 83.9 0.0 2.66
Syntrophus 92.9 0.8 2.31
Rikenellaceae 86.7 2.3 2.72Candidate Phylum OP1 83.9 0.0 1.66
Rhodocyclaceae 69.0 1.63 3.73
17 of 27
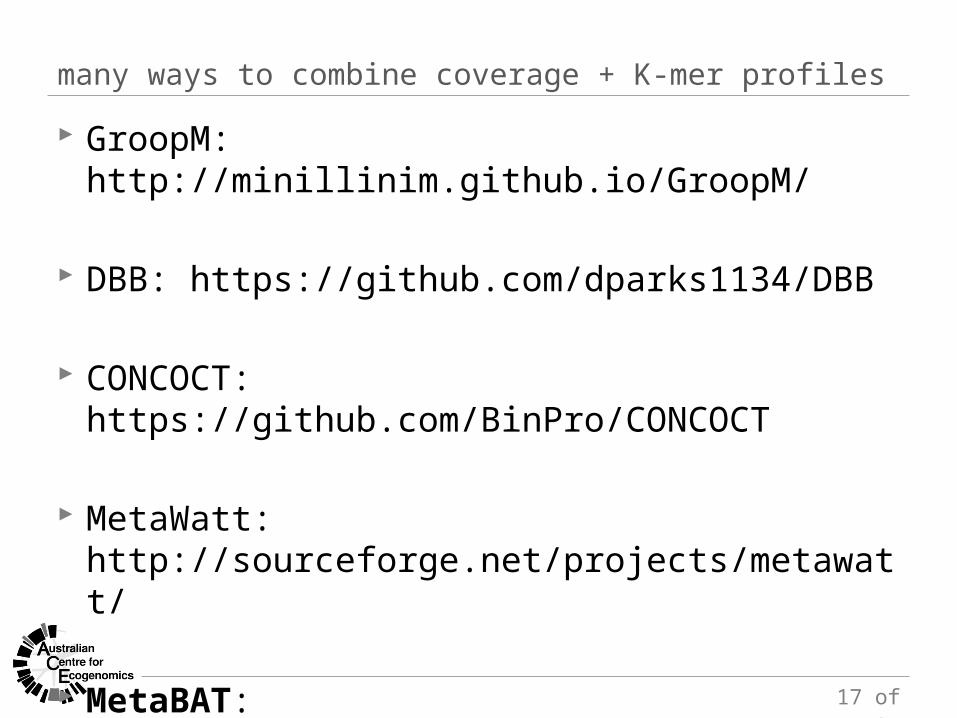
many ways to combine coverage + K-mer profiles GroopM: http://minillinim.github.io/GroopM/
DBB: https://github.com/dparks1134/DBB
CONCOCT: https://github.com/BinPro/CONCOCT
MetaWatt: http://sourceforge.net/projects/metawatt/
MetaBAT: https://bitbucket.org/berkeleylab/metabat

18 of 27
MetaBAT overview
Kang et al., bioRxiv, 2014
19 of 27
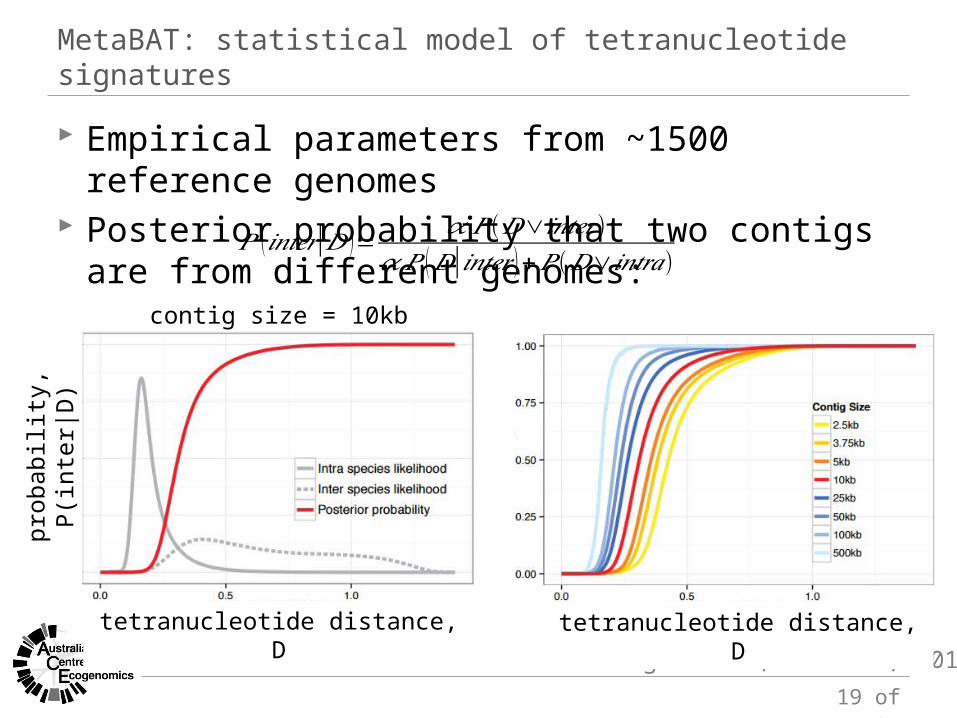
MetaBAT: statistical model of tetranucleotide signatures
Empirical parameters from ~1500 reference genomes Posterior probability that two contigs are from different
genomes:
Kang et al., bioRxiv, 2014
contig size = 10kb
𝑃 (𝑖𝑛𝑡𝑒𝑟|𝐷 )= 𝛼 𝑃 (𝐷∨𝑖𝑛𝑡𝑒𝑟 )𝛼 𝑃 (𝐷|𝑖𝑛𝑡𝑒𝑟 )+𝑃 (𝐷∨𝑖𝑛𝑡𝑟𝑎)
tetranucleotide distance, D tetranucleotide distance, D
prob
abili
ty, P
(inte
r|D)
20 of 27
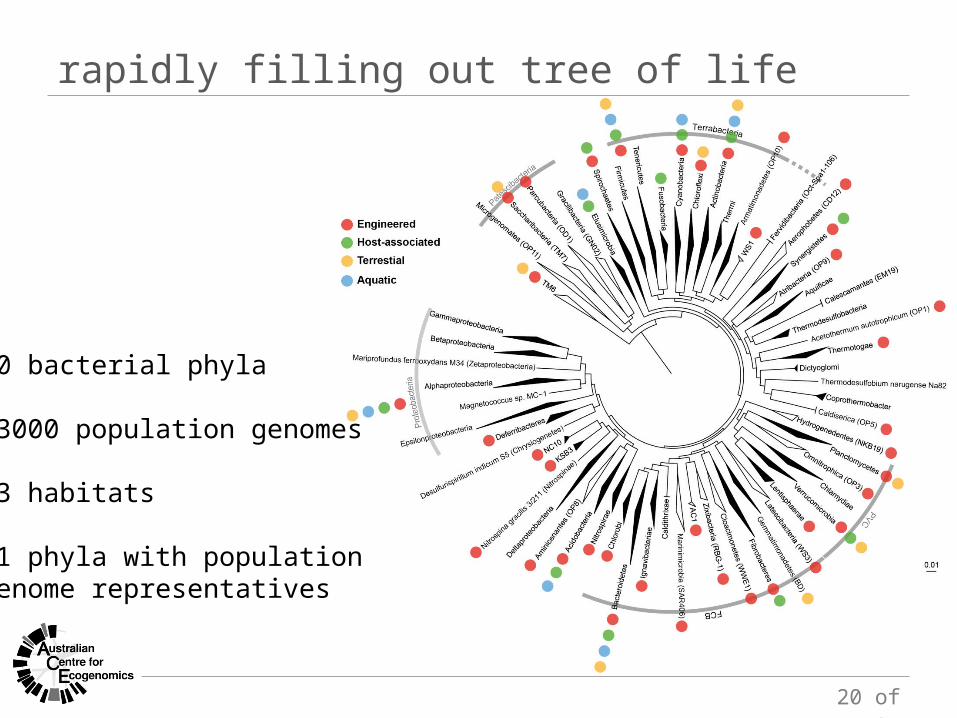
rapidly filling out tree of life
60 bacterial phyla
>3000 population genomes
23 habitats
51 phyla with population genome representatives
21 of 27
take away points
Population genomes can be recovered from metagenomic samples
K-mer profiles complement differential coverage signal
Rapidly expanding reference genomes Improve gene-centric metagenomics
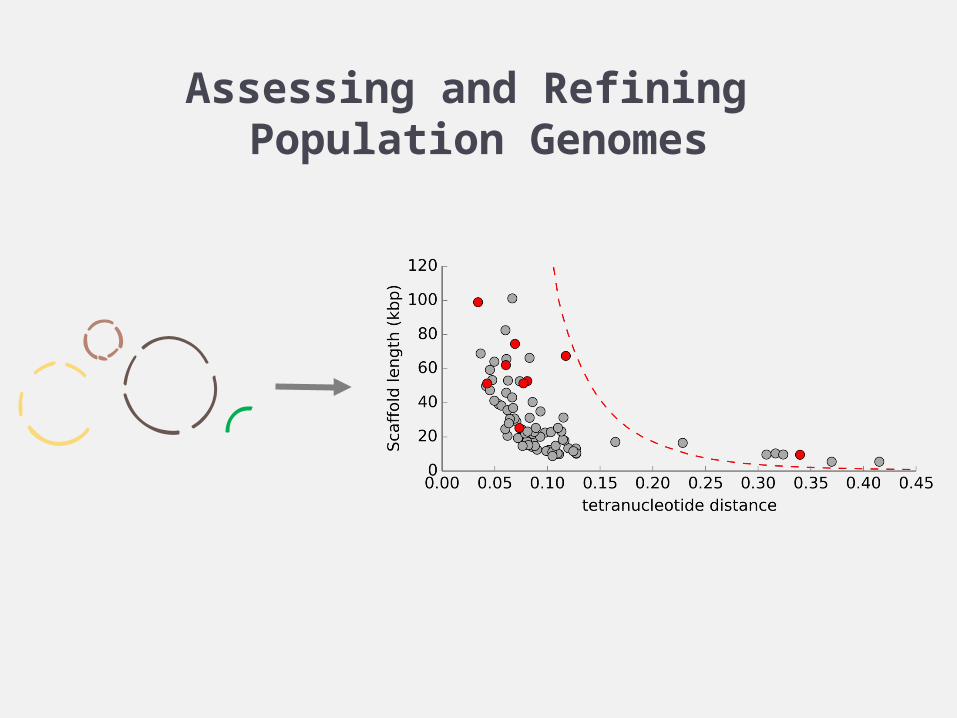
Assessing and Refining Population Genomes
23 of 27
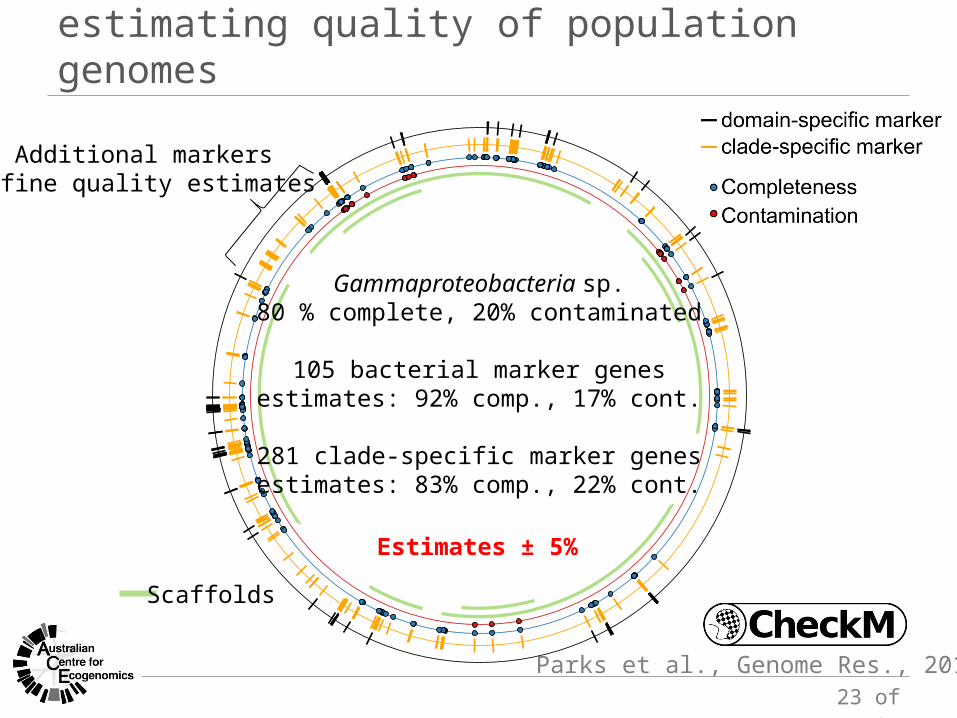
estimating quality of population genomes
Additional markersrefine quality estimates
Scaffolds
Gammaproteobacteria sp.80 % complete, 20% contaminated
105 bacterial marker genesestimates: 92% comp., 17% cont.
281 clade-specific marker genesestimates: 83% comp., 22% cont.
Parks et al., Genome Res., 2015
Estimates ± 5%

24 of 27
varying quality of recovered genomes
microbial community from coalbed methane well
cove
rage
tetranucleotide (PC1)
Genome Comp. (%) Cont. (%) Length (Mbp)ArchaeaMethanobacteriaceae 1 98.4 1.6 2.32Methanobacteriaceae 2 96.8 0.8 2.23Methanobacteriaceae 3 88.6 0.0 1.57Methanobacteriaceae 4 96.0 0.0 1.71
BacteriaActinobacteria 1 95.0 0.9 2.56Actinobacteria 2 90.5 2.7 2.72Actinobacteria 3 88.4 2.7 2.48
Clostridiales 1 92.6 9.4 2.91Clostridiales 2 80.2 0.0 2.74Elusimicrobia 95.7 2.2 2.03Thermodesulfovibrionaceae 83.9 0.0 2.66
Syntrophus 92.9 0.8 2.31
Rikenellaceae 86.7 2.3 2.72Candidate Phylum OP1 83.9 0.0 1.66
Rhodocyclaceae 69.0 1.63 3.73
25 of 27
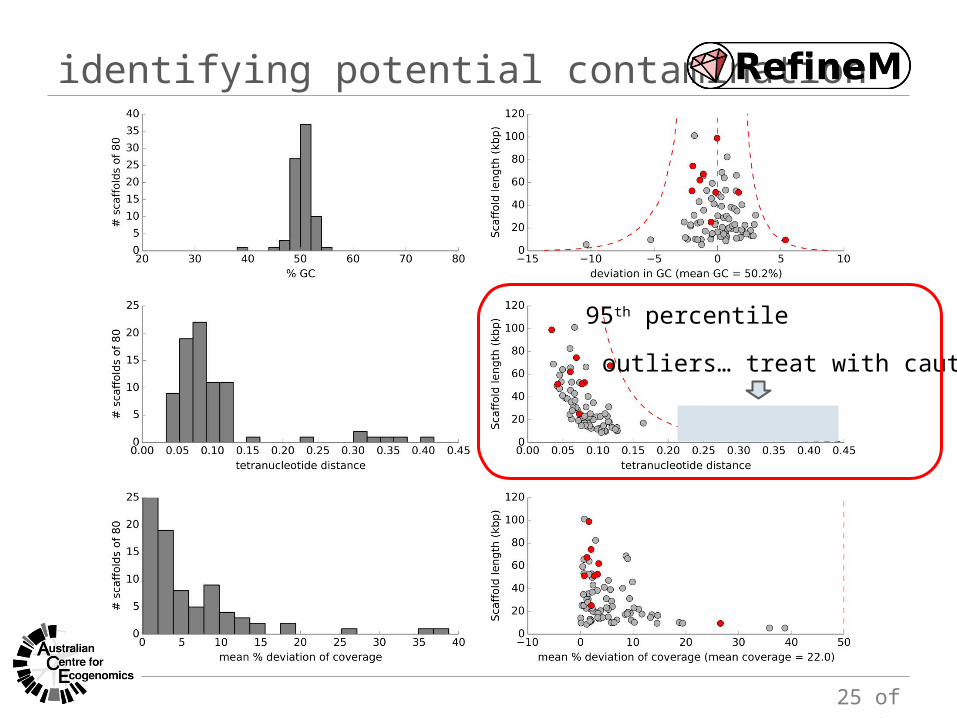
identifying potential contamination
95th percentile
outliers… treat with caution
26 of 27
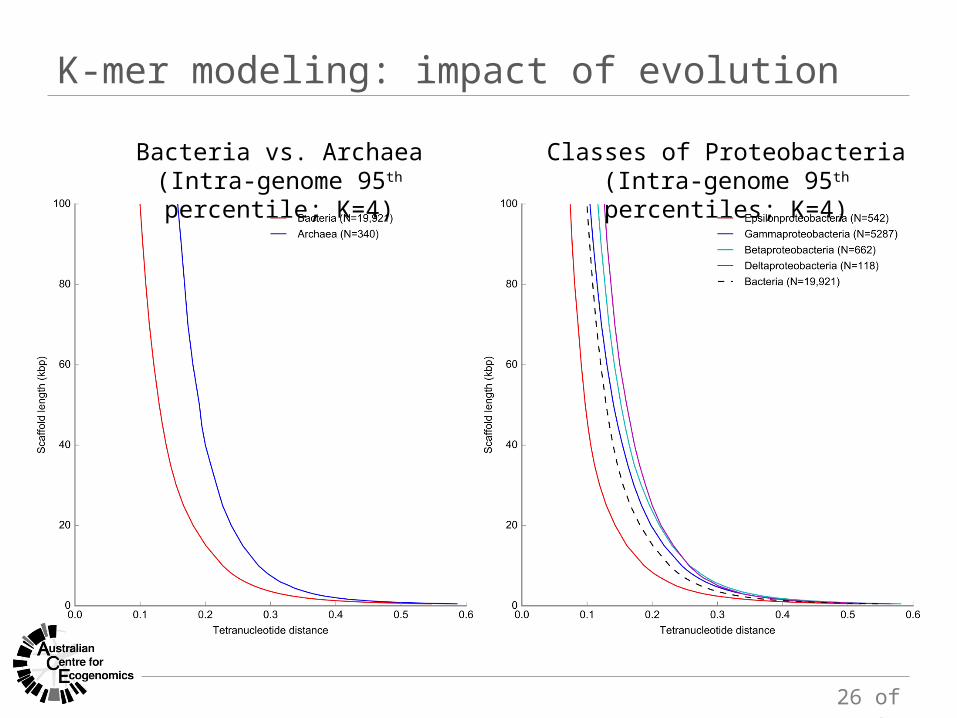
K-mer modeling: impact of evolution
Bacteria vs. Archaea(Intra-genome 95th percentile; K=4)
Classes of Proteobacteria(Intra-genome 95th percentiles; K=4)
27 of 27
final thoughts K-mers widely used in gene- and genome-centric
metagenomic
Population genomes substantially improving diversity of available reference genomes Big win for taxonomic attribution methods And CheckM, and many other bioinformatic programs
How best to exploit population genomes Looking at 100,000+ reference genomes in next few years Issues in terms of scalability Using ‘noisy’ population genomes raises interesting questions

Thank you!


![[2013.10.29] albertsen genomics metagenomics](https://img.pdfslide.net/doc/110x75/554a2539b4c90520578b4861/20131029-albertsen-genomics-metagenomics.jpg)