Embed Size (px)
Citation preview
Adam Rissien
Agricultural & Water Policy Director
(614) 487-7506
Preventing Harmful Algal Blooms: How Much Phosphorus Reduction Do
We Need?
Ohio Environmental Council
Our Mission:
To secure healthy air, land, and water for all who call Ohio home.
About the OEC
Founded in 1969
Statewide, non-profit, non- government
Membership organization – 3,000+ individuals, 100+ group members
Budget of $1.5 million – funded primarily by grants & donations
Volunteer Board of Directors; 16 staff members
Key Issues
Clean Water Program Reduce Nutrient Pollution
Prevent Spread of Asian Carp
Environmental Health Program Protecting People from Toxic
Chemicals
Clean Air Program Promoting Renewable Energy
Sources
Natural Resources Protecting State Parks & Nature
Preserves
Green Jobs / Green Economy Promoting Environmentally
Sustainable Careers
Oil & Gas Drilling Fight Fracking
PRESENTED BY DR. JEFFERY REUTTER, Annex 4 Task Team Co-chair, Special Advisor Ohio Sea Grant Col lege Program
Avai lable for Quest ions: Sant ina Wortman, U.S. Environmental Protect ion Agency, Region 5 Off ice
Annex 4 Objectives and Targets Task Team Recommendations
OHIO SEA GRANT AND STONE LABORATORY
OHIO SEA GRANT AND STONE LABORATORY
Preventing Harmful Algal Blooms: How Much Phosphorus
Reduction Do We Need?
Dr. Jeffrey M. ReutterSpecial Advisor, Ohio Sea Grant College
Program
OHIO SEA GRANT AND STONE LABORATORY
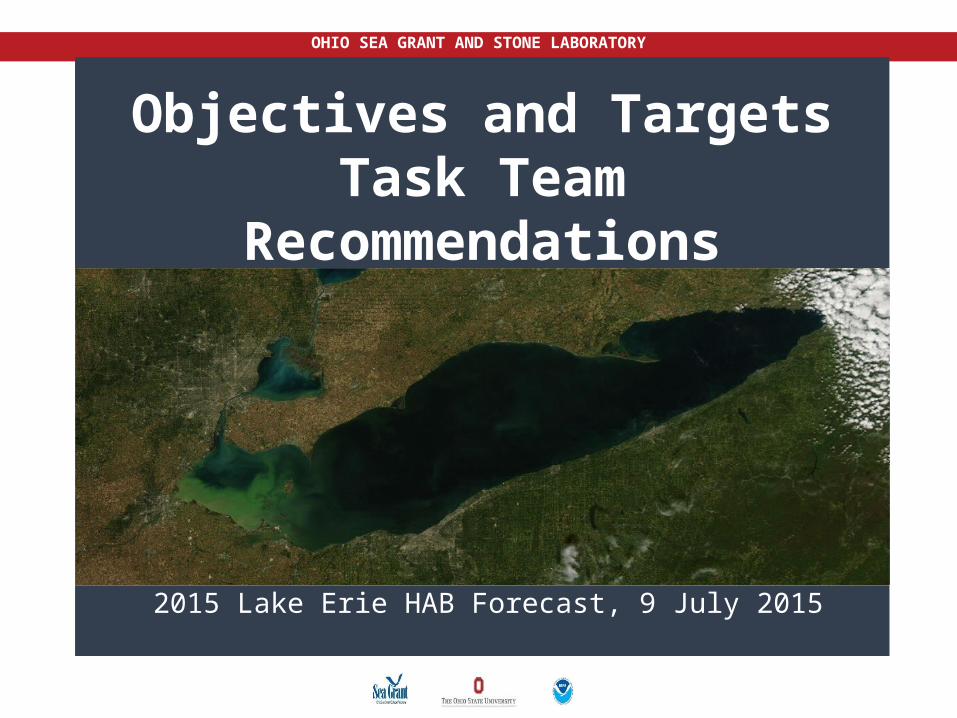
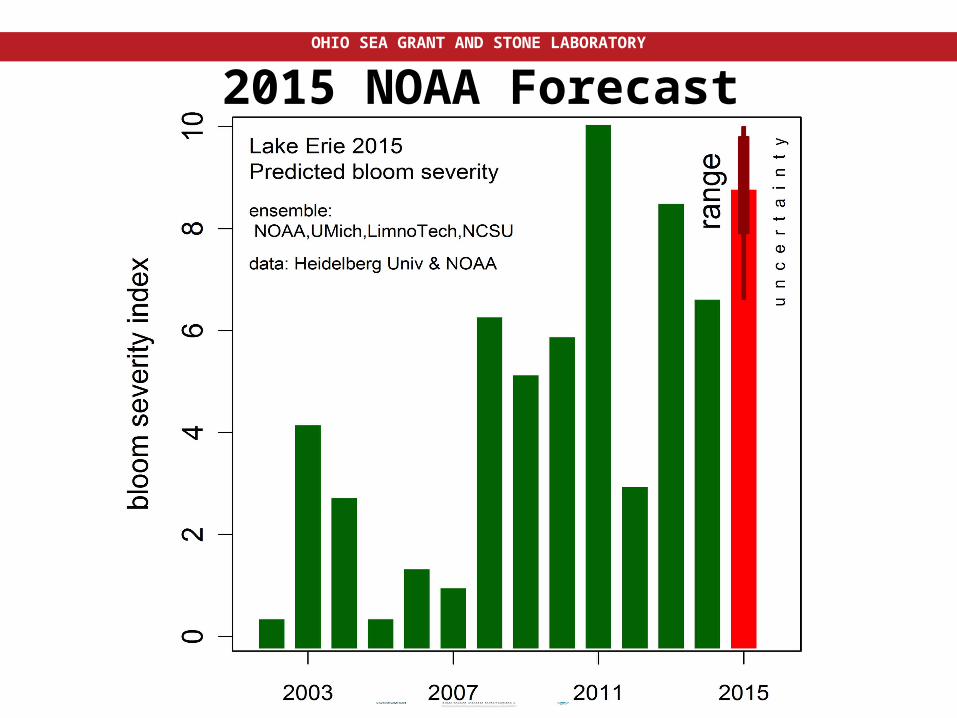
2015 Lake Erie HAB Forecast, 9 July 2015
Objectives and Targets Task Team
Recommendations
OHIO SEA GRANT AND STONE LABORATORY
8
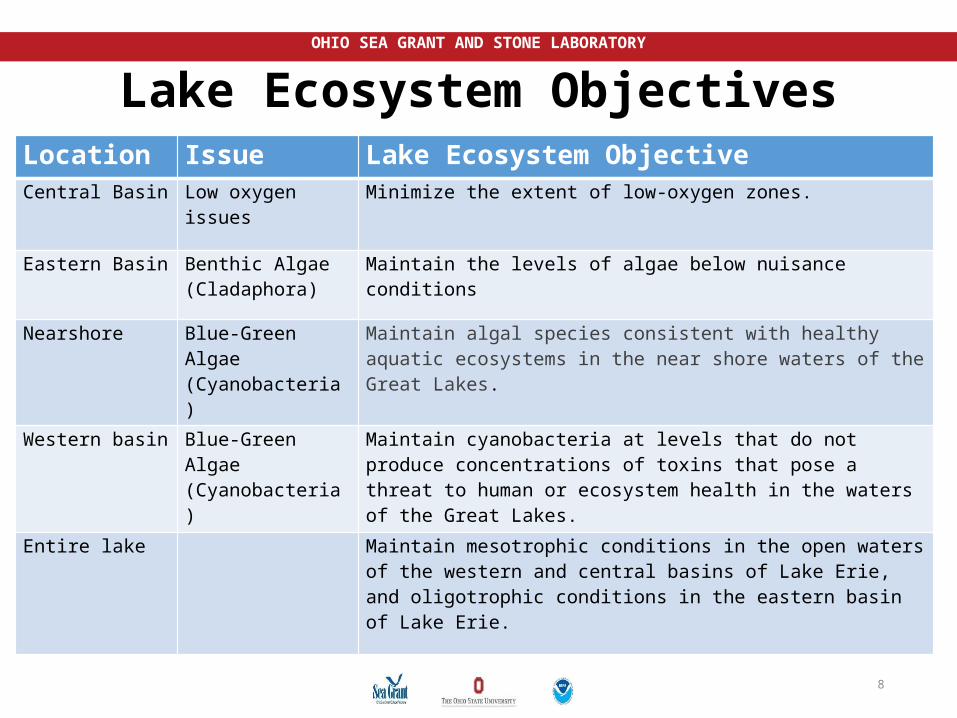
Lake Ecosystem ObjectivesLocation Issue Lake Ecosystem ObjectiveCentral Basin Low oxygen issues Minimize the extent of low-oxygen zones.
Eastern Basin Benthic Algae(Cladaphora)
Maintain the levels of algae below nuisance conditions
Nearshore Blue-Green Algae (Cyanobacteria)
Maintain algal species consistent with healthy aquatic ecosystems in the near shore waters of the Great Lakes.
Western basin Blue-Green Algae (Cyanobacteria)
Maintain cyanobacteria at levels that do not produce concentrations of toxins that pose a threat to human or ecosystem health in the waters of the Great Lakes.
Entire lake Maintain mesotrophic conditions in the open waters of the western and central basins of Lake Erie, and oligotrophic conditions in the eastern basin of Lake Erie.
OHIO SEA GRANT AND STONE LABORATORY
Objectives & Targets Task Team Report
The draft phosphorus targets are now available to the public for comment at:
http://binational.net/
“Adaptive Management”
9
OHIO SEA GRANT AND STONE LABORATORY
Lake Erie and Other Great Lakes
•Southernmost•Shallowest•Warmest•Most agricultural land and least forest•Most nutrients and sediment•Most biologically productive
OHIO SEA GRANT AND STONE LABORATORY
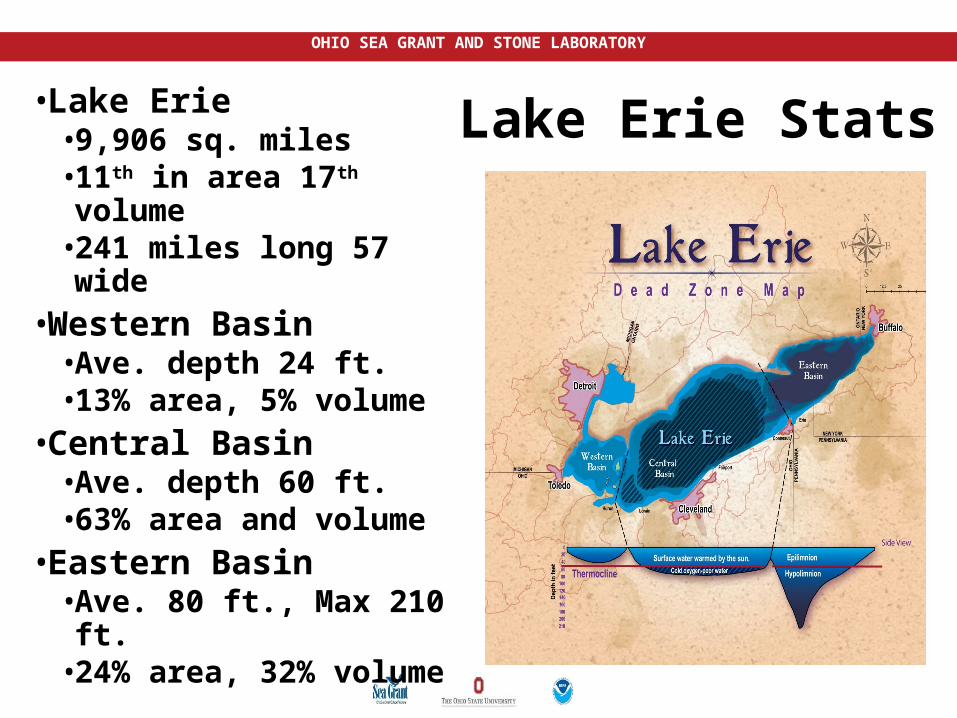
Lake Erie Stats•Lake Erie•9,906 sq. miles•11th in area 17th volume•241 miles long 57 wide
•Western Basin•Ave. depth 24 ft.•13% area, 5% volume
•Central Basin•Ave. depth 60 ft.•63% area and volume
•Eastern Basin•Ave. 80 ft., Max 210 ft. •24% area, 32% volume
OHIO SEA GRANT AND STONE LABORATORY
80:10:10 Rule
•80% of water from upper lakes•10% direct precipitation•10% from Lake Erie tributaries
•Maumee •Largest tributary to Great Lakes
•Drains 4.2 million acres of ag land•3% of flow into Lake Erie
OHIO SEA GRANT AND STONE LABORATORY
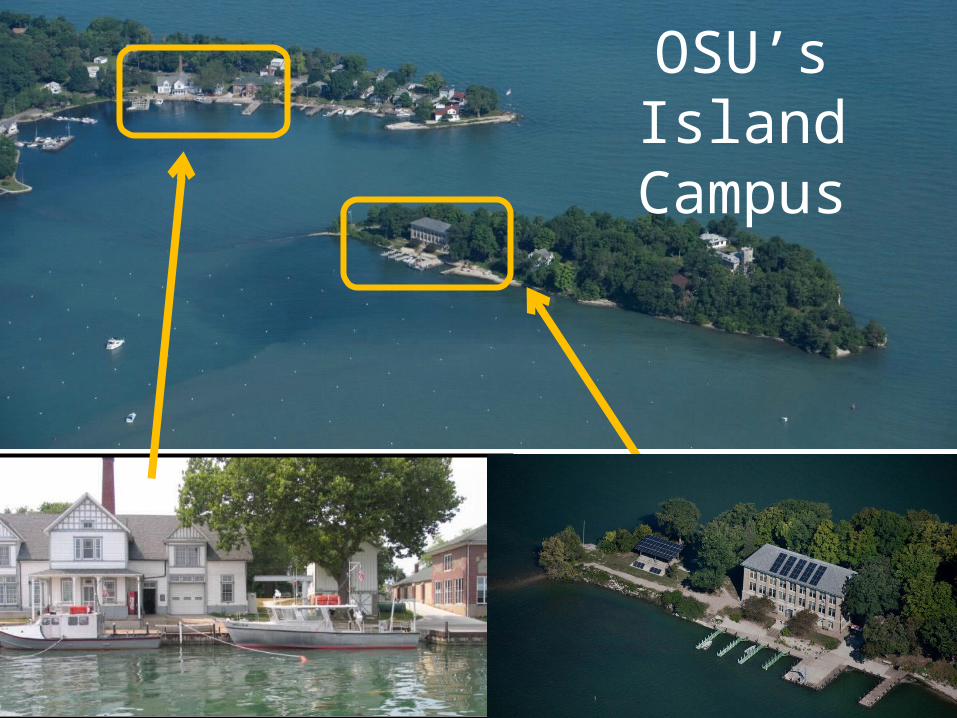
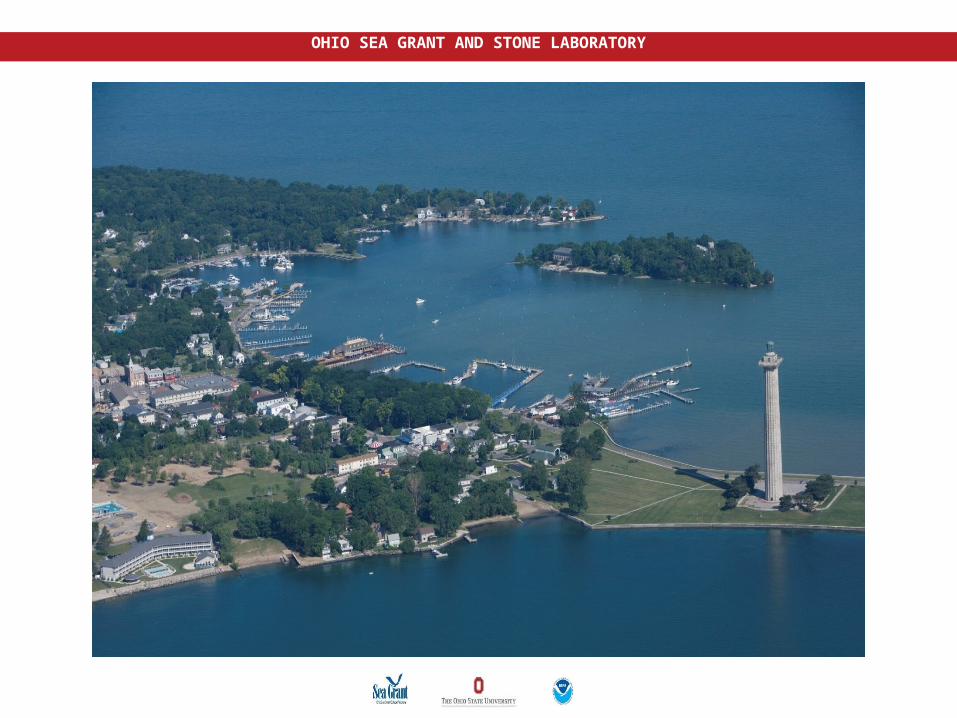
OHIO SEA GRANT AND STONE LABORATORYOSU’s Island Campus
OHIO SEA GRANT AND STONE LABORATORY
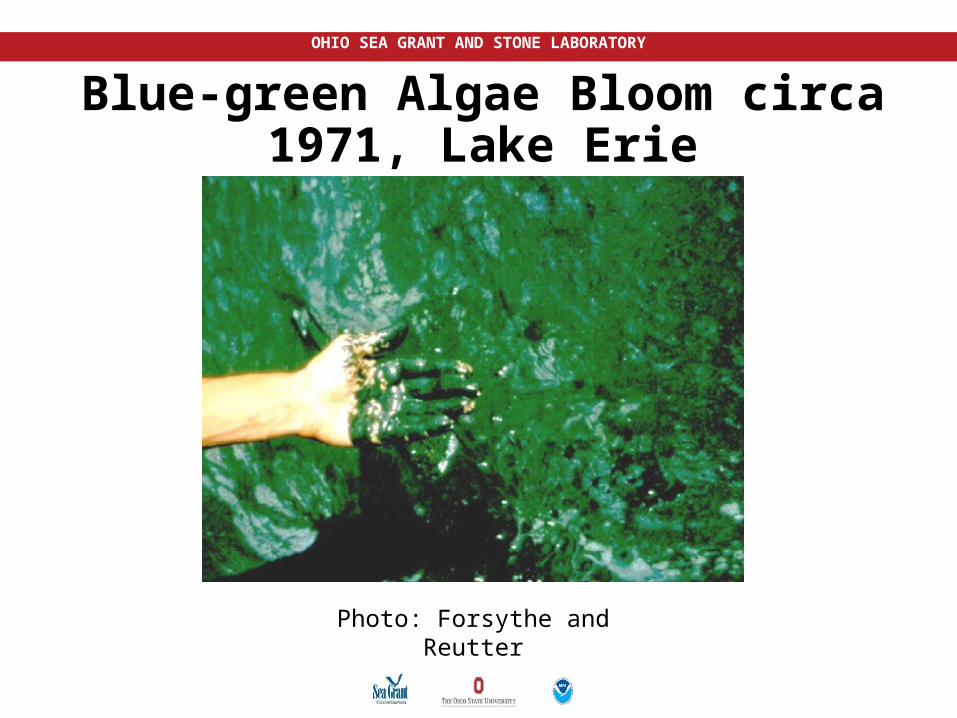
Blue-green Algae Bloom circa 1971, Lake Erie
Photo: Forsythe and Reutter
OHIO SEA GRANT AND STONE LABORATORY
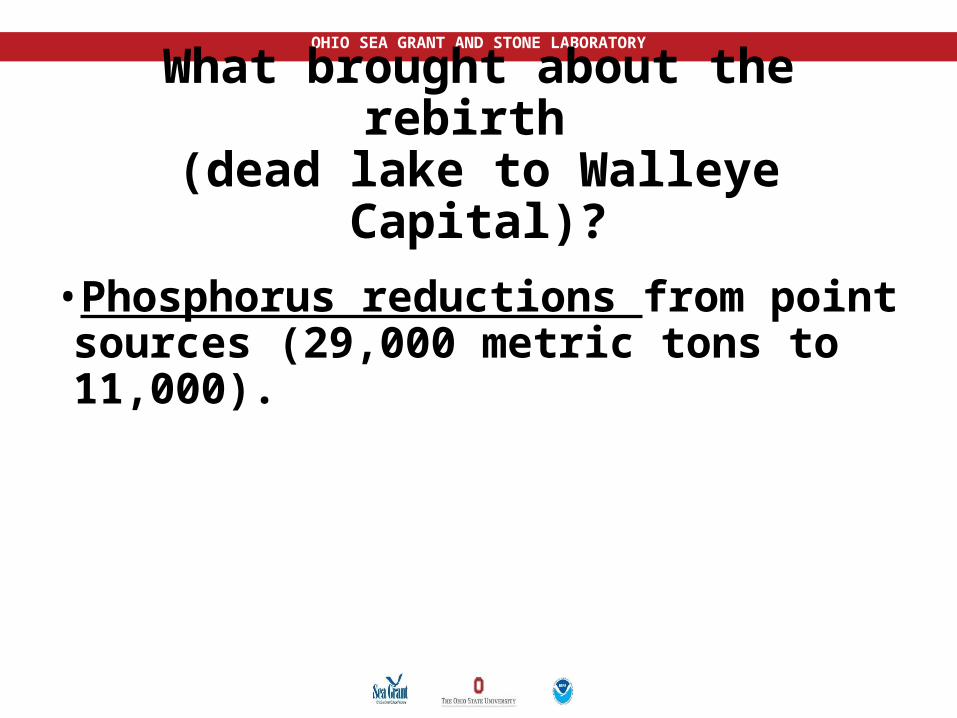
What brought about the rebirth (dead lake to Walleye Capital)?
•Phosphorus reductions from point sources (29,000 metric tons to 11,000).
OHIO SEA GRANT AND STONE LABORATORY
OHIO SEA GRANT AND STONE LABORATORY
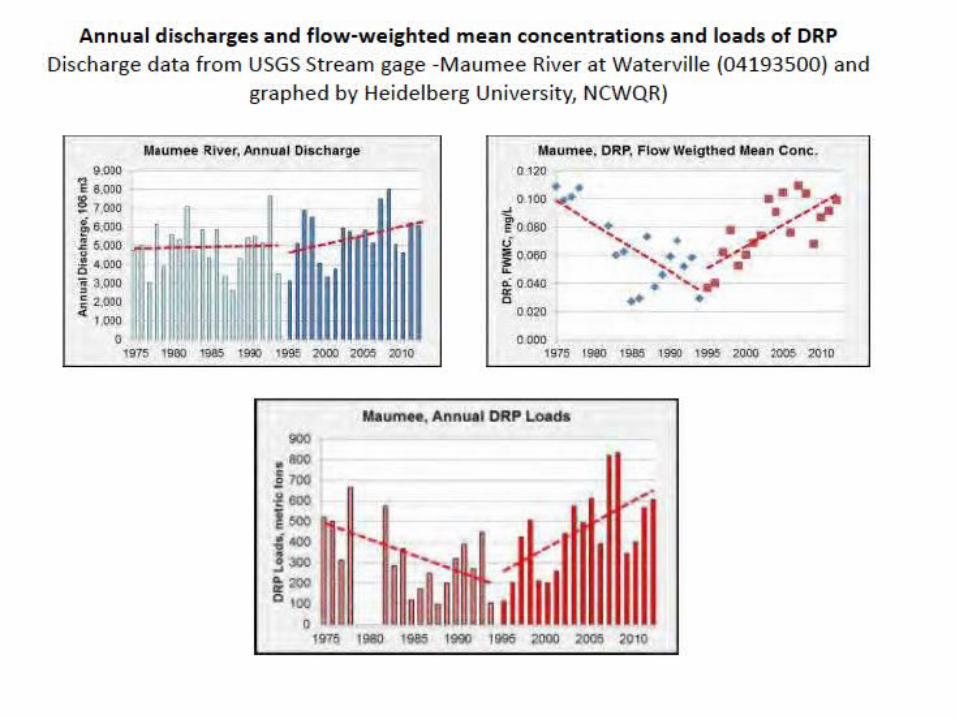
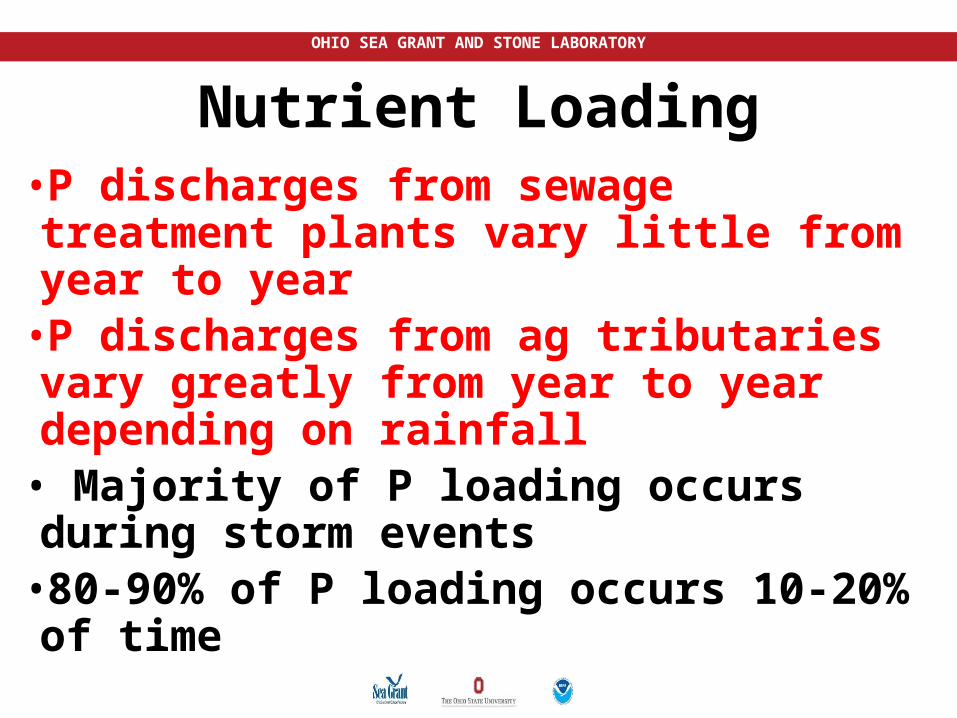
Nutrient Loading•P discharges from sewage treatment plants vary little from year to year
•P discharges from ag tributaries vary greatly from year to year depending on rainfall
• Majority of P loading occurs during storm events
•80-90% of P loading occurs 10-20% of time
OHIO SEA GRANT AND STONE LABORATORY
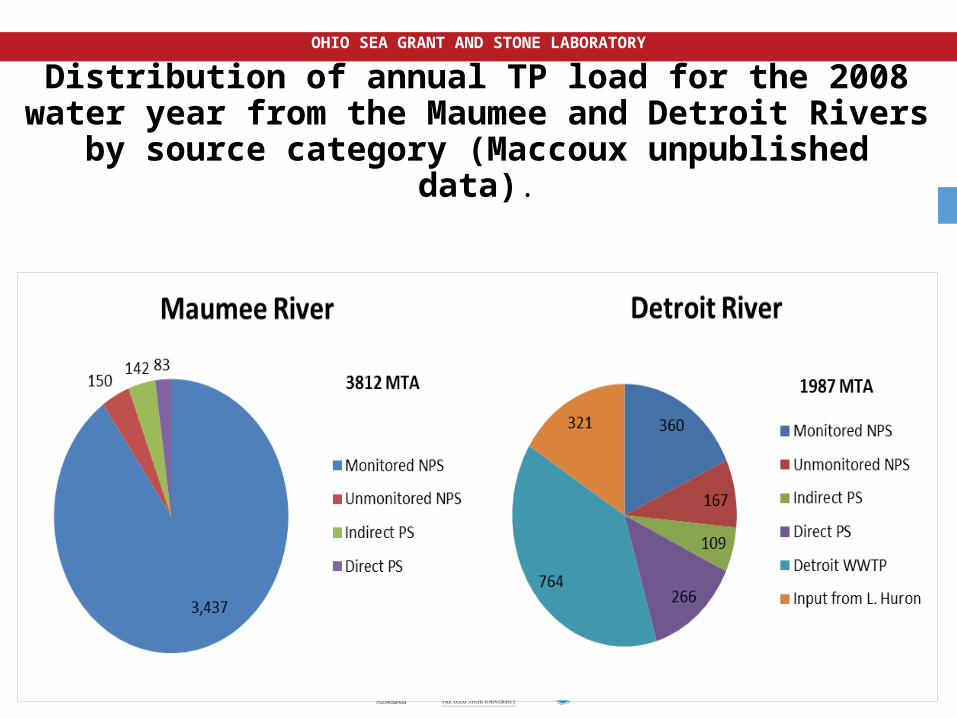
Distribution of annual TP load for the 2008 water year from the Maumee and Detroit
Rivers by source category (Maccoux unpublished data).
OHIO SEA GRANT AND STONE LABORATORY
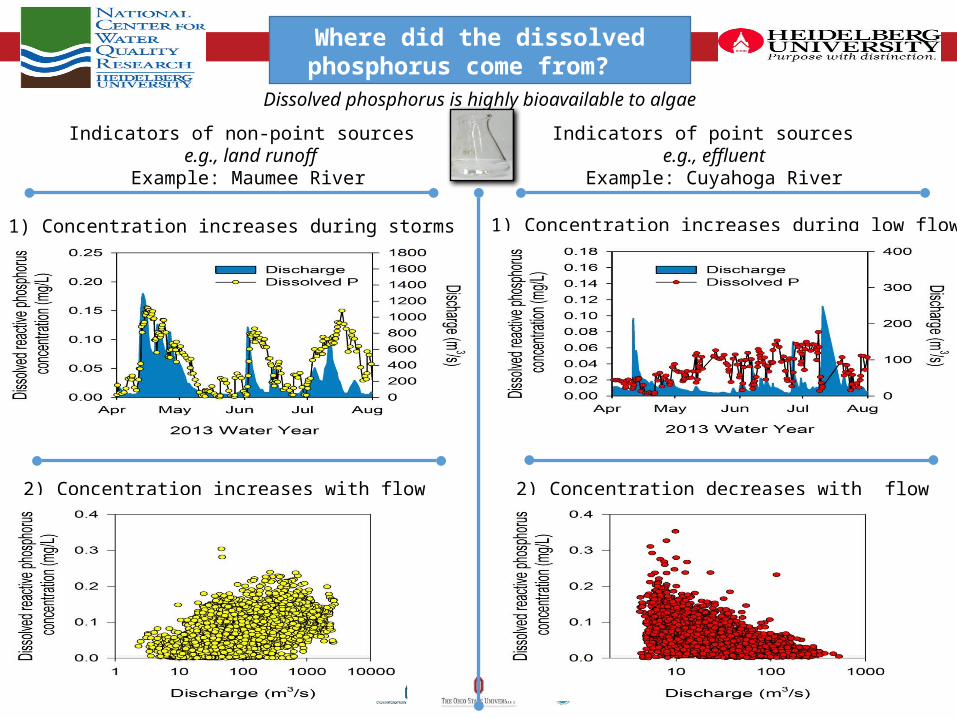
OHIO SEA GRANT AND STONE LABORATORYWhere did the dissolved phosphorus come from?
Indicators of non-point sources e.g., land runoff
Example: Maumee River
Indicators of point sources e.g., effluent
Example: Cuyahoga River
1) Concentration increases during storms
2) Concentration increases with flow
1) Concentration increases during low flow
2) Concentration decreases with flow
Dissolved phosphorus is highly bioavailable to algae
OHIO SEA GRANT AND STONE LABORATORY
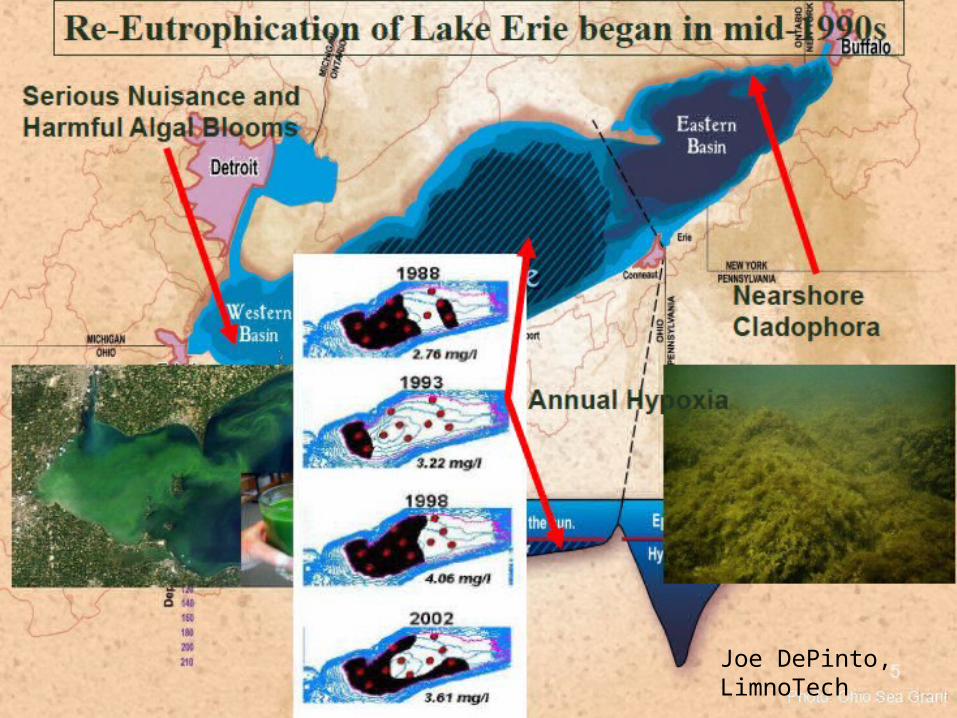
Joe DePinto, LimnoTech
OHIO SEA GRANT AND STONE LABORATORY
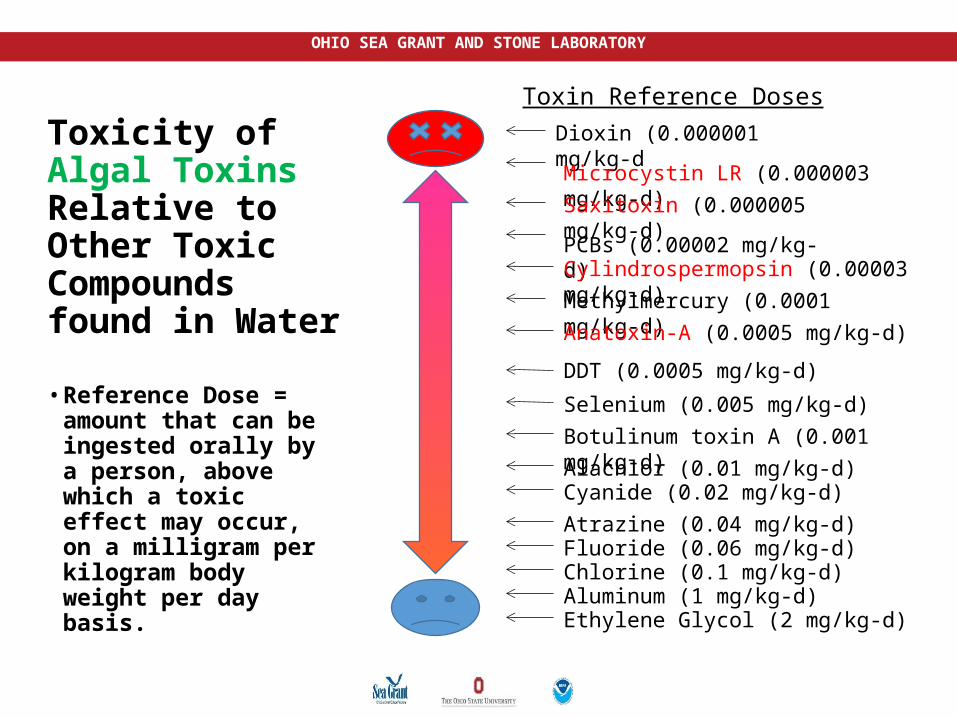
• Reference Dose = amount that can be ingested orally by a person, above which a toxic effect may occur, on a milligram per kilogram body weight per day basis.
Toxicity of Algal Toxins Relative to Other Toxic Compounds found in Water
Dioxin (0.000001 mg/kg-d)
Microcystin LR (0.000003 mg/kg-d)Saxitoxin (0.000005 mg/kg-d)
PCBs (0.00002 mg/kg-d)Cylindrospermopsin (0.00003 mg/kg-d)Methylmercury (0.0001 mg/kg-d)Anatoxin-A (0.0005 mg/kg-d)
DDT (0.0005 mg/kg-d)
Selenium (0.005 mg/kg-d)
Alachlor (0.01 mg/kg-d)Cyanide (0.02 mg/kg-d)Atrazine (0.04 mg/kg-d)Fluoride (0.06 mg/kg-d)Chlorine (0.1 mg/kg-d)Aluminum (1 mg/kg-d)Ethylene Glycol (2 mg/kg-d)
Botulinum toxin A (0.001 mg/kg-d)
Toxin Reference Doses
OHIO SEA GRANT AND STONE LABORATORY
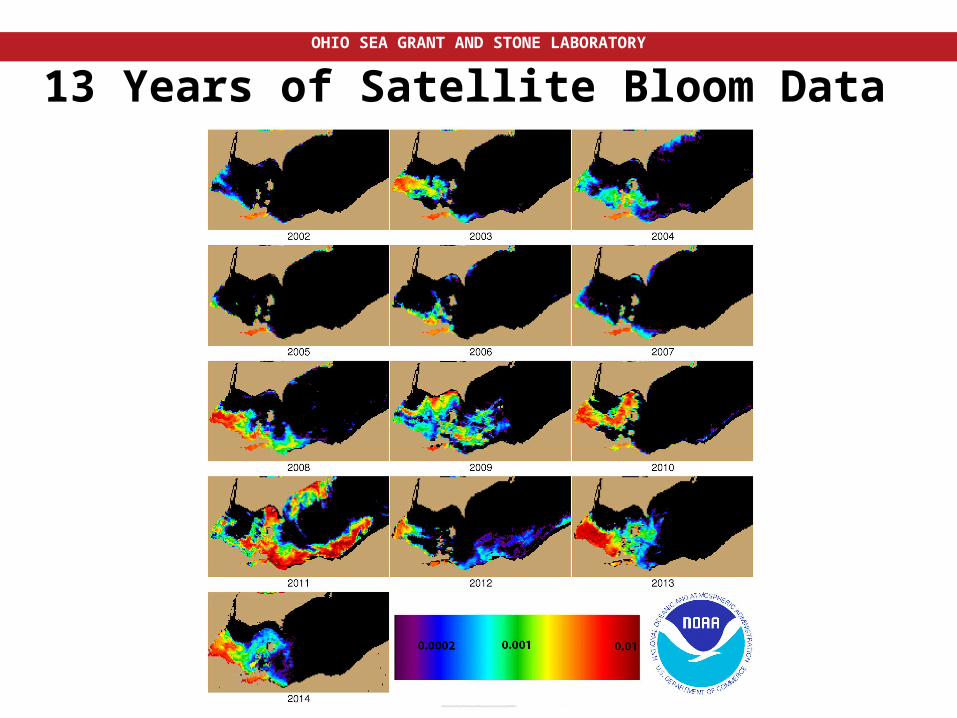
13 Years of Satellite Bloom Data
OHIO SEA GRANT AND STONE LABORATORY
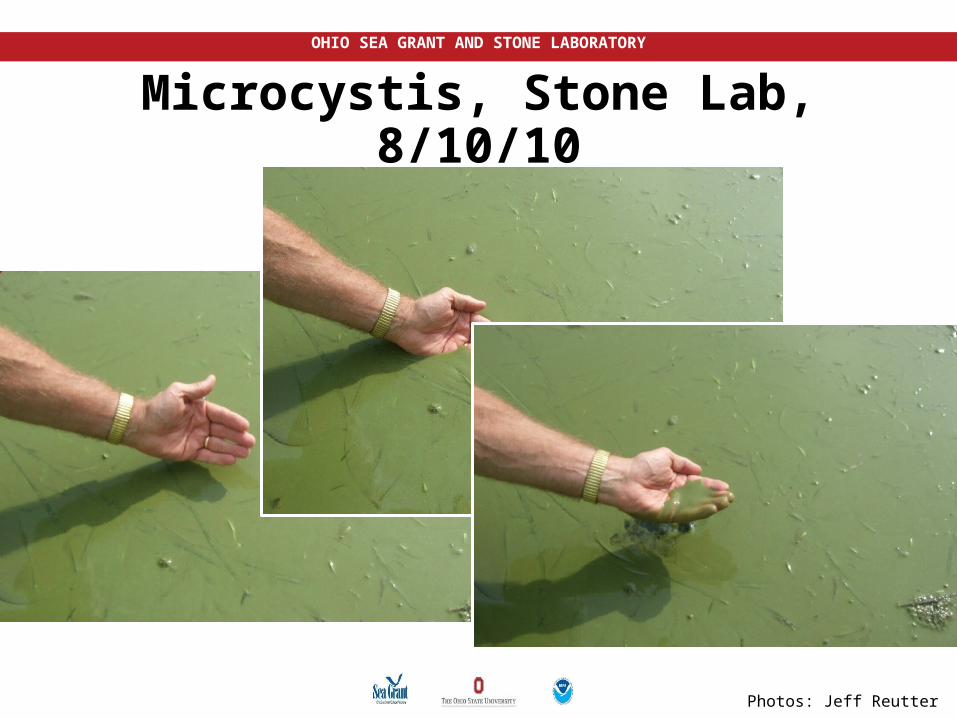
Photos: Jeff Reutter
Microcystis, Stone Lab, 8/10/10
OHIO SEA GRANT AND STONE LABORATORY
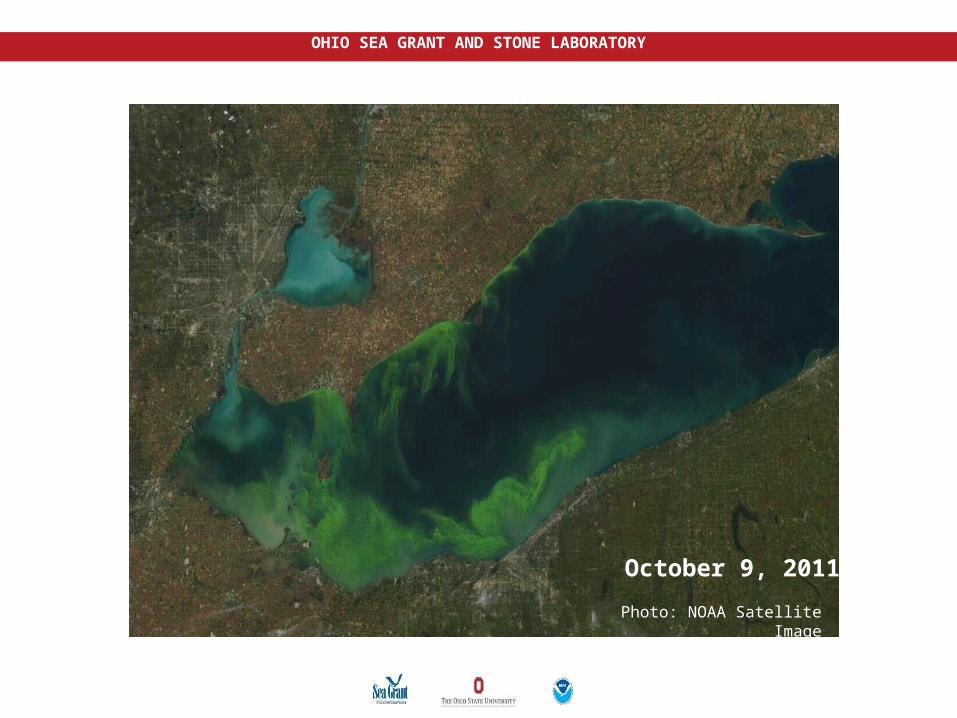
Photo: NOAA Satellite Image
October 9, 2011
OHIO SEA GRANT AND STONE LABORATORY
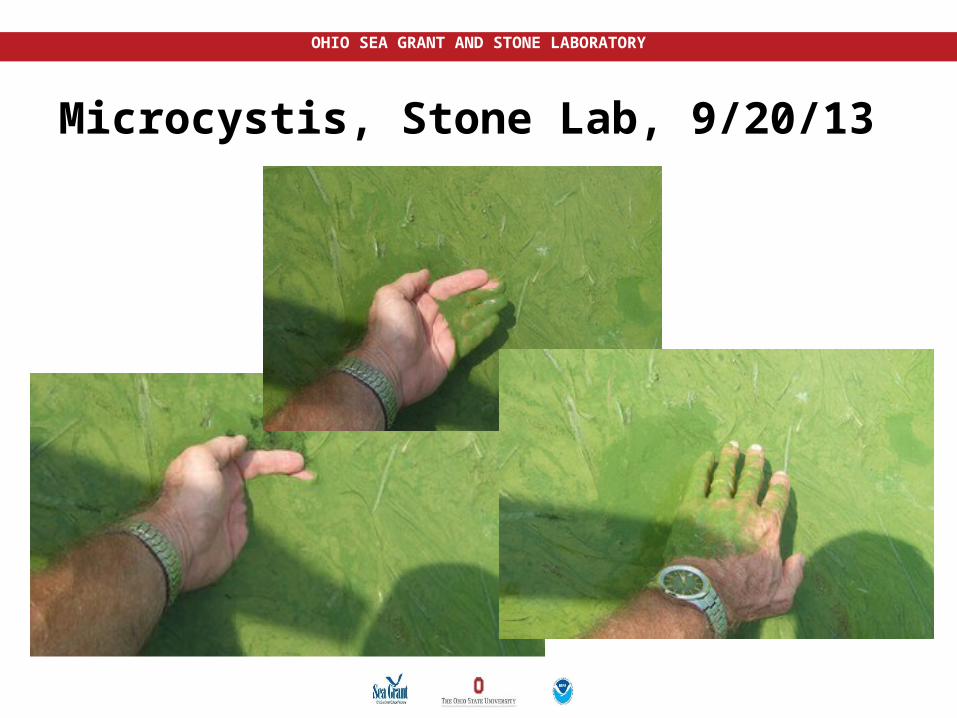
Microcystis, Stone Lab, 9/20/13
OHIO SEA GRANT AND STONE LABORATORY
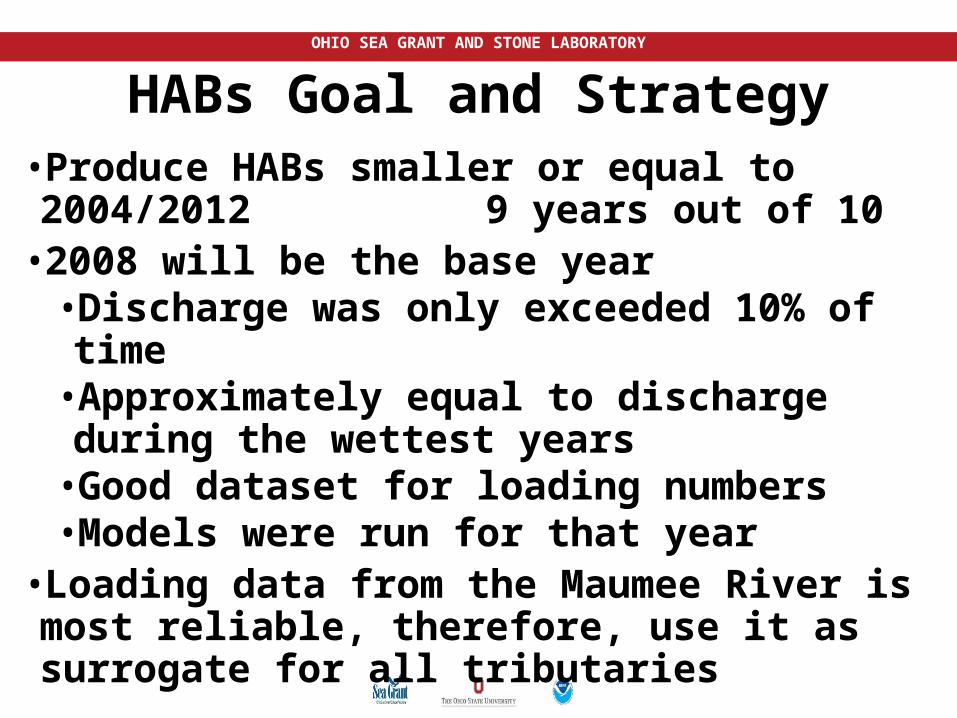
HABs Goal and Strategy•Produce HABs smaller or equal to 2004/2012 9 years out of 10
•2008 will be the base year•Discharge was only exceeded 10% of time•Approximately equal to discharge during the wettest years
•Good dataset for loading numbers•Models were run for that year
•Loading data from the Maumee River is most reliable, therefore, use it as surrogate for all tributaries
OHIO SEA GRANT AND STONE LABORATORY
HABs Strategy—Continued 1 • Western Basin HABs can be accurately forecast based
on spring P load (1 March to 31 July) from Maumee River
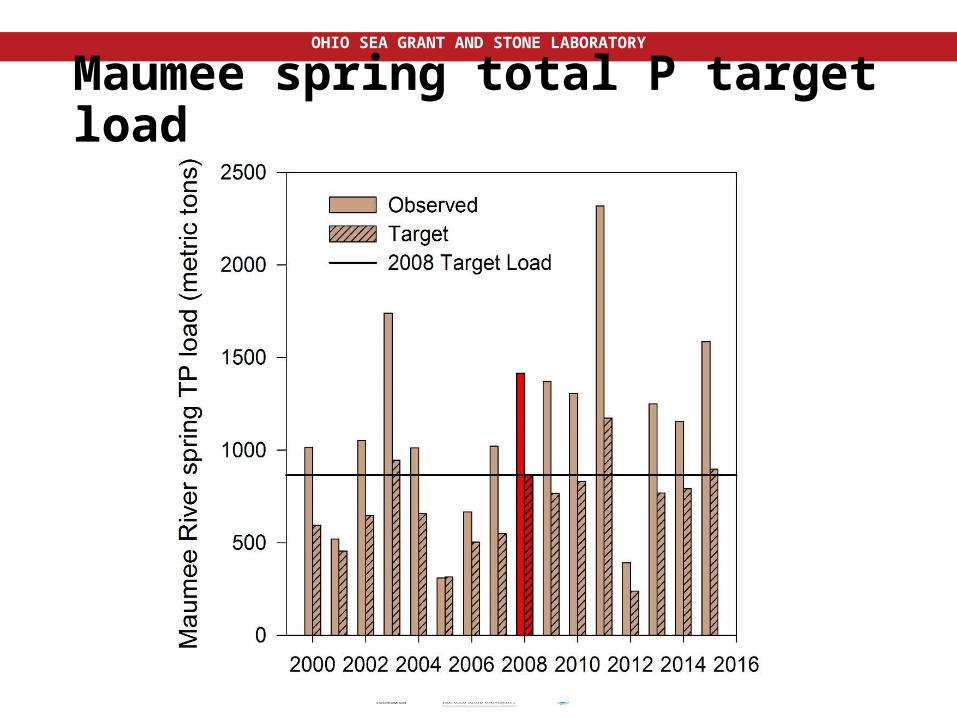
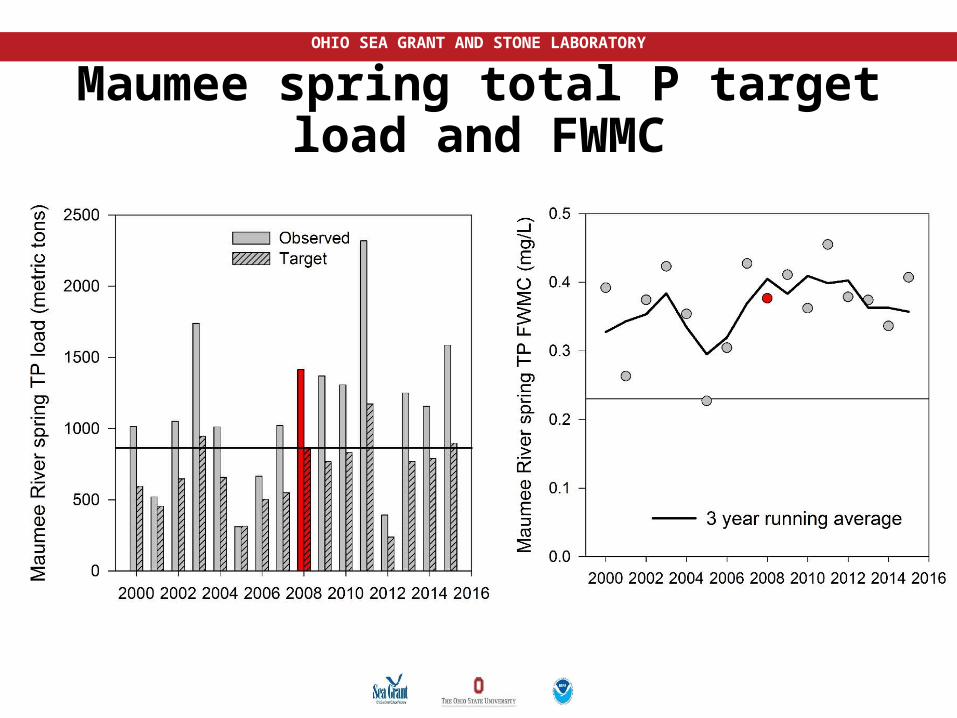
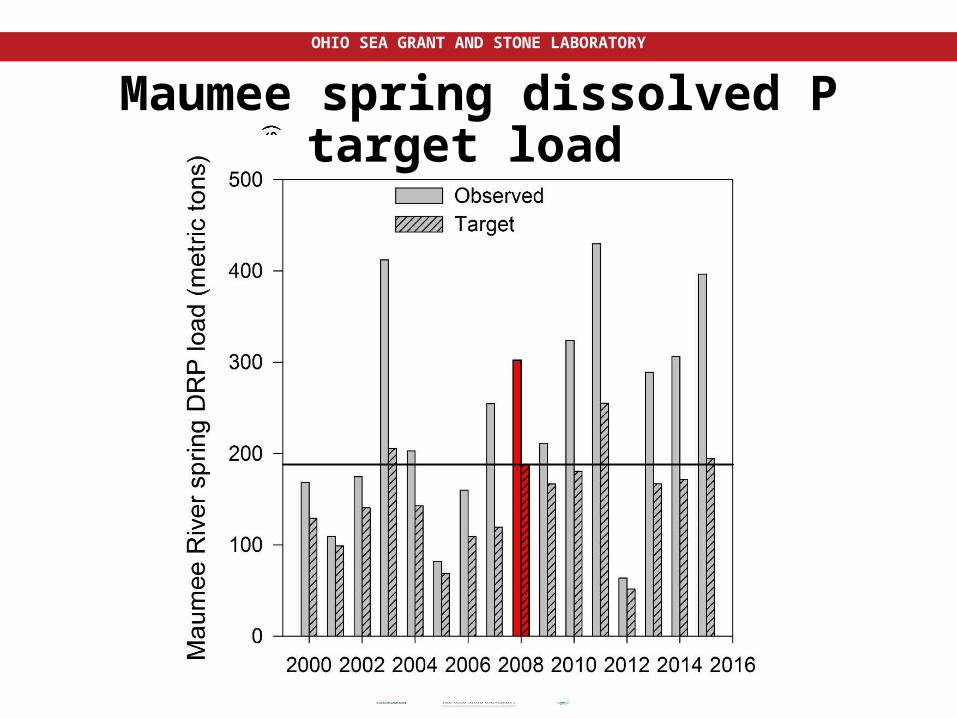
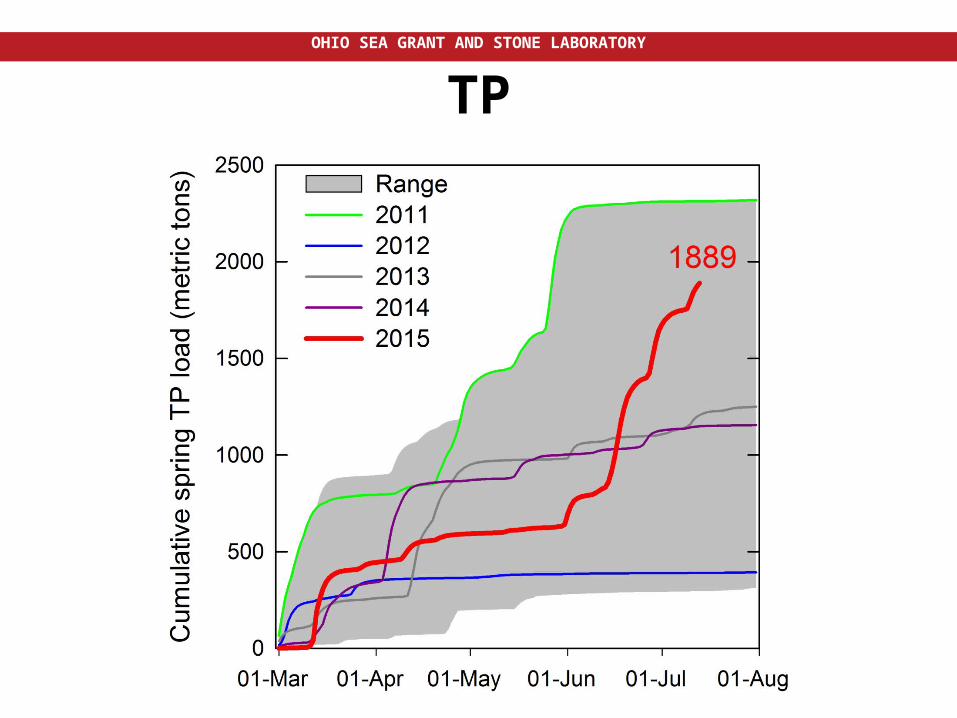
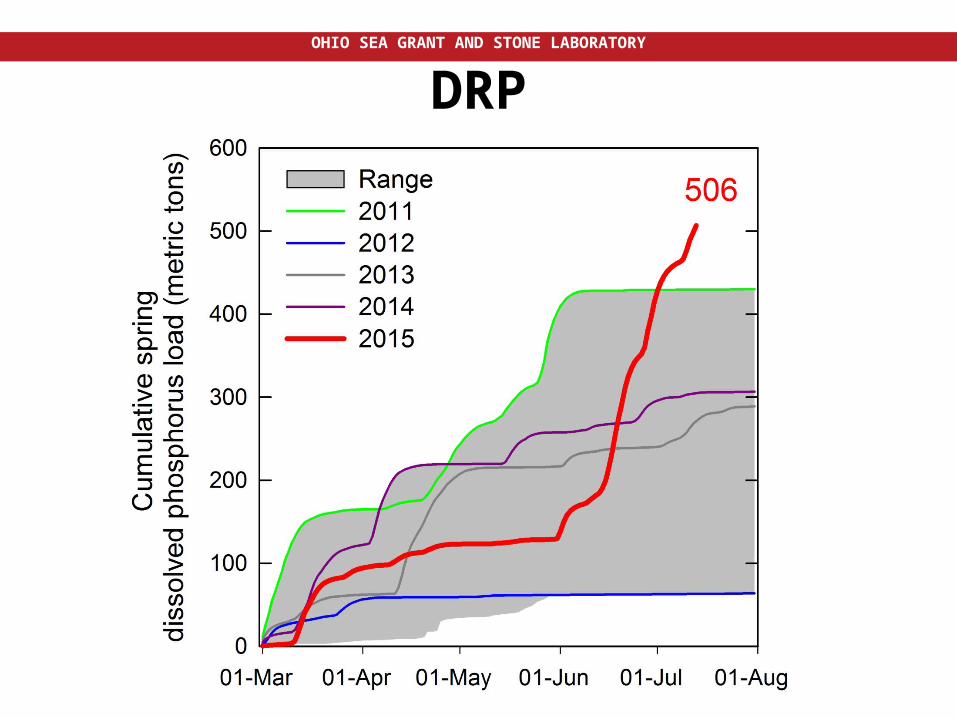
• Spring TP load of 860 tons & DRP of 186 tons (FWMC of 0.23 mg/L TP and 0.05 mg/L of DRP) or less produces desired result. That is a 40% reduction of Maumee load and FWMC in 2008.
• HABs can be observed at mouths of all Western Basin tributaries and TT believes that all tributaries contribute is some way to Western Basin HAB
• Therefore, goal should be to reduce loading from all Western Basin tributaries by 40% from their 2008 base load
OHIO SEA GRANT AND STONE LABORATORY
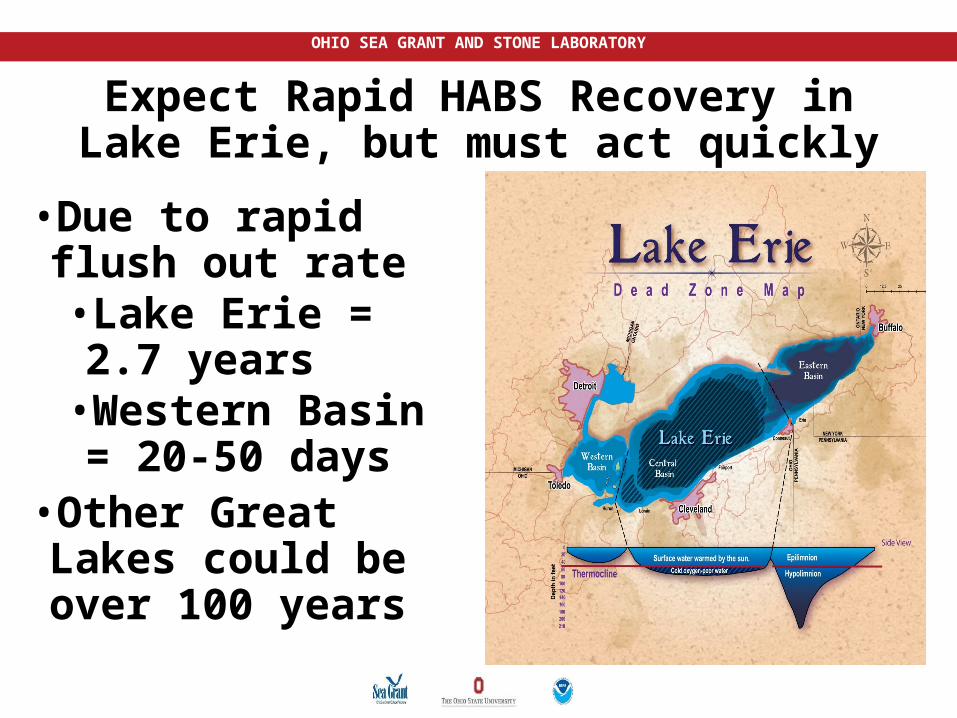
Expect Rapid HABS Recovery in Lake Erie, but must act quickly
•Due to rapid flush out rate•Lake Erie = 2.7 years•Western Basin = 20-50 days
•Other Great Lakes could be over 100 years
OHIO SEA GRANT AND STONE LABORATORY
HABs Strategy—Continued 2
•Flow Weighted Mean Concentrations of P should be used as the indicator to track our progress in achieving goals.
OHIO SEA GRANT AND STONE LABORATORY
Hypoxia Goal and Strategy
•Hypoxia occurs in the Central Basin hypolimnion and can be reduced by reducing annual P loading
•P loading to the Central Basin comes from Western Basin and Central Basin tributaries and point sources
•Reduce P loading to a point where average hypolimnetic dissolved oxygen will be 2.0 mg/l or higher
OHIO SEA GRANT AND STONE LABORATORY
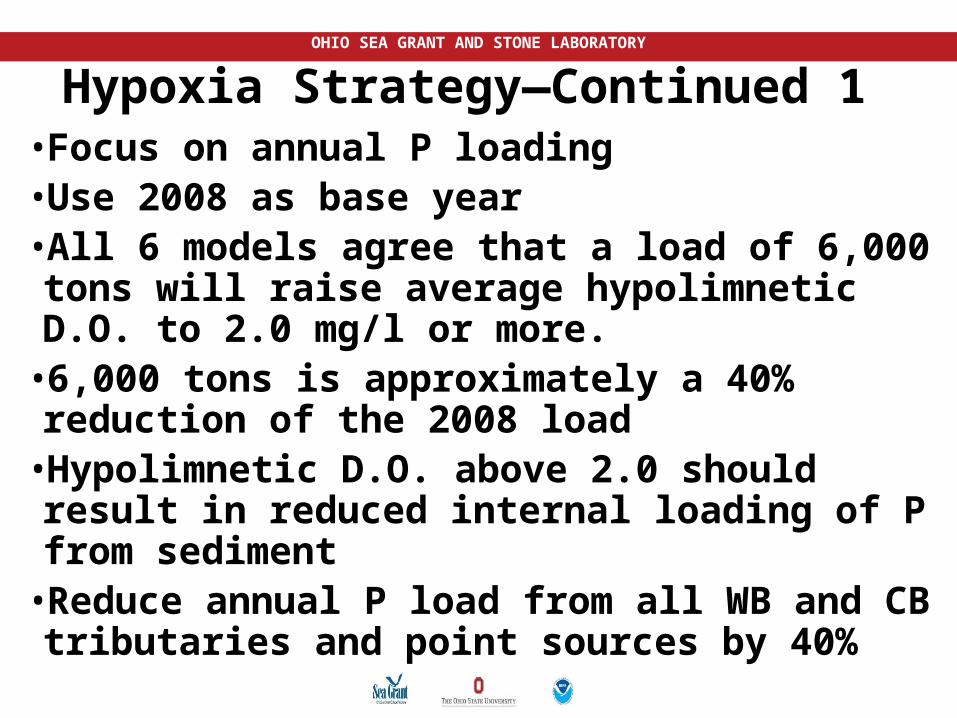
Hypoxia Strategy—Continued 1 •Focus on annual P loading•Use 2008 as base year•All 6 models agree that a load of 6,000 tons will raise average hypolimnetic D.O. to 2.0 mg/l or more.
•6,000 tons is approximately a 40% reduction of the 2008 load
•Hypolimnetic D.O. above 2.0 should result in reduced internal loading of P from sediment
•Reduce annual P load from all WB and CB tributaries and point sources by 40%

OHIO SEA GRANT AND STONE LABORATORY
13 Years of Satellite Bloom Data
OHIO SEA GRANT AND STONE LABORATORY
Maumee spring total P target load
OHIO SEA GRANT AND STONE LABORATORY
Maumee spring total P target load and FWMC
OHIO SEA GRANT AND STONE LABORATORY
Maumee spring dissolved P target load
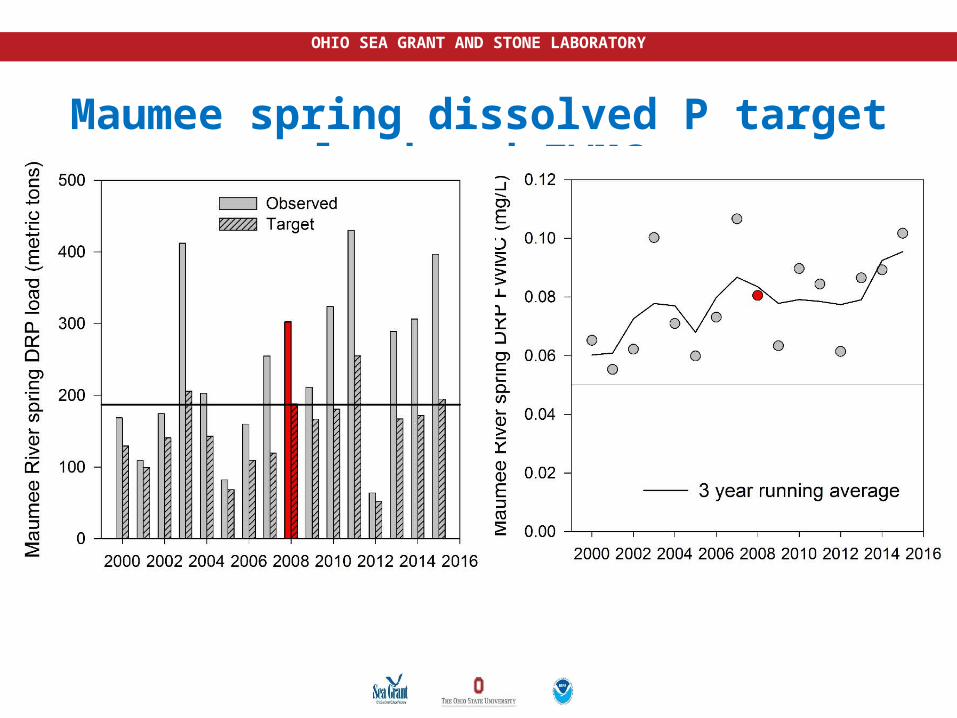
OHIO SEA GRANT AND STONE LABORATORY
Maumee spring dissolved P target load and FWMC
OHIO SEA GRANT AND STONE LABORATORYOHIO SEA GRANT AND STONE LABORATORY
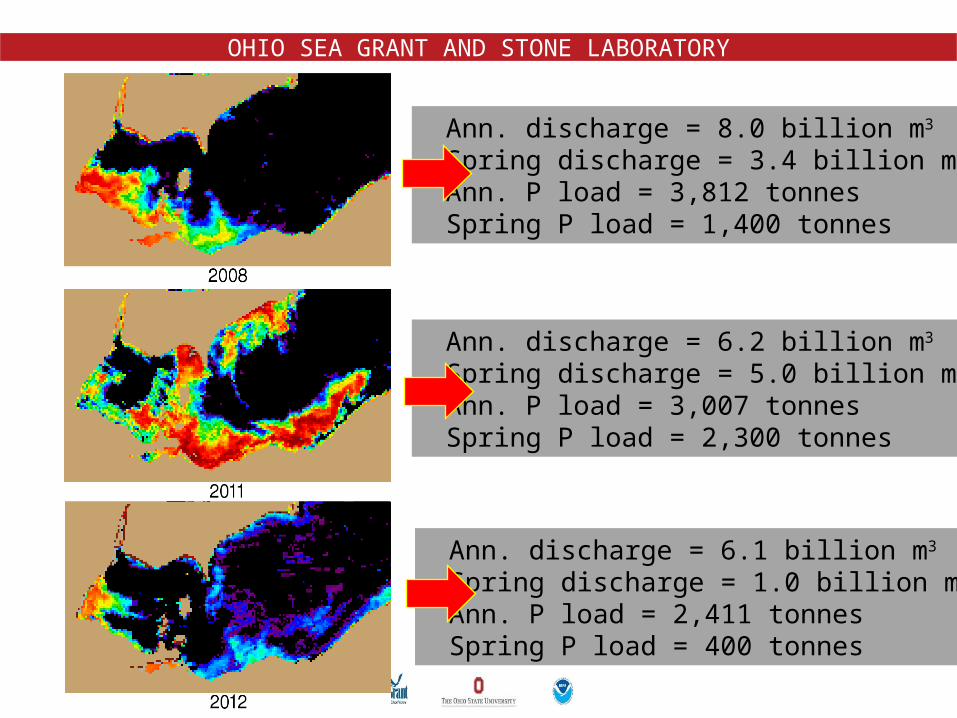
Ann. discharge = 8.0 billion m3
Spring discharge = 3.4 billion m3
Ann. P load = 3,812 tonnes Spring P load = 1,400 tonnes
Ann. discharge = 6.2 billion m3
Spring discharge = 5.0 billion m3
Ann. P load = 3,007 tonnes Spring P load = 2,300 tonnes
Ann. discharge = 6.1 billion m3
Spring discharge = 1.0 billion m3
Ann. P load = 2,411 tonnes Spring P load = 400 tonnes
OHIO SEA GRANT AND STONE LABORATORY
2015 NOAA Forecast
OHIO SEA GRANT AND STONE LABORATORY
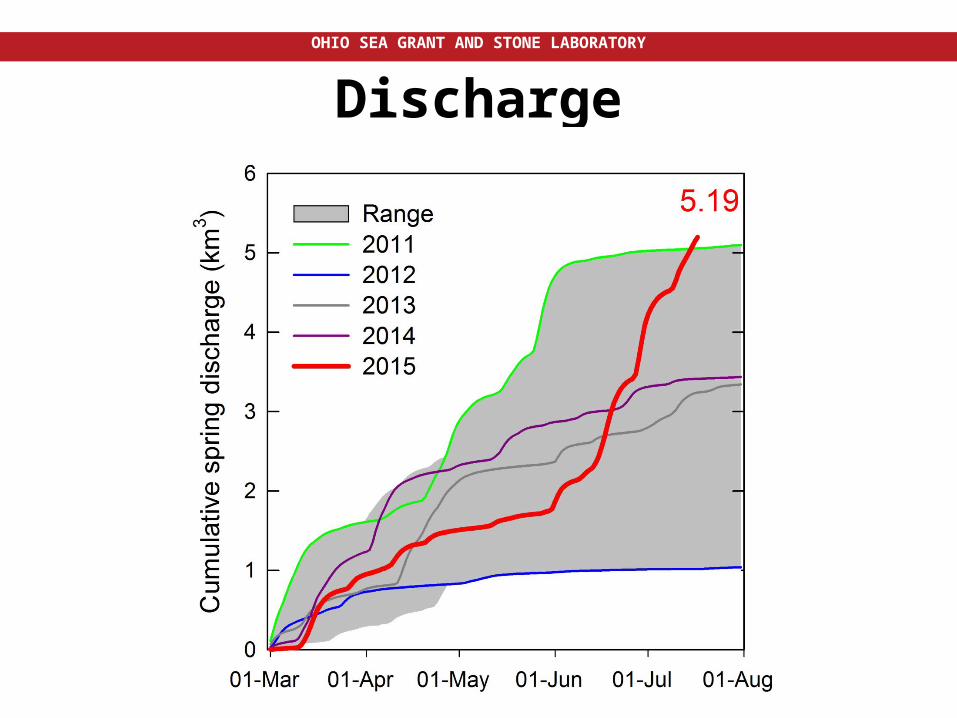
Discharge
OHIO SEA GRANT AND STONE LABORATORY
TP
OHIO SEA GRANT AND STONE LABORATORY
DRP
OHIO SEA GRANT AND STONE LABORATORY
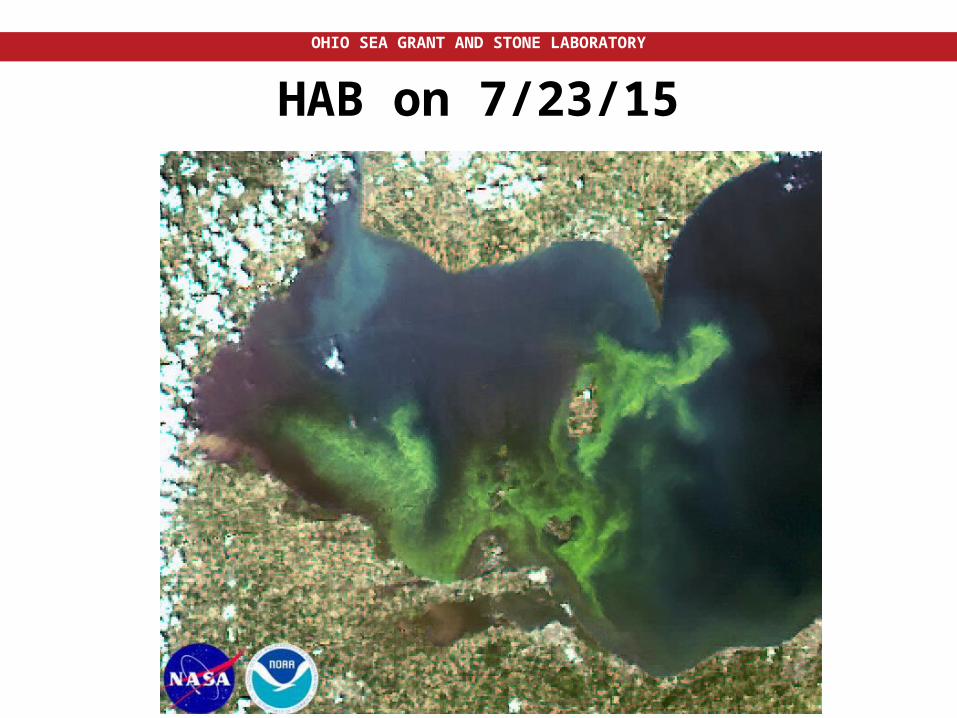
HAB on 7/23/15
OHIO SEA GRANT AND STONE LABORATORY
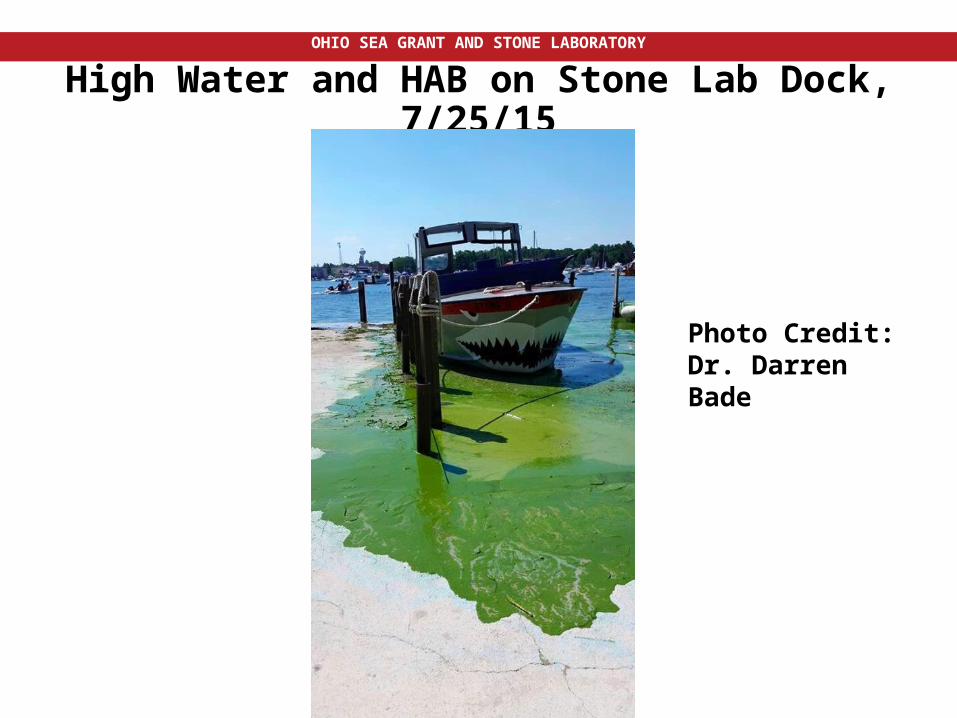
High Water and HAB on Stone Lab Dock, 7/25/15
Photo Credit: Dr. Darren Bade
OHIO SEA GRANT AND STONE LABORATORY
For more information:Dr. Jeff Reutter, Special Advisor
Ohio Sea Grant and Stone LabOhio State Univ.1314 Kinnear Rd.Col, OH [email protected]
Stone LaboratoryOhio State Univ.Box 119Put-in-Bay, OH 43456614-247-6500