Embed Size (px)
Citation preview
How can an interactive visual analytics toolhelp biomedical scientists investigategenotype-phenotype relationships?
Thesis Proposal
Defense
Erik Segerdell, DMICE MS Student
April 3, 2015
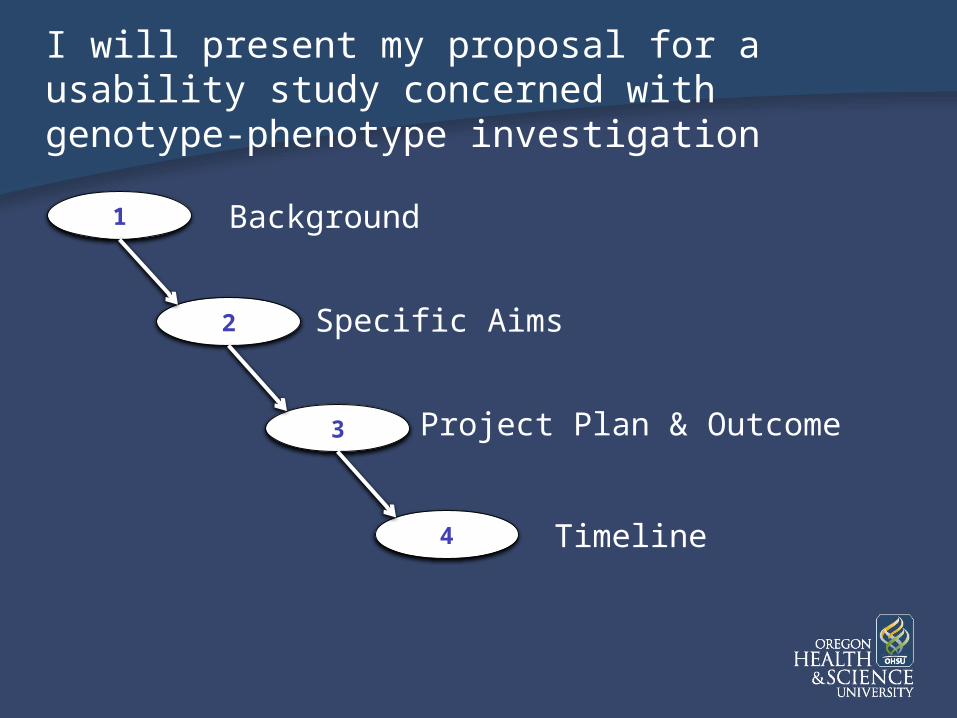
I will present my proposal for a usability study concerned with genotype-phenotype investigation
1
2
3
4
Background
Specific Aims
Project Plan & Outcome
Timeline
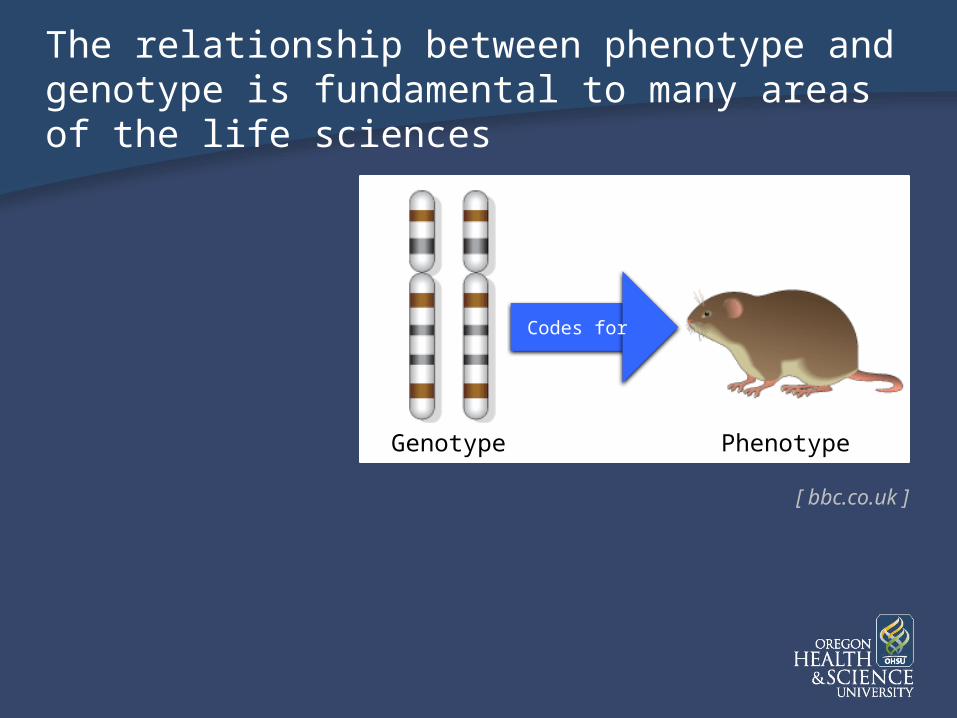
The relationship between phenotype and genotype is fundamental to many areas of the life sciences
[ bbc.co.uk ]
Genotype Phenotype
Codes for
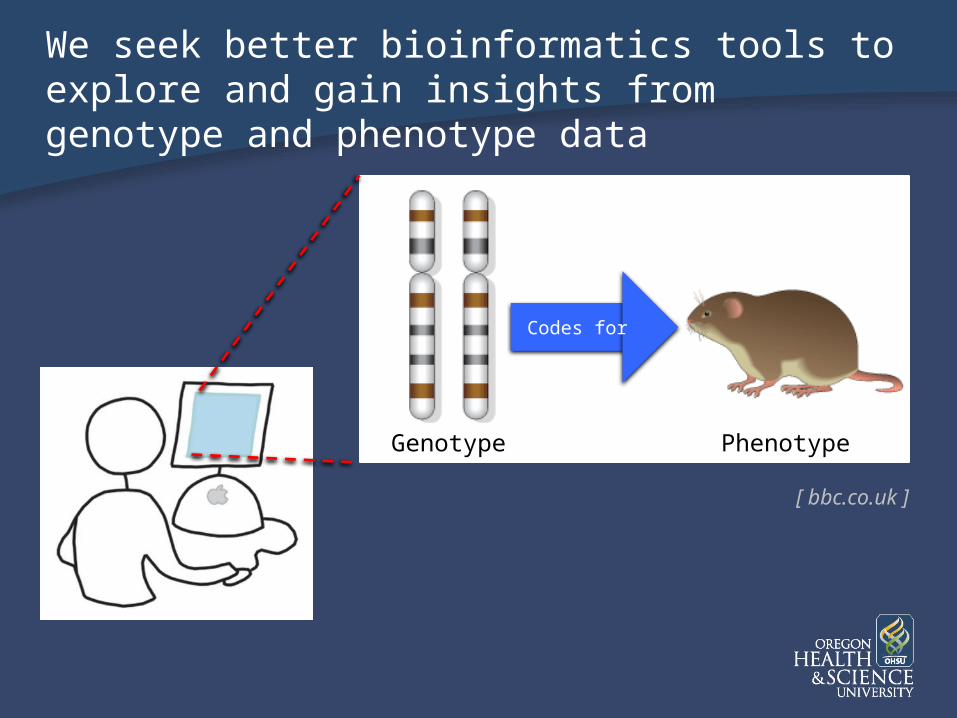
We seek better bioinformatics tools to explore and gain insights from genotype and phenotype data
Genotype Phenotype
Codes for
[ bbc.co.uk ]
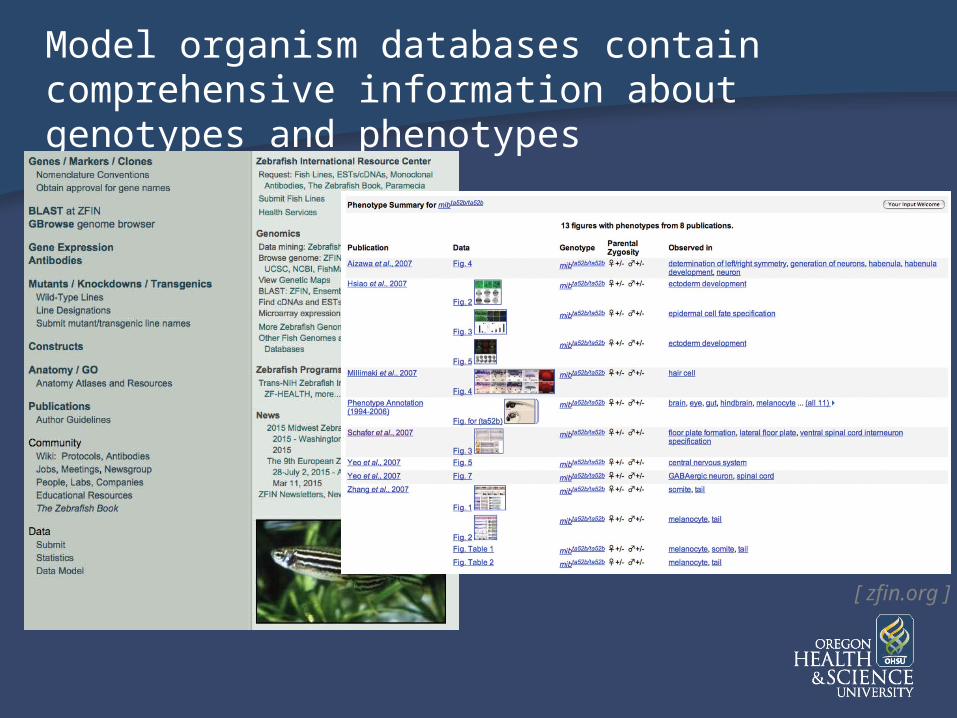
Model organism databases contain comprehensive information about genotypes and phenotypes
[ zfin.org ]
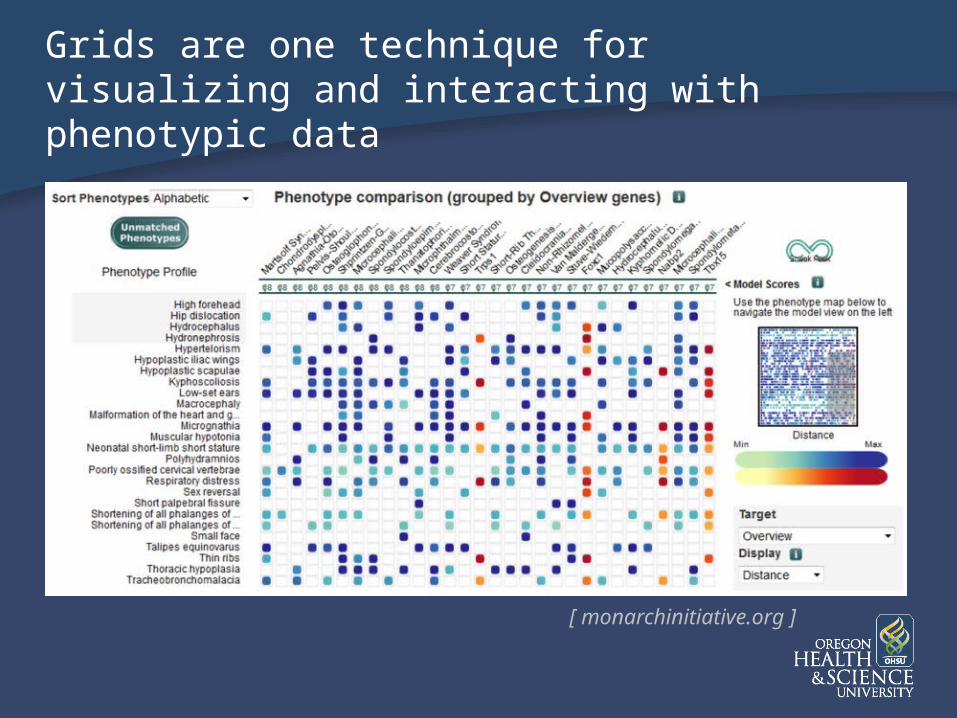
Grids are one technique for visualizing and interacting with phenotypic data
[ monarchinitiative.org ]
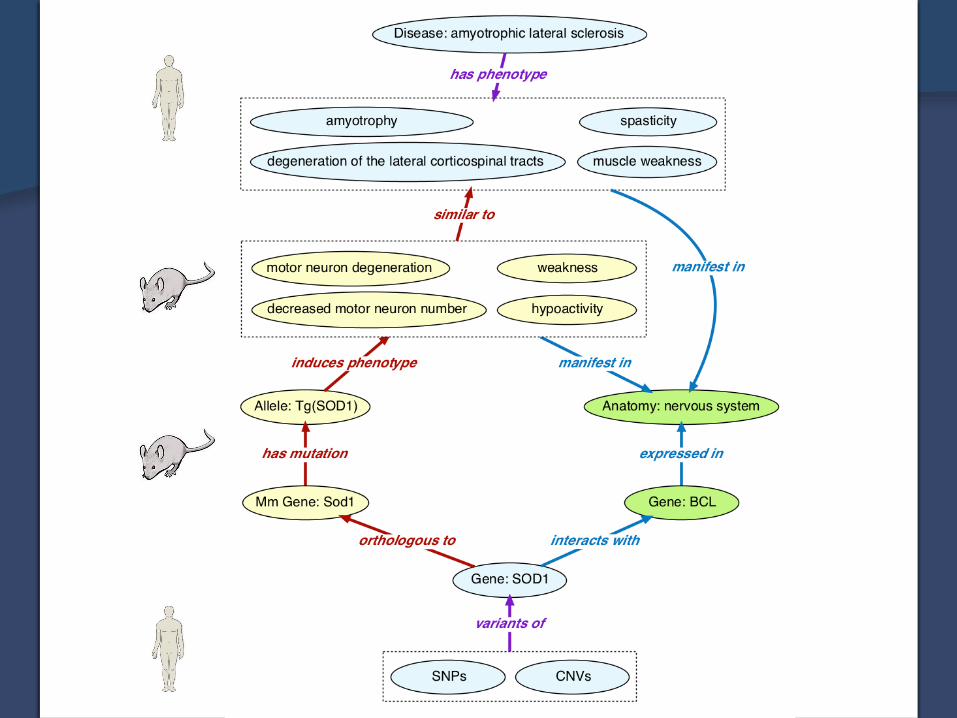
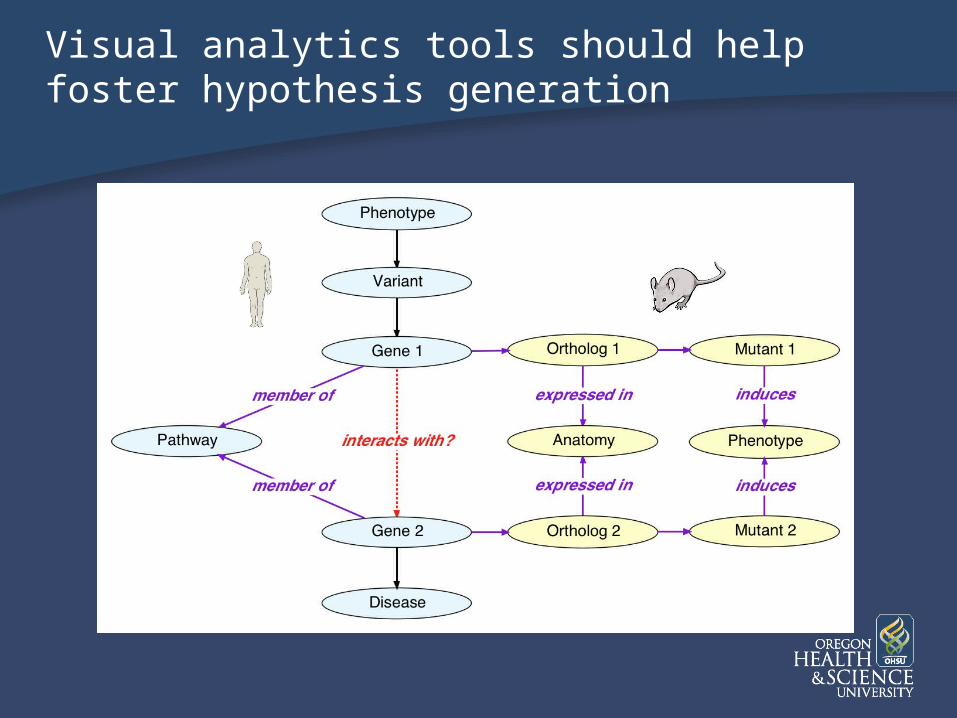
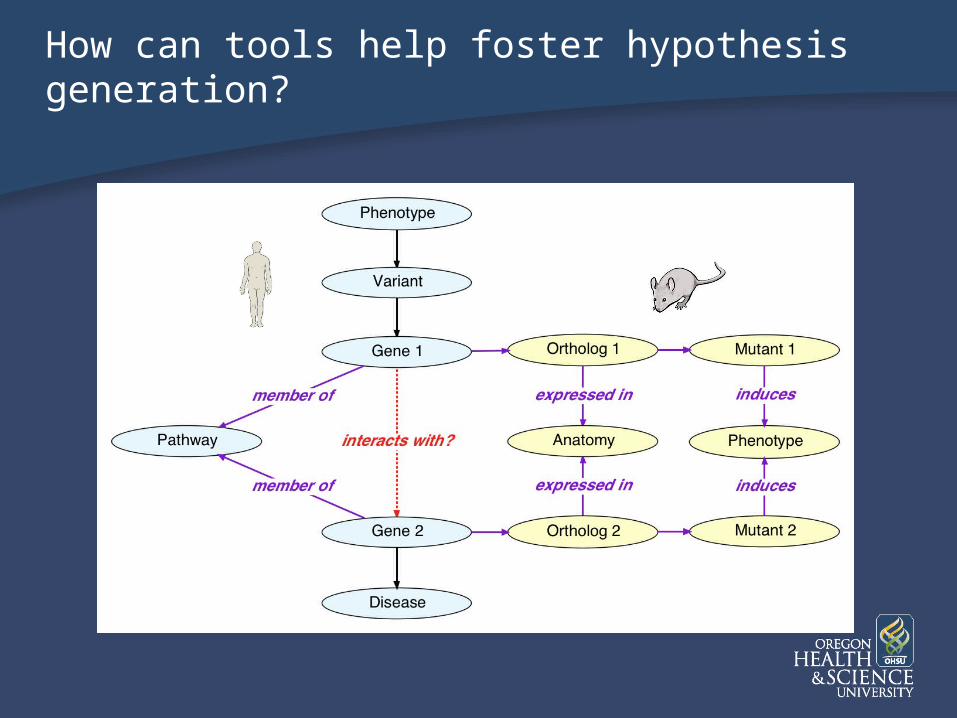
Visual analytics tools should help foster hypothesis generation
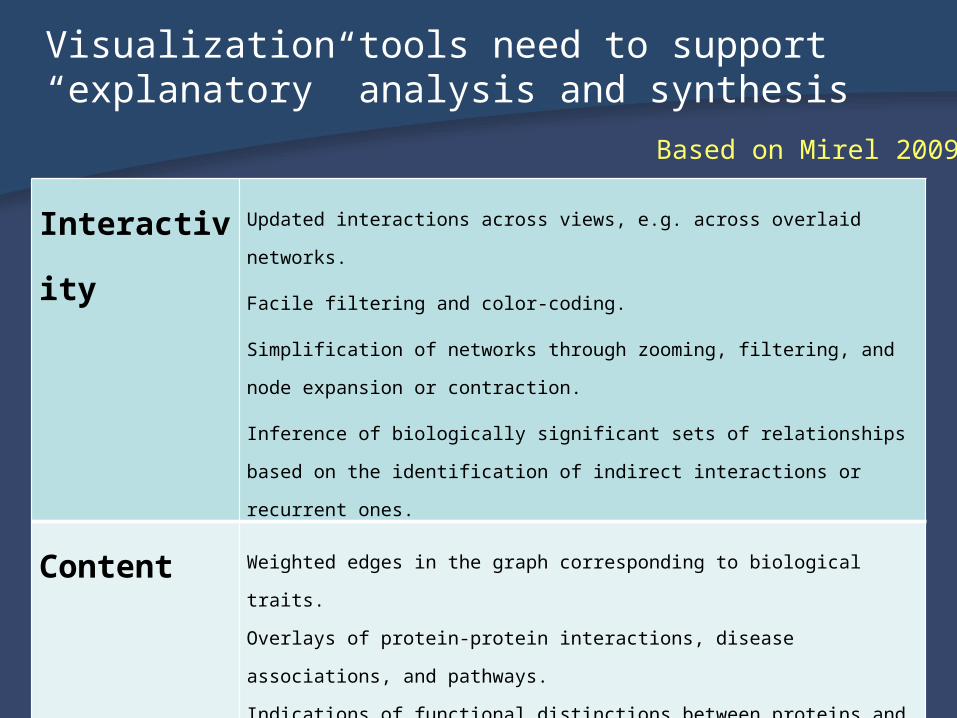
Visualization tools need to support “explanatory” analysis and synthesis
Interactivi
ty
Updated interactions across views, e.g. across overlaid networks.
Facile filtering and color-coding.
Simplification of networks through zooming, filtering, and node
expansion or contraction.
Inference of biologically significant sets of relationships based on the
identification of indirect interactions or recurrent ones.
Content Weighted edges in the graph corresponding to biological traits.
Overlays of protein-protein interactions, disease associations, and
pathways.
Indications of functional distinctions between proteins and other bio-
molecules.
Based on Mirel 2009
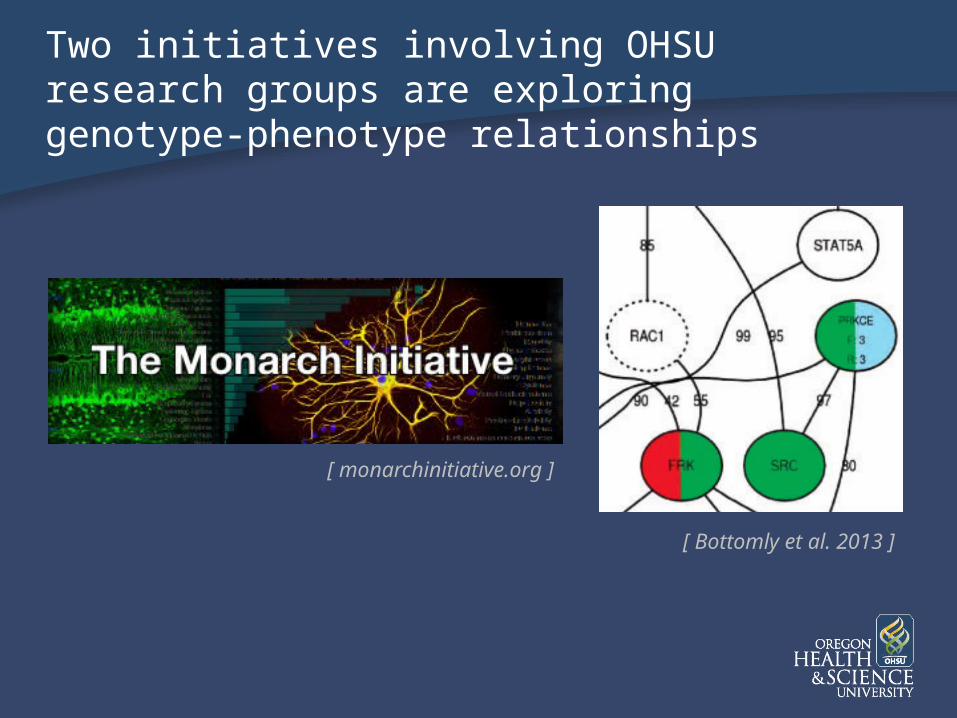
Two initiatives involving OHSU research groups are exploring genotype-phenotype relationships
[ Bottomly et al. 2013 ]
[ monarchinitiative.org ]
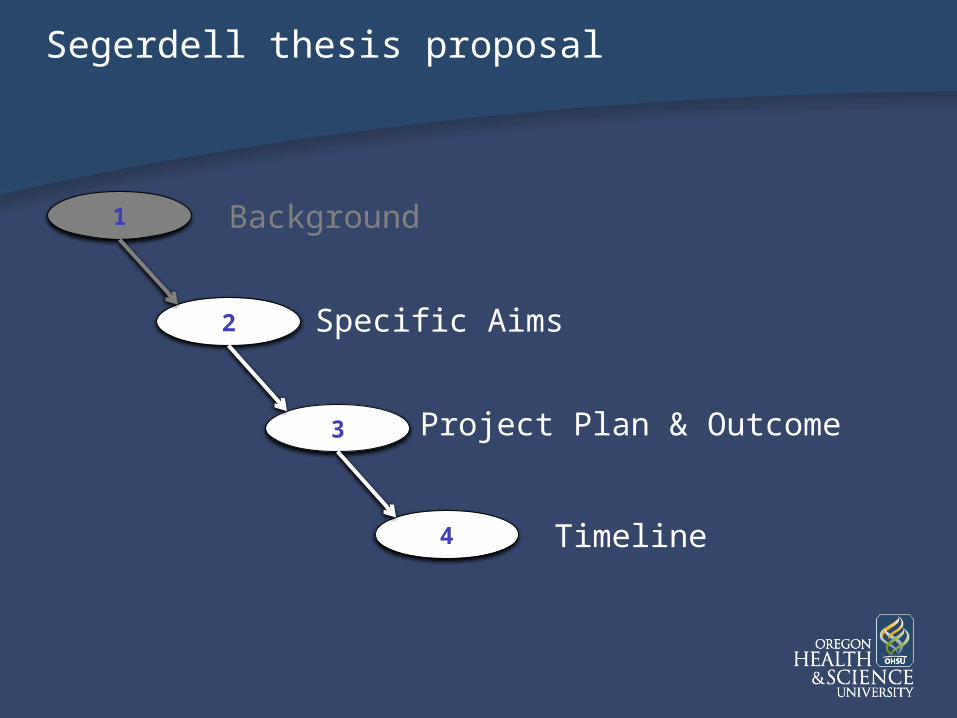
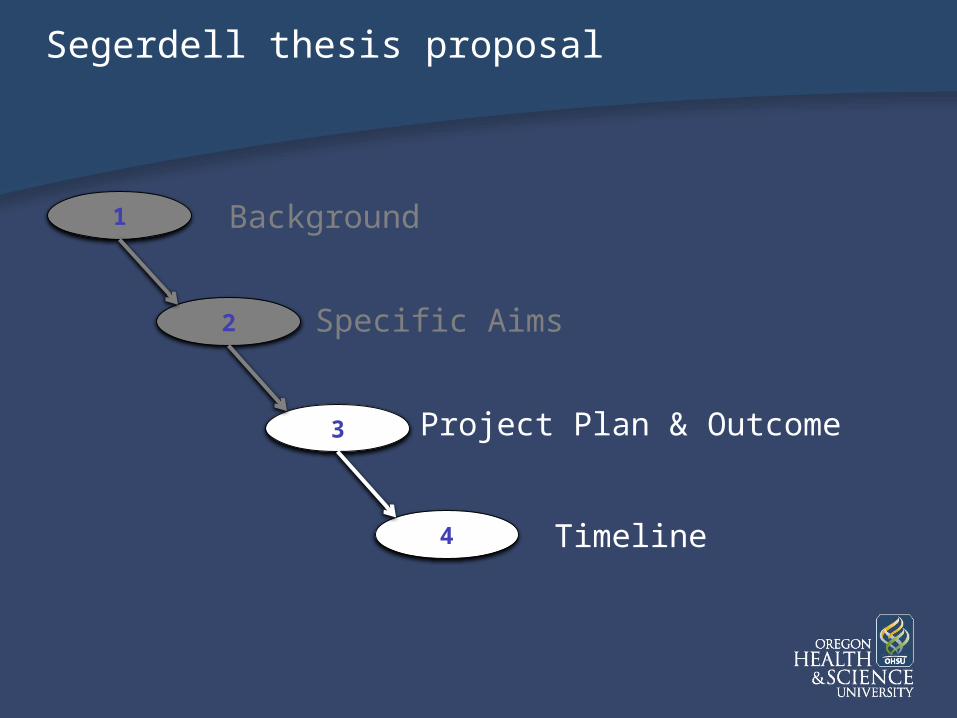
Segerdell thesis proposal
1
2
3
4
Background
Specific Aims
Project Plan & Outcome
Timeline
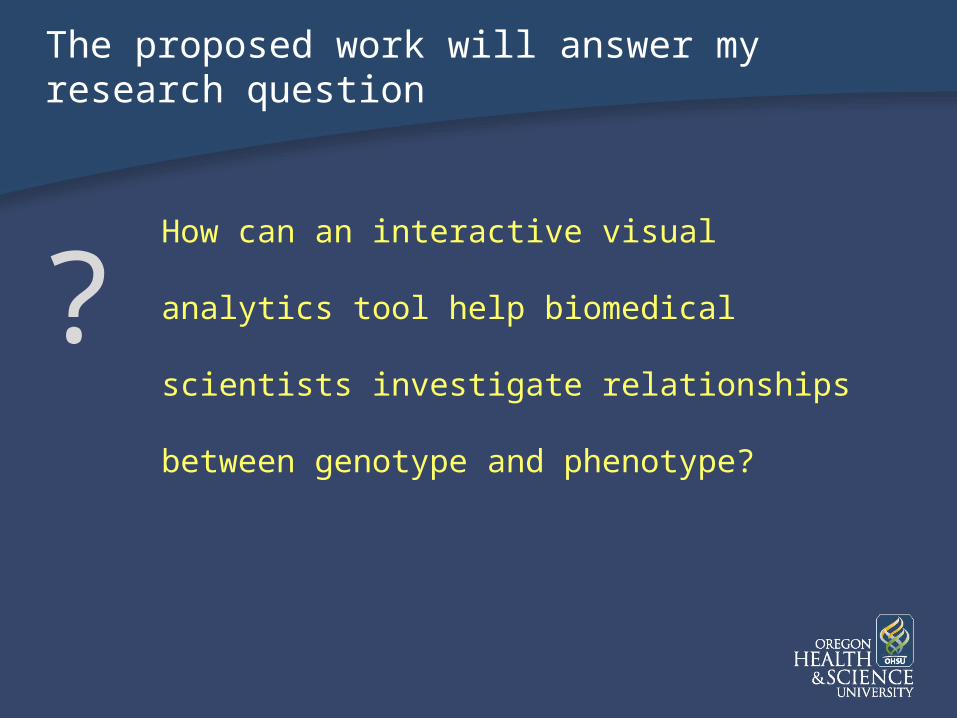
The proposed work will answer my research question
How can an interactive visual analytics tool
help biomedical scientists investigate
relationships between genotype and
phenotype?
?
How can tools help foster hypothesis generation?
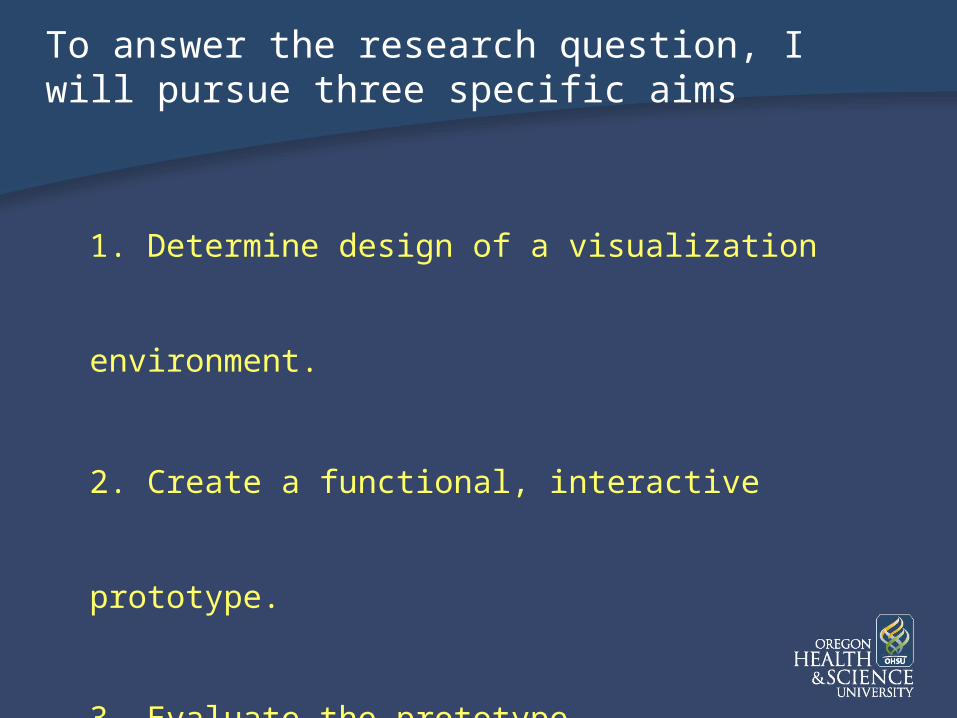
To answer the research question, I will pursue three specific aims
1. Determine design of a visualization
environment.
2. Create a functional, interactive prototype.
3. Evaluate the prototype.
Segerdell thesis proposal
1
2
3
4
Background
Specific Aims
Project Plan & Outcome
Timeline
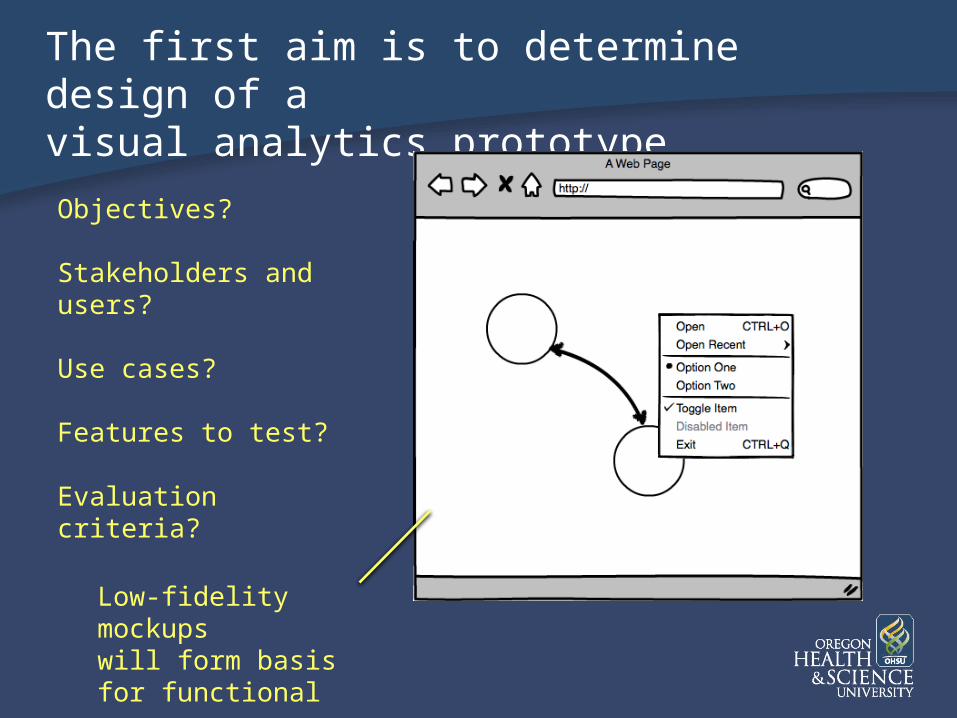
The first aim is to determine design of avisual analytics prototype
Objectives?
Stakeholders and users?
Use cases?
Features to test?
Evaluation criteria?
Low-fidelity mockupswill form basis for functional ones.
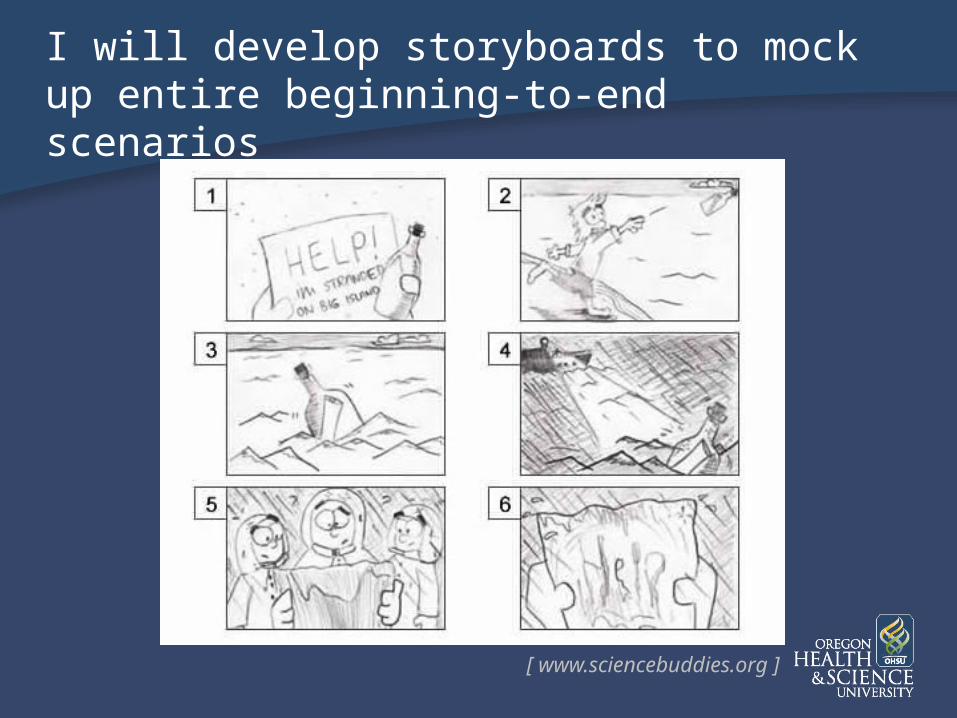
I will develop storyboards to mock up entire beginning-to-end scenarios
[ www.sciencebuddies.org ]
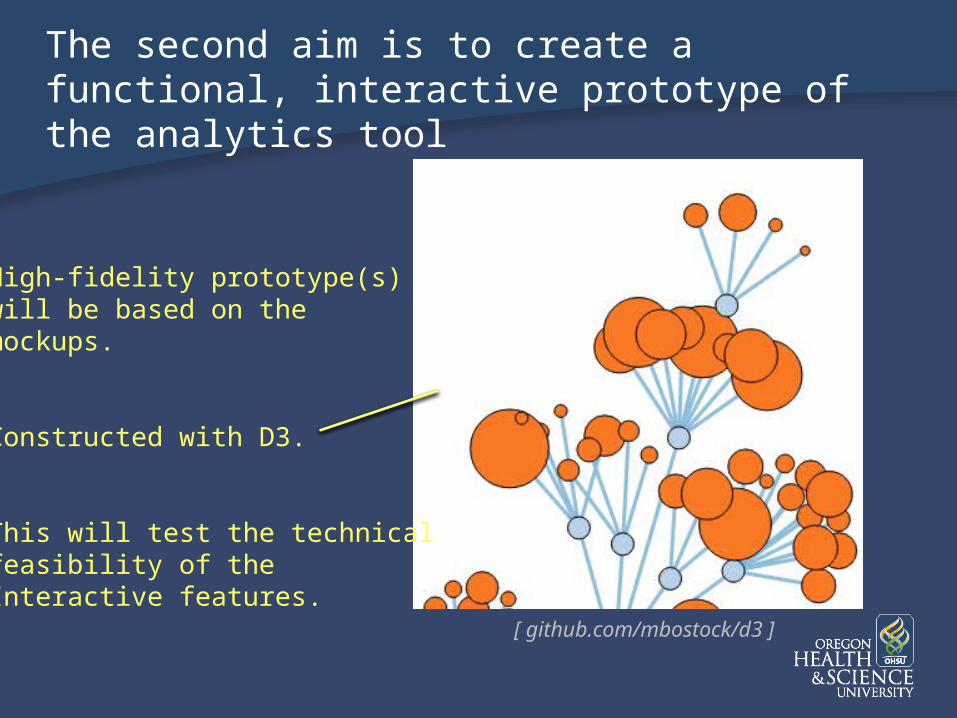
The second aim is to create a functional, interactive prototype of the analytics tool
High-fidelity prototype(s)will be based on themockups.
Constructed with D3.
This will test the technicalfeasibility of theInteractive features.
[ github.com/mbostock/d3 ]
The third aim is to evaluate the usability of the prototypes
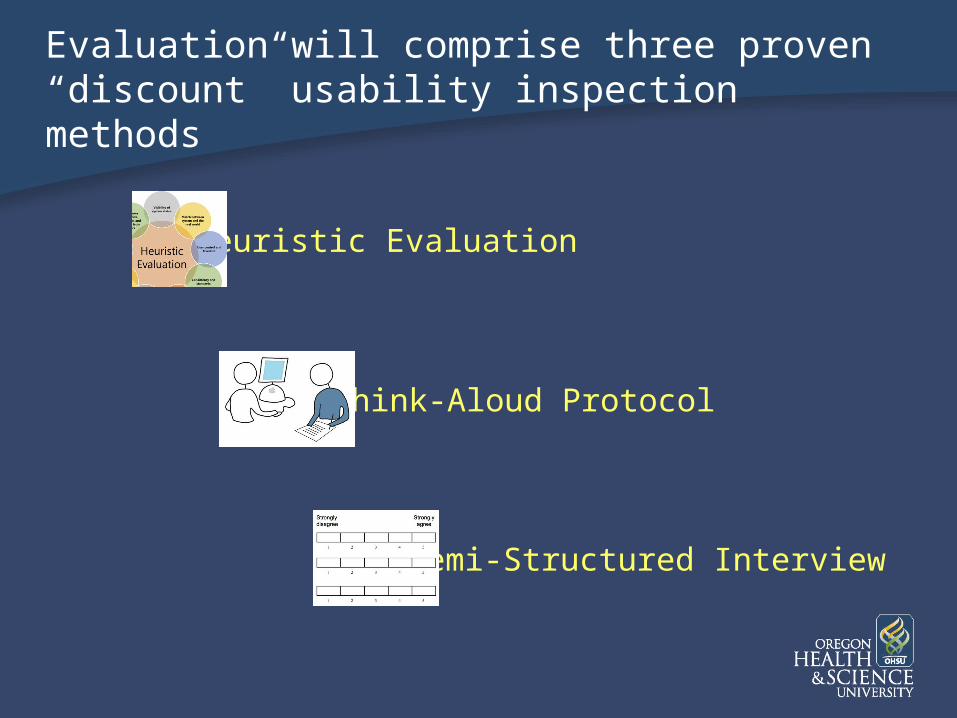
Evaluation will comprise three proven “discount” usability inspection methods
Think-Aloud Protocol
Semi-Structured Interview
Heuristic Evaluation
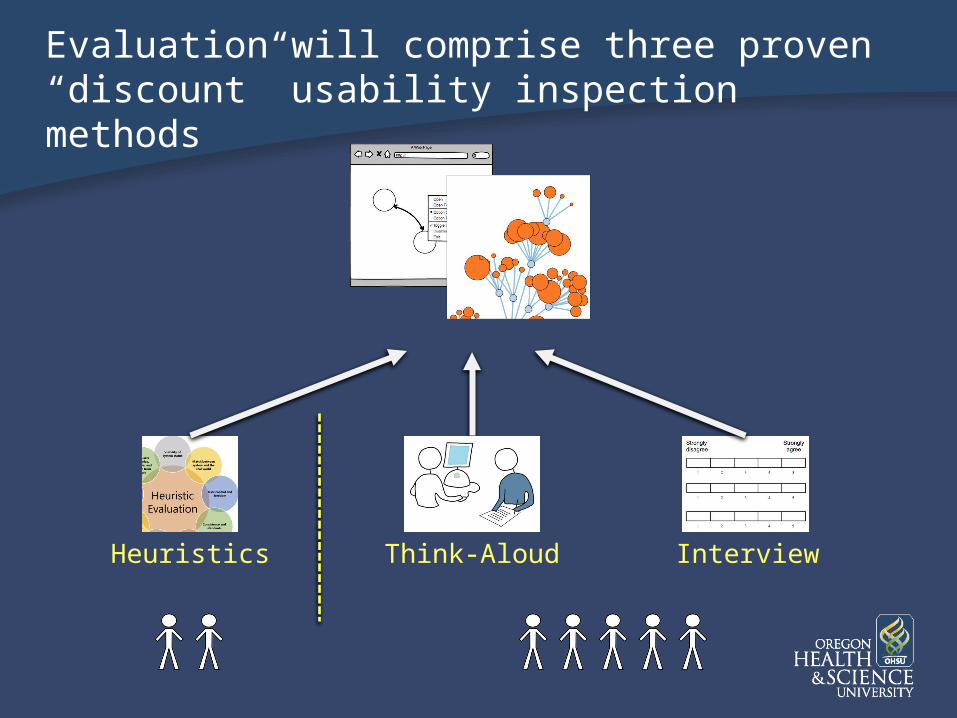
Evaluation will comprise three proven “discount” usability inspection methods
InterviewHeuristics Think-Aloud
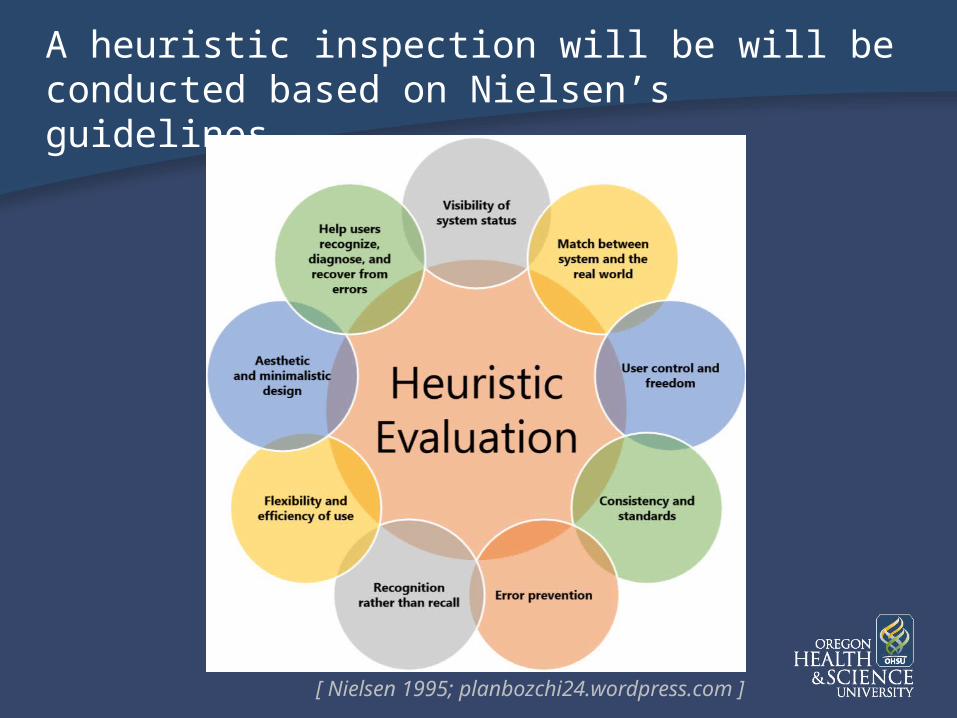
A heuristic inspection will be will be conducted based on Nielsen’s guidelines
[ Nielsen 1995; planbozchi24.wordpress.com ]
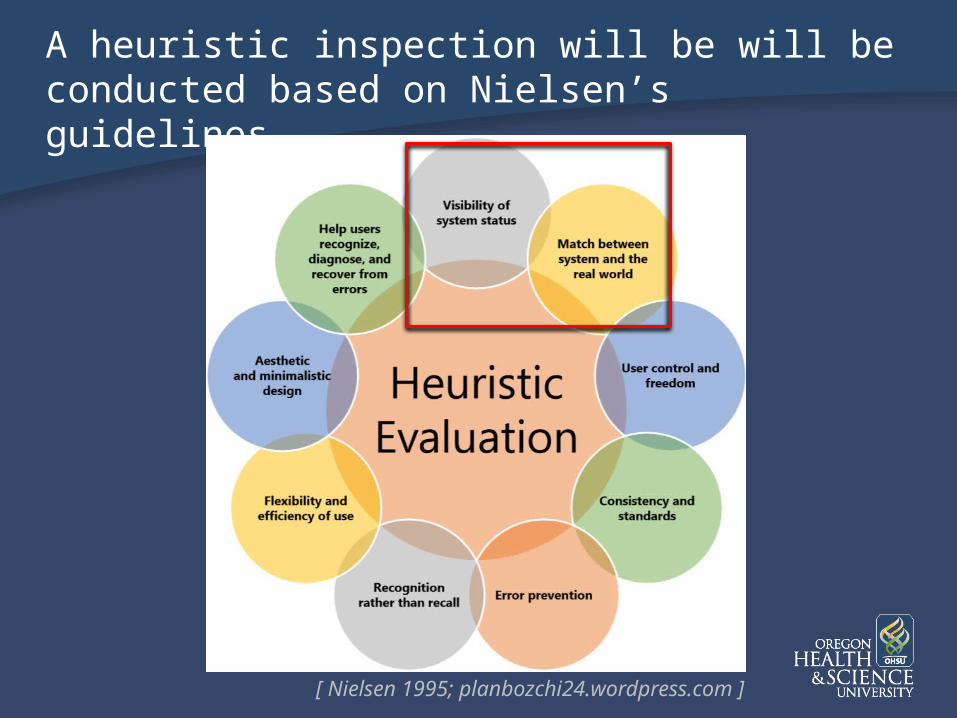
A heuristic inspection will be will be conducted based on Nielsen’s guidelines
[ Nielsen 1995; planbozchi24.wordpress.com ]
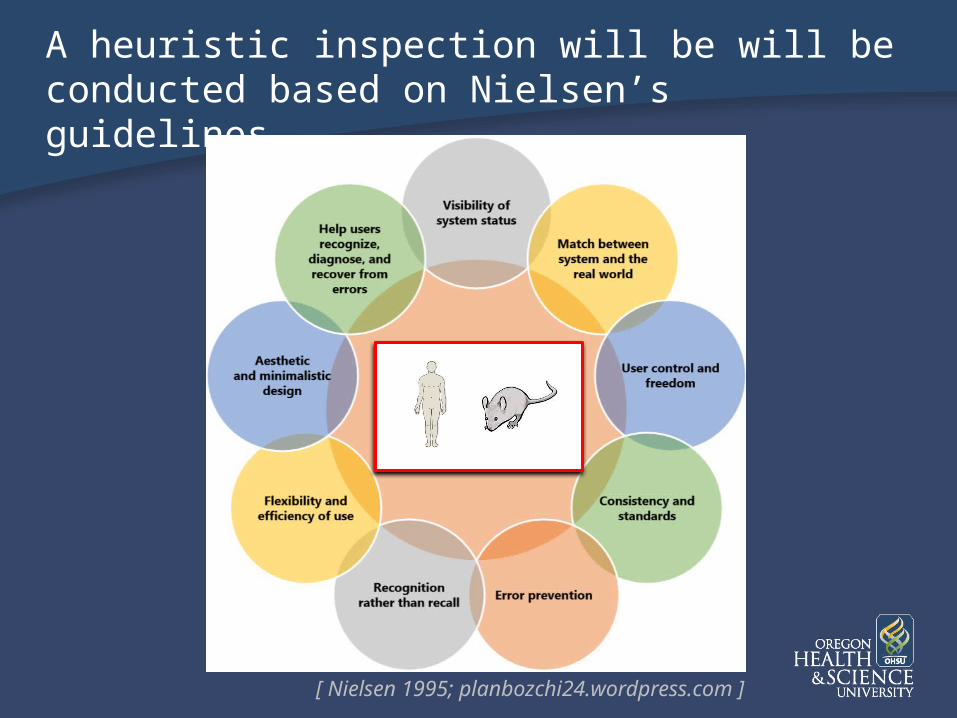
A heuristic inspection will be will be conducted based on Nielsen’s guidelines
[ Nielsen 1995; planbozchi24.wordpress.com ]
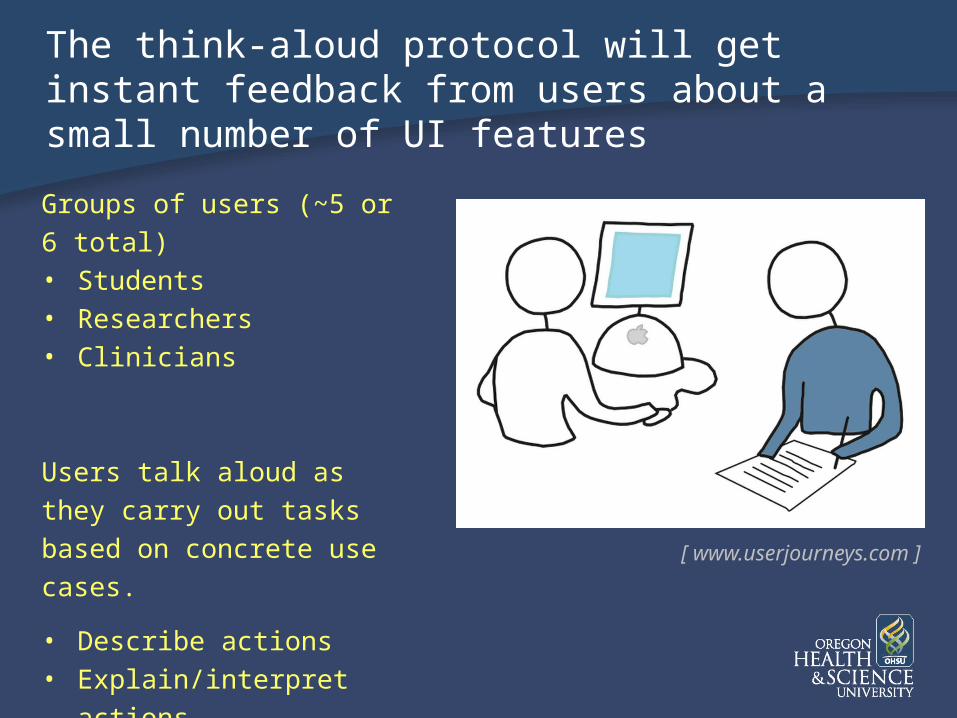
The think-aloud protocol will get instant feedback from users about a small number of UI features
Groups of users (~5 or 6 total)• Students• Researchers• Clinicians
Users talk aloud as they carry out tasks based on concrete use cases.
• Describe actions• Explain/interpret actions
[ www.userjourneys.com ]
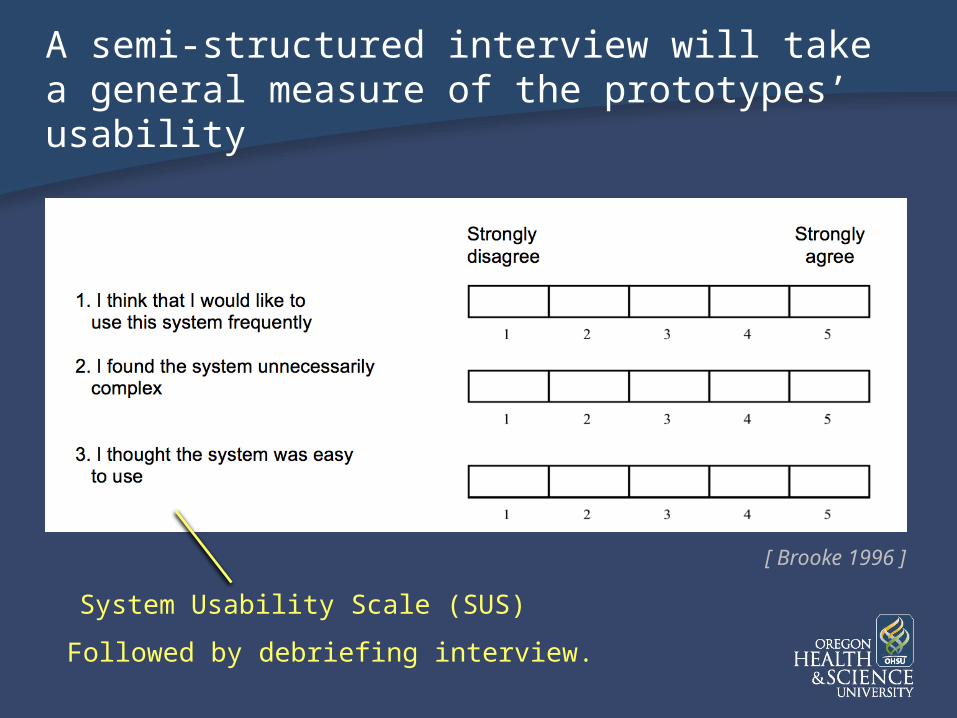
A semi-structured interview will take a general measure of the prototypes’ usability
[ Brooke 1996 ]
System Usability Scale (SUS)
Followed by debriefing interview.
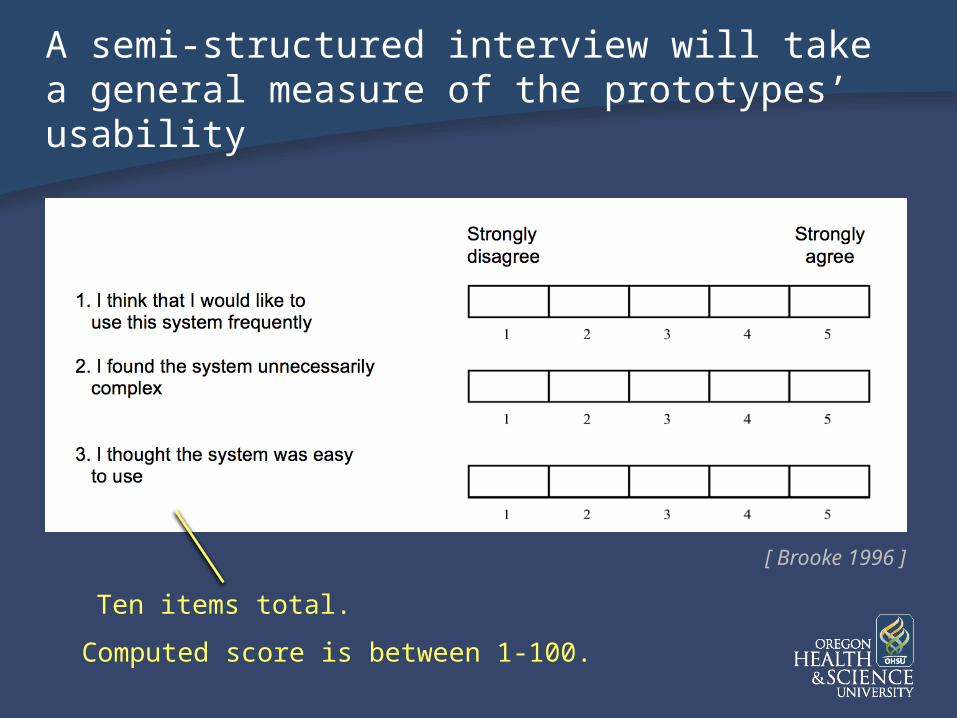
A semi-structured interview will take a general measure of the prototypes’ usability
Ten items total.
Computed score is between 1-100.
[ Brooke 1996 ]
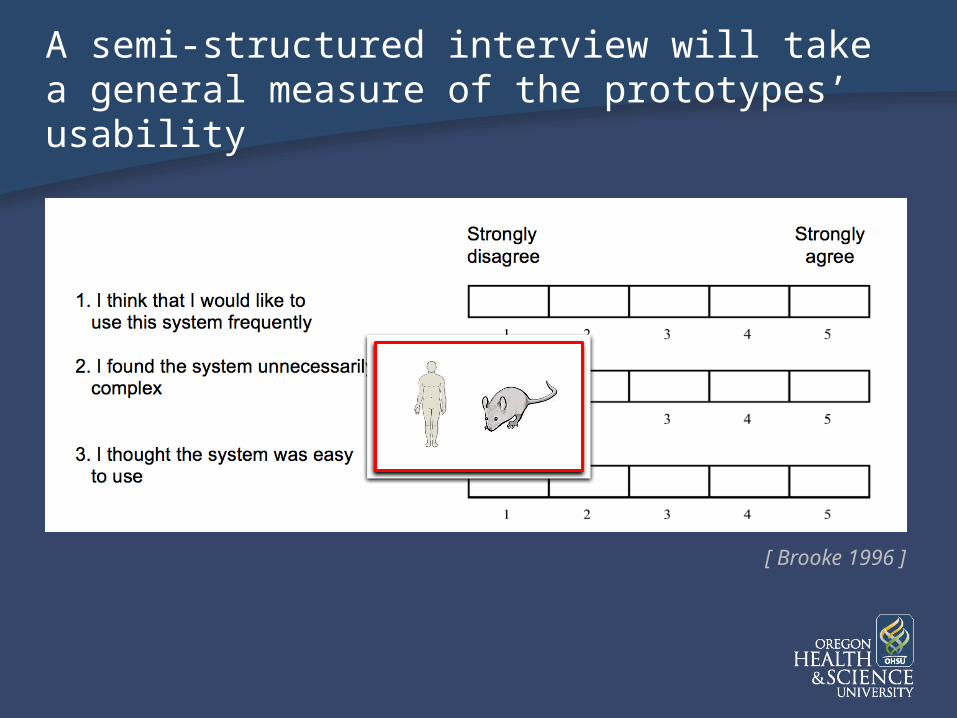
A semi-structured interview will take a general measure of the prototypes’ usability
[ Brooke 1996 ]
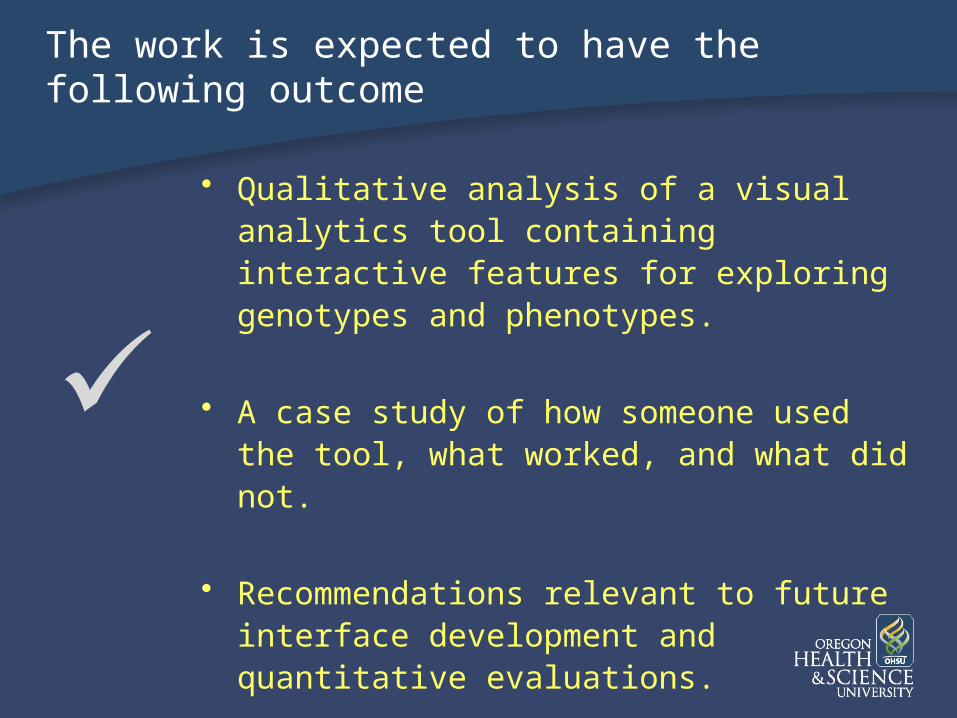
The work is expected to have the following outcome
• Qualitative analysis of a visual analytics tool containing interactive features for exploring genotypes and phenotypes.
• A case study of how someone used the tool, what worked, and what did not.
• Recommendations relevant to future interface development and quantitative evaluations.
✓
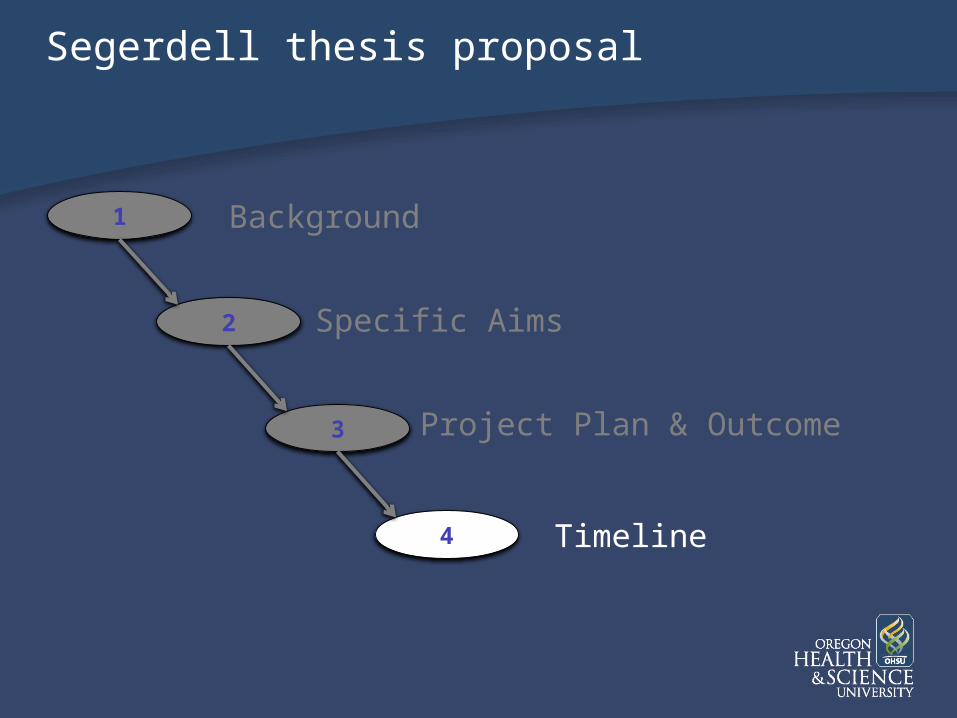
Segerdell thesis proposal
1
2
3
4
Background
Specific Aims
Project Plan & Outcome
Timeline
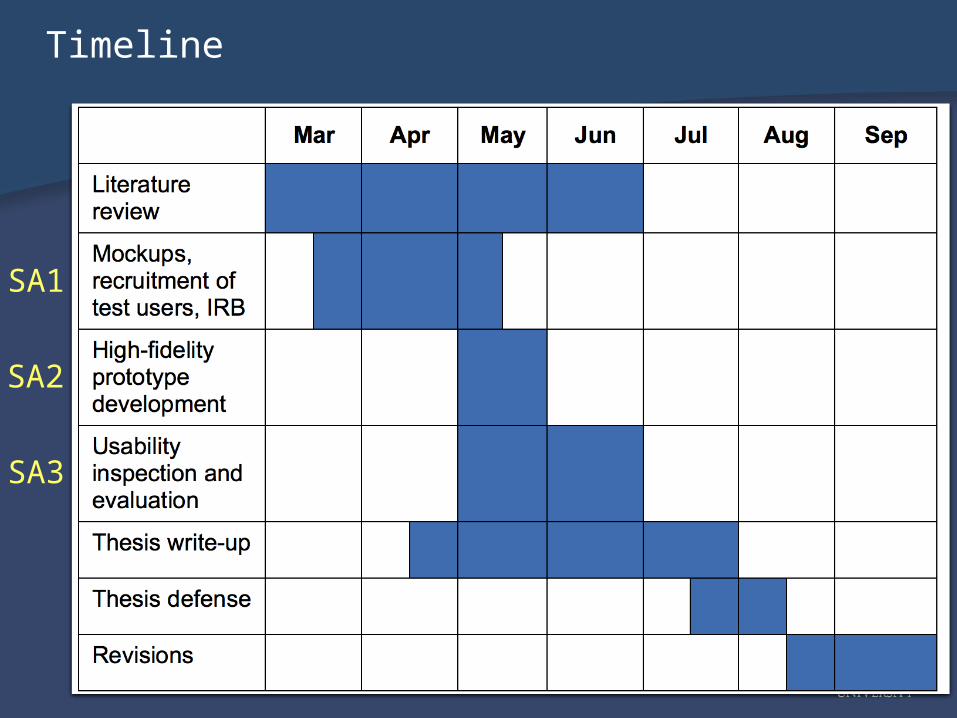
Timeline
SA1
SA2
SA3
Acknowledgments
Thesis Advisory Committee
• Beth Wilmot, PhD• Melissa Haendel, PhD• Harry Hochheiser, PhD• Michelle Hribar, PhD
Colleagues
• Monarch Initiative• Bioinformatics Shared
Resource, KCI• Ontology
Development Group, OHSU Library
• DMICE Faculty & Staff