Embed Size (px)
Citation preview

Taking an ancient path toward Artificial Intelligence
Arend HintzeDepartment of Integrative BiologyDepartment of Computer Science and EngineeringBEACON Center for studying evolution in actionMichigan State University

The idea of computation
Whitehead &
Russell ~1910
2a = b
true true“rule”
a = b/2divide by 2
truetrue
true
axiom
formal process of proof:

Principia Mathematica
axiom
true
true
true
true
true
true
true
true
true
Kurt Gödel: I am true, but not provable

Turing and the Enigma
“XTYENSODNEADF…”“Attack at dawn…”
“Need refueling soon”
“TEHDIENENEEE”
possible mappings:

universal computation
every possible mapping
all possible mappings:
“AAAAAAA” “AAAAAAB”
… “ZZZZZZZY” “ZZZZZZZZ”
Any:“AAAAAAA” “AAAAAAB”
… “ZZZZZZZY” “ZZZZZZZZ”
Any:
Konrad Zuse

your brain is just a process …
find:

the 60s, 70s, and 80s (and maybe the 90s)
machine intelligence

AI after 2001…

software engineering how to find:
reverse engineering!

expert system vs. artificial intelligence (that I want)
• specific goal
• well defined boundary cases
• single purpose
• very vague goal
• no boundary case
• multi purpose
• does change during its lifetime
vs

engineering vs. evolution

What to evolve?

What to evolve?
grammar L system code ANN genetic
programmingMarkov Model
-unpredictablemutational
effectrange
-almost all mutationsdeleterious
-explodingnumber
of weightsto optimize
-fixed topology
-over growth -hardto train
-no boundon hidden
states
-Baum WelchFix:evolvable code
Fix:NEAT
Fix:pruning

Probabilistic Logic Gates
1
11
1
1
90% 1 10% 0
FUZZY MORE MODULAR

evolvable encoding

does it scale?282 (302)
~100,000
~250,000
~1,000,000
~71,000,000
~86,000,000,000

one Markov Gate is a group of neurons
≠=MARKOV GATE

Darwin vs. DARPA
Synapse ~97% accuracy 250.000 neurons
~1.000.000.000 transistors dedicated neuromorphic chip
Markov Brains ~93%-96% accuracy
~1000 deterministic gates
hardware from late 70s
~4500 transistors intel 8088
Dave Knoester Samuel Chapman
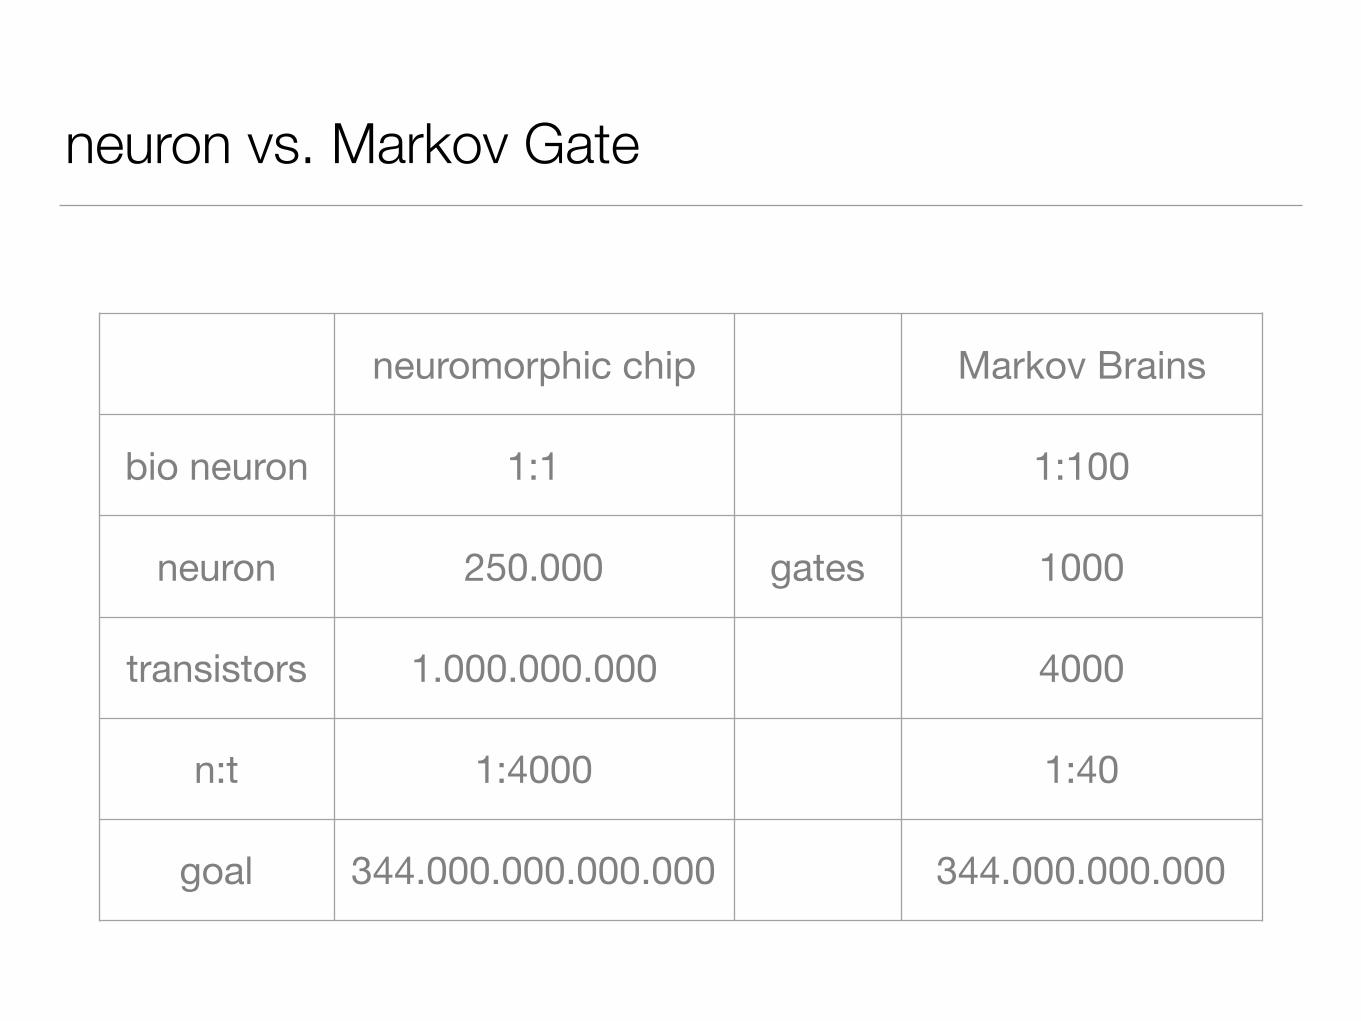
neuron vs. Markov Gate
neuromorphic chip Markov Brains
bio neuron 1:1 1:100
neuron 250.000 gates 1000
transistors 1.000.000.000 4000
n:t 1:4000 1:40
goal 344.000.000.000.000 344.000.000.000

10,000,000,000
100,000,000,000
1.000,000,000,000
10.000,000,000,000
100.000,000,000,000
2016 2024 2032 2040 2048
~350.000.000.000~350.000.000.000.000
US debt $17,872,947,693,177US debt $19,688,773,606,117

one question answered:
What to evolve?
one to go:
How to evolve it?

How to evolve? How did it evolve?
Evolutionary Biology
Cognitive Science
Psychology
Behavior Biology
Evolutionary Neuroscience

How to evolve something?
R
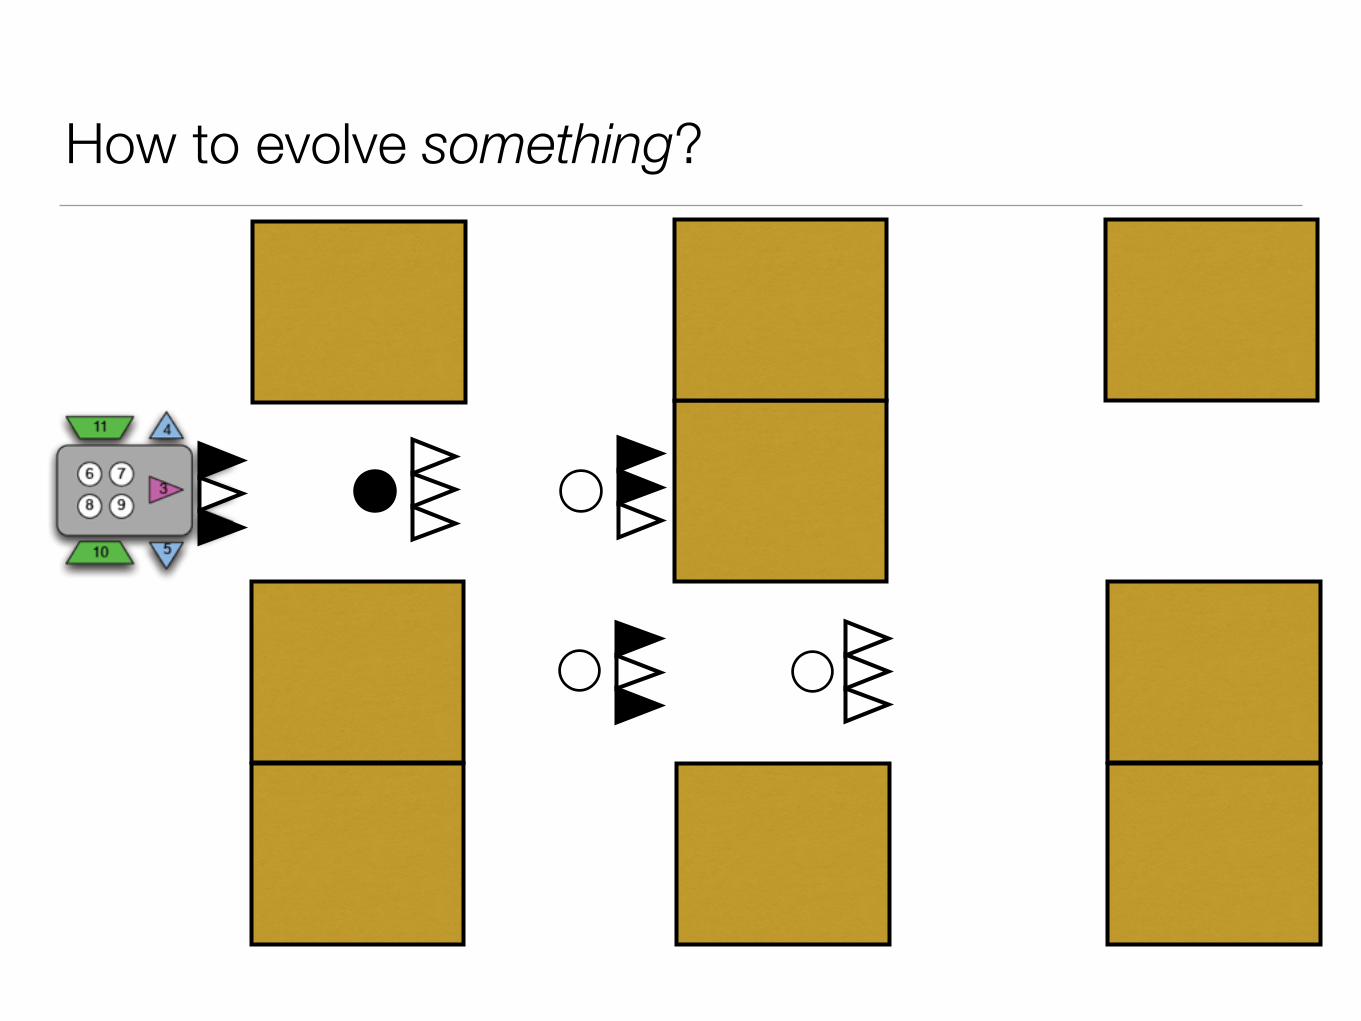
How to evolve something?

population n=100
evaluate performance best
performance
worst performance
highest chance to make offspring
lowest chance to make offspring
next generation
mutation
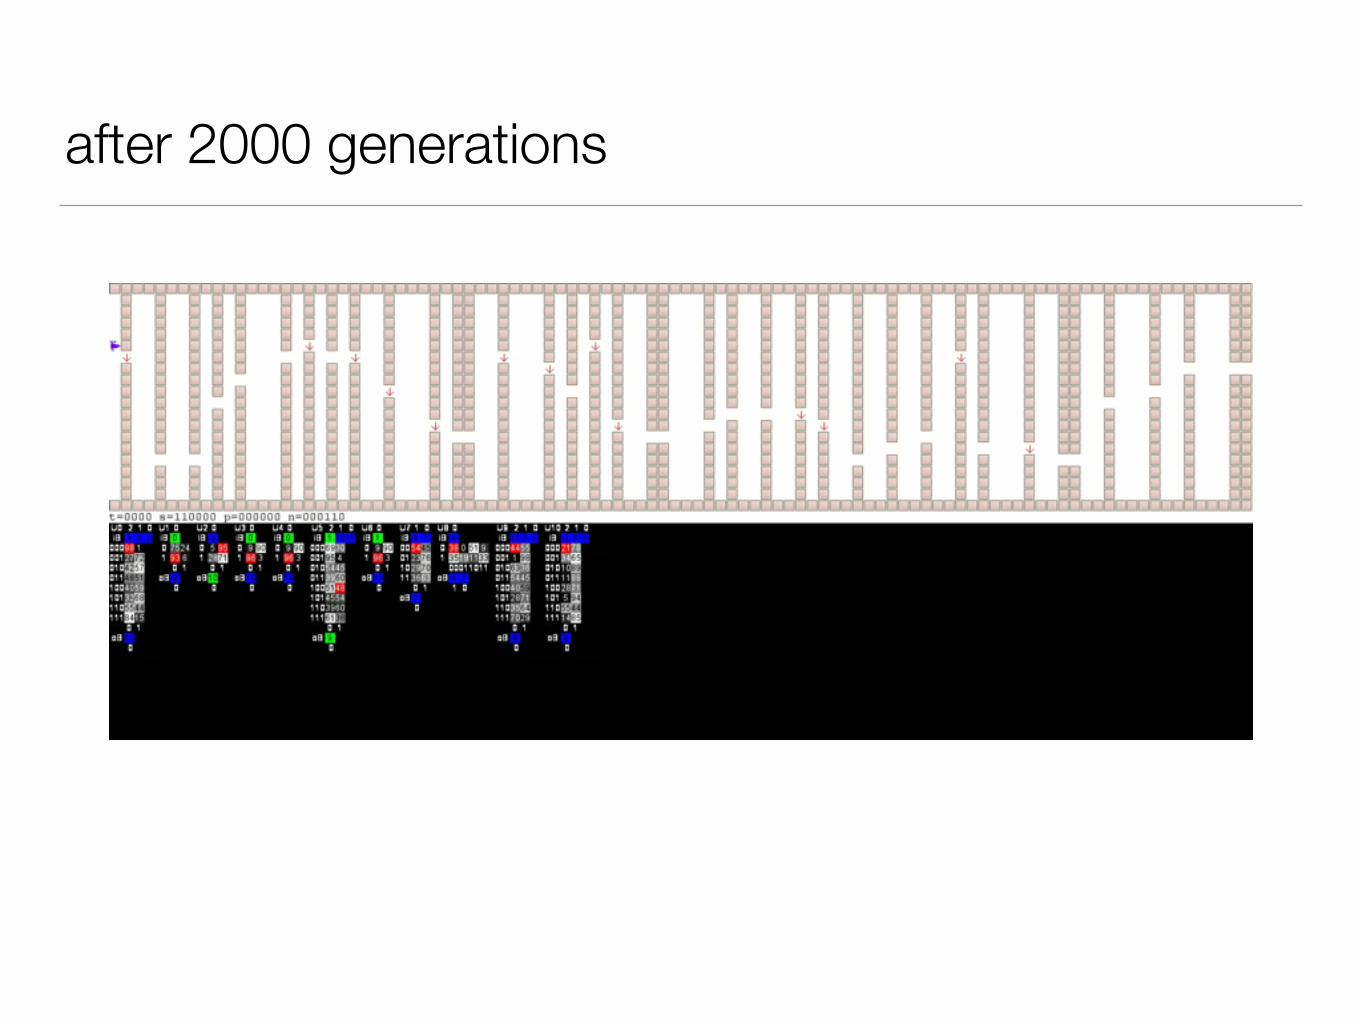
after 2000 generations

after 14.000 generations

finally after 49.000 generations

How to do Biology with this?

an evolutionary experiment
predation response, foraging, mating ….

2d swarming agent
of the lifetime simulation, we assign the predator and prey genomesseparate fitness values according to the fitness functions:
Wpredator ¼X2000
t¼1S" At ð2:1Þ
and
Wprey ¼X2000
t¼1At; ð2:2Þ
where t is the current simulation time step, S is the starting swarmsize (here, S ¼ 50), and At is the number of prey agents alive atsimulation time step t. It can be shown that the predator fitness(equation (2.1)) is proportional to the mean kill rate k (meannumber of prey consumed per time step), while the prey fitness(equation (2.2)) is proportional to (1 2 k). Thus, predators areawarded higher fitness for capturing more prey faster, and preyare rewarded for surviving longer. We only simulate a portion ofthe prey’s lifespan where they are under predation because weare investigating swarming as a response to predation, ratherthan a feeding or mating behaviour.
Once we evaluate all of the predator–prey genome pairs in ageneration, we perform fitness-proportionate selection on thepopulations via a Moran process, allow the selected genomes toasexually reproduce into the next generation’s populations, incre-ment the generation counter and repeat the evaluation process onthe new populations until the final generation (1200) is reached.
We perform 180 replicates of each experiment, where for eachreplicate we seed the prey population with a set of randomlygenerated MNs and the predator population with a pre-evolvedpredator MN that exhibits rudimentary prey-tracking behaviour.Seeding the predator population in this manner only serves tospeed up the coevolutionary process and has negligible effects onthe outcome of the experiment (electronic supplementary material,figure S1).
2.2. Predator and prey agentsFigure 1 depicts the sensory-motor architecture of predator andprey agents in this system. The retina sensors of both predator
and prey agents are logically organized into ‘layers’, where alayer includes 12 sensors, with each sensor having a field of viewof 158 and a range of 100 virtual metres (200 virtual metres for pre-dators). Moreover, each layer is attuned to sensing a specific type ofagent. Specifically, the predator agents have a single-layer retinathat is only capable of sensing prey. In contrast, the prey agentshave a dual-layer retina, where one layer is able to sense conspeci-fics and the other senses the predator. (We note that there is only asingle predator active during each simulation, hence the lack ofa predator-sensing retinal layer for the predator agent.)
Regardless of the number of agents present in a single retinaslice, the agents only know the agent type(s) that reside withinthat slice, but not how many, representing the wide, relativelycoarse-grain visual systems typical in swarming birds such asstarlings [42]. For example in figure 1, the furthest-right retinaslice has two prey in it (light grey triangles), so the prey sensorfor that slice activates. Similarly, the sixth retina slice from theleft has both a predator (dark grey triangle) and a prey (lightgrey triangle) agent in it, so both the predator and prey sensors acti-vate and inform the MN that one or more predators and one ormore prey are currently in that slice. Finally, since the prey nearthe fourth retina slice from the left is just outside the range of theretina slice, the prey sensor for that slice does not activate. Wenote that although the agent’s sensors do not report the numberof agents present in a single retina slice, this constraint does notpreclude the agent’s MN from evolving and making use of a count-ing mechanism that reports the number of agents present in a set ofretina slices. Once provided with its sensory information, the preyagent chooses one of four discrete actions: (i) stay still, (ii) moveforward 1 unit, (iii) turn left 88 while moving forward 1 unit, or(iv) turn right 88 while moving forward 1 unit.
Likewise, the predator agent detects nearby prey agentsusing a limited-distance (200 virtual metres), pixelated retinacovering its frontal 1808 that functions just like the prey agent’sretina. Similar to the prey agents, predator agents make decisionsabout where to move next, but the predator agents move threetimes faster than the prey agents and turn correspondinglyslower (68 per simulation time step) owing to their higher speed.
2.3. Simulation environmentWe use a simulation environment to evaluate the relative per-formance of the predator and prey agents. At the beginning ofevery simulation, we place a single predator agent and 50 preyagents at random locations inside a closed 512 % 512 unit two-dimensional simulation environment. Each of the 50 preyagents are controlled by clonal MNs of the particular prey MNbeing evaluated. We evaluate the swarm with clonal MNs toeliminate any possible effects of selection on the individuallevel, e.g. the ‘selfish herd’ effect [30,32].
During each simulation time step, we provide all agents theirsensory input, update their MN, then allow the MN to make adecision about where to move next. When the predator agentmoves within five virtual metres of a prey agent it can see, itautomatically makes an attack attempt on that prey agent. Ifthe attack attempt is successful, the target prey agent is removedfrom the simulation and marked as consumed. Predator agentsare limited to one attack attempt every 10 simulation timesteps, which is called the handling time. The handling time rep-resents the time it takes to consume and digest a prey aftersuccessful prey capture, or the time it takes to refocus on anotherprey in the case of an unsuccessful attack attempt. Shorter hand-ling times have negligible effects on the outcome of theexperiment, except for when there is no handling time at all(electronic supplementary material, figure S2).
To investigate predator confusion as an indirect selectionpressure driving the evolution of swarming, we implement a per-ceptual constraint on the predator agent. When the predator
retina
Markovnetwork
L R
01 0
0 0
000011
10 1
000 00 10 100
Figure 1. An illustration of the predator and prey agents in the model. Lightgrey triangles are prey agents and the dark grey triangle is a predator agent.The predator and prey agents have a 1808 limited-distance retina (100 virtualmetres for the prey agents; 200 virtual metres for the predator agent) toobserve their surroundings and detect the presence of the predator andprey agents. Each agent has its own Markov network, which decideswhere to move next based on a combination of sensory input andmemory. The left and right actuators (labelled ‘L’ and ‘R’) enable theagents to move forward, left, and right in discrete steps.
rsif.royalsocietypublishing.orgJR
SocInterface10:20130305
3
on October 4, 2014rsif.royalsocietypublishing.orgDownloaded from
Randal Olson

normal predator confusable predator
R. S. Olson, A. Hintze, F. C. Dyer, D. B. Knoester, and C. Adami, Predator confusion is sufficient to evolve swarming behavior (2013) Journal of the Royal Society Interface 10: 20130305. plus many more ….
evolution of swarming as a predation response requires a confusable predator

where to go from here?
memory entrainment
learning
neuro correlates: IIT, phi, Representations
AI in computer games
complex environmentshuman decision making

Memory, learning, entrainment
L R F N
A x
B x
C x
D x
L R F N
A x
B x
C x
D x

Hierarchies and organized groups
division of labor dominance hierarchy
Evolution of autonomous hierarchy formation and maintenance A. Hintze, M. Miromeni, ALIFE 14: Conference Proceedings, 2014

multi agent environments

psychology
rational decision maker evolved decision makervs.
A. Hintze, R. Olson, C. Adami, R. Hertwig, Risk sensitivity as an evolutionary adaptation. Scientific reports 2014 P. Kvam, J. Cesario, J. Schossau, H. Eisthen, A. Hintze, Computational evolution of decision-making strategies Cognitive Science Conference Proceedings 2015 A. Hintze, N. Phillips, R. Hertwig, The Janus face of Darwinian competition, Scientific reports 2015 A. Hintze, R. Hertwig, The Evolution of Generosity in the Ultimatum Game, Scientific Reports 2016

value judgement task: Heuristic vs. Optimal Strategy
generations
perfo
rman
ceno strategy
heuristic
optimal strategy

more virtual environments

AI in computer games

the future?

Thank you!
Laura Smale
Barbara Lundrigan
Fred Dyer
Tim Pleskac Ralph Hertwig
Kay Holekamp Heather Eisthen
Chris Adami

Modular Agent Based Evolution Framework
https://github.com/ahnt/MABE