Embed Size (px)
Citation preview
Novel assembly approach for the homozygous genomes
and the conservation of critically endangered Solenodon paradoxus
Taras K Oleksyk et al.
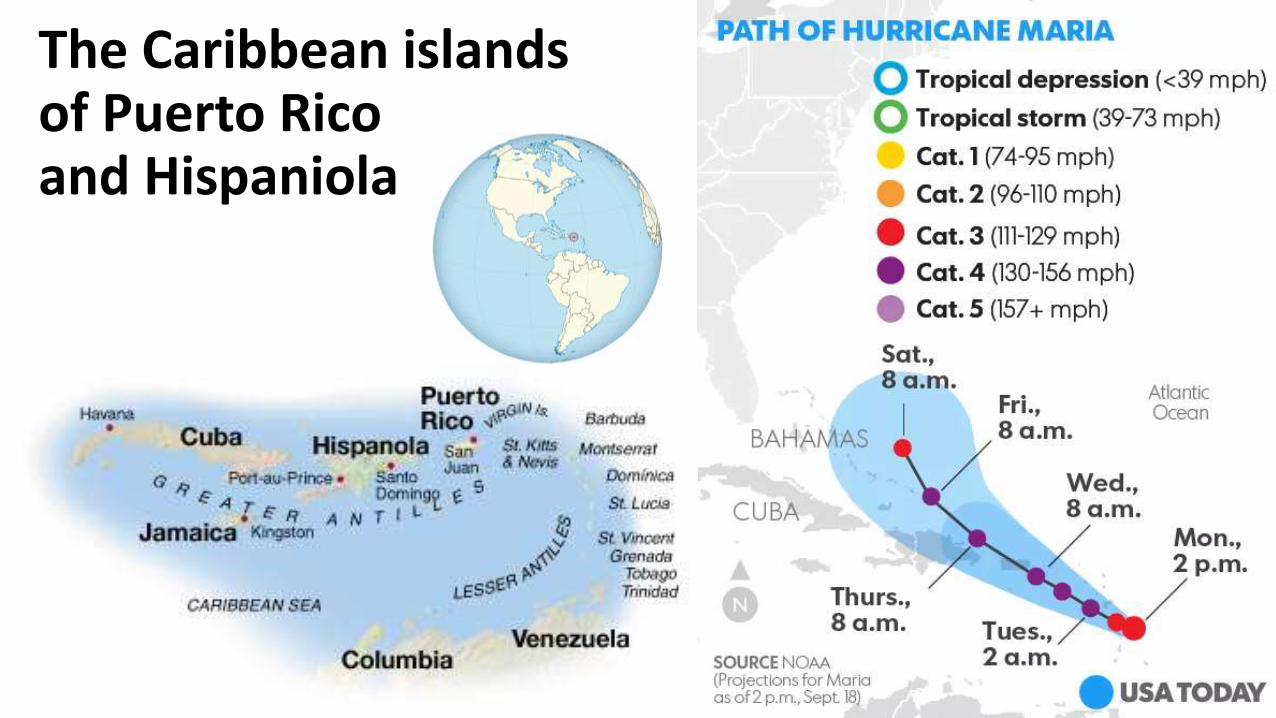
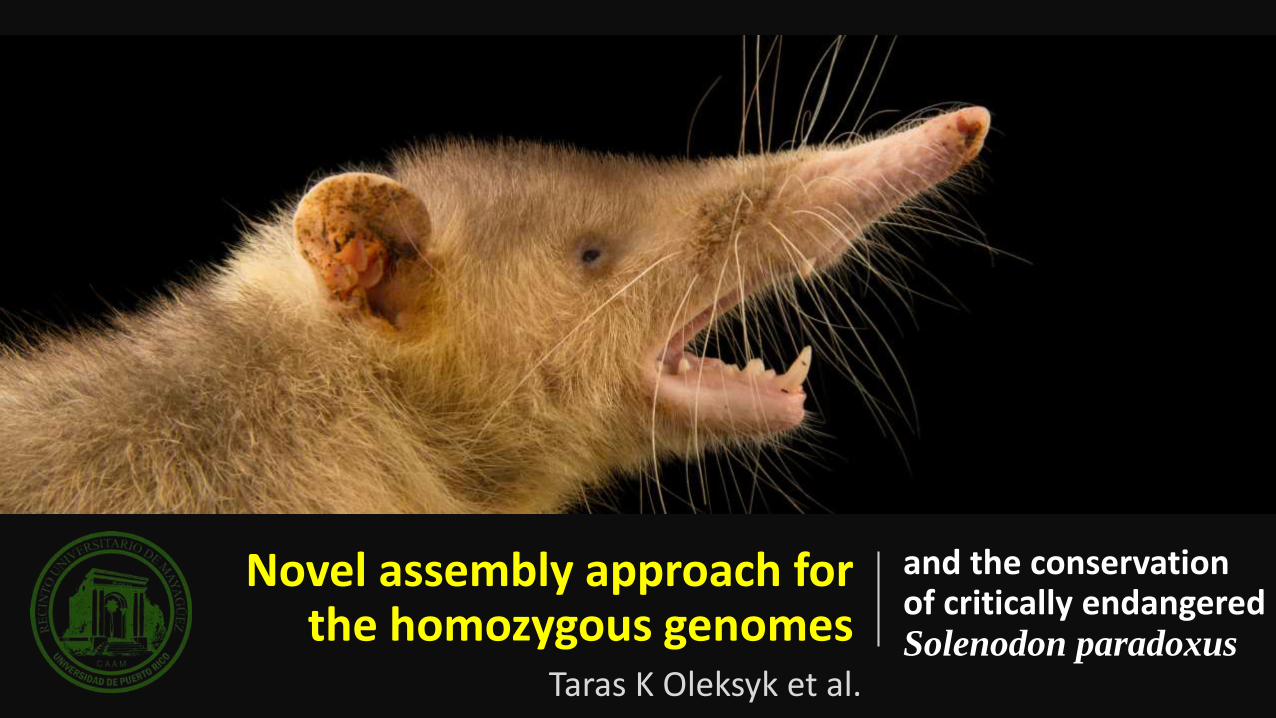
The Caribbean islands of Puerto Ricoand Hispaniola
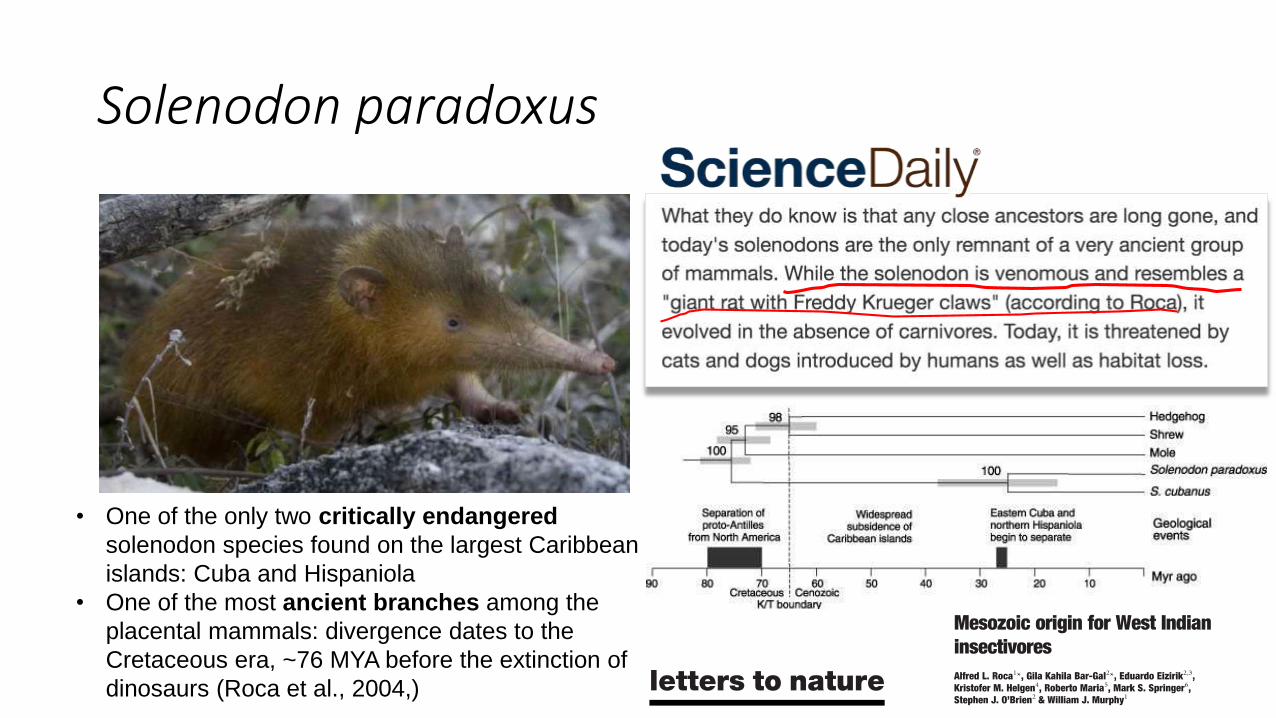
Solenodon paradoxus
• One of the only two critically endangered
solenodon species found on the largest Caribbean
islands: Cuba and Hispaniola
• One of the most ancient branches among the
placental mammals: divergence dates to the
Cretaceous era, ~76 MYA before the extinction of
dinosaurs (Roca et al., 2004,)
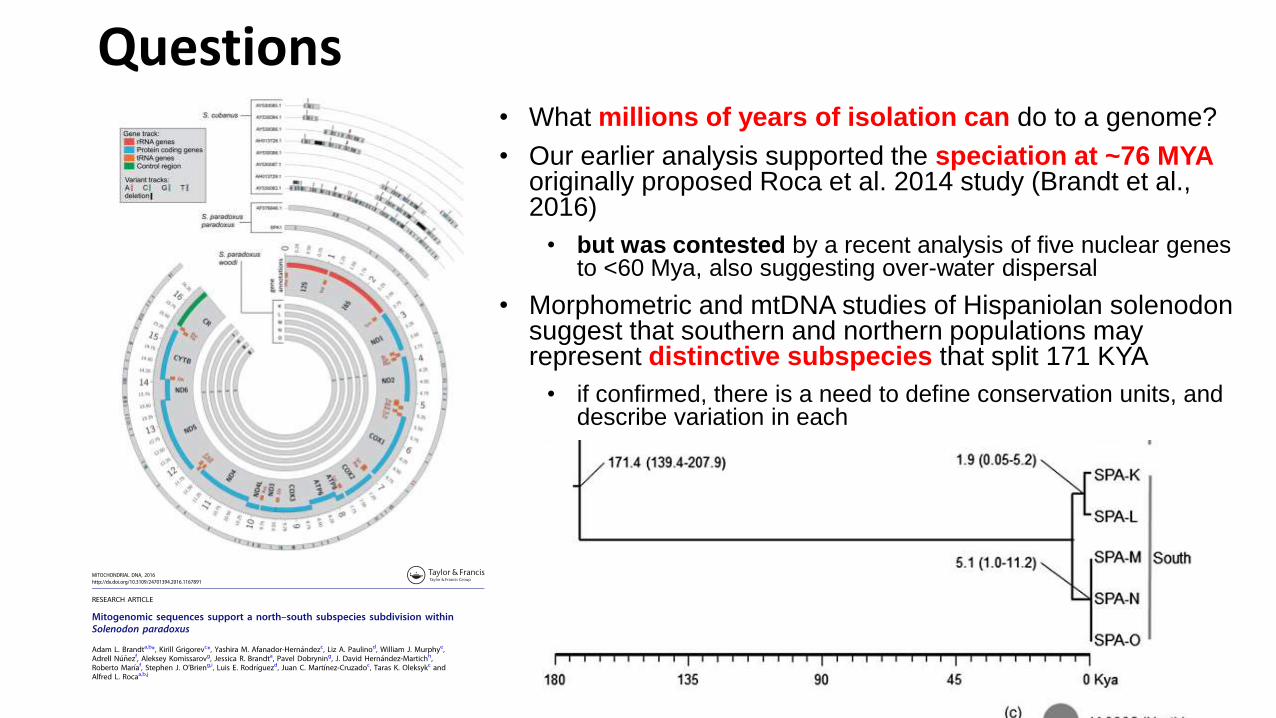
Questions• What millions of years of isolation can do to a genome?
• Our earlier analysis supported the speciation at ~76 MYAoriginally proposed Roca et al. 2014 study (Brandt et al., 2016)
• but was contested by a recent analysis of five nuclear genes to <60 Mya, also suggesting over-water dispersal
• Morphometric and mtDNA studies of Hispaniolan solenodon suggest that southern and northern populations may represent distinctive subspecies that split 171 KYA
• if confirmed, there is a need to define conservation units, and describe variation in each
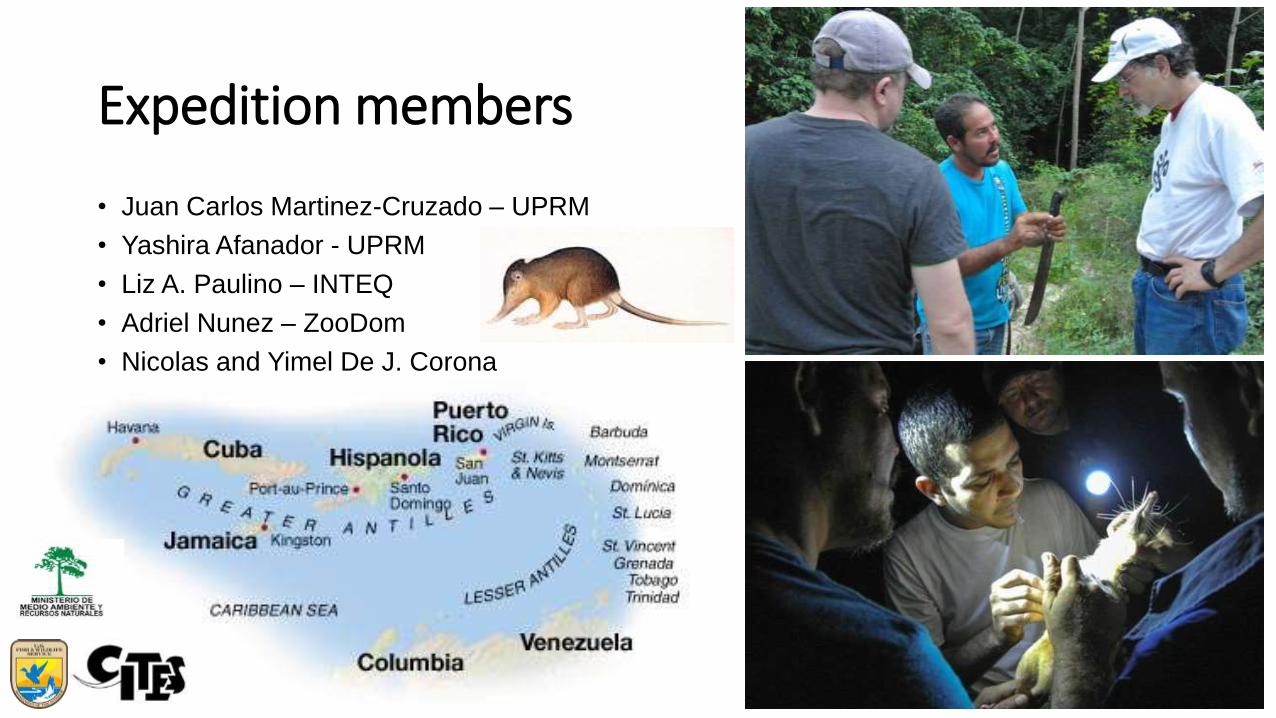
Expedition members
• Juan Carlos Martinez-Cruzado – UPRM
• Yashira Afanador - UPRM
• Liz A. Paulino – INTEQ
• Adriel Nunez – ZooDom
• Nicolas and Yimel De J. Corona
zoo
zoozoo
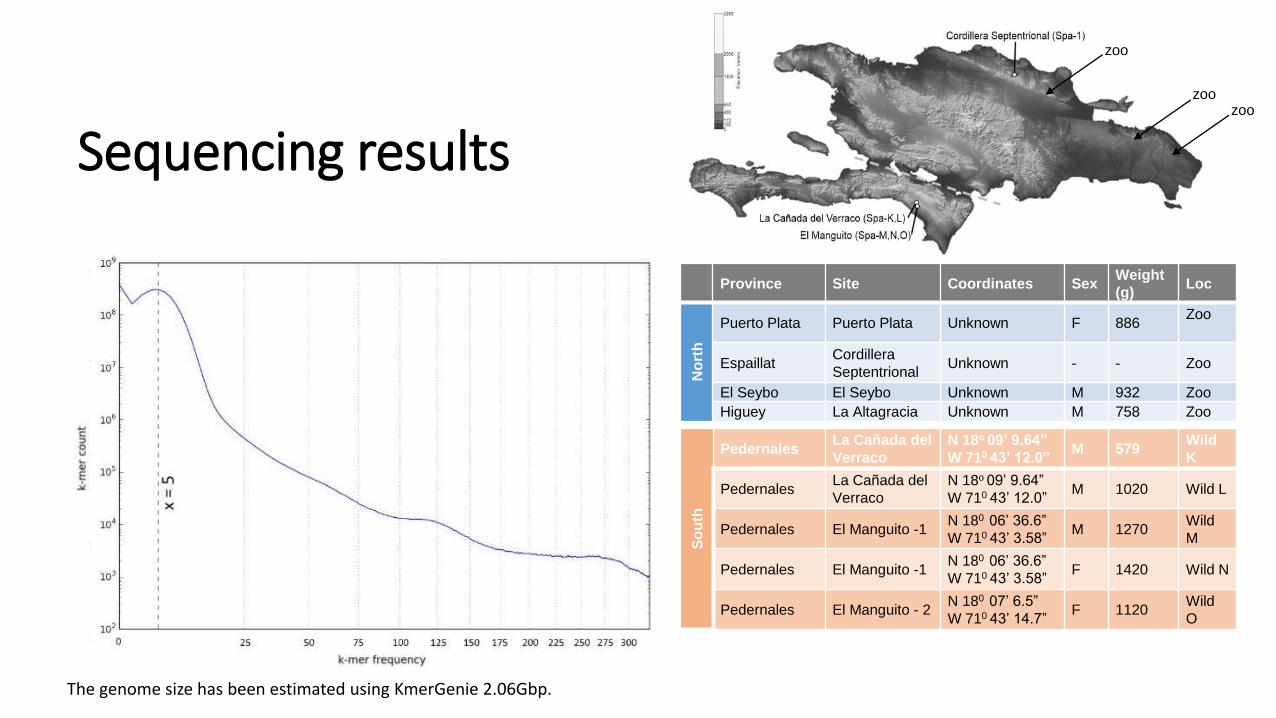
Sequencing results
The genome size has been estimated using KmerGenie 2.06Gbp.
How to maximize information derived from data?
Province Site Coordinates SexWeight
(g)Loc
No
rth
Puerto Plata Puerto Plata Unknown F 886Zoo
EspaillatCordillera
SeptentrionalUnknown - - Zoo
El Seybo El Seybo Unknown M 932 Zoo
Higuey La Altagracia Unknown M 758 Zoo
So
uth
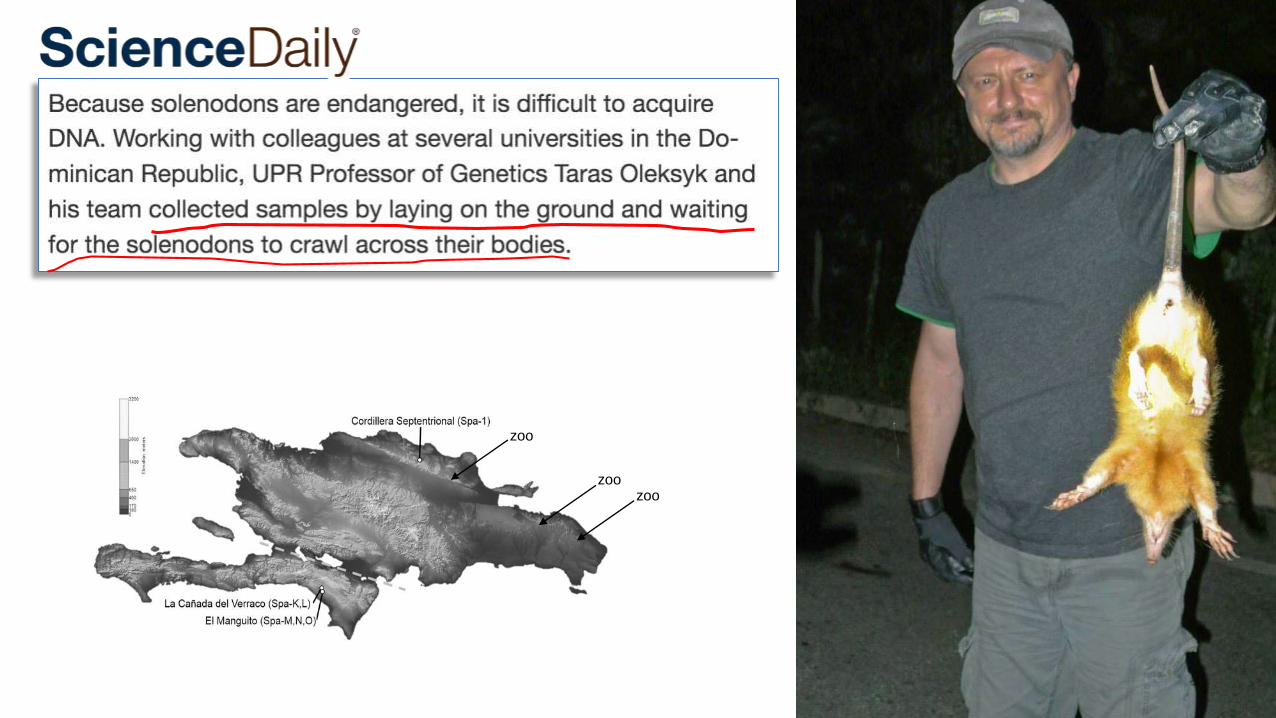
PedernalesLa Cañada del
Verraco
N 18o 09’ 9.64”
W 710 43’ 12.0”M 579
Wild
K
PedernalesLa Cañada del
Verraco
N 18o 09’ 9.64”
W 710 43’ 12.0”M 1020 Wild L
Pedernales El Manguito -1N 180 06’ 36.6”
W 710 43’ 3.58”M 1270
Wild
M
Pedernales El Manguito -1N 180 06’ 36.6”
W 710 43’ 3.58”F 1420 Wild N
Pedernales El Manguito - 2N 180 07’ 6.5”
W 710 43’ 14.7”F 1120
Wild
O
zoo
zoozoo
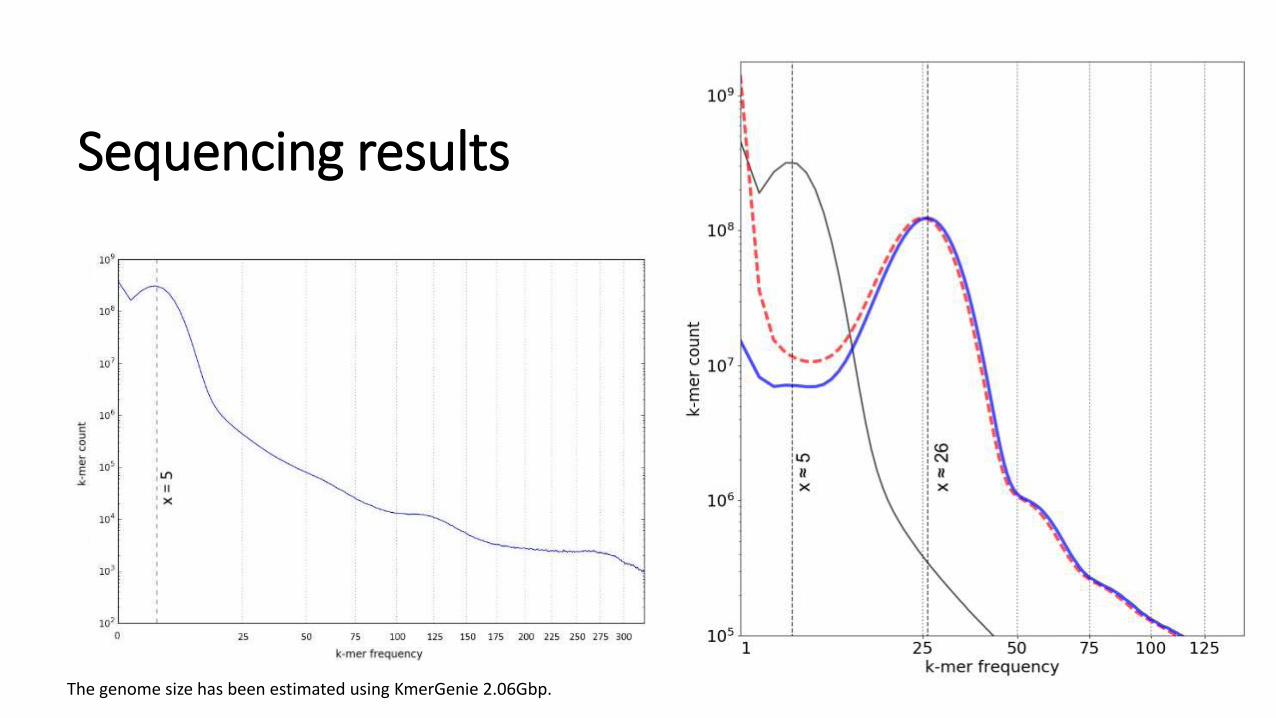
Sequencing results
The genome size has been estimated using KmerGenie 2.06Gbp.
How to maximize information derived from data?
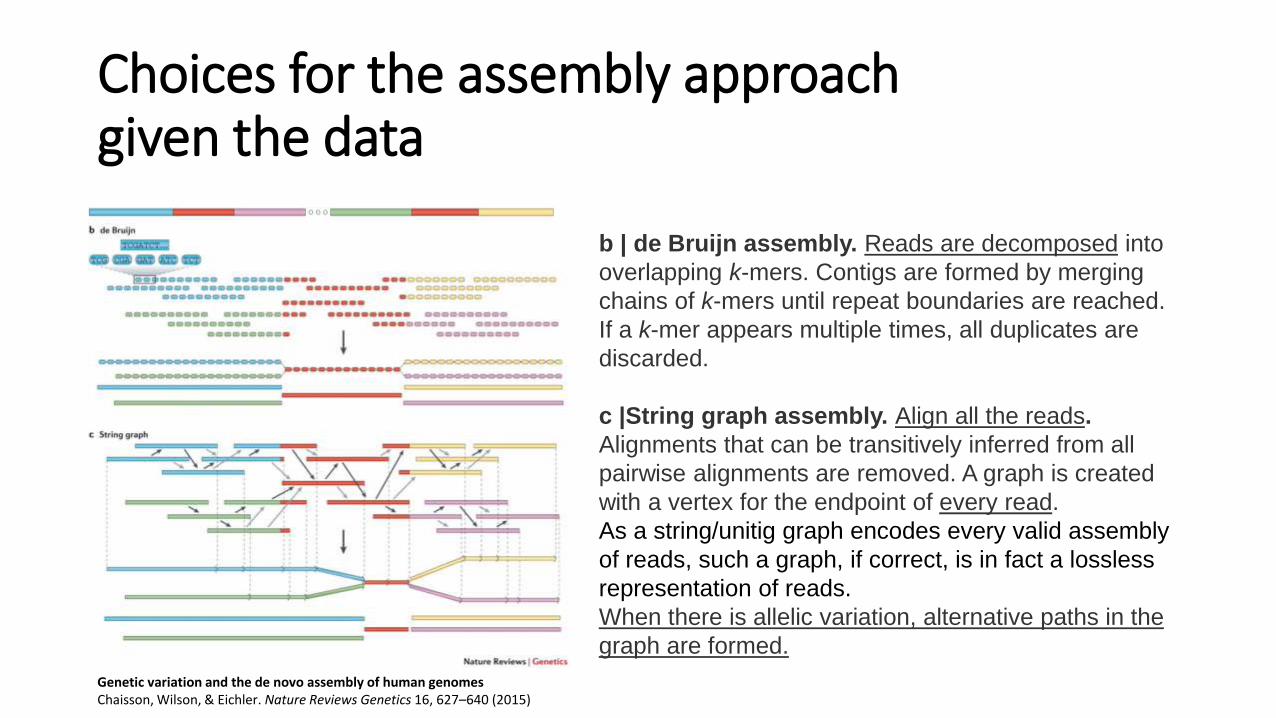
Choices for the assembly approachgiven the data
b | de Bruijn assembly. Reads are decomposed into
overlapping k-mers. Contigs are formed by merging
chains of k-mers until repeat boundaries are reached.
If a k-mer appears multiple times, all duplicates are
discarded.
c |String graph assembly. Align all the reads.
Alignments that can be transitively inferred from all
pairwise alignments are removed. A graph is created
with a vertex for the endpoint of every read.
As a string/unitig graph encodes every valid assembly
of reads, such a graph, if correct, is in fact a lossless
representation of reads.
When there is allelic variation, alternative paths in the
graph are formed.
Genetic variation and the de novo assembly of human genomes Chaisson, Wilson, & Eichler. Nature Reviews Genetics 16, 627–640 (2015)
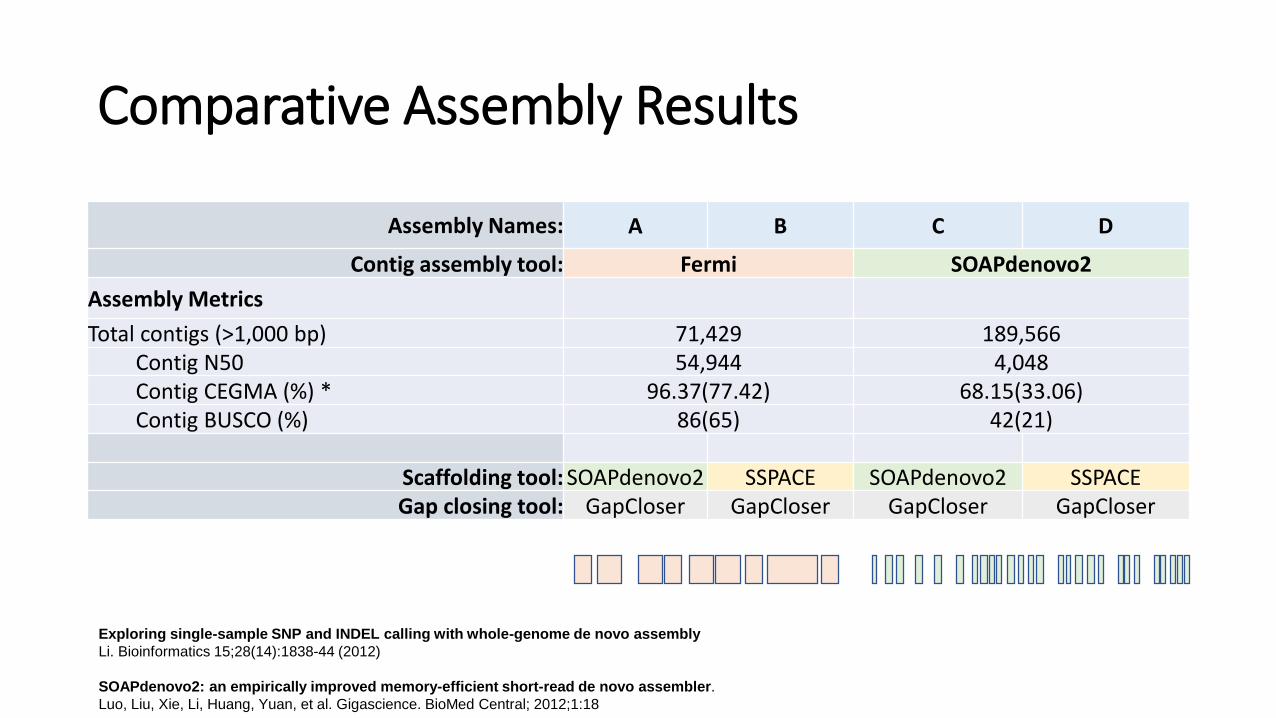
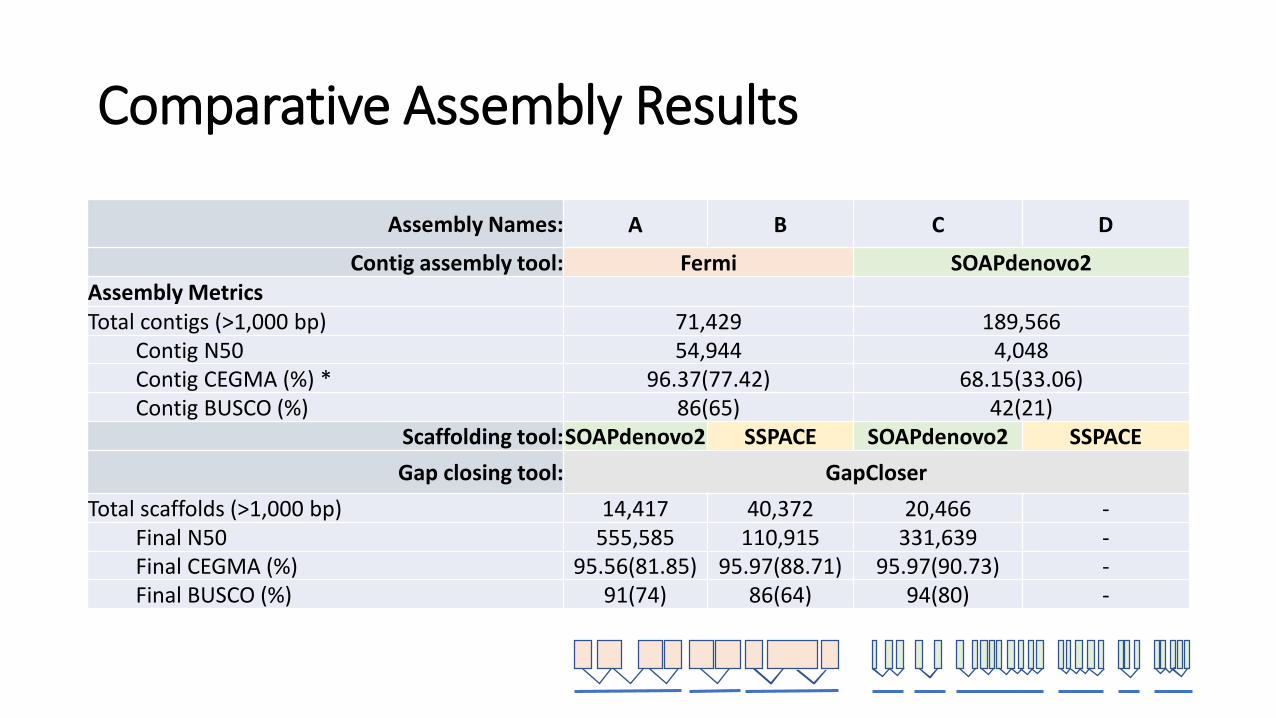
Comparative Assembly Results
Assembly Names: A B C D
Contig assembly tool: Fermi SOAPdenovo2
Assembly Metrics
Total contigs (>1,000 bp) 71,429 189,566Contig N50 54,944 4,048Contig CEGMA (%) * 96.37(77.42) 68.15(33.06)Contig BUSCO (%) 86(65) 42(21)
Scaffolding tool: SOAPdenovo2 SSPACE SOAPdenovo2 SSPACEGap closing tool: GapCloser GapCloser GapCloser GapCloser
Exploring single-sample SNP and INDEL calling with whole-genome de novo assembly
Li. Bioinformatics 15;28(14):1838-44 (2012)
SOAPdenovo2: an empirically improved memory-efficient short-read de novo assembler.
Luo, Liu, Xie, Li, Huang, Yuan, et al. Gigascience. BioMed Central; 2012;1:18
Comparative Assembly Results
Assembly Names: A B C D
Contig assembly tool: Fermi SOAPdenovo2Assembly MetricsTotal contigs (>1,000 bp) 71,429 189,566
Contig N50 54,944 4,048Contig CEGMA (%) * 96.37(77.42) 68.15(33.06)Contig BUSCO (%) 86(65) 42(21)
Scaffolding tool:SOAPdenovo2 SSPACE SOAPdenovo2 SSPACE
Gap closing tool: GapCloser
Total scaffolds (>1,000 bp) 14,417 40,372 20,466 -Final N50 555,585 110,915 331,639 -Final CEGMA (%) 95.56(81.85) 95.97(88.71) 95.97(90.73) -Final BUSCO (%) 91(74) 86(64) 94(80) -
A B
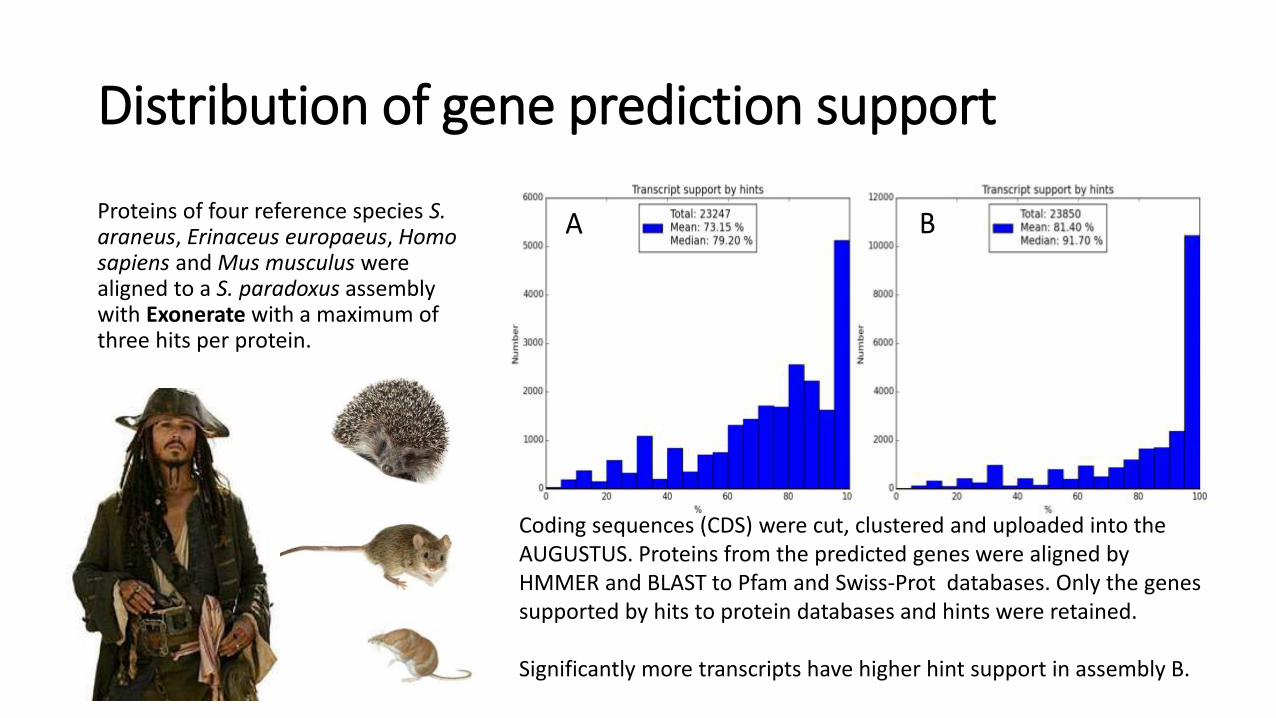
Distribution of gene prediction support
Proteins of four reference species S. araneus, Erinaceus europaeus, Homo sapiens and Mus musculus were aligned to a S. paradoxus assembly with Exonerate with a maximum of three hits per protein.
Coding sequences (CDS) were cut, clustered and uploaded into the AUGUSTUS. Proteins from the predicted genes were aligned by HMMER and BLAST to Pfam and Swiss-Prot databases. Only the genes supported by hits to protein databases and hints were retained.
Significantly more transcripts have higher hint support in assembly B.
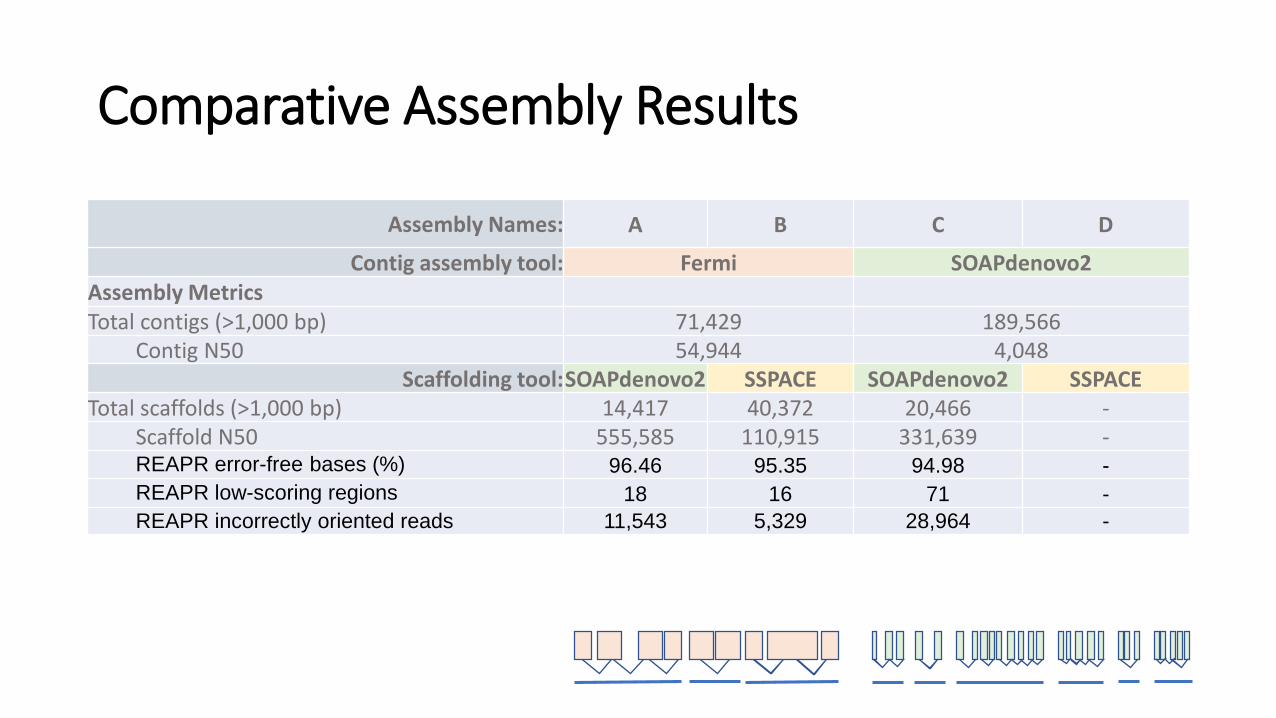
Comparative Assembly Results
Assembly Names: A B C D
Contig assembly tool: Fermi SOAPdenovo2Assembly MetricsTotal contigs (>1,000 bp) 71,429 189,566
Contig N50 54,944 4,048Scaffolding tool:SOAPdenovo2 SSPACE SOAPdenovo2 SSPACE
Total scaffolds (>1,000 bp) 14,417 40,372 20,466 -Scaffold N50 555,585 110,915 331,639 -REAPR error-free bases (%) 96.46 95.35 94.98 -
REAPR low-scoring regions 18 16 71 -
REAPR incorrectly oriented reads 11,543 5,329 28,964 -
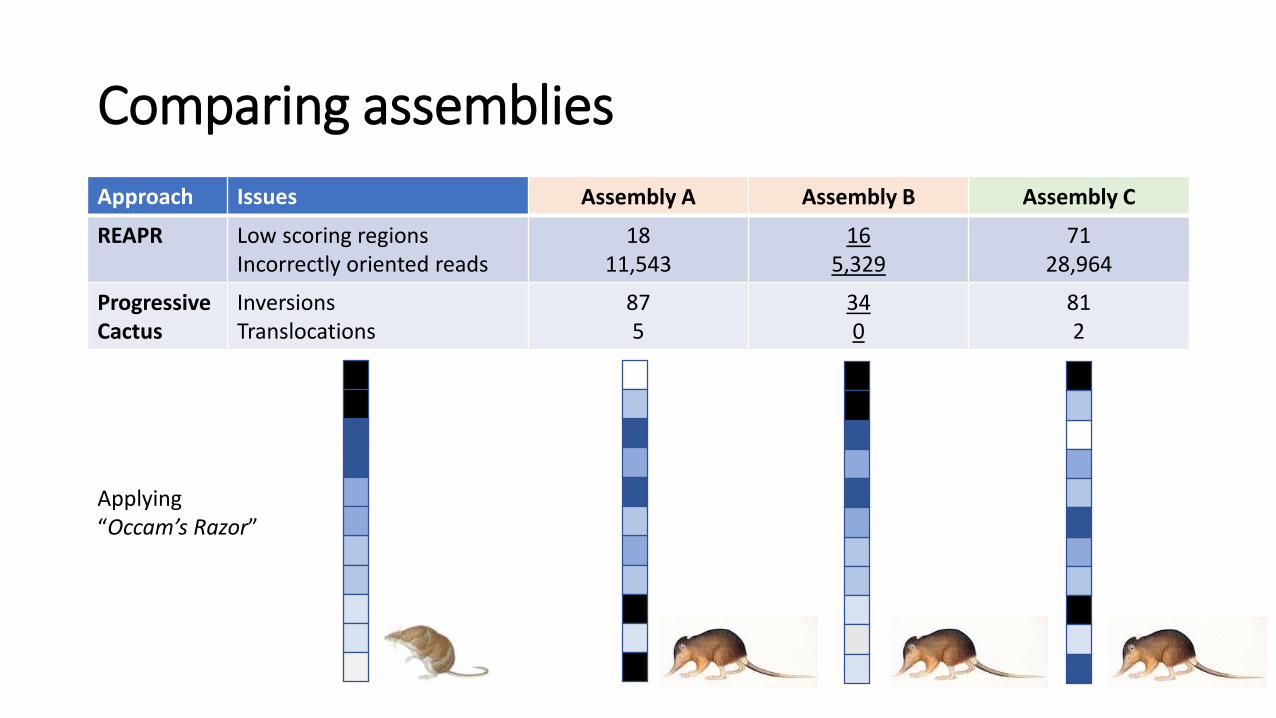
Comparing assemblies
Approach Issues Assembly A Assembly B Assembly C
REAPR Low scoring regionsIncorrectly oriented reads
18 11,543
165,329
7128,964
Progressive Cactus
InversionsTranslocations
87 5
340
812
Applying “Occam’s Razor”
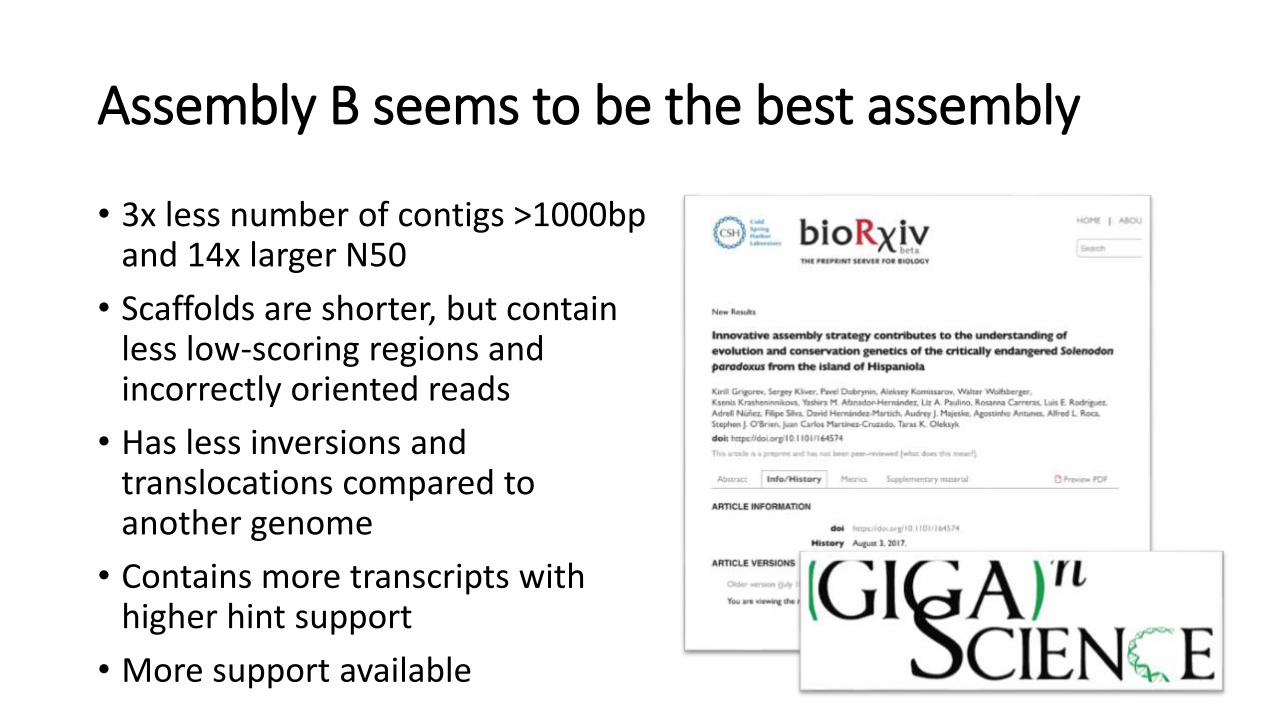
Assembly B seems to be the best assembly
• 3x less number of contigs >1000bp and 14x larger N50
• Scaffolds are shorter, but contain less low-scoring regions and incorrectly oriented reads
• Has less inversions and translocations compared to another genome
• Contains more transcripts with higher hint support
• More support available
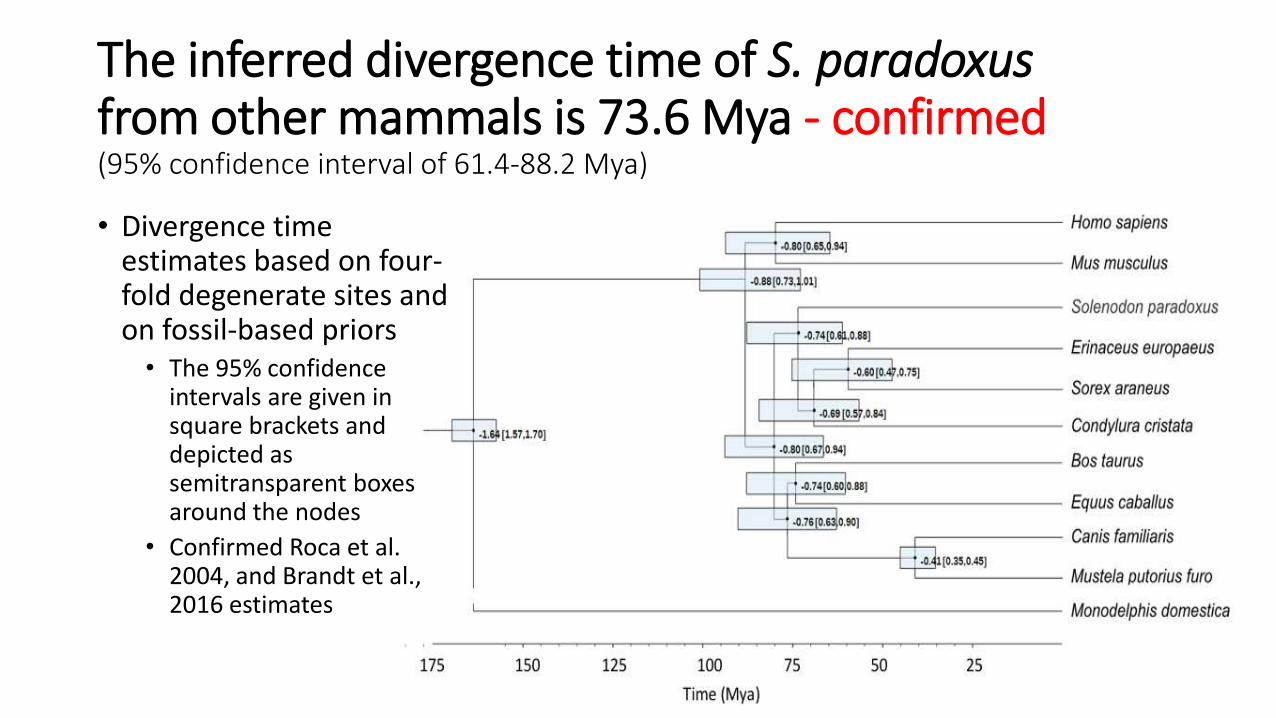
The inferred divergence time of S. paradoxusfrom other mammals is 73.6 Mya - confirmed(95% confidence interval of 61.4-88.2 Mya)
• Divergence time estimates based on four-fold degenerate sites and on fossil-based priors
• The 95% confidence intervals are given in square brackets and depicted as semitransparent boxes around the nodes
• Confirmed Roca et al. 2004, and Brandt et al., 2016 estimates
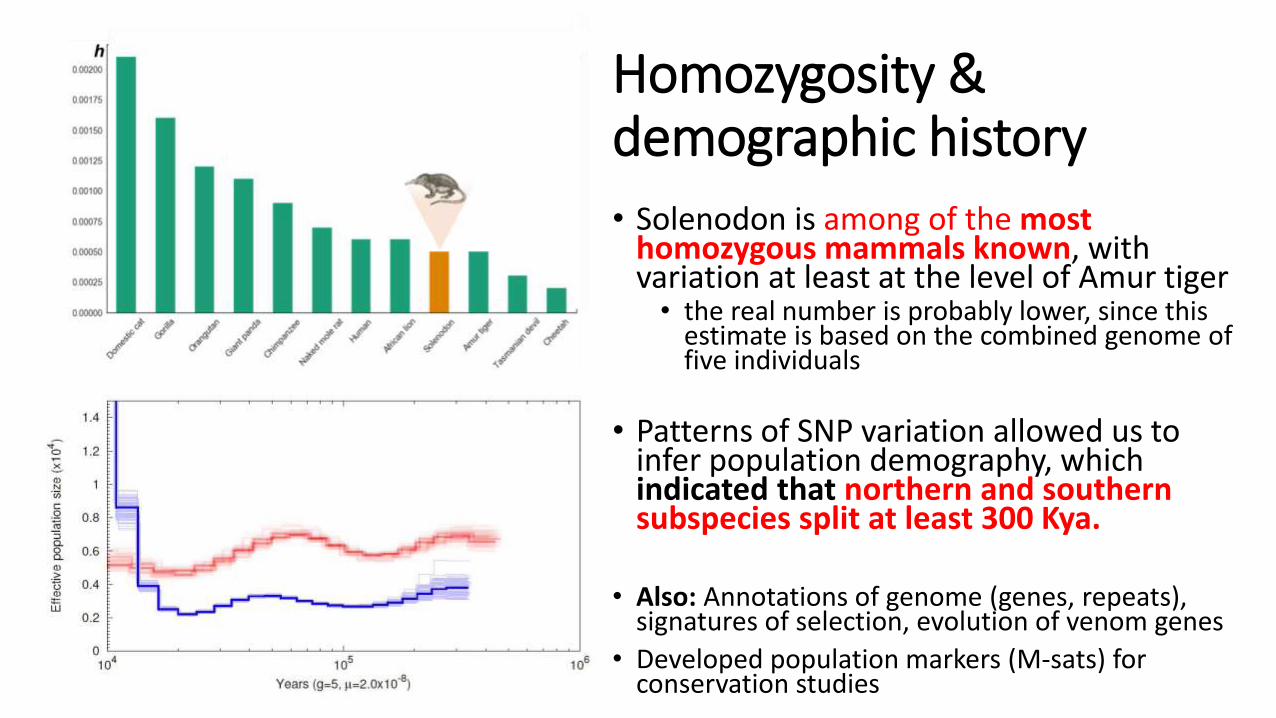
Homozygosity & demographic history
• Solenodon is among of the most homozygous mammals known, with variation at least at the level of Amur tiger
• the real number is probably lower, since this estimate is based on the combined genome of five individuals
• Patterns of SNP variation allowed us to infer population demography, which indicated that northern and southern subspecies split at least 300 Kya.
• Also: Annotations of genome (genes, repeats), signatures of selection, evolution of venom genes
• Developed population markers (M-sats) for conservation studies
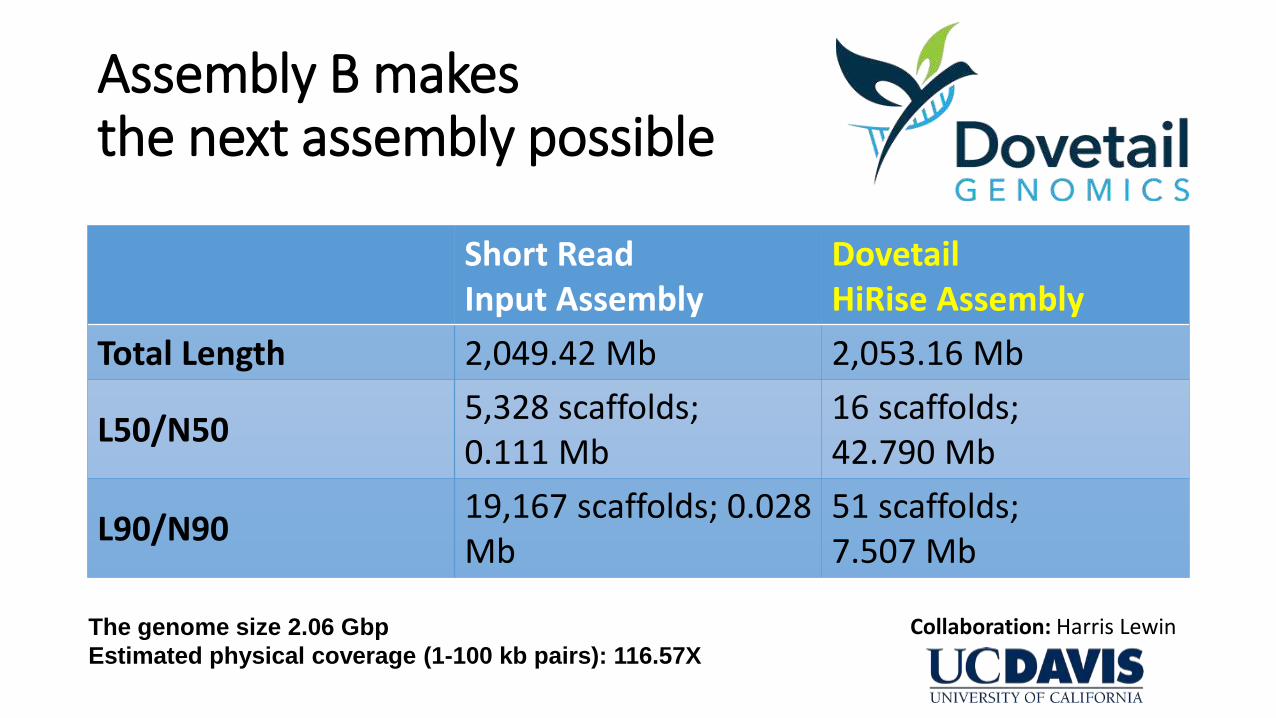
Assembly B makes the next assembly possible
Short Read Input Assembly
Dovetail HiRise Assembly
Total Length 2,049.42 Mb 2,053.16 Mb
L50/N50 5,328 scaffolds; 0.111 Mb
16 scaffolds; 42.790 Mb
L90/N90 19,167 scaffolds; 0.028 Mb
51 scaffolds; 7.507 Mb
The genome size 2.06 Gbp
Estimated physical coverage (1-100 kb pairs): 116.57X
Collaboration: Harris Lewin
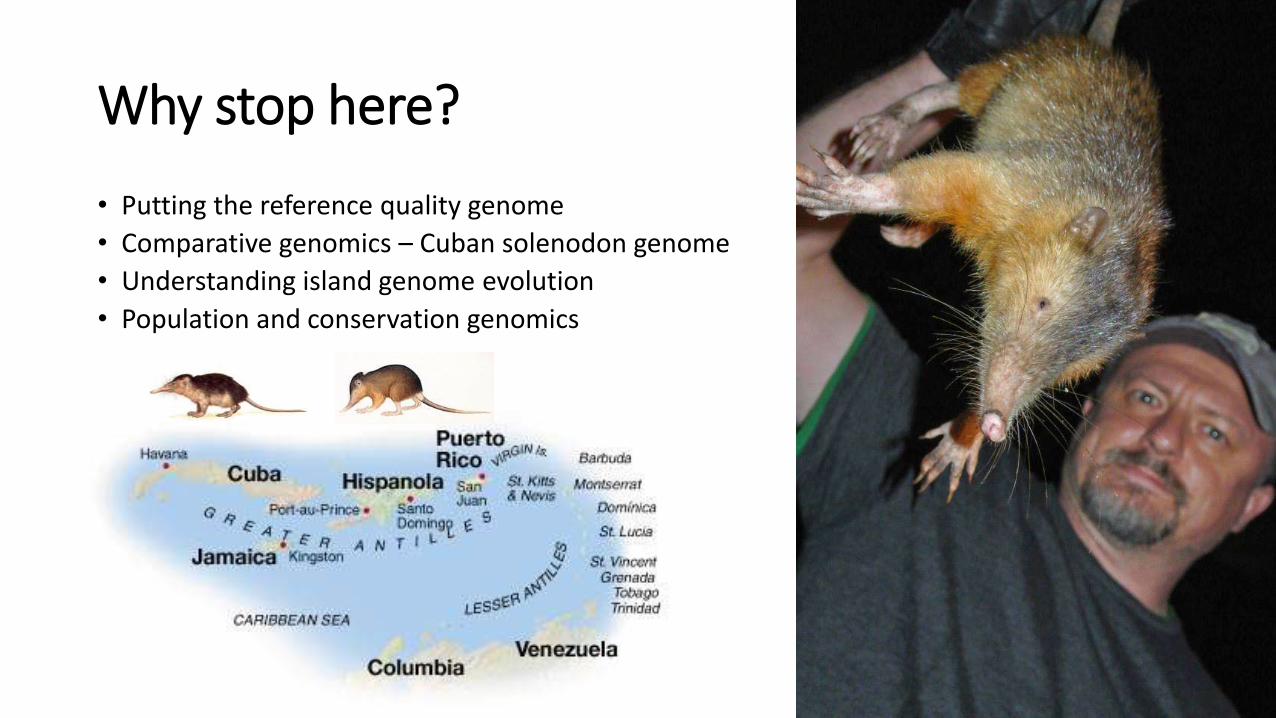
Why stop here?
• Putting the reference quality genome
• Comparative genomics – Cuban solenodon genome
• Understanding island genome evolution
• Population and conservation genomics
Thank you
• Sergey Kliver
• Pavel Dobrynin
• Aleksey Komissarov
• KseniaKrasheninnikova
• Stephen J. O’Brien
• Kirill Grigorev
• Yashira M. Afanador
• Walter Wolfsberger
• Audrey J. Majeske
• Juan Carlos Martinez-Cruzado
• Liz A. Paulino
• Rosanna Carreras
• Luis E. Rodríguez
• Adrell Nunez
• David Hernandez-Martich
• Filipe Silva
• Agostinho Antunes
NSF project #1432092
• Alfred L. Roca
• Adam Brandt