Embed Size (px)
Citation preview

The role of spatial models in appliedecological research
Richard ChandlerWarnell School of Forestry and Natural Resources
University of Georgia

Tobler’s first law of geography
Everything is relatedto everything else, butnear things are morerelated than distantthings.
Waldo Tobler
Introduction Metapopulations Scale of habitat selection 2 / 35

Implications of Tobler’s Law
Stuart Hurlbert
Pseudoreplication
Introduction Metapopulations Scale of habitat selection 3 / 35

Fisher’s solution
Randomized Complete
Block Design
R. A. Fisher
Introduction Metapopulations Scale of habitat selection 4 / 35

Thoughts on Fisher and Hurlbert
Blocking is very important in manipulativeexperiments, but. . .
• How far away should our blocks be?
• How large should our blocks be?
• What do we do if spatial correlation iscontinuous?
• What caused the spatial correlation in thefirst place?
Introduction Metapopulations Scale of habitat selection 5 / 35

Recent Innovations
Soaking up variation with (spatial)random effects
We need a new approach to understandthe mechanisms that underlie spatial
dependence
Introduction Metapopulations Scale of habitat selection 6 / 35

Recent Innovations
Soaking up variation with (spatial)random effects
We need a new approach to understandthe mechanisms that underlie spatial
dependence
Introduction Metapopulations Scale of habitat selection 6 / 35

Mechanistic models of spatial dependence
Why are nearer things more similar?
Ecological theory tells us. . .
• Dispersal
• Connectivity
• Conspecific attraction
• Resource selection in patchy environments
Spatial correlation provides informationabout these processes
Introduction Metapopulations Scale of habitat selection 7 / 35

Mechanistic models of spatial dependence
Tools for inference – hierarchical models
Other uses of these tools
• Modeling the detection process
• Designing cost-efficient studies
Introduction Metapopulations Scale of habitat selection 8 / 35

Mechanistic models of spatial dependence
Tools for inference – hierarchical models
Other uses of these tools
• Modeling the detection process
• Designing cost-efficient studies
Introduction Metapopulations Scale of habitat selection 8 / 35
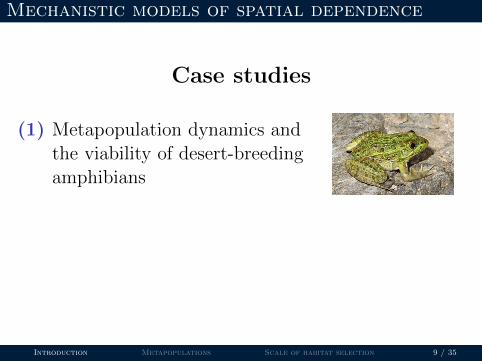
Mechanistic models of spatial dependence
Case studies
(1) Metapopulation dynamics andthe viability of desert-breedingamphibians
(2) Understanding the spatial scaleof habitat selection
Introduction Metapopulations Scale of habitat selection 9 / 35

Mechanistic models of spatial dependence
Case studies
(1) Metapopulation dynamics andthe viability of desert-breedingamphibians
(2) Understanding the spatial scaleof habitat selection
Introduction Metapopulations Scale of habitat selection 9 / 35

Metapopulations
Introduction Metapopulations Scale of habitat selection 10 / 35

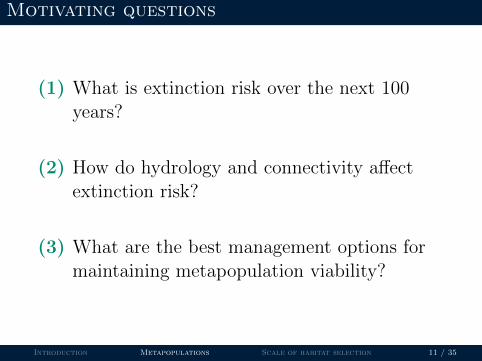
Motivating questions
(1) What is extinction risk over the next 100years?
(2) How do hydrology and connectivity affectextinction risk?
(3) What are the best management options formaintaining metapopulation viability?
Introduction Metapopulations Scale of habitat selection 11 / 35

Motivating questions
(1) What is extinction risk over the next 100years?
(2) How do hydrology and connectivity affectextinction risk?
(3) What are the best management options formaintaining metapopulation viability?
Introduction Metapopulations Scale of habitat selection 11 / 35
Motivating questions
(1) What is extinction risk over the next 100years?
(2) How do hydrology and connectivity affectextinction risk?
(3) What are the best management options formaintaining metapopulation viability?
Introduction Metapopulations Scale of habitat selection 11 / 35

Leopard frog data
Year2007 2008 . . . 2013
Site 1 2 3 1 2 3 . . . 1 2 31 0 1 1 0 0 0 . . . 1 0 12 0 0 0 0 0 0 . . . 0 0 03 – – – 1 1 0 . . . 0 0 1...
......
......
......
......
......
41 0 1 1 0 1 0 . . . 0 0 0
42 – – – – – – . . . – – –...
......
......
......
......
......
273 – – – – – – . . . – – –
Plus, coordinates and covariates for each site
Introduction Metapopulations Scale of habitat selection 12 / 35

Leopard frog data
Year2007 2008 . . . 2013
Site 1 2 3 1 2 3 . . . 1 2 31 0 1 1 0 0 0 . . . 1 0 12 0 0 0 0 0 0 . . . 0 0 03 – – – 1 1 0 . . . 0 0 1...
......
......
......
......
......
41 0 1 1 0 1 0 . . . 0 0 042 – – – – – – . . . – – –...
......
......
......
......
......
273 – – – – – – . . . – – –
Plus, coordinates and covariates for each site
Introduction Metapopulations Scale of habitat selection 12 / 35

Metapopulation theory
Basic elements
• Dispersal-based colonizationfunction
• Rescue effect
• Correlated extinction
Missing elements
• Observation model
MacKenzie et al. (2003) occupancy modelsprovided the latter, but not the former
Introduction Metapopulations Scale of habitat selection 13 / 35

Metapopulation theory
Basic elements
• Dispersal-based colonizationfunction
• Rescue effect
• Correlated extinction
Missing elements
• Observation model
MacKenzie et al. (2003) occupancy modelsprovided the latter, but not the former
Introduction Metapopulations Scale of habitat selection 13 / 35

Metapopulation theory
Basic elements
• Dispersal-based colonizationfunction
• Rescue effect
• Correlated extinction
Missing elements
• Observation model
MacKenzie et al. (2003) occupancy modelsprovided the latter, but not the former
Introduction Metapopulations Scale of habitat selection 13 / 35

Standard dynamic occupancy model
Initial occupancyzi,1 ∼ Bern(ψ)
Colonization and extinction
zi,k ∼ Bern(µi,k)
µi,k = (1− zi,k)γ + zi,k(1− ε)
Detectionyi,j,k ∼ Bern(zi,k × p)
Useful, but doesn’t allow formetapopulation extinction
Introduction Metapopulations Scale of habitat selection 14 / 35

Standard dynamic occupancy model
Initial occupancyzi,1 ∼ Bern(ψ)
Colonization and extinction
zi,k ∼ Bern(µi,k)
µi,k = (1− zi,k)γ + zi,k(1− ε)
Detectionyi,j,k ∼ Bern(zi,k × p)
Useful, but doesn’t allow formetapopulation extinction
Introduction Metapopulations Scale of habitat selection 14 / 35

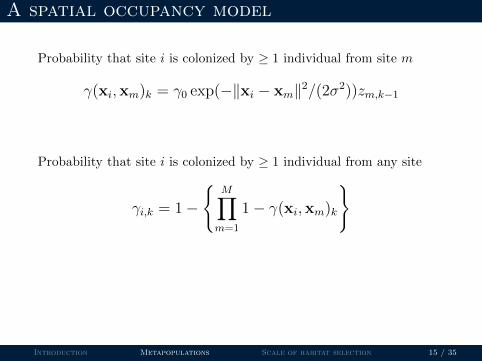
A spatial occupancy model
Probability that site i is colonized by ≥ 1 individual from site m
γ(xi,xm)k = γ0 exp(−‖xi − xm‖2/(2σ2))zm,k−1
Probability that site i is colonized by ≥ 1 individual from any site
γi,k = 1−
{M∏
m=1
1− γ(xi,xm)k
}Hence:
• Metapopulation extinction is possible
• Useful for PVA, connectivity planning
Introduction Metapopulations Scale of habitat selection 15 / 35
A spatial occupancy model
Probability that site i is colonized by ≥ 1 individual from site m
γ(xi,xm)k = γ0 exp(−‖xi − xm‖2/(2σ2))zm,k−1
Probability that site i is colonized by ≥ 1 individual from any site
γi,k = 1−
{M∏
m=1
1− γ(xi,xm)k
}
Hence:
• Metapopulation extinction is possible
• Useful for PVA, connectivity planning
Introduction Metapopulations Scale of habitat selection 15 / 35

A spatial occupancy model
Probability that site i is colonized by ≥ 1 individual from site m
γ(xi,xm)k = γ0 exp(−‖xi − xm‖2/(2σ2))zm,k−1
Probability that site i is colonized by ≥ 1 individual from any site
γi,k = 1−
{M∏
m=1
1− γ(xi,xm)k
}Hence:
• Metapopulation extinction is possible
• Useful for PVA, connectivity planning
Introduction Metapopulations Scale of habitat selection 15 / 35

Results – Local extinction and hydroperiod
●
●
●
0.0
0.2
0.4
0.6
0.8
1.0
Loca
l ext
inct
ion
prob
abili
ty (
ε)
Intermittent Semi−permanent Permanent
Introduction Metapopulations Scale of habitat selection 16 / 35

Results – Colonization
Introduction Metapopulations Scale of habitat selection 17 / 35

Results – Colonization and connectivity
Introduction Metapopulations Scale of habitat selection 18 / 35

Results – Proportion of sites occupied
2000 2020 2040 2060 2080 2100
0.0
0.2
0.4
0.6
0.8
1.0
Year
Pro
port
ion
of s
ites
occu
pied
Introduction Metapopulations Scale of habitat selection 19 / 35

Results – Extinction risk
2000 2020 2040 2060 2080 2100
0.00
0.02
0.04
0.06
0.08
0.10
Year
Met
apop
ulat
ion
extin
ctio
n pr
obab
ility
Status quo
How important are sites with permanent water?Introduction Metapopulations Scale of habitat selection 20 / 35

Results – Extinction risk
2000 2020 2040 2060 2080 2100
0.00
0.02
0.04
0.06
0.08
0.10
Year
Met
apop
ulat
ion
extin
ctio
n pr
obab
ility
1 failed siteStatus quo
How important are sites with permanent water?Introduction Metapopulations Scale of habitat selection 20 / 35

Results – Extinction risk
2000 2020 2040 2060 2080 2100
0.00
0.02
0.04
0.06
0.08
0.10
Year
Met
apop
ulat
ion
extin
ctio
n pr
obab
ility
2 failed sites1 failed siteStatus quo
How important are sites with permanent water?Introduction Metapopulations Scale of habitat selection 20 / 35

Future directions
• Landscape resistance tomovement
• Abundance-basedformulation
• Decision analysis
Introduction Metapopulations Scale of habitat selection 21 / 35

Trailing-edge populations
Introduction Metapopulations Scale of habitat selection 22 / 35

Trailing-edge populations
Introduction Metapopulations Scale of habitat selection 22 / 35

Trailing-edge populations
Introduction Metapopulations Scale of habitat selection 22 / 35

Trailing-edge populations
Introduction Metapopulations Scale of habitat selection 22 / 35

Trailing-edge populations
Introduction Metapopulations Scale of habitat selection 22 / 35

Trailing-edge populations
Introduction Metapopulations Scale of habitat selection 22 / 35

Trailing-edge populations
Introduction Metapopulations Scale of habitat selection 22 / 35

Trailing-edge populations
Introduction Metapopulations Scale of habitat selection 22 / 35

Hypotheses
Populations at southern range limits are:
• Genetically unique
• Declining due to rapid environmental change
Questions
• Will they be able to adapt or move?
• How can forest managment and landscapeplanning increase viability?
Introduction Metapopulations Scale of habitat selection 23 / 35

First steps
Habitat selection and habitat-specific demographics
Introduction Metapopulations Scale of habitat selection 24 / 35

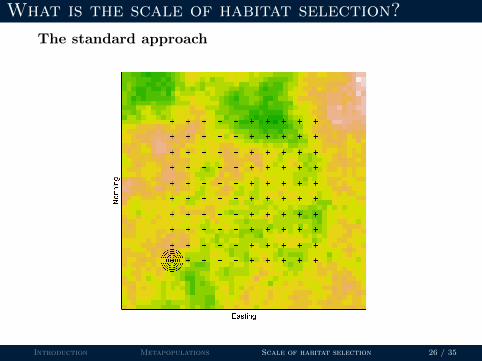
The “scale problem”
How does an individual select a site?
Introduction Metapopulations Scale of habitat selection 25 / 35

What is the scale of habitat selection?
The standard approach
Introduction Metapopulations Scale of habitat selection 26 / 35
What is the scale of habitat selection?
The standard approach
Introduction Metapopulations Scale of habitat selection 26 / 35

What is the scale of habitat selection?
A new approach
Introduction Metapopulations Scale of habitat selection 27 / 35

What is the scale of habitat selection?
A new approach
Introduction Metapopulations Scale of habitat selection 27 / 35

What is the scale of habitat selection?
A new approach
Introduction Metapopulations Scale of habitat selection 27 / 35

What is the scale of habitat selection?
A new approach
Introduction Metapopulations Scale of habitat selection 27 / 35

Outcome – spatial variation in abundance
Introduction Metapopulations Scale of habitat selection 28 / 35

Outcome – spatial variation in abundance
Introduction Metapopulations Scale of habitat selection 28 / 35

Canada Warbler example
Introduction Metapopulations Scale of habitat selection 29 / 35

Canada Warbler results
Model Parameters AICNDVI + s(Elevation) + s(Elevation)2 5 77.4NDVI + s(Elevation) 4 79.5NDVI + Elevation + Elevation2 3 80.0NDVI + Elevation 3 80.8s(NDVI) + Elevation 4 83.0
Introduction Metapopulations Scale of habitat selection 30 / 35

Canada Warbler results
0 200 400 600 800 1000
0.0
0.2
0.4
0.6
0.8
1.0
Distance (meters)S
moo
thin
g w
eigh
t
Introduction Metapopulations Scale of habitat selection 31 / 35

Canada Warbler results
0 200 400 600 800 1000
0.0
0.2
0.4
0.6
0.8
1.0
Distance (meters)S
moo
thin
g w
eigh
t
Introduction Metapopulations Scale of habitat selection 31 / 35

Canada Warbler results
Introduction Metapopulations Scale of habitat selection 32 / 35

Conclusions
(1) Spatial correlation results from ecologicalprocesses
(2) Spatial models use the correlation asinformation about these processes
Introduction Metapopulations Scale of habitat selection 33 / 35

Conclusions
(1) Spatial correlation results from ecologicalprocesses
(2) Spatial models use the correlation asinformation about these processes
Introduction Metapopulations Scale of habitat selection 33 / 35

Thanks• Leopard frog research team
I Erin MuthsI Blake HossackI Brent SigafusI Cecil SchwalbeI Chris JarchowI Paige Howell
• Canada Warbler research teamI Sam MerkerI Anna Joy LehmickeI Carly ChandlerI Jared Feura (photographs)
• FundingI USGS Amphibian Research and Monitoring InitiativeI Warnell School of Forestry and Natural Resources
Questions?