Embed Size (px)
Citation preview
Provenance Visualization for Biomedical Discovery
HARVARD MEDICAL SCHOOL DEPARTMENT OF BIOMEDICAL INFORMATICS
Nils Gehlenborg・http://gehlenborglab.org・@nils_gehlenborg
Tracing the Origins of Data and Ideas

Nature asked 1,576 researchers if there is a reproducibility crisis in science.
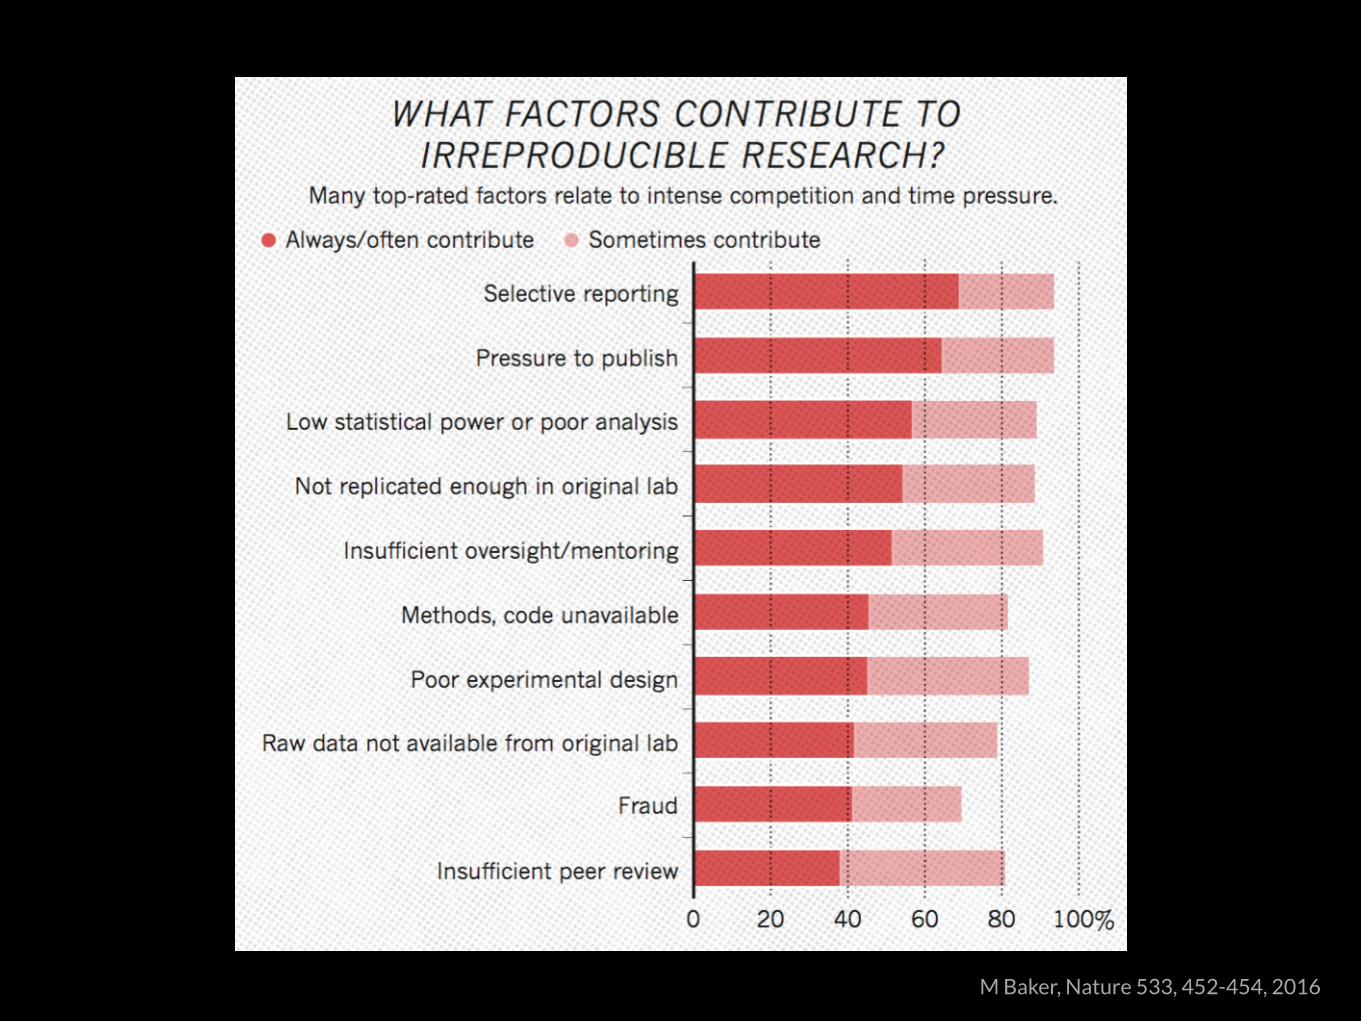
M Baker, Nature 533, 452-454, 2016

0% 100%
No crisis (3%)
Don’t know (7%)
Slight crisis (38%)
M Baker, Nature 533, 452-454, 2016
Significant crisis (52%)
Nature asked 1,576 researchers if there is a reproducibility crisis in science.
M Baker, Nature 533, 452-454, 2016

M Baker, Nature 533, 452-454, 2016
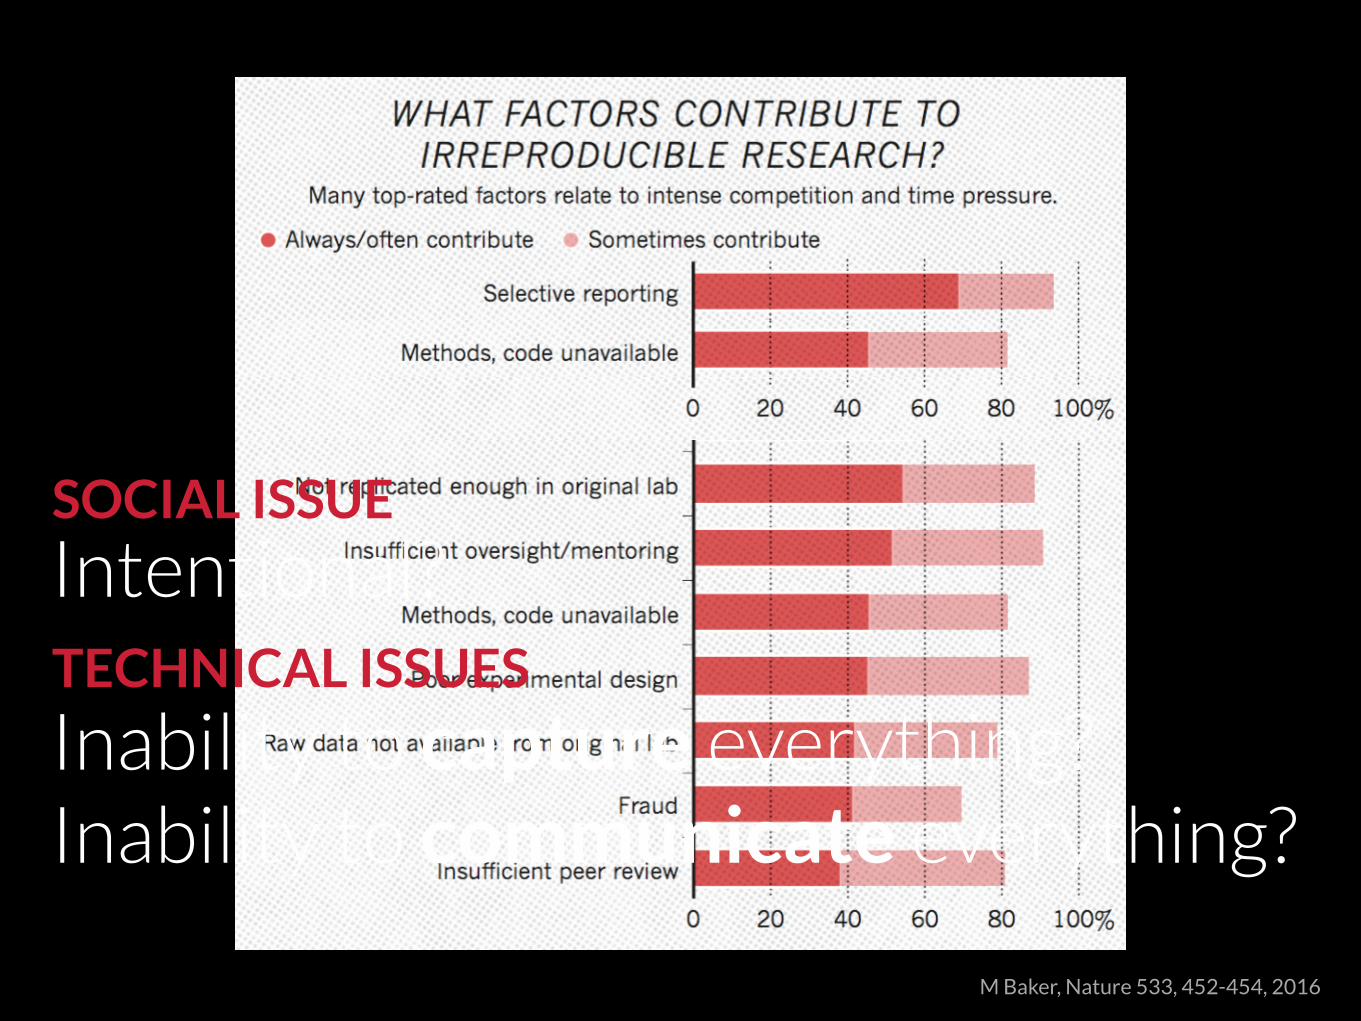
Intentional?
Inability to capture everything?
Inability to communicate everything?
M Baker, Nature 533, 452-454, 2016
Intentional?
Inability to capture everything?Inability to communicate everything?
SOCIAL ISSUE
TECHNICAL ISSUES

PROVENANCE
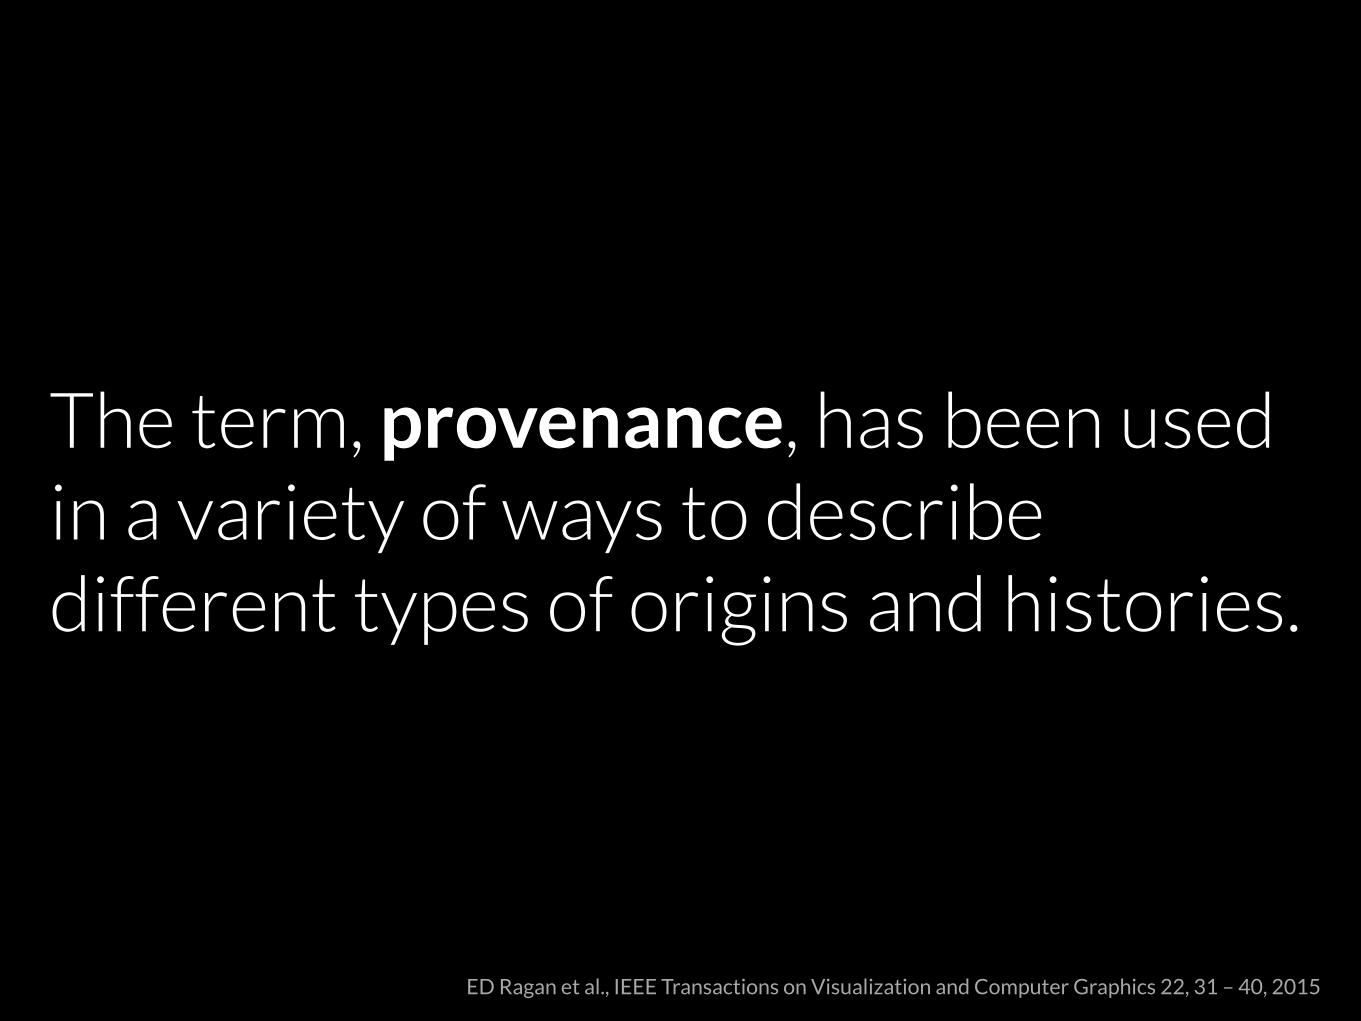
The term, provenance, has been used in a variety of ways to describe different types of origins and histories.
ED Ragan et al., IEEE Transactions on Visualization and Computer Graphics 22, 31 – 40, 2015
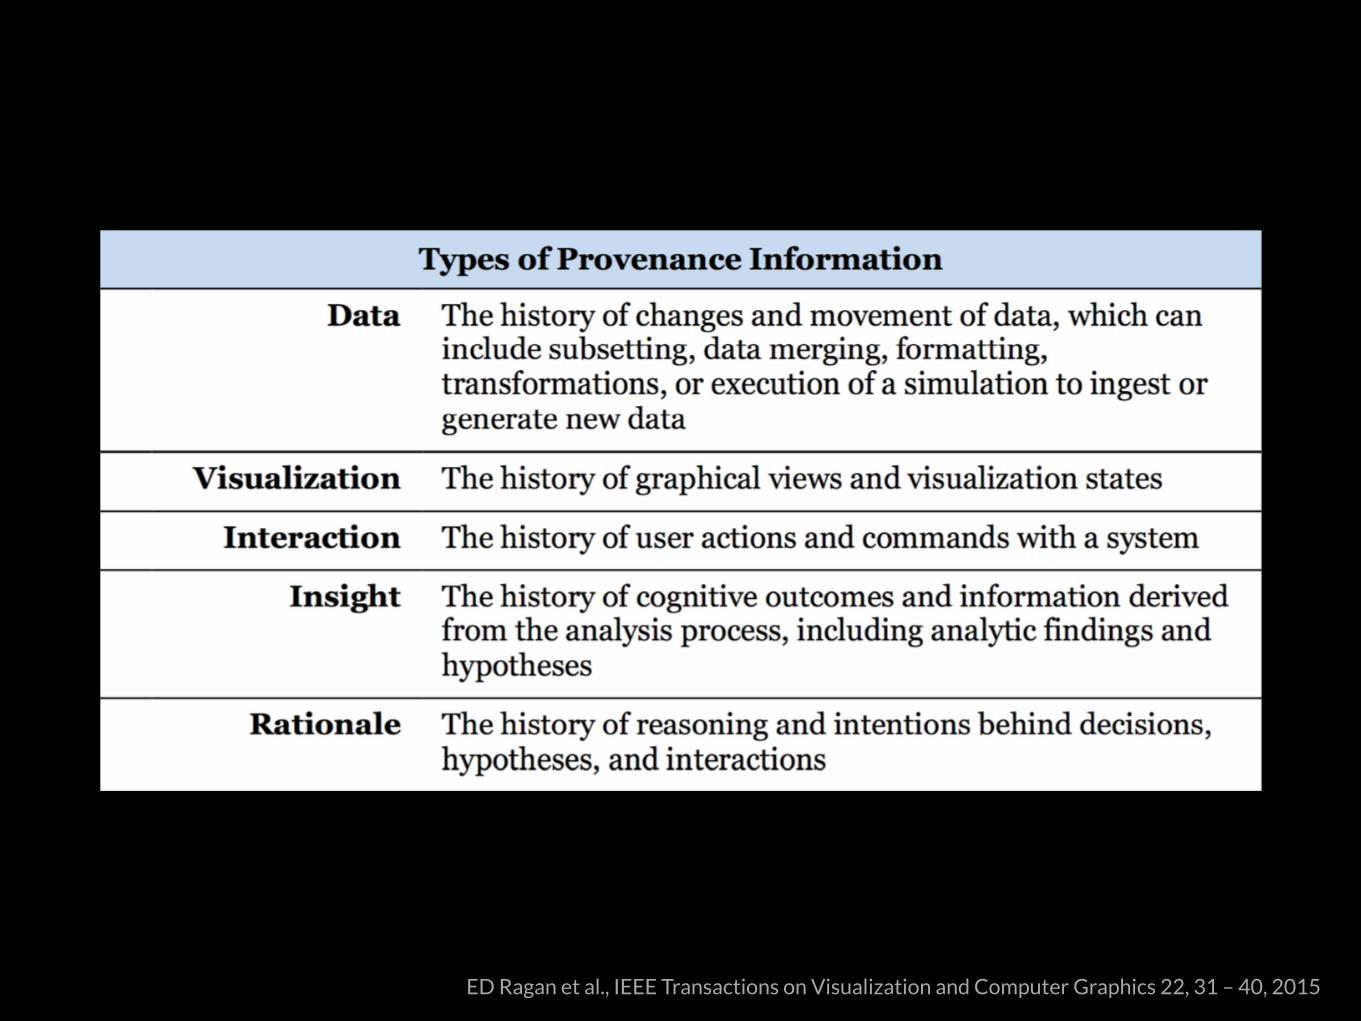
Types of Provenance Information
ED Ragan et al., IEEE Transactions on Visualization and Computer Graphics 22, 31 – 40, 2015
Data Visualization
Interaction
Insight
Rationale
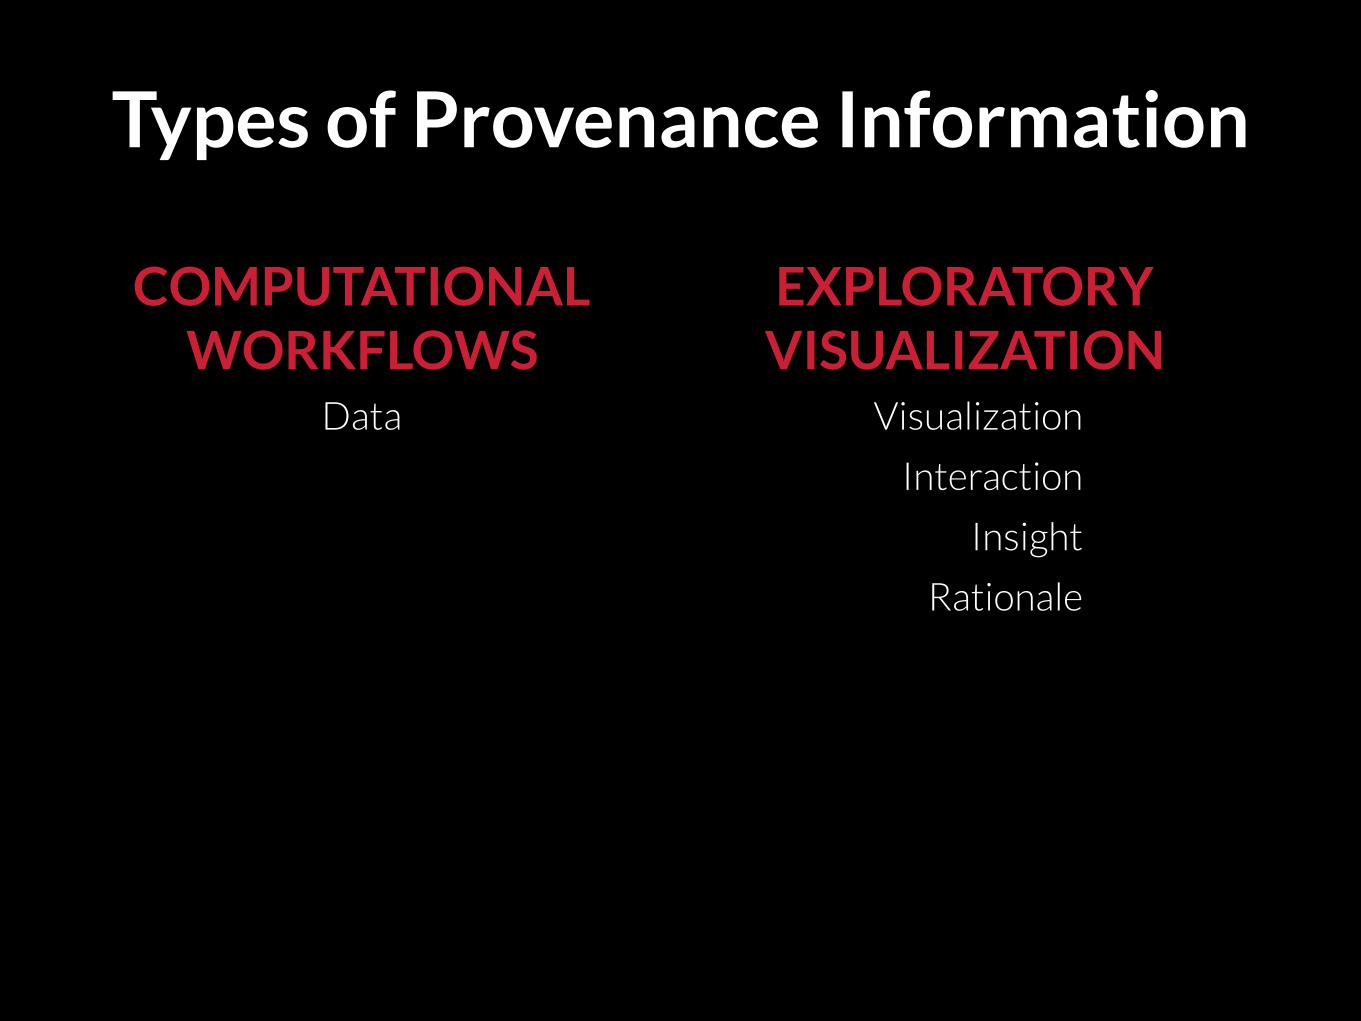
COMPUTATIONAL WORKFLOWS
EXPLORATORY VISUALIZATION
Types of Provenance Information

Data Visualization
Interaction
Insight
Rationale
COMPUTATIONAL WORKFLOWS
EXPLORATORY VISUALIZATION
Types of Provenance Information


ROLE OF VISUALIZATION
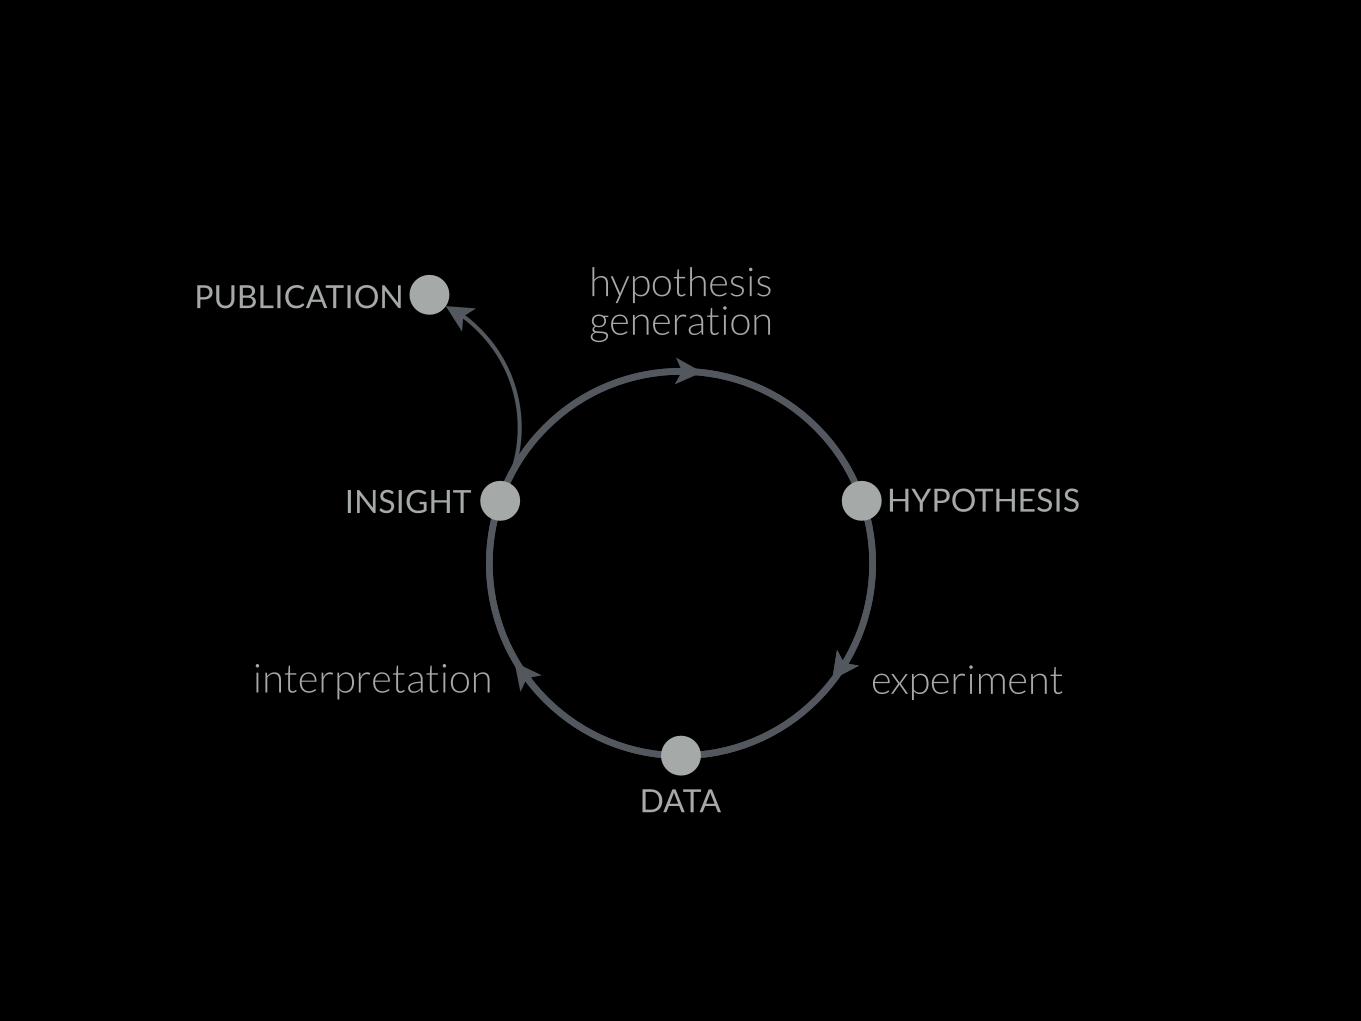
PUBLICATION
experiment
DATA
INSIGHT HYPOTHESIS
interpretation
hypothesis generation
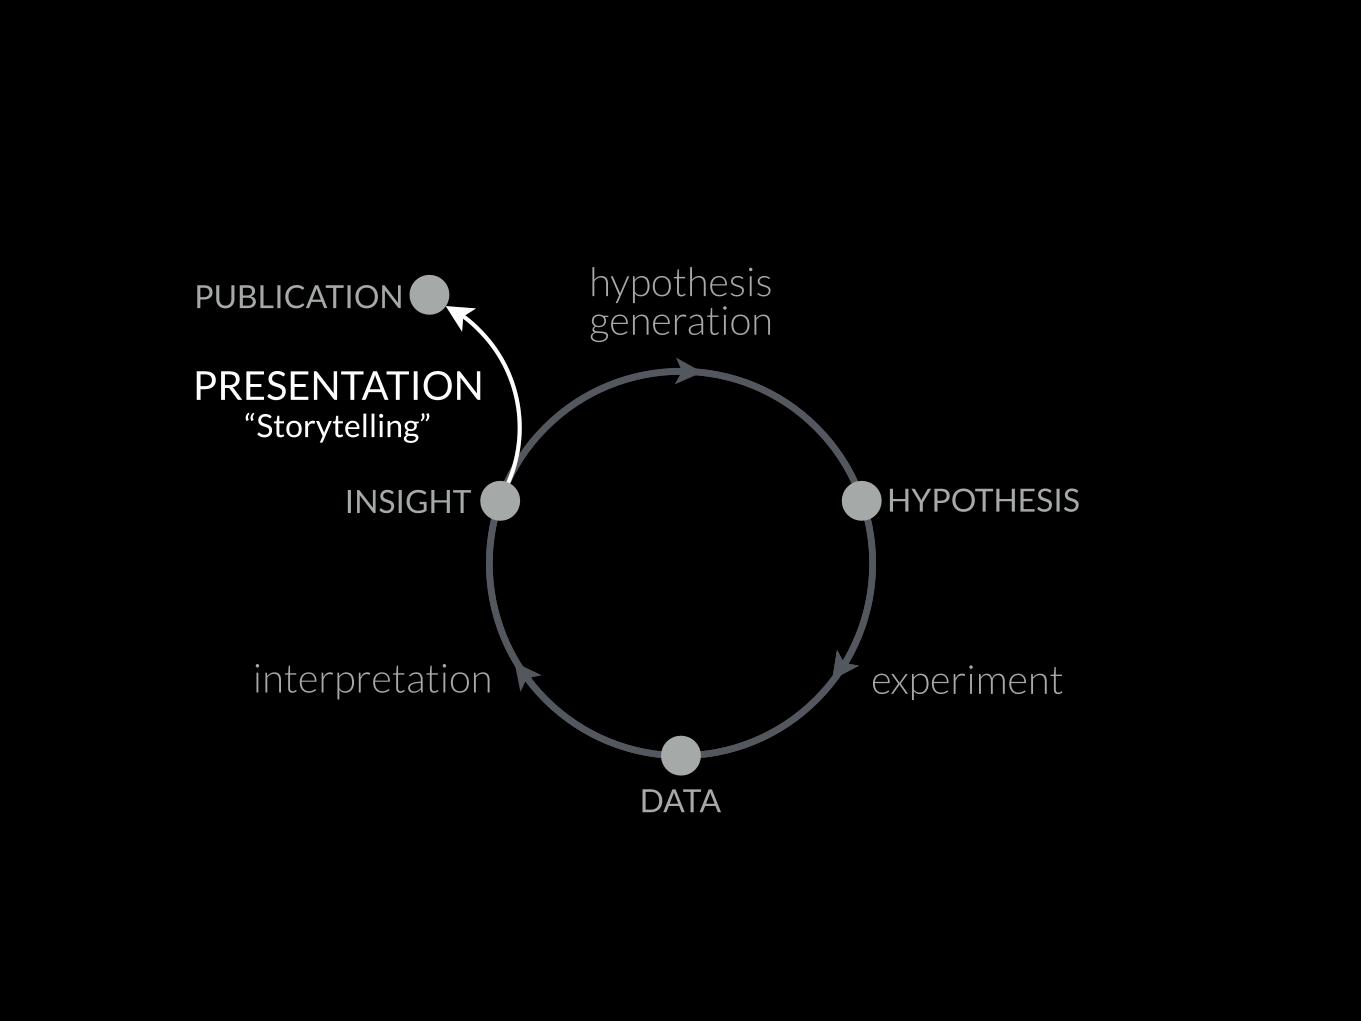
PUBLICATION
experiment
DATA
INSIGHT HYPOTHESIS
interpretation
hypothesis generation
PRESENTATION“Storytelling”
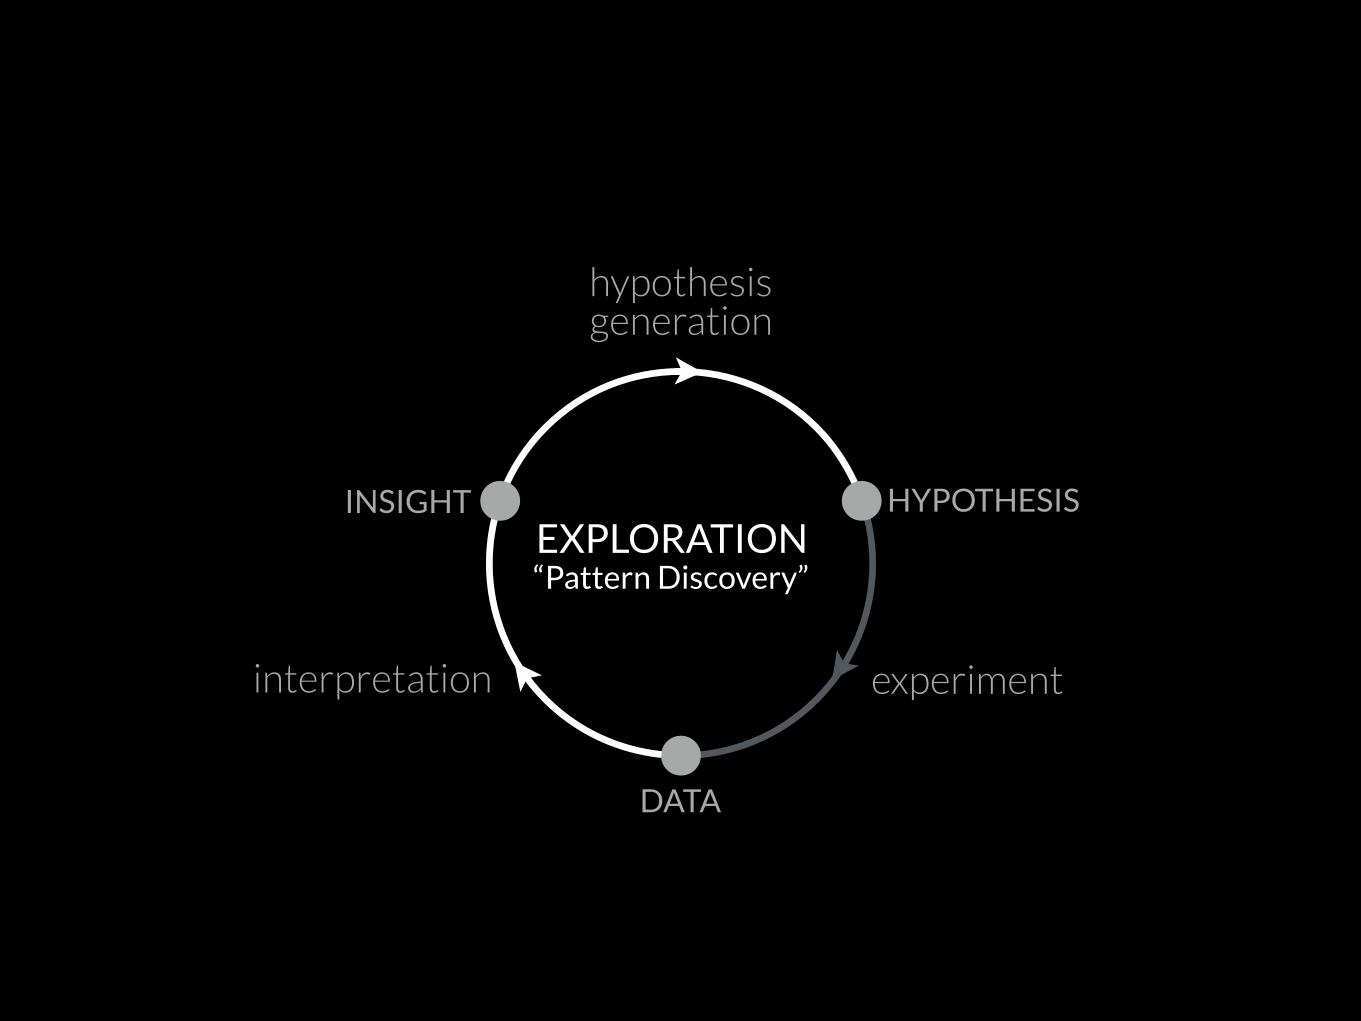
experiment
DATA
INSIGHT HYPOTHESIS
interpretation
hypothesis generation
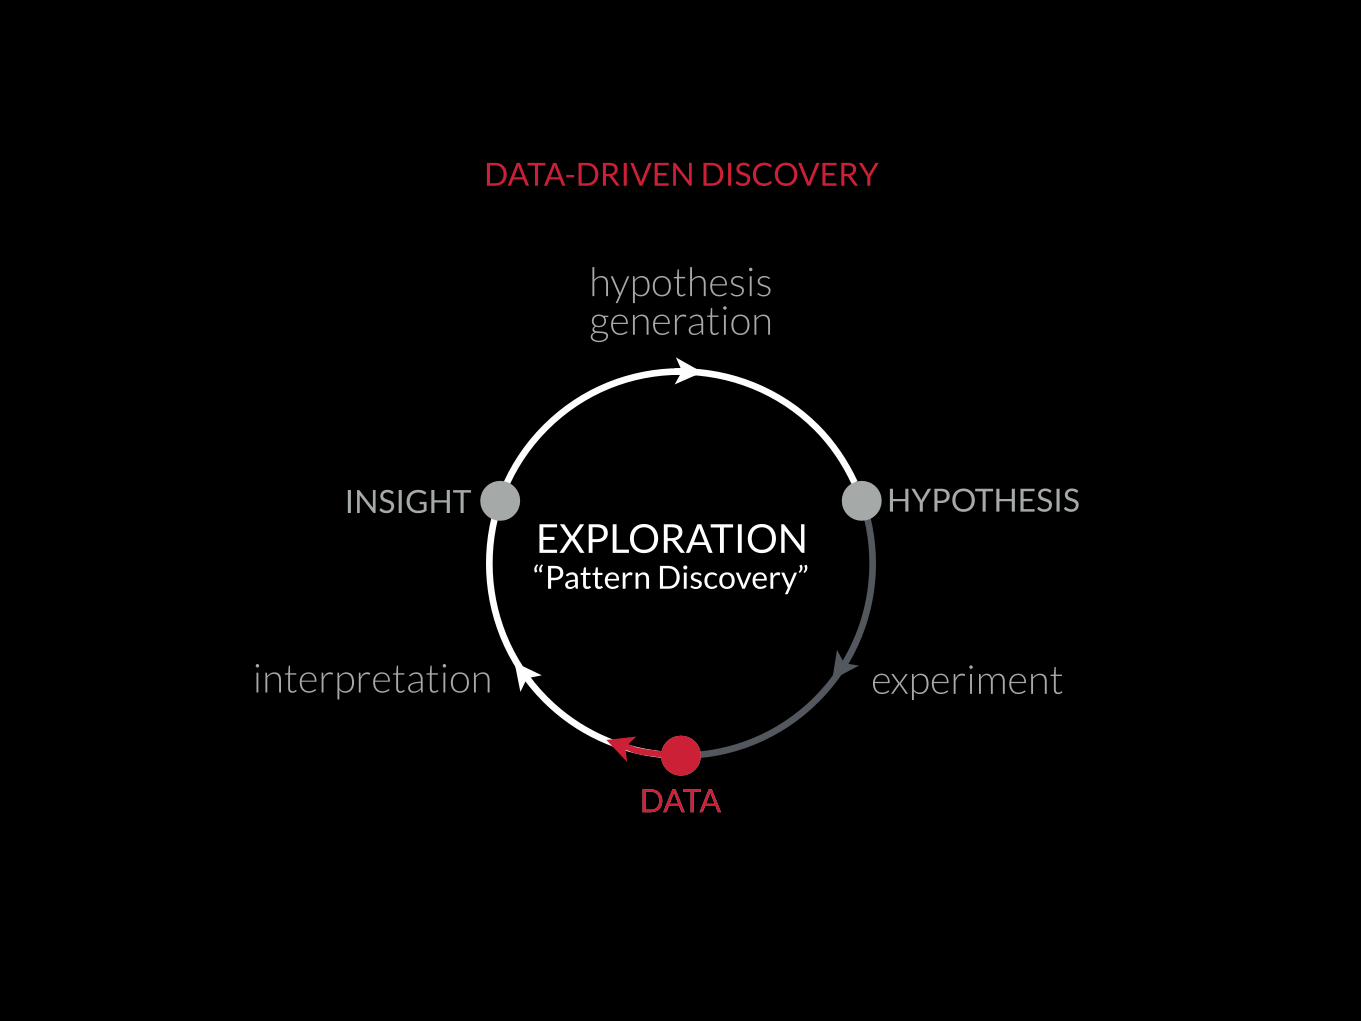
EXPLORATION“Pattern Discovery”

experiment
DATA
INSIGHT HYPOTHESIS
interpretation
HYPOTHESIS
hypothesis generation
EXPLORATION
HYPOTHESIS-DRIVEN DISCOVERY
“Pattern Discovery”

experiment
DATA
INSIGHT HYPOTHESIS
interpretation
DATA
hypothesis generation
EXPLORATION
DATA-DRIVEN DISCOVERY
“Pattern Discovery”
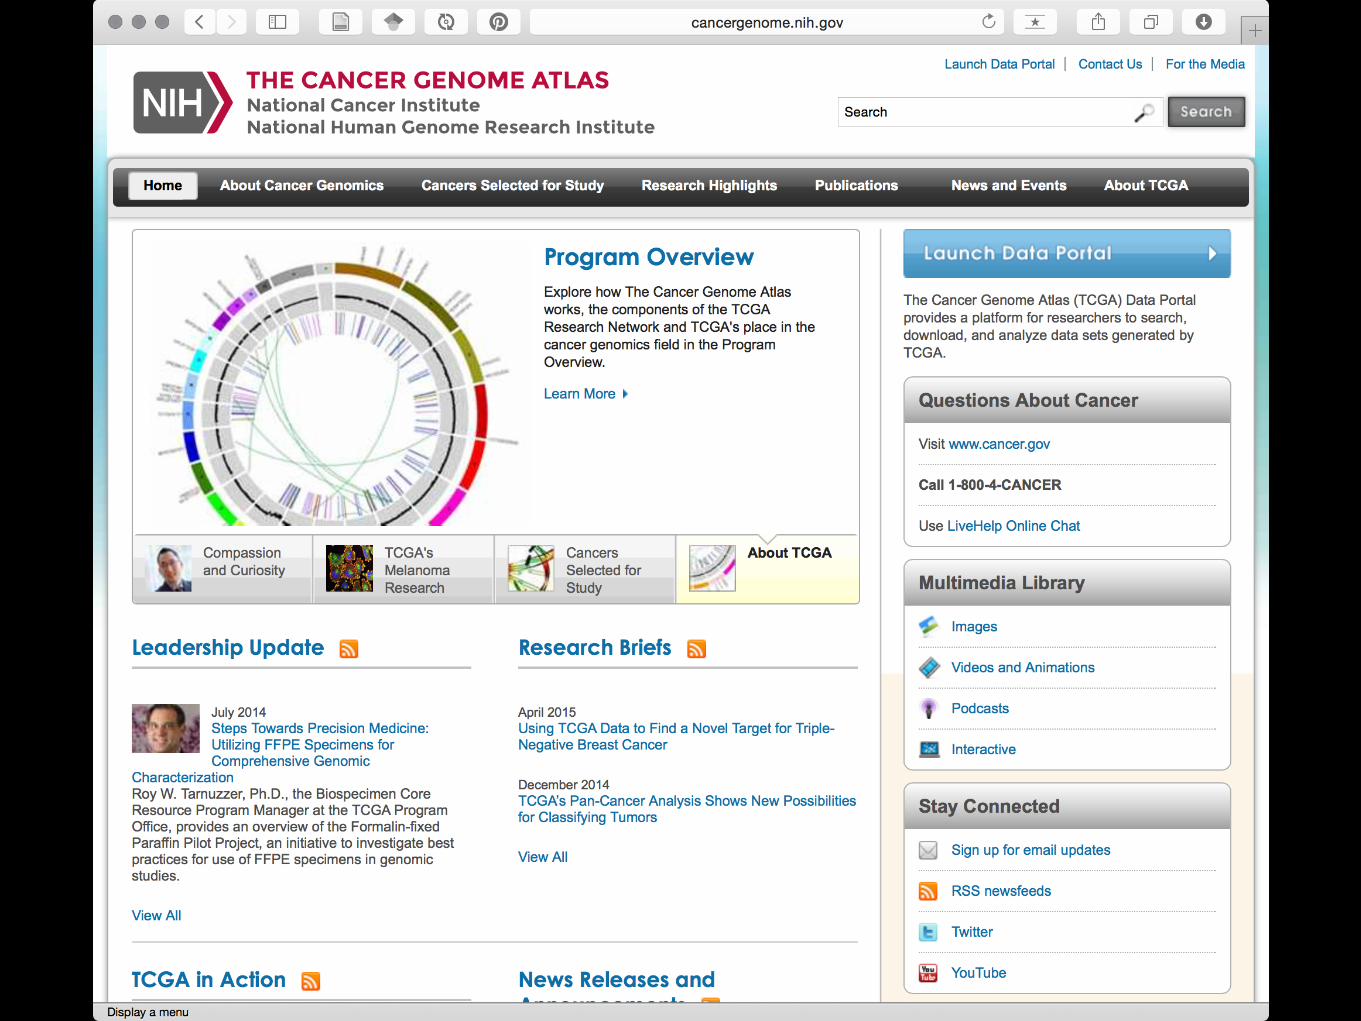
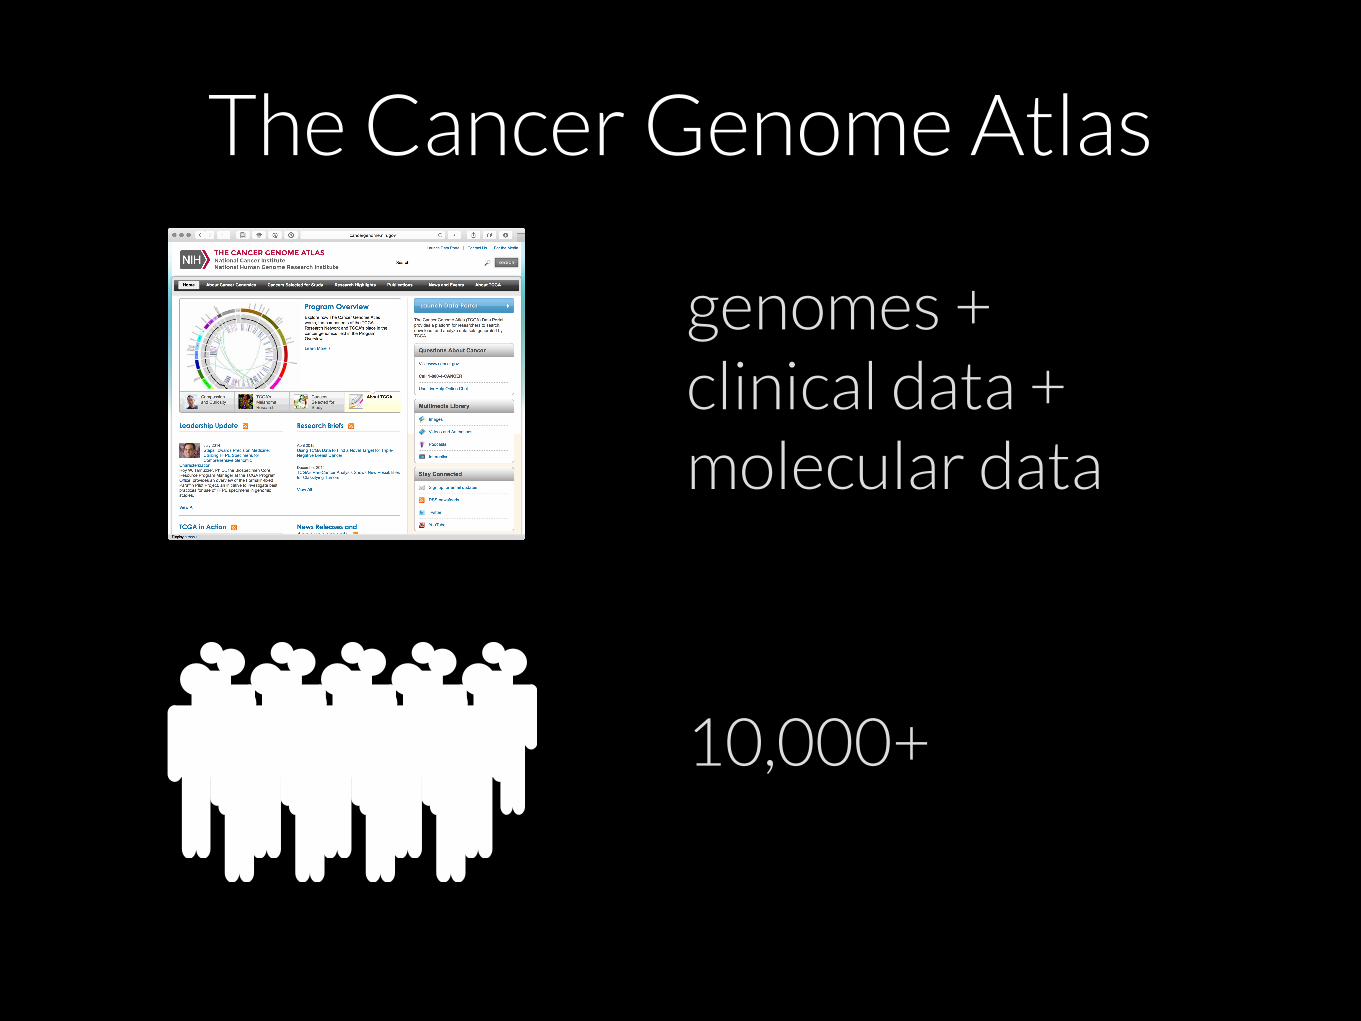
The Cancer Genome Atlas
10,000+
genomes + clinical data + molecular data

CANCER SUBTYPES

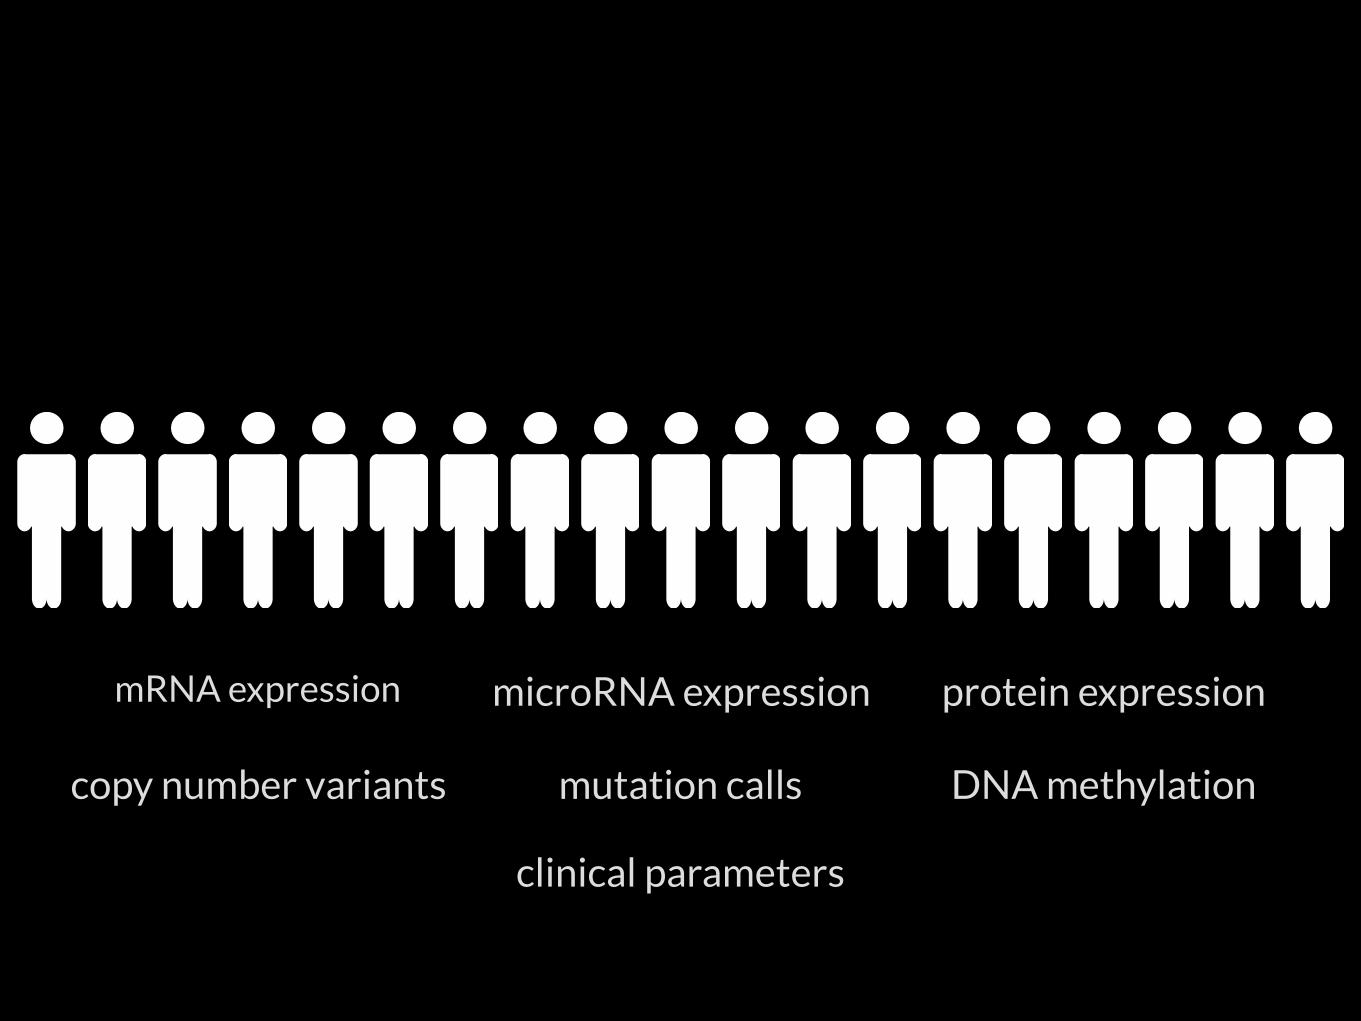
mRNA expression microRNA expression
DNA methylation
protein expression
copy number variants mutation calls
clinical parameters

mRNA expression microRNA expressionDNA methylation
protein expressioncopy number variants mutation calls
clinical parameters

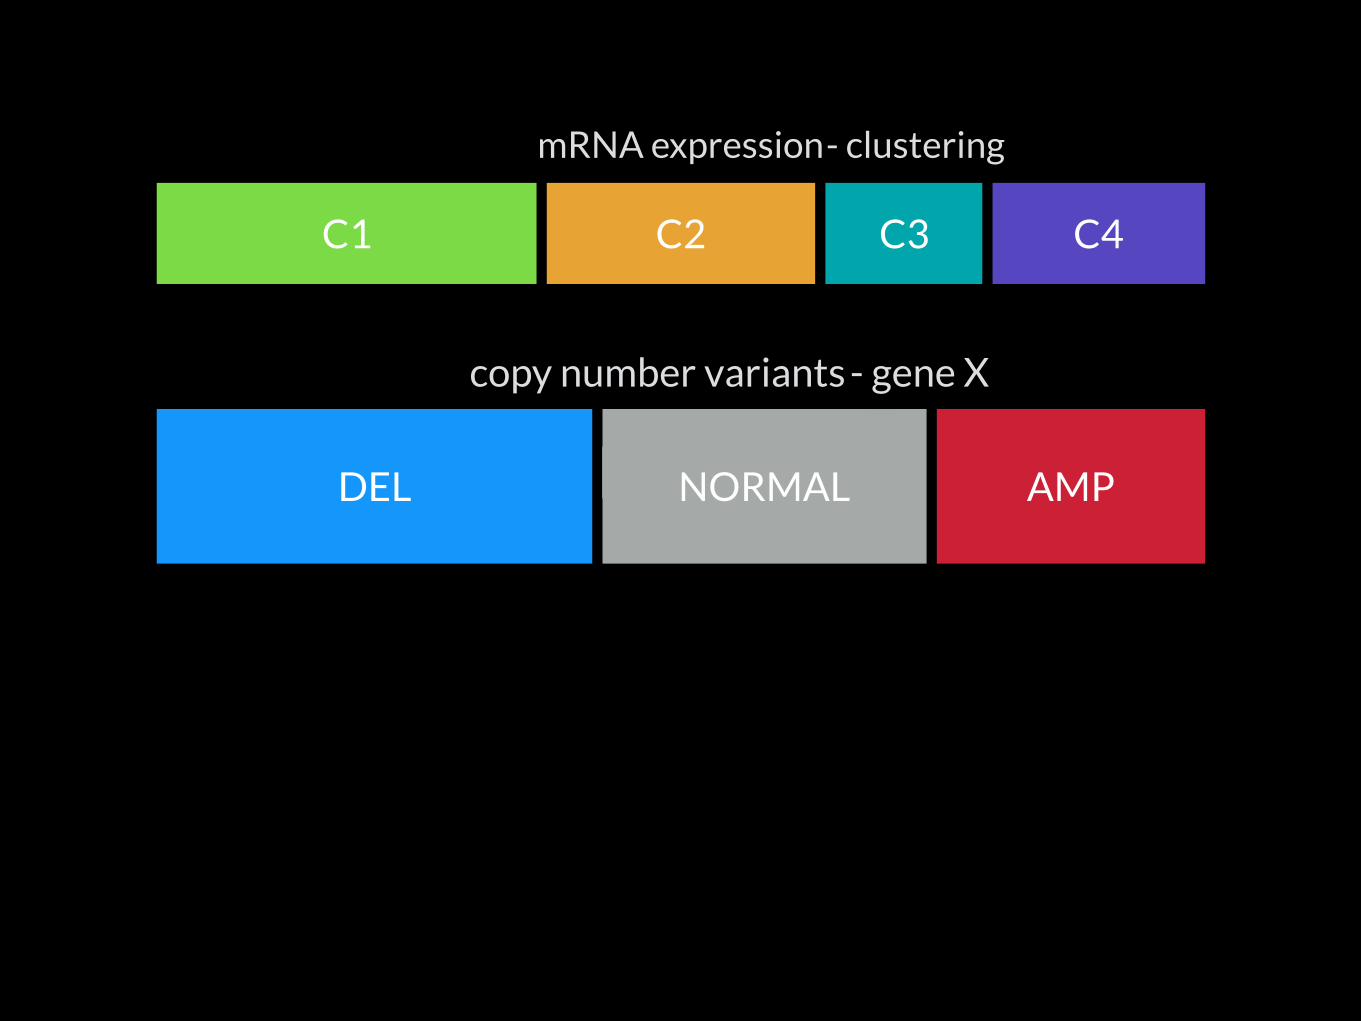
C4C3C2C1
mRNA expression - clustering
C4C3C2C1
mRNA expression
copy number variants
DEL NORMAL AMP
- clustering
- gene X

DEL NORMAL AMP
C4C3C2C1
mRNA expression
copy number variants
mutation calls
WILDTYPEMUT
- clustering
- gene X
- gene Y
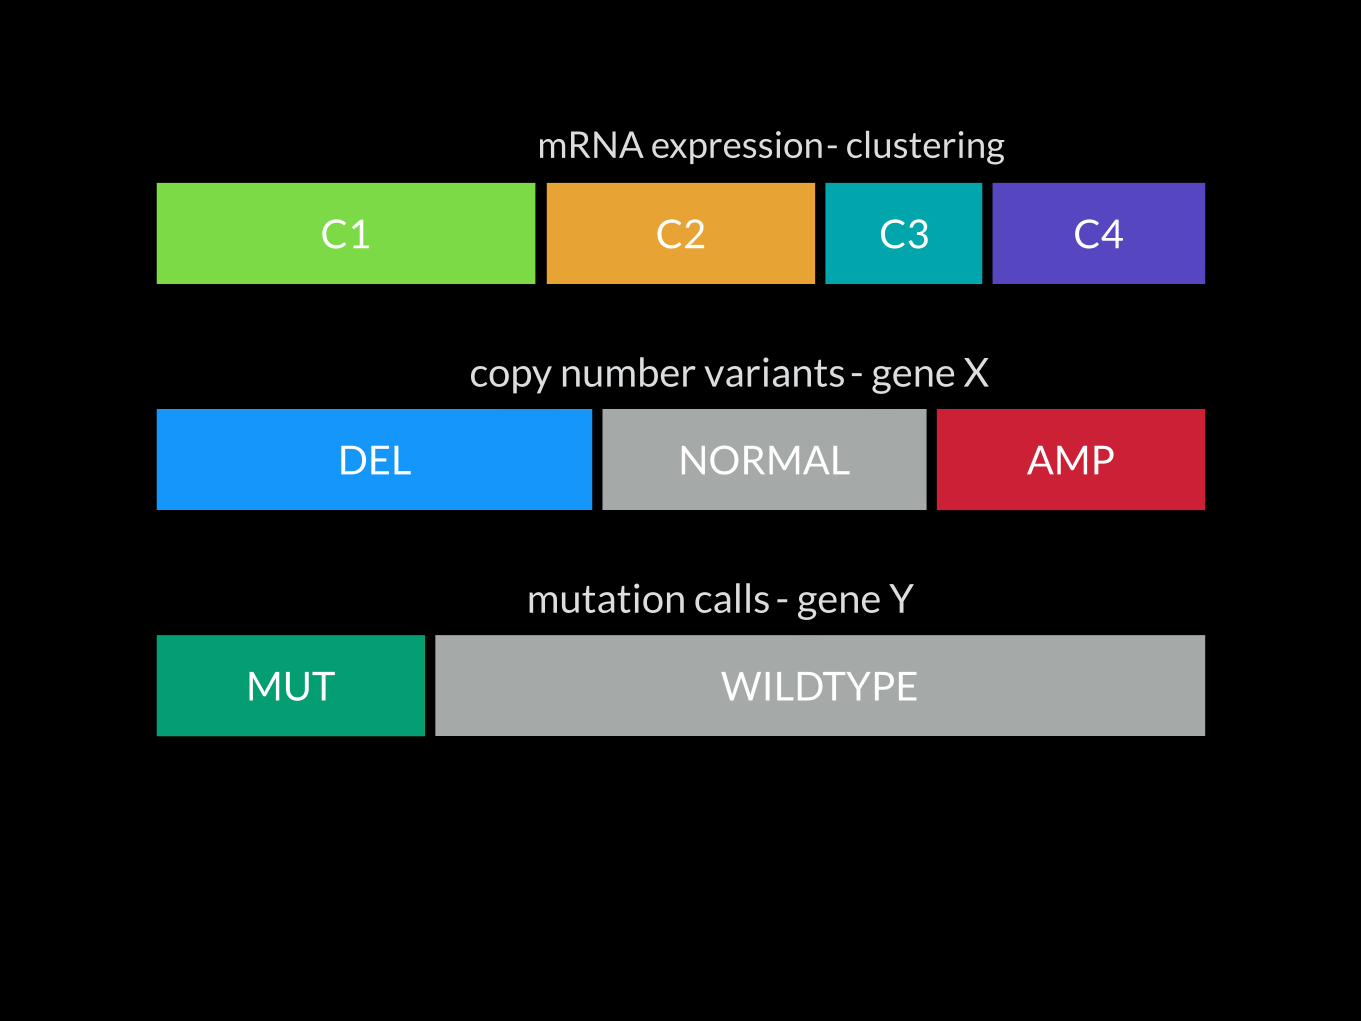
DEL NORMAL AMP
C4C3C2C1
mRNA expression
copy number variants
mutation calls
WILDTYPEMUT
- clustering
- gene X
- gene Y

DEL NORMAL AMP
C4C3C2C1
mRNA expression
copy number variants
mutation calls
WILDTYPEMUT
- clustering
- gene X
- gene Y
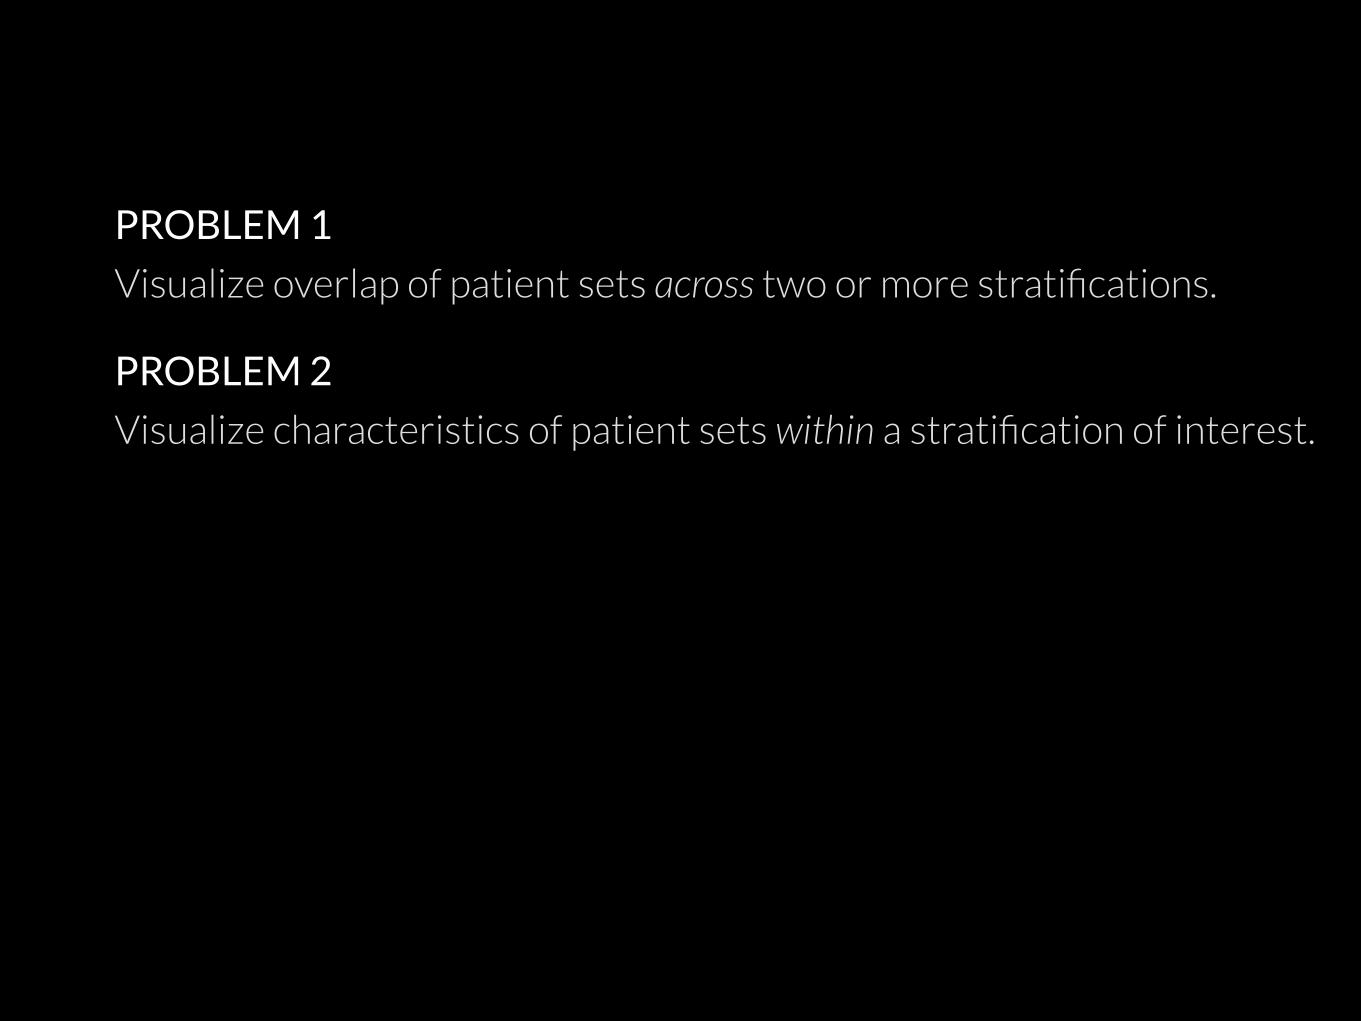
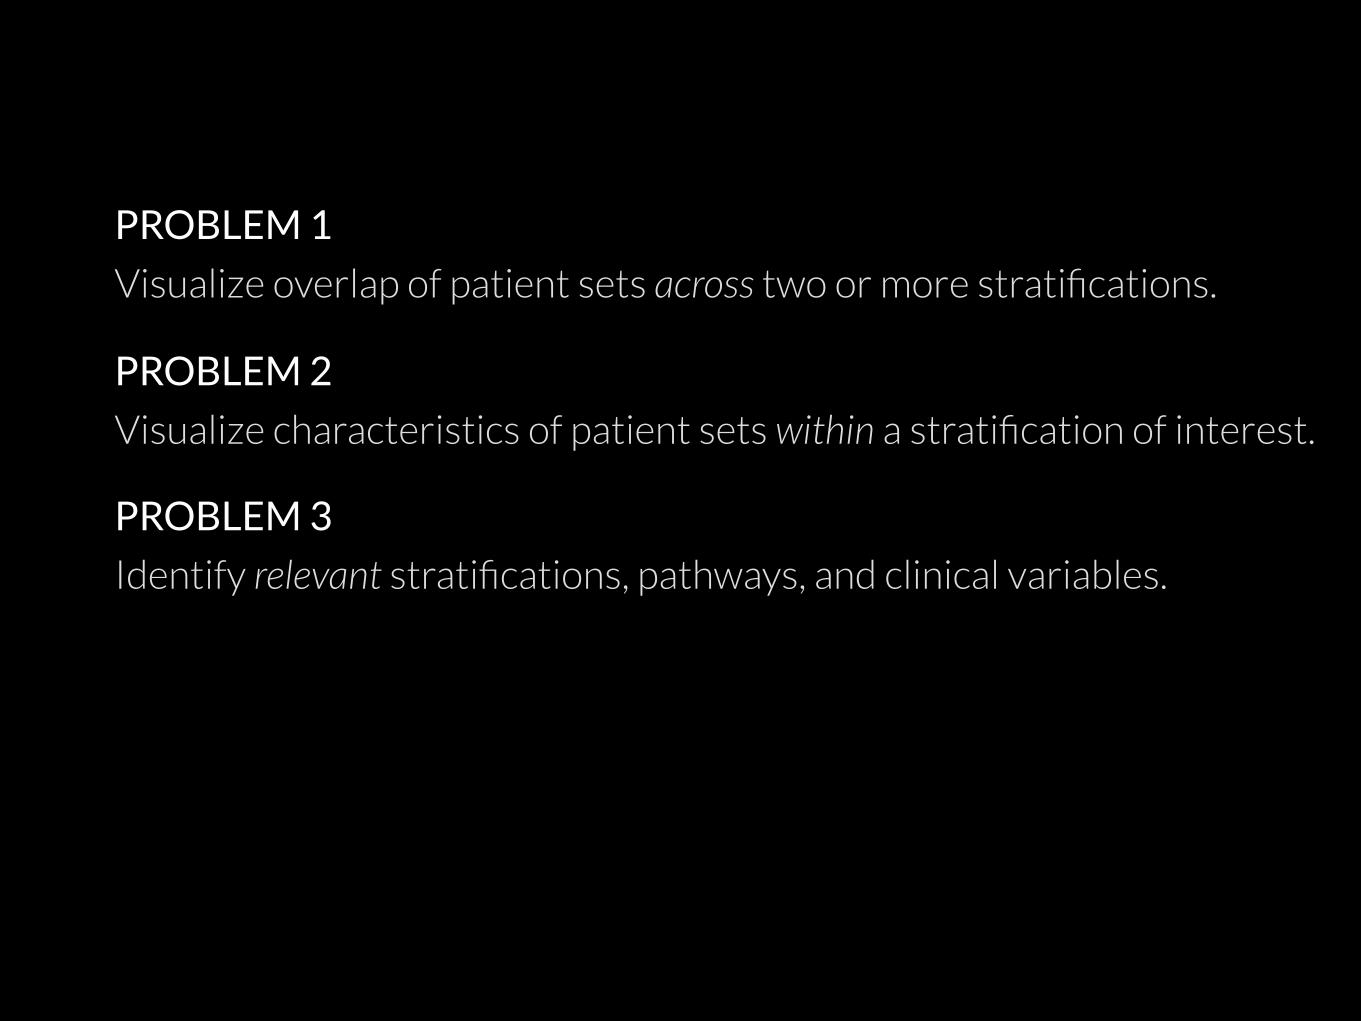
PROBLEM 1
Visualize overlap of patient sets across two or more stratifications.
PROBLEM 2
Visualize characteristics of patient sets within a stratification of interest.
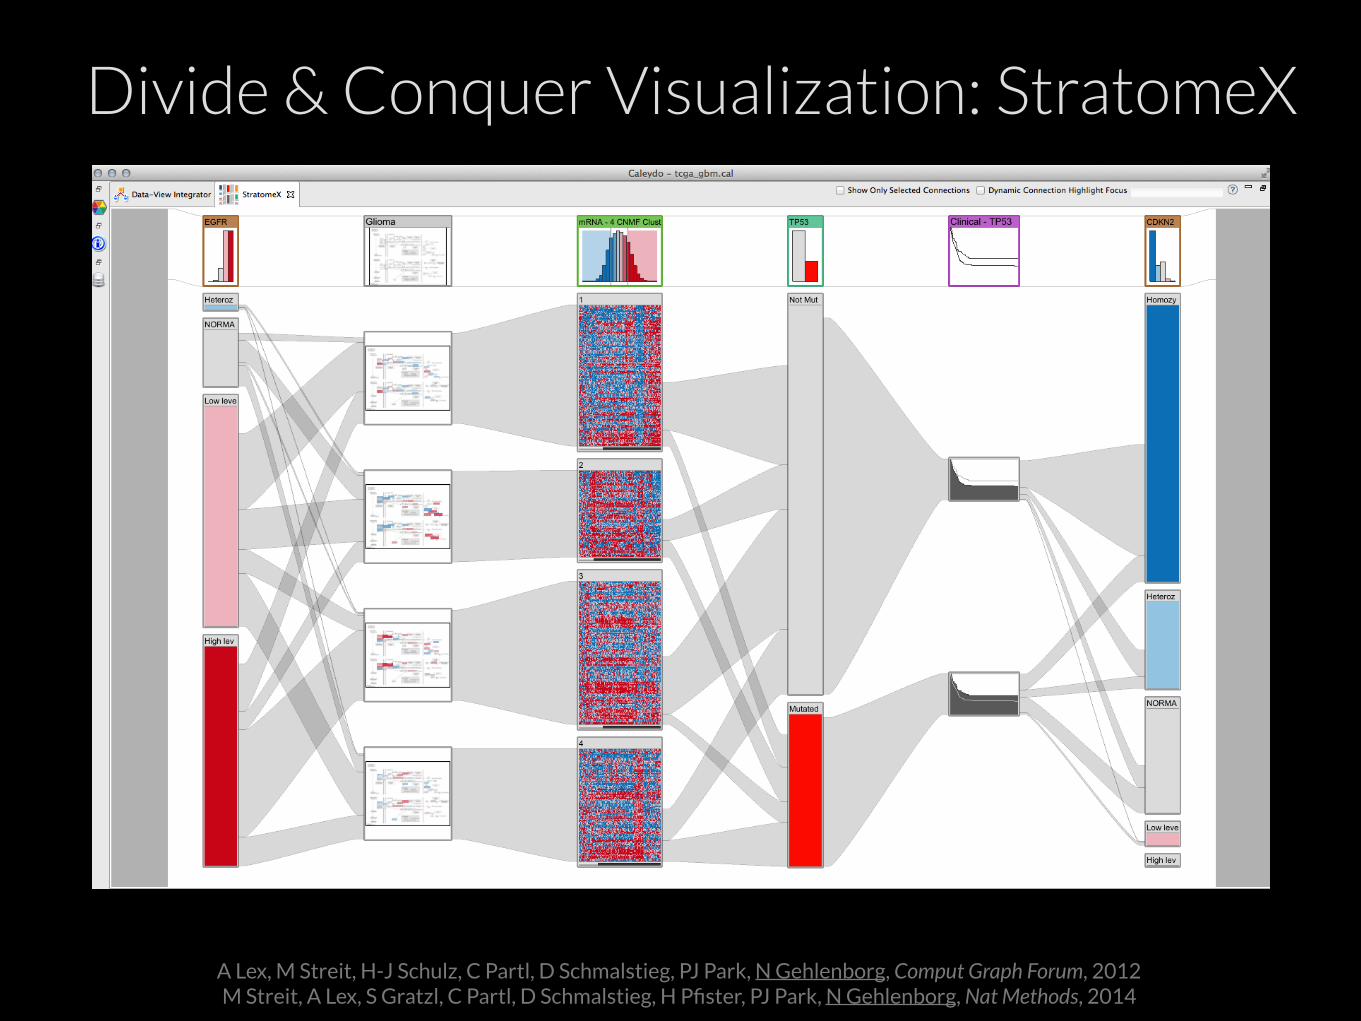
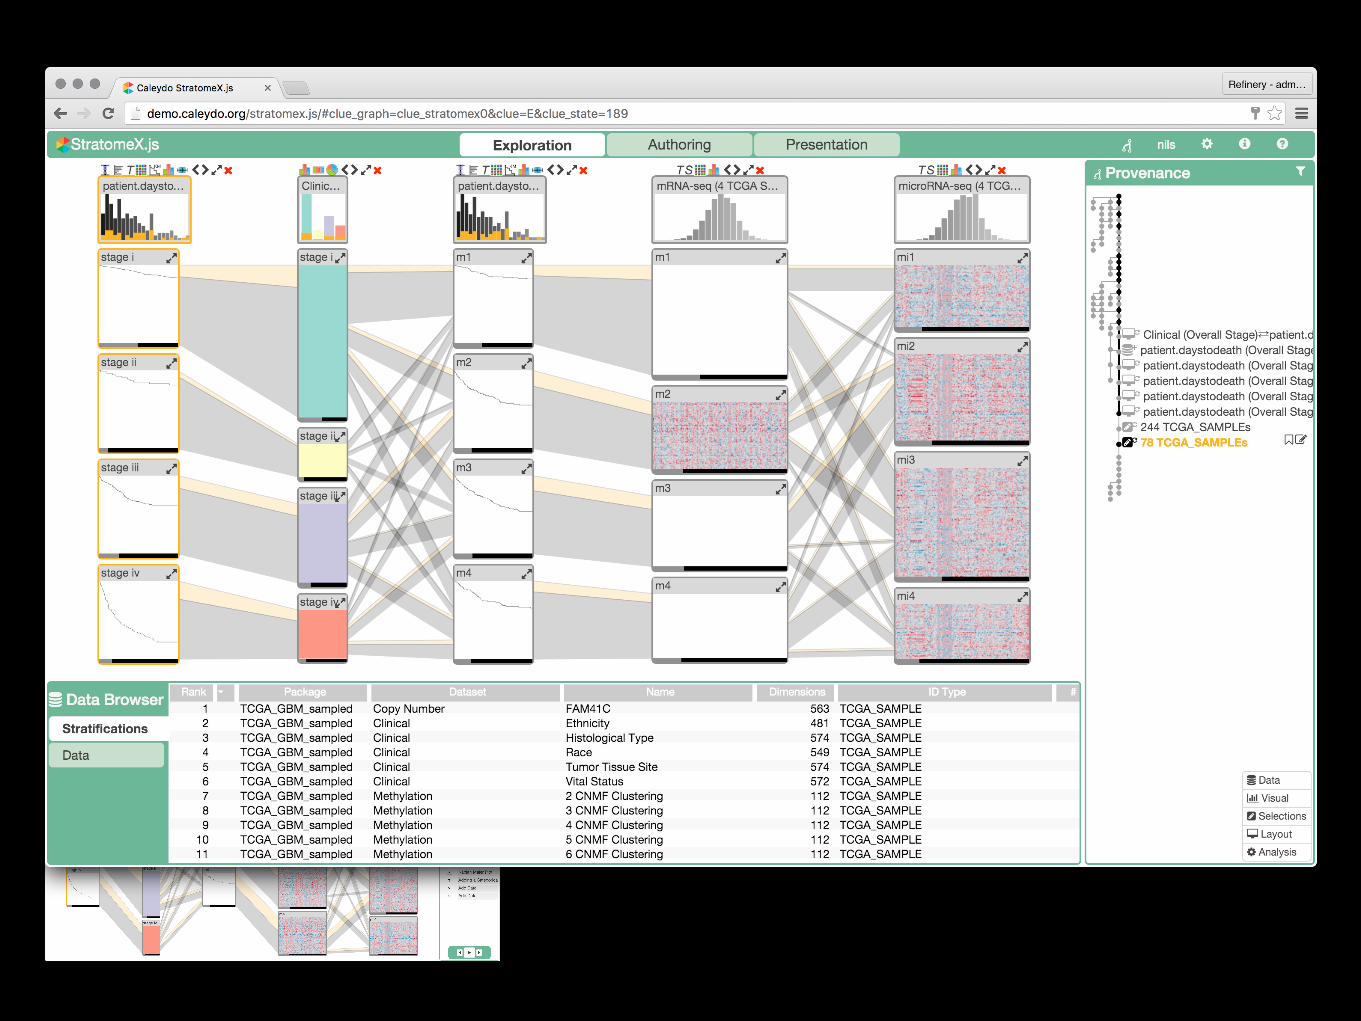
A Lex, M Streit, H-J Schulz, C Partl, D Schmalstieg, PJ Park, N Gehlenborg, Comput Graph Forum, 2012 M Streit, A Lex, S Gratzl, C Partl, D Schmalstieg, H Pfister, PJ Park, N Gehlenborg, Nat Methods, 2014
Divide & Conquer Visualization: StratomeX
PROBLEM 1
Visualize overlap of patient sets across two or more stratifications.
PROBLEM 2
Visualize characteristics of patient sets within a stratification of interest.
PROBLEM 3
Identify relevant stratifications, pathways, and clinical variables.
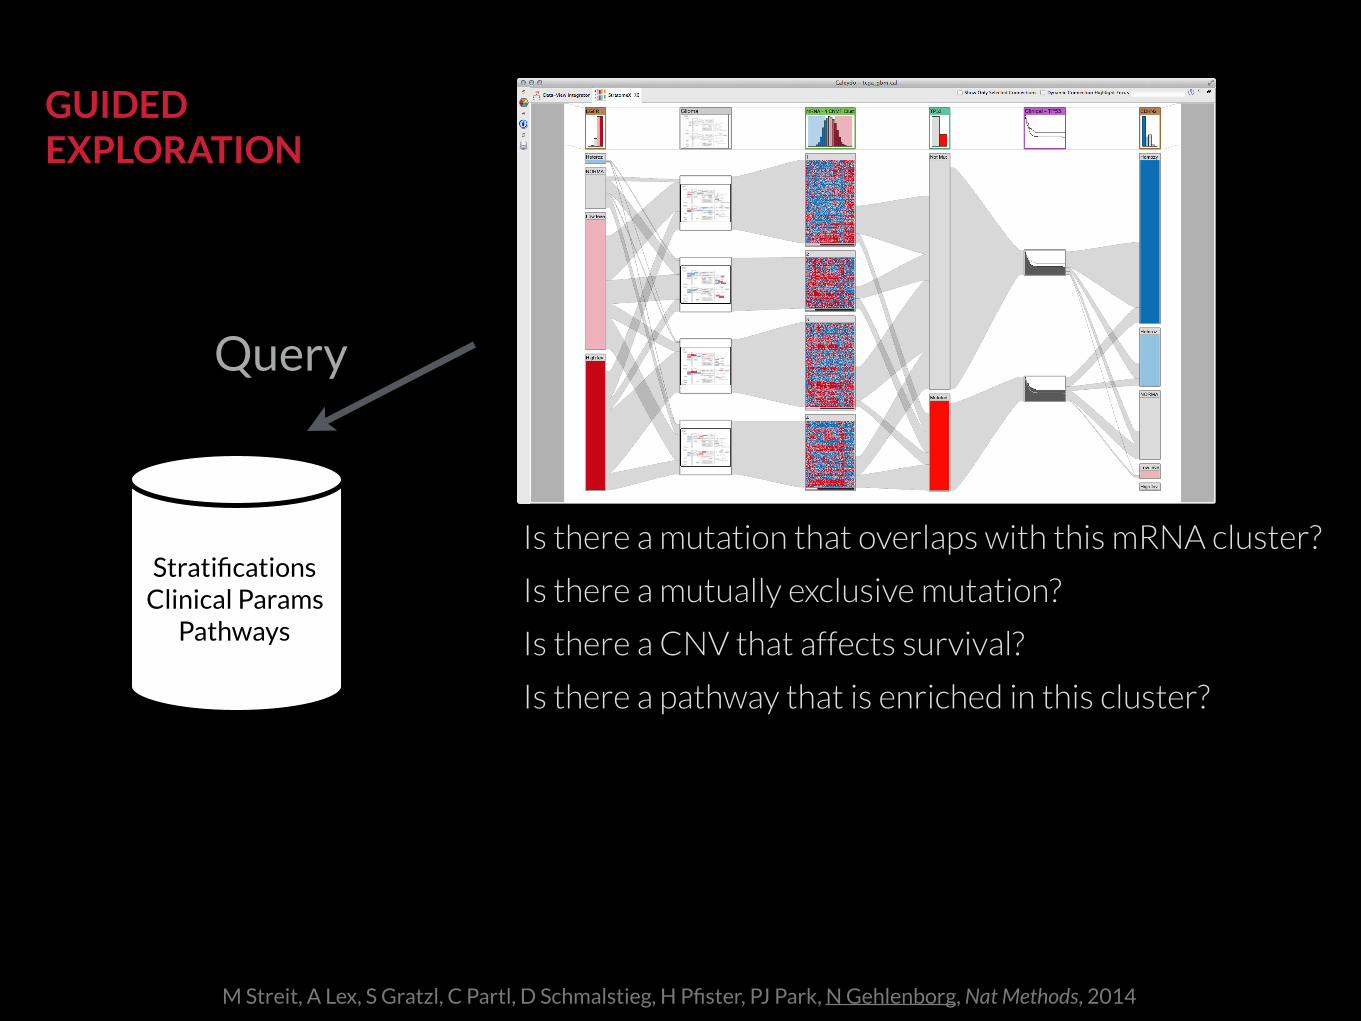
Is there a mutation that overlaps with this mRNA cluster?
Is there a CNV that affects survival?
Is there a pathway that is enriched in this cluster?
Is there a mutually exclusive mutation?
Query
Stratifications Clinical Params
Pathways
GUIDED EXPLORATION
M Streit, A Lex, S Gratzl, C Partl, D Schmalstieg, H Pfister, PJ Park, N Gehlenborg, Nat Methods, 2014
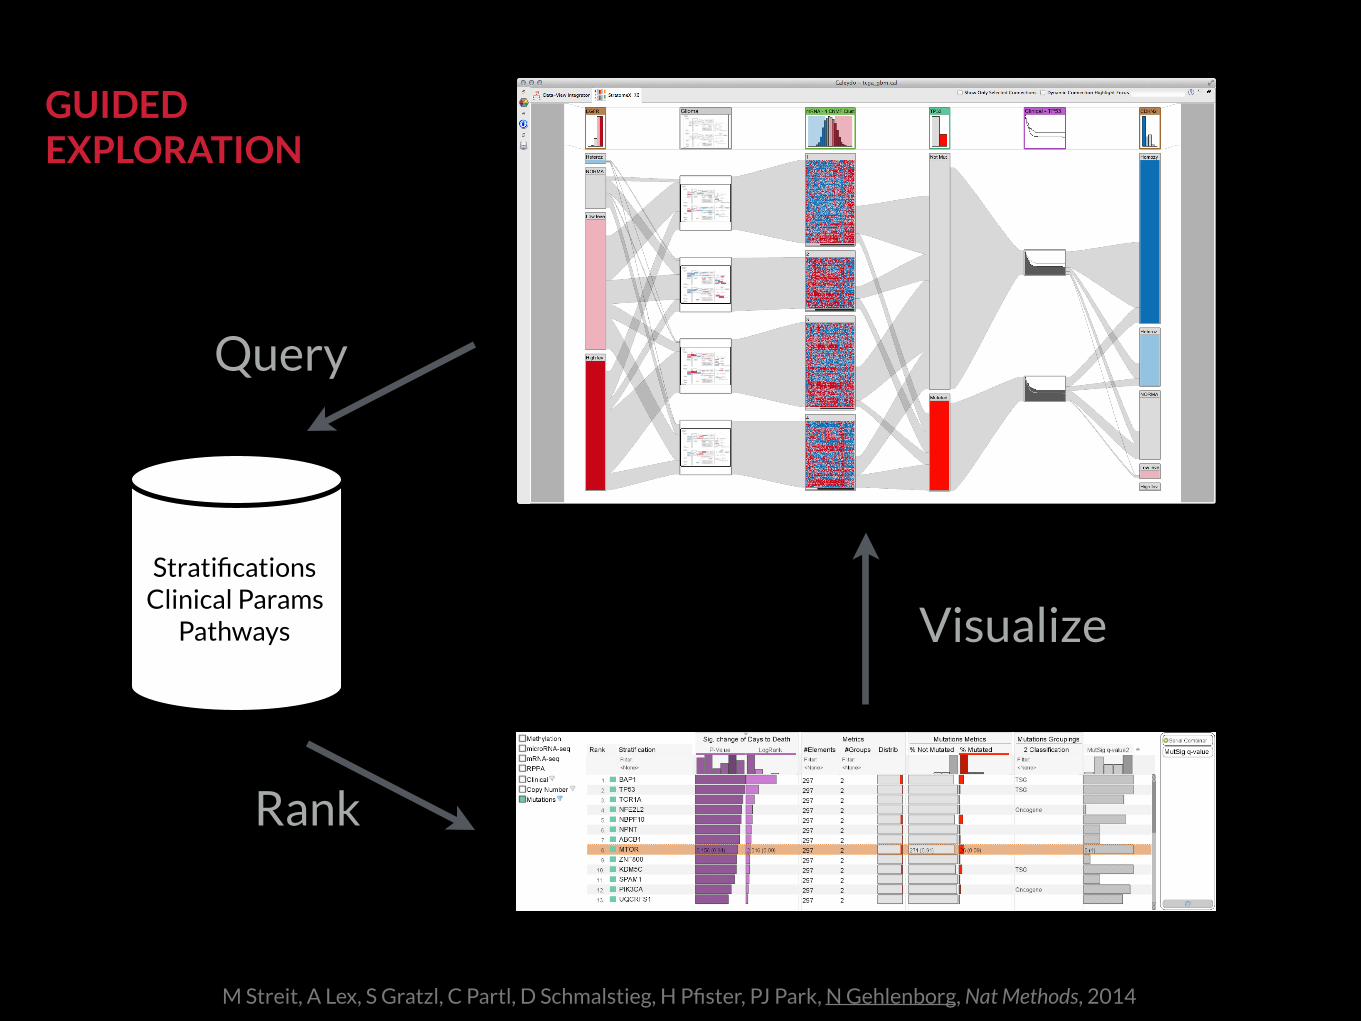
Query
Rank
VisualizeStratifications
Clinical Params Pathways
GUIDED EXPLORATION
M Streit, A Lex, S Gratzl, C Partl, D Schmalstieg, H Pfister, PJ Park, N Gehlenborg, Nat Methods, 2014

AND NOW WHAT?
DATA-DRIVEN DISCOVERY
experiment
DATA
INSIGHT HYPOTHESIS
interpretation
DATA
hypothesis generation
EXPLORATION“Pattern Discovery”
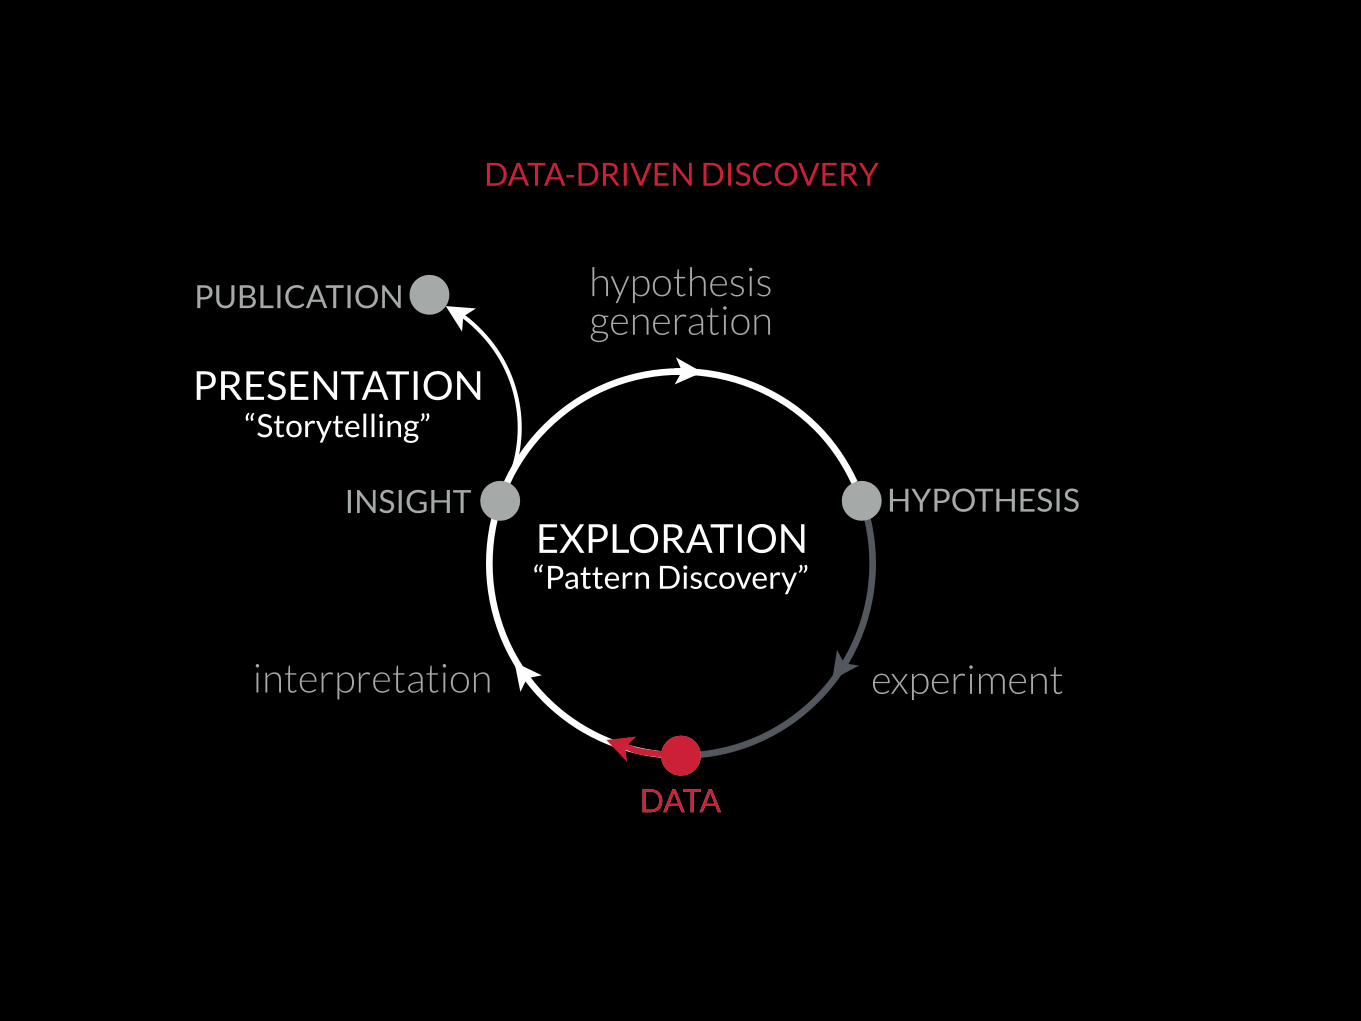
DATA-DRIVEN DISCOVERY
PUBLICATION
experiment
DATA
INSIGHT HYPOTHESIS
interpretation
DATA
hypothesis generation
EXPLORATION
PRESENTATION“Storytelling”
“Pattern Discovery”

DATA-DRIVEN DISCOVERY
DATA-DRIVEN COMMUNICATION
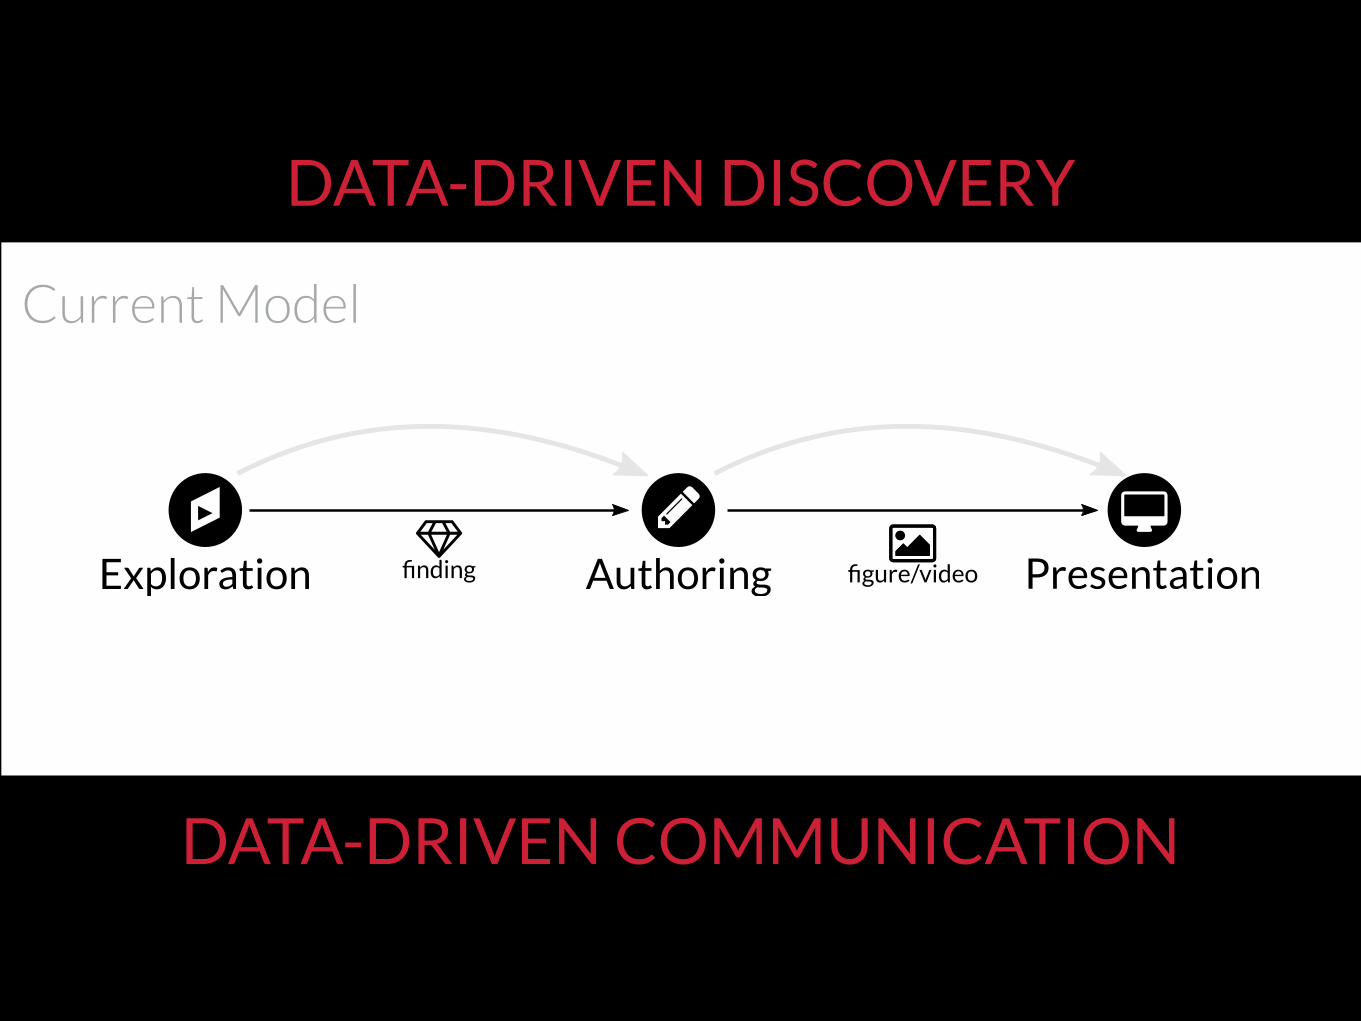
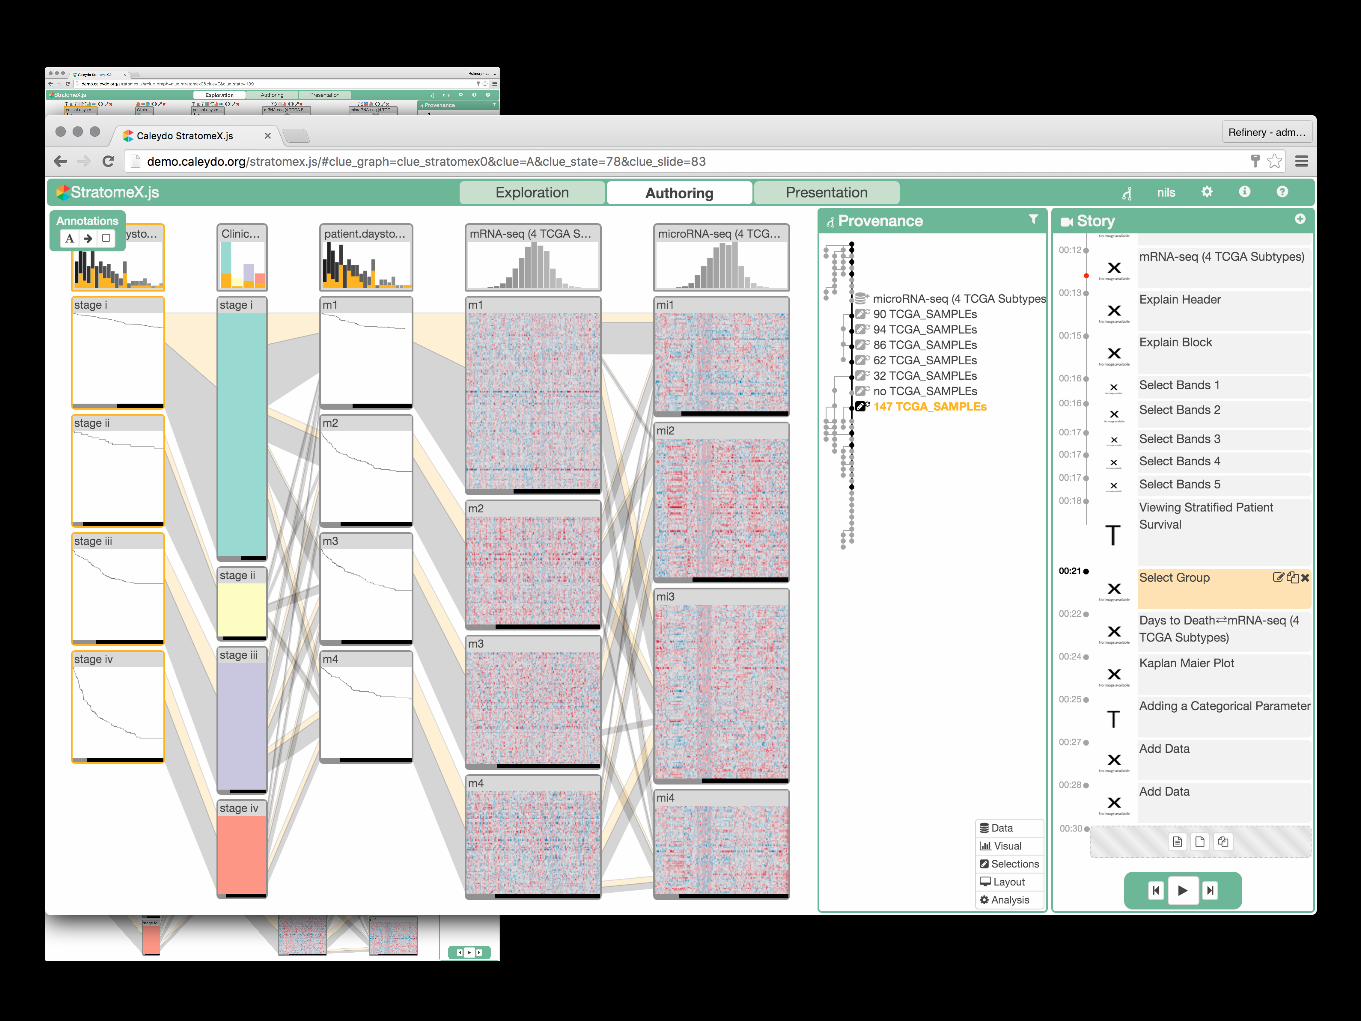
finding figure/videoAuthoringExploration Presentation
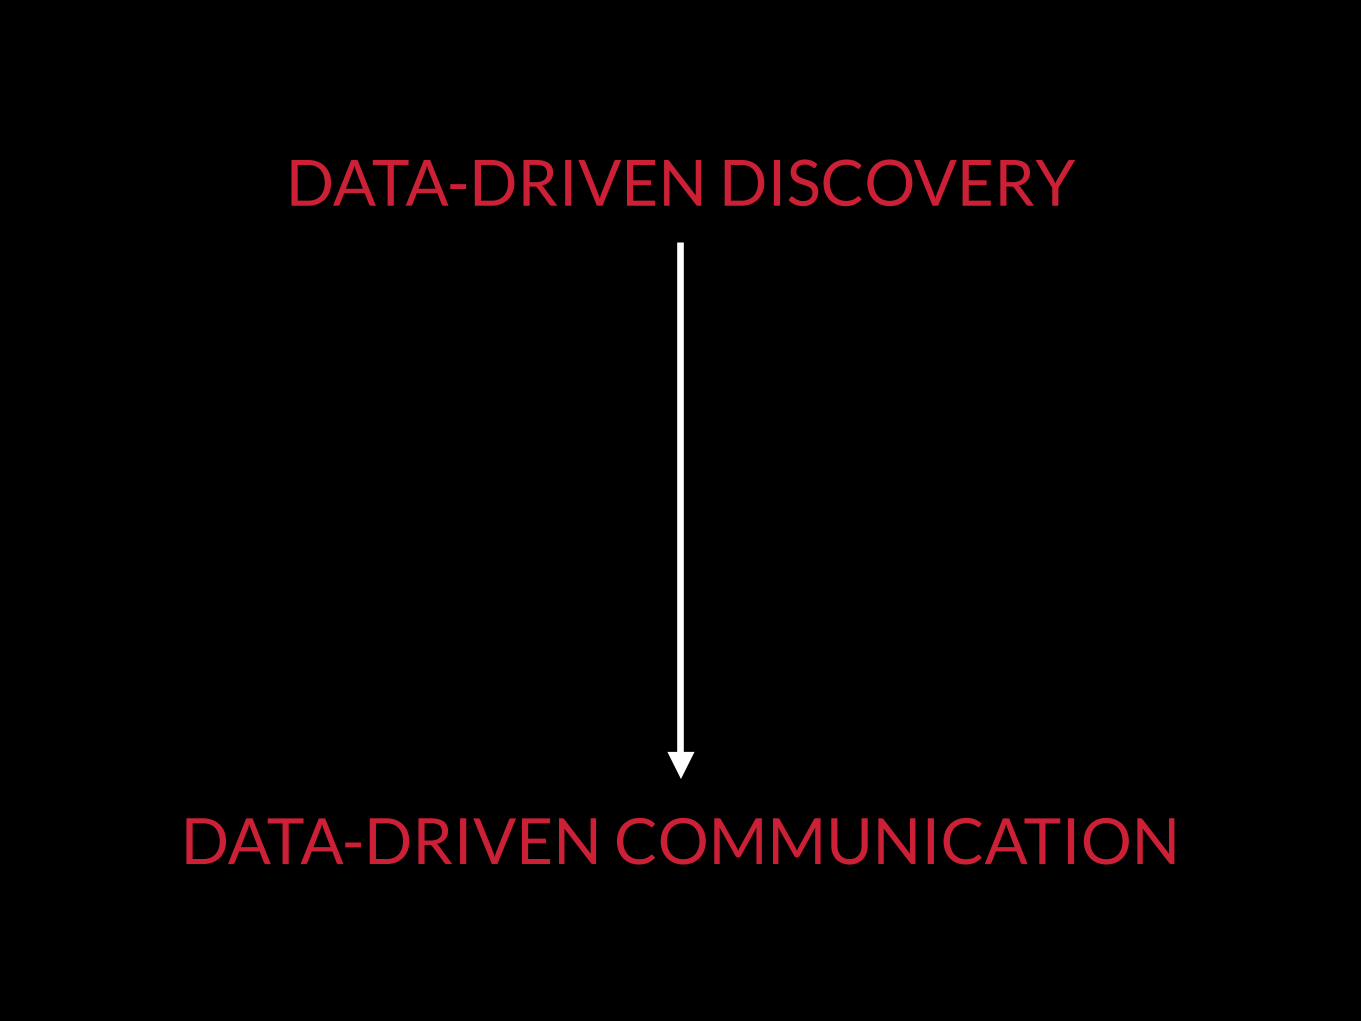
DATA-DRIVEN DISCOVERY
DATA-DRIVEN COMMUNICATION
finding figure/videoAuthoringExploration Presentation
Current Model
DATA-DRIVEN DISCOVERY
DATA-DRIVEN COMMUNICATION
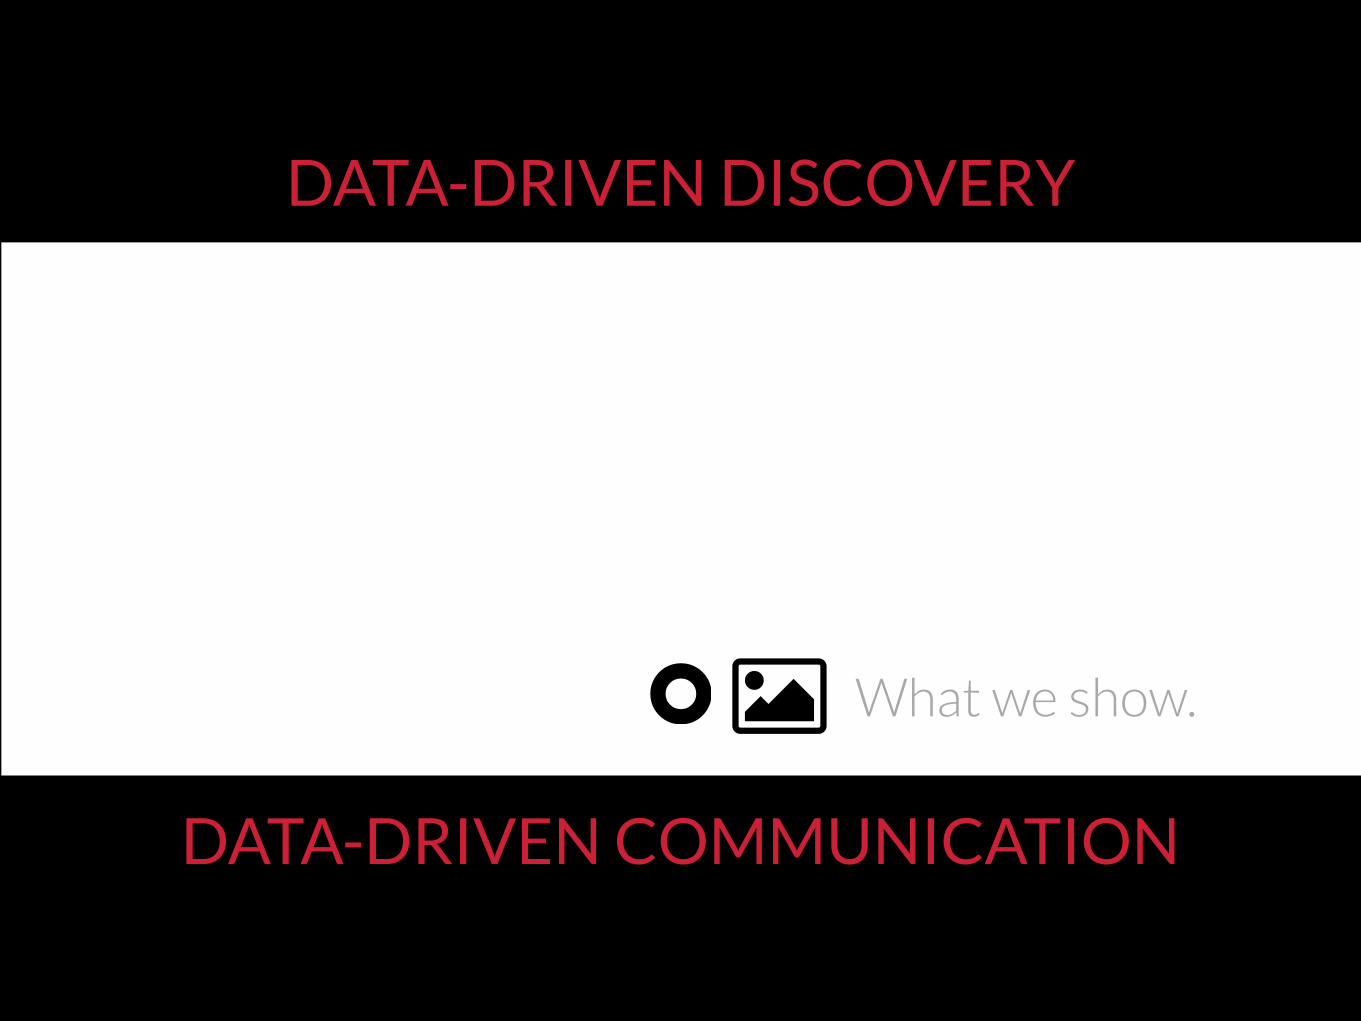
finding figure/videoAuthoringExploration PresentationWhat we show.
DATA-DRIVEN DISCOVERY
DATA-DRIVEN COMMUNICATION
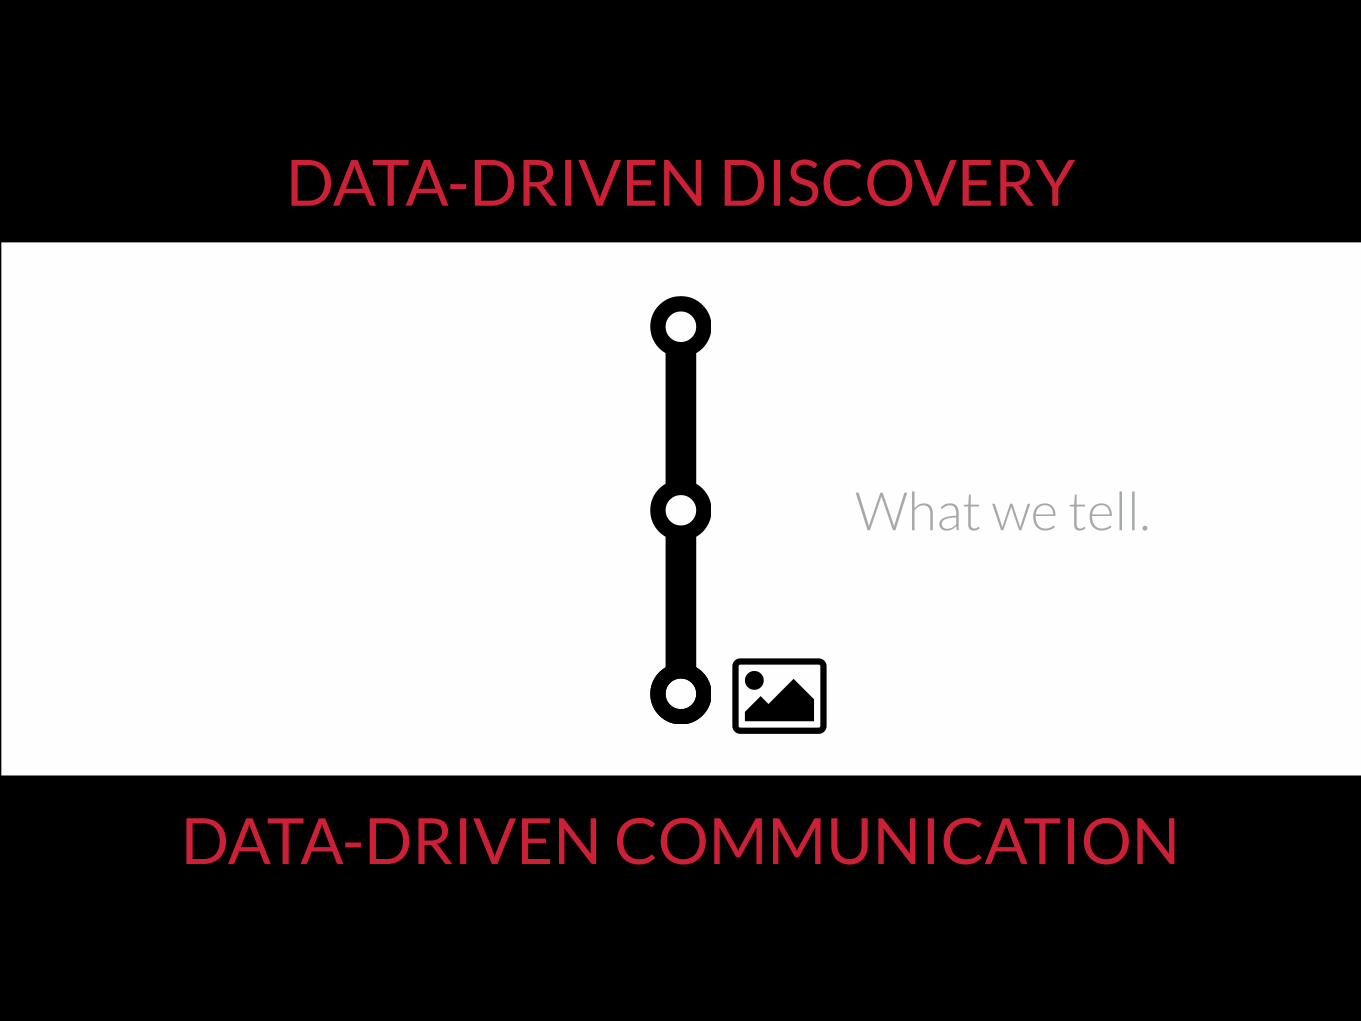
finding figure/videoAuthoringExploration Presentation
What we tell.
DATA-DRIVEN DISCOVERY
DATA-DRIVEN COMMUNICATION
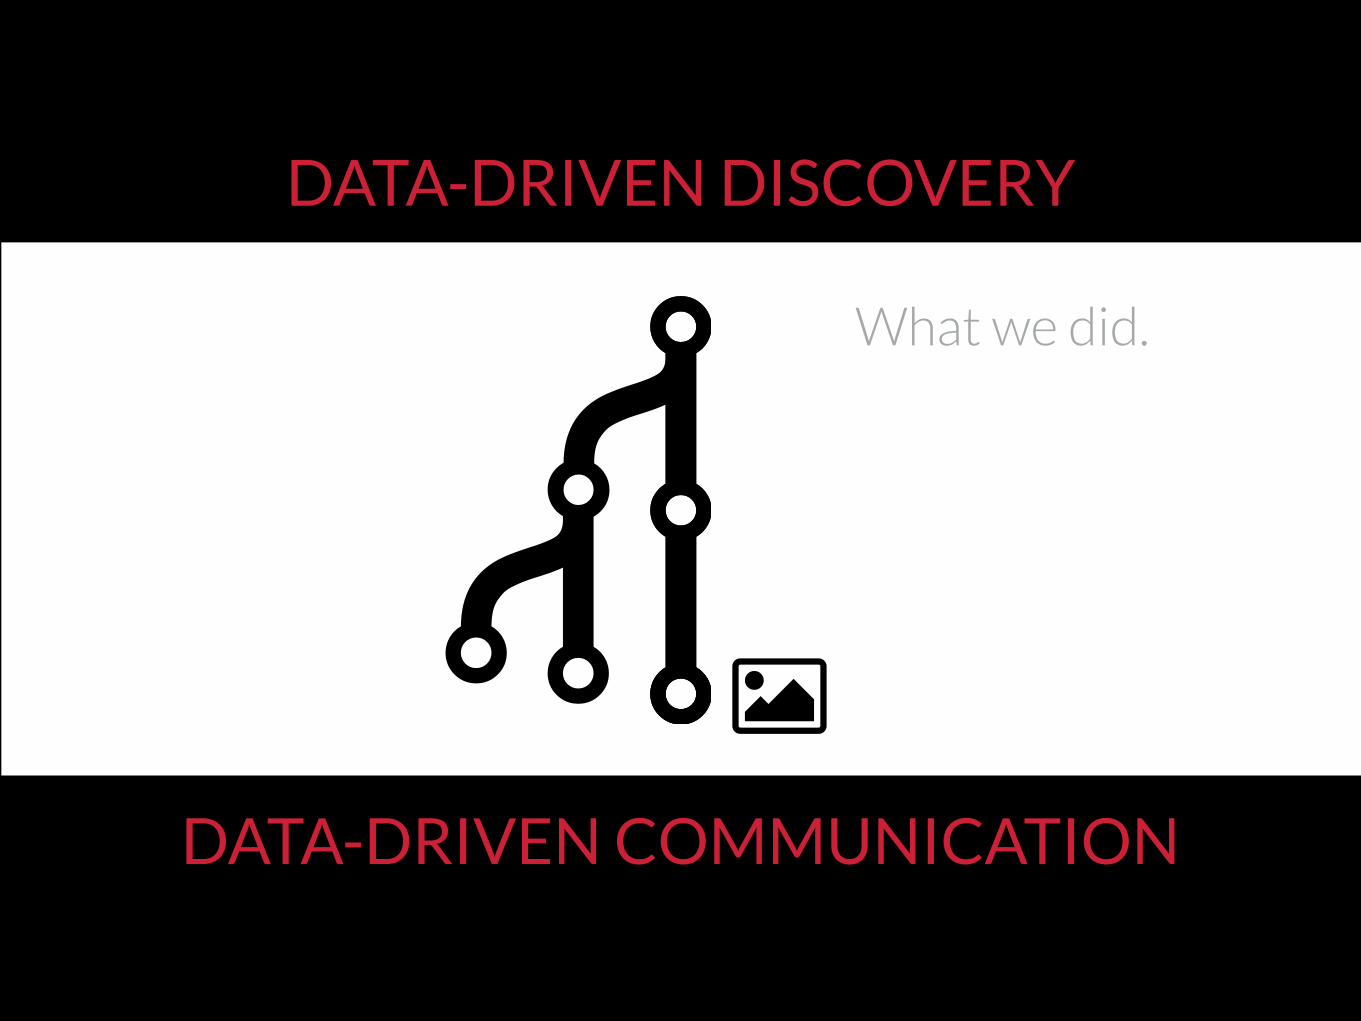
finding figure/videoAuthoringExploration Presentation
What we did.
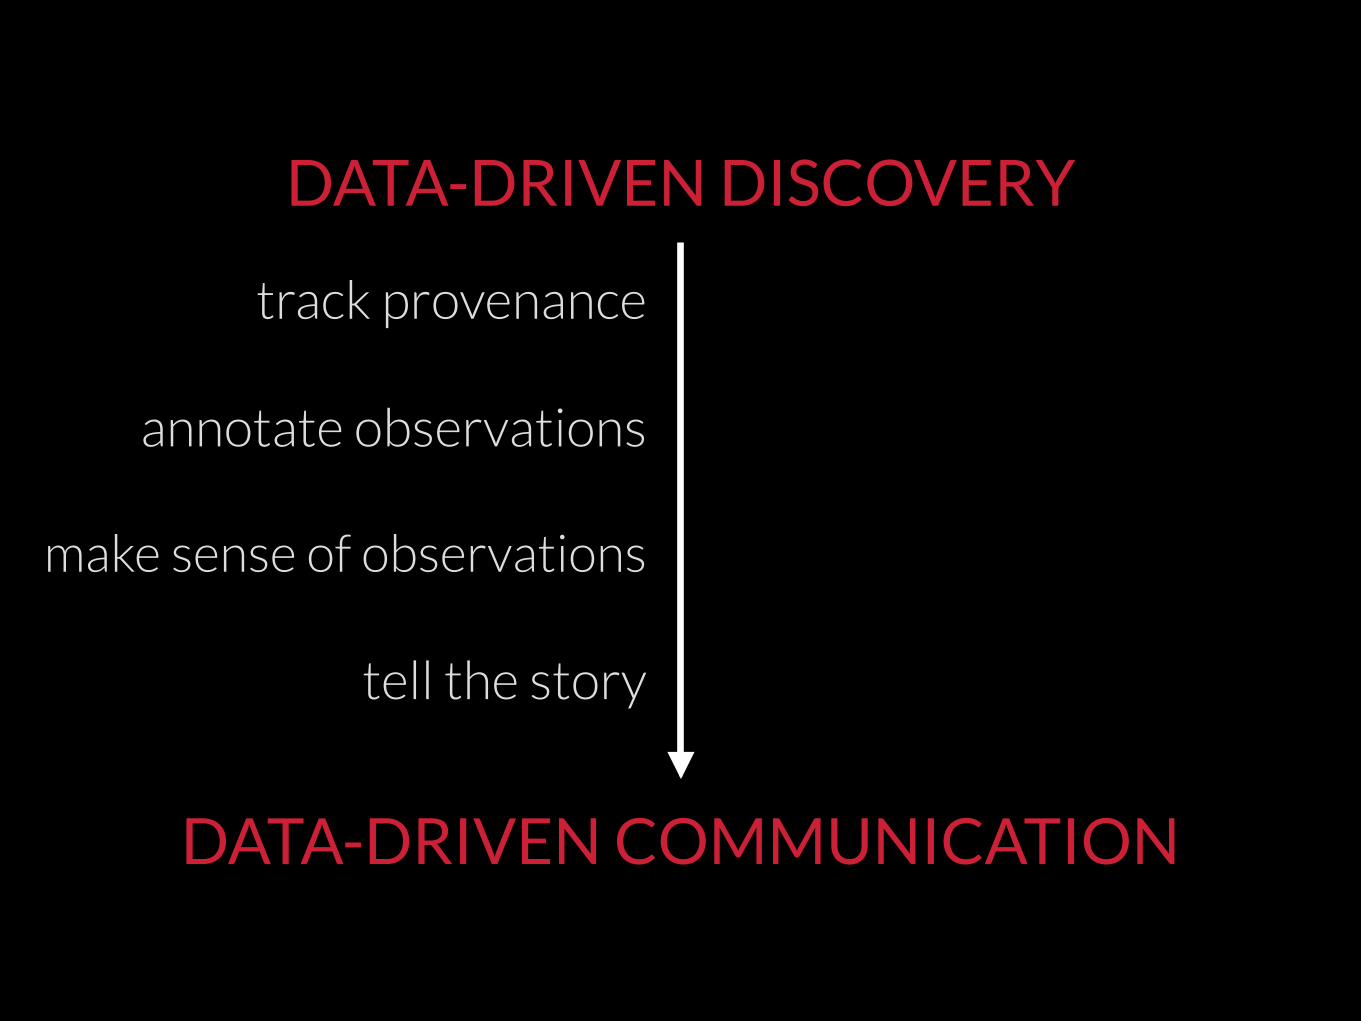
DATA-DRIVEN DISCOVERY
DATA-DRIVEN COMMUNICATION
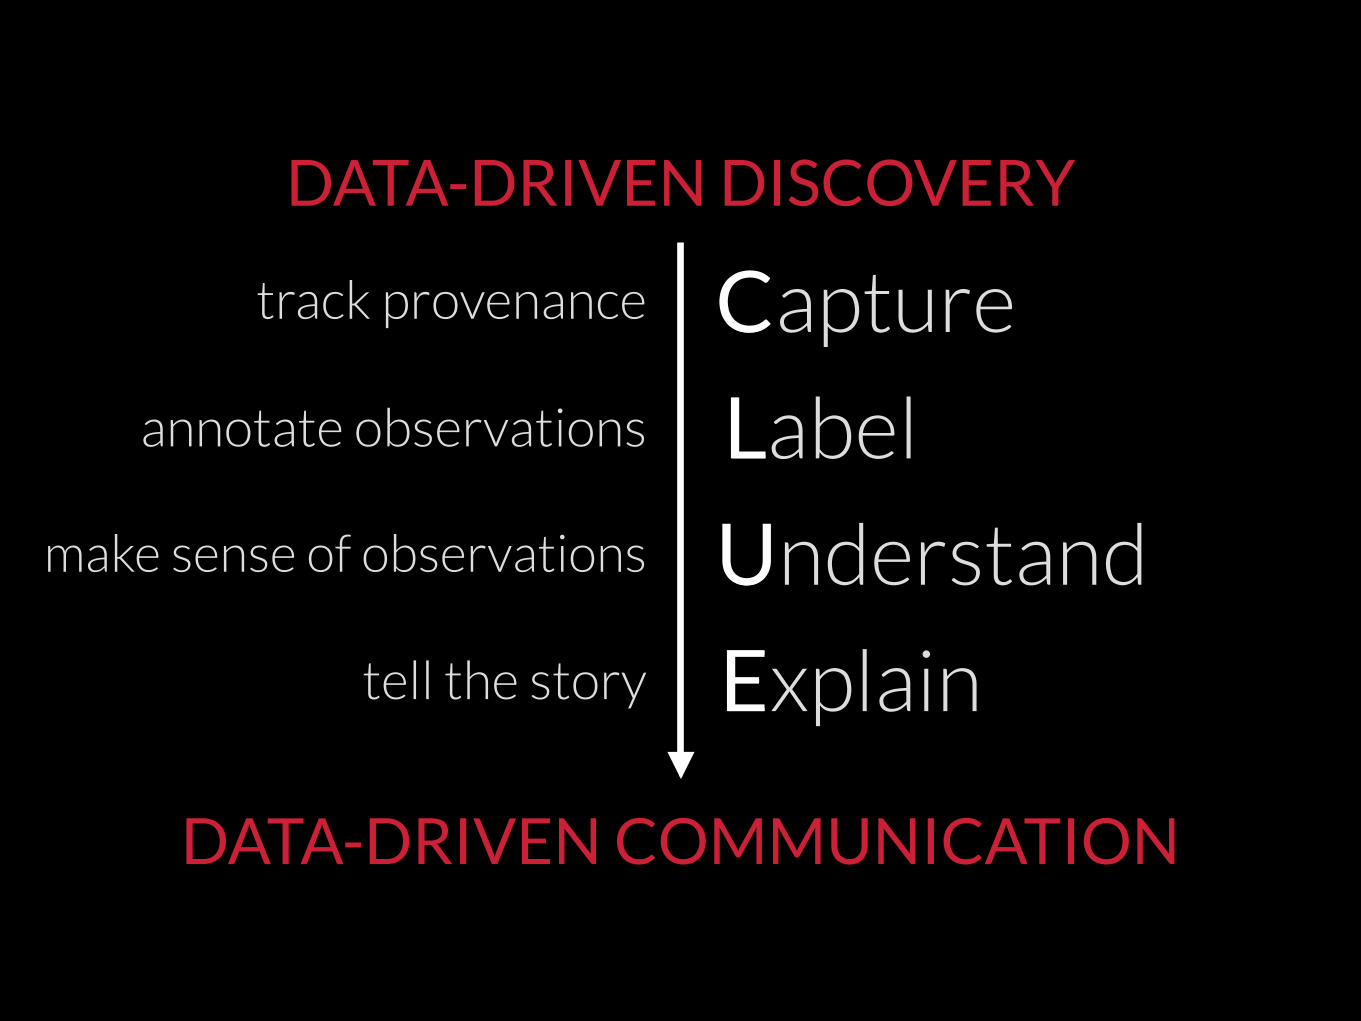
track provenance
annotate observations
make sense of observations
tell the story
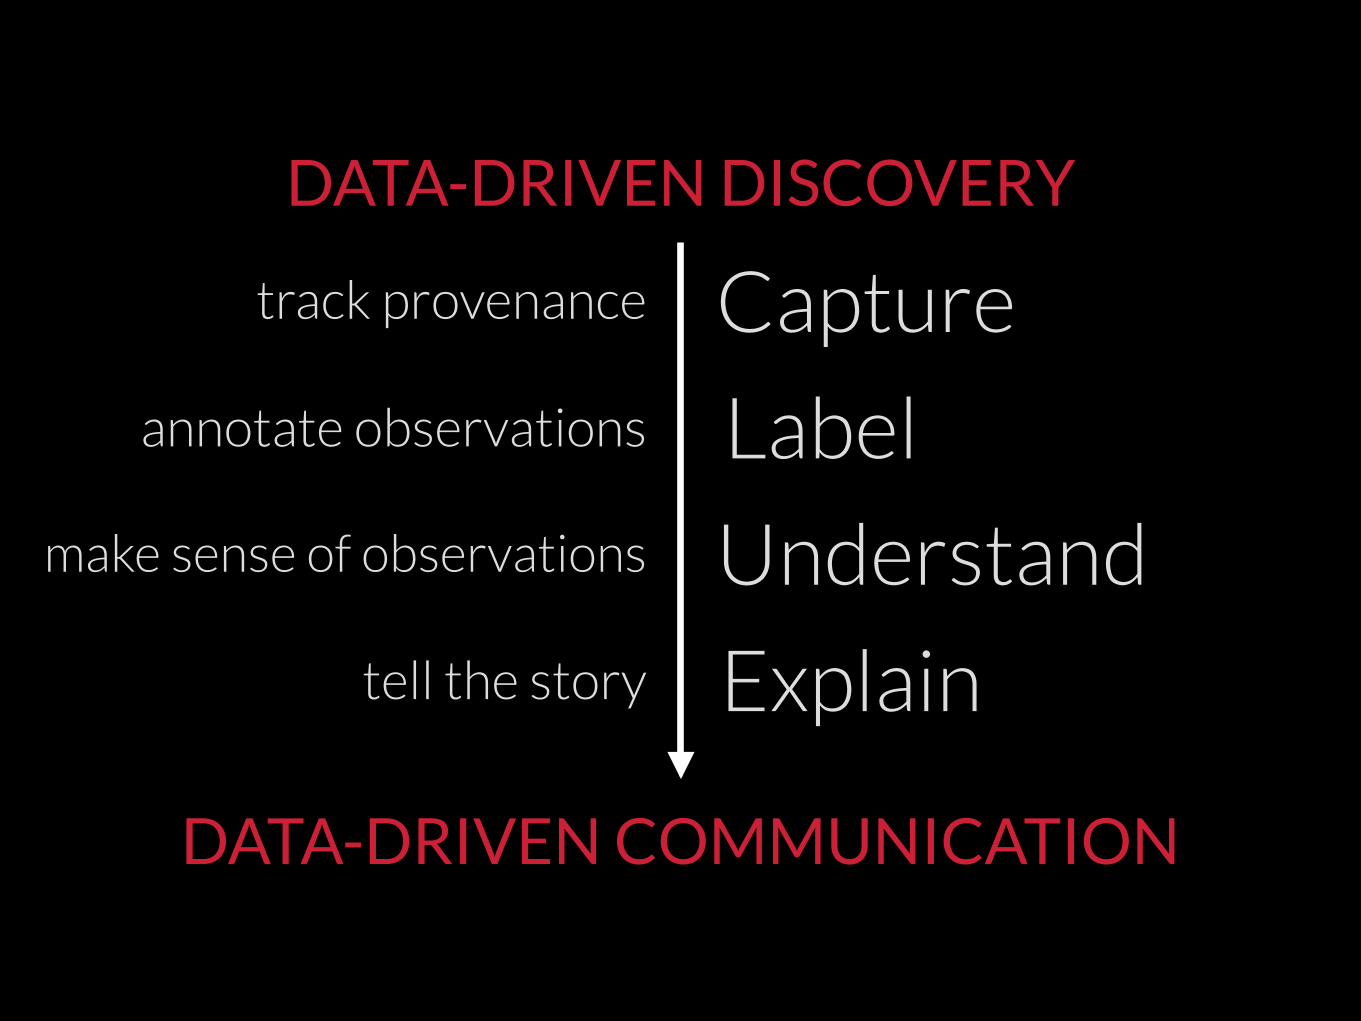
DATA-DRIVEN DISCOVERY
DATA-DRIVEN COMMUNICATION
Capture
Label
Understand
Explain
track provenance
annotate observations
make sense of observations
tell the story
DATA-DRIVEN DISCOVERY
DATA-DRIVEN COMMUNICATION
Capture
Label
Understand
Explain
track provenance
annotate observations
make sense of observations
tell the story
C
L
U
E
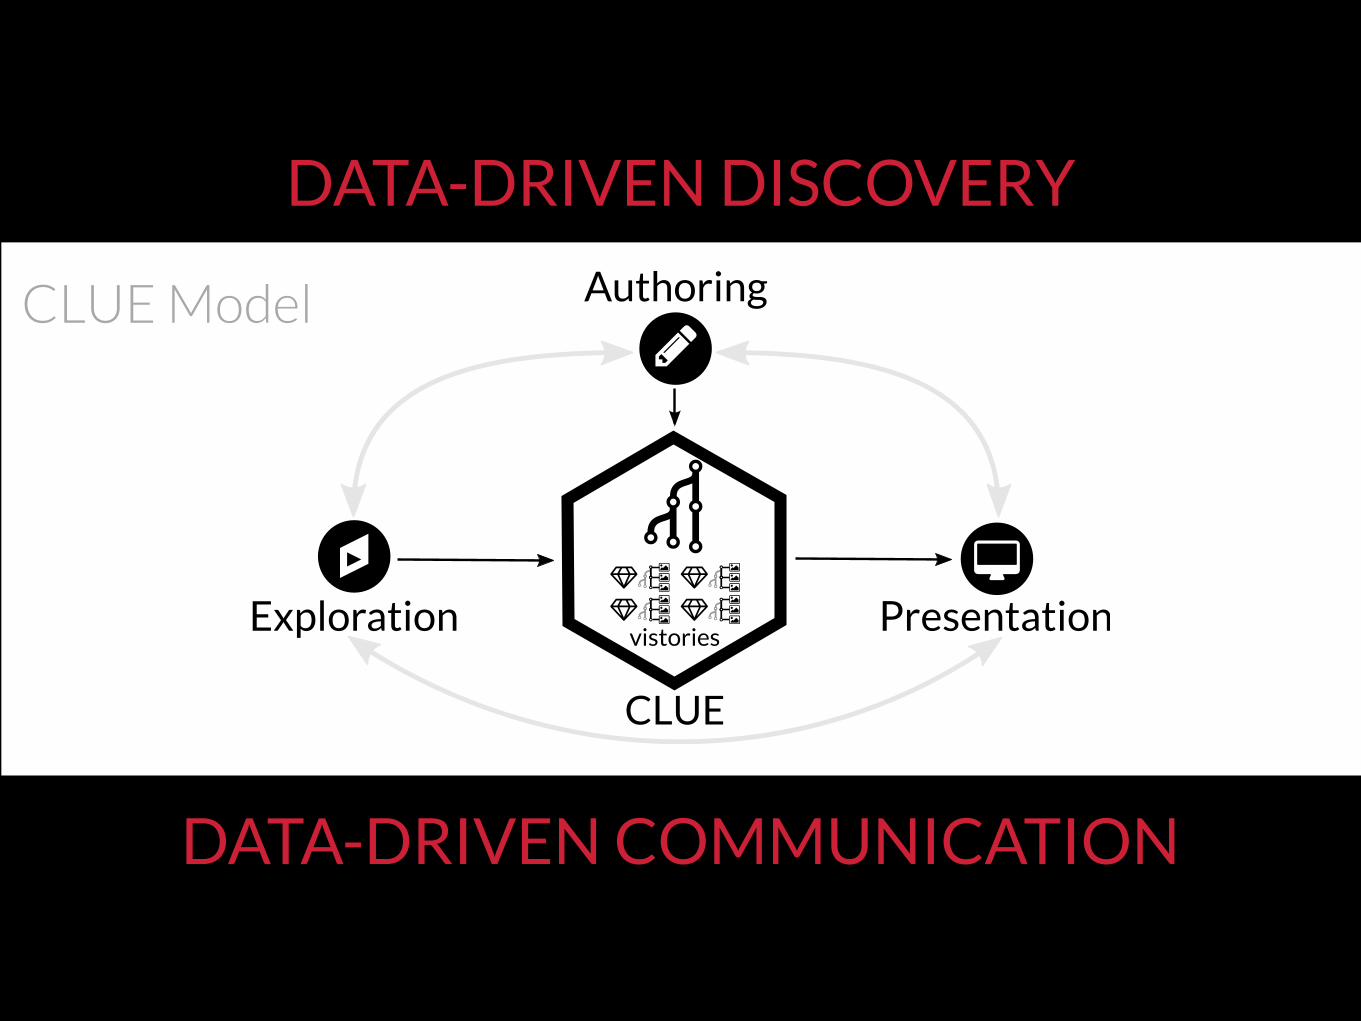
CLUE
vistories
Authoring
Exploration Presentation
DATA-DRIVEN DISCOVERY
DATA-DRIVEN COMMUNICATION
CLUE Model

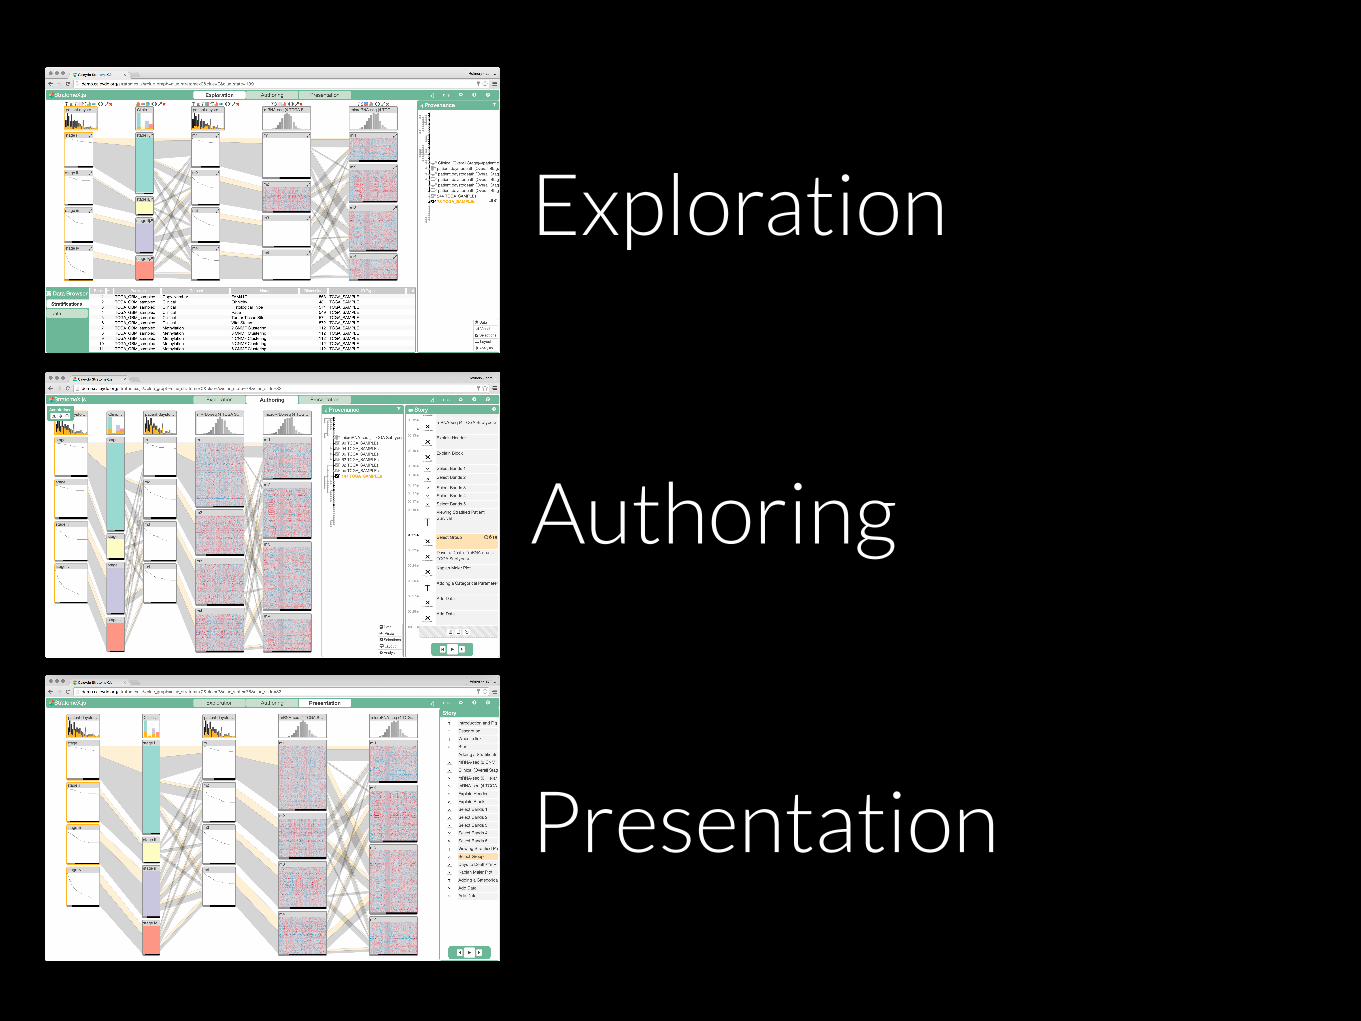
Exploration
Authoring
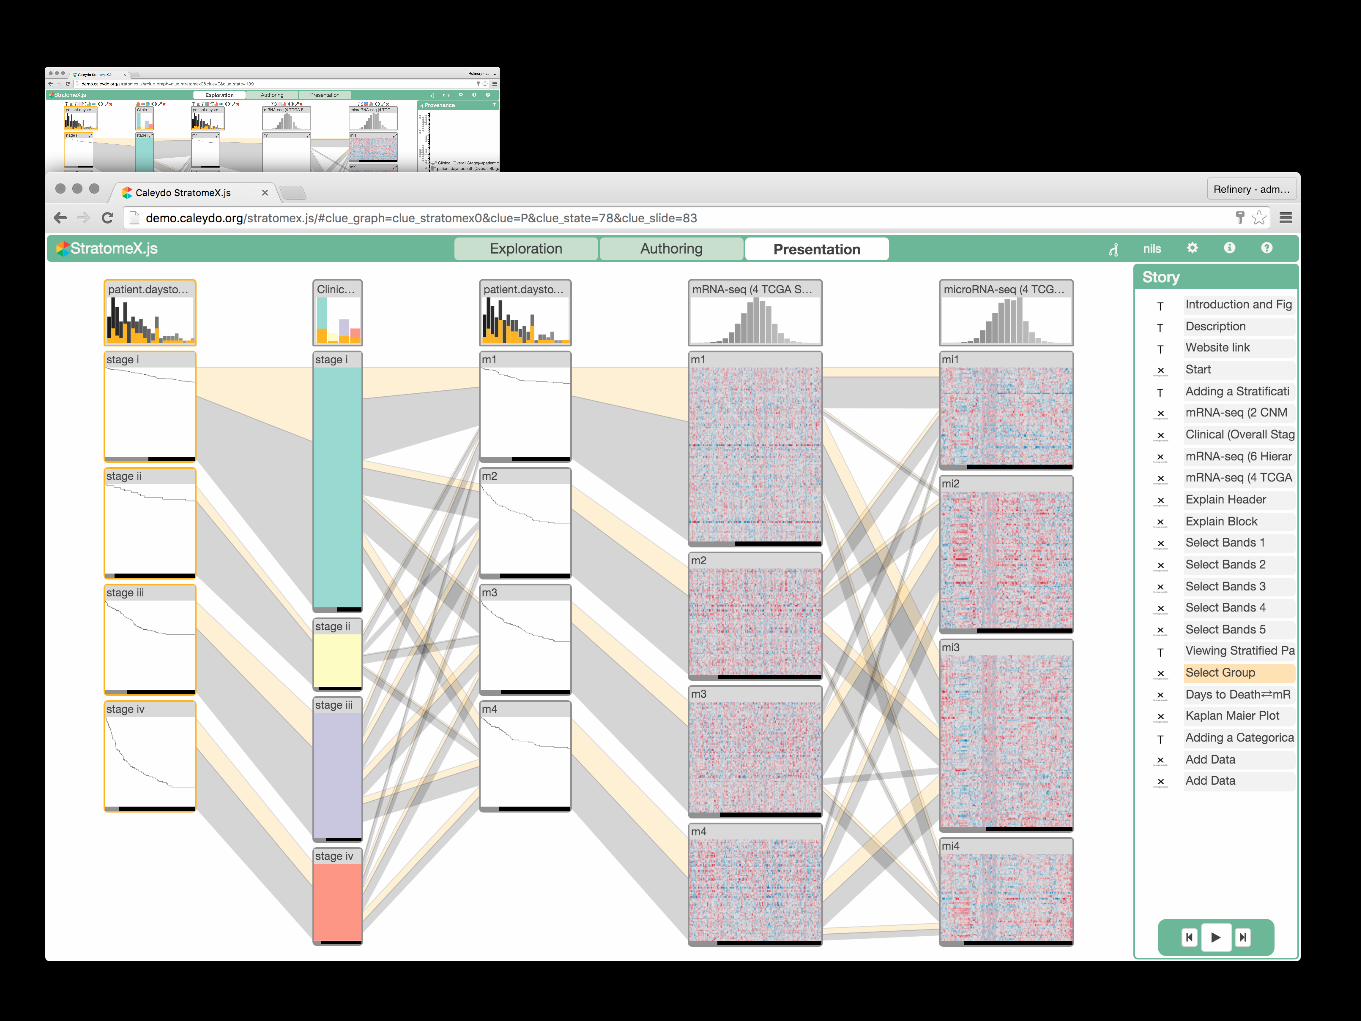
Presentation
Exploration
Authoring
Presentation

Exploration
Authoring
Presentation
Exploration
Authoring
Presentation
Exploration
Authoring
Presentation
Exploration
Authoring
Presentation

Exploration
Authoring
Presentation

Exploration
Authoring
Presentation
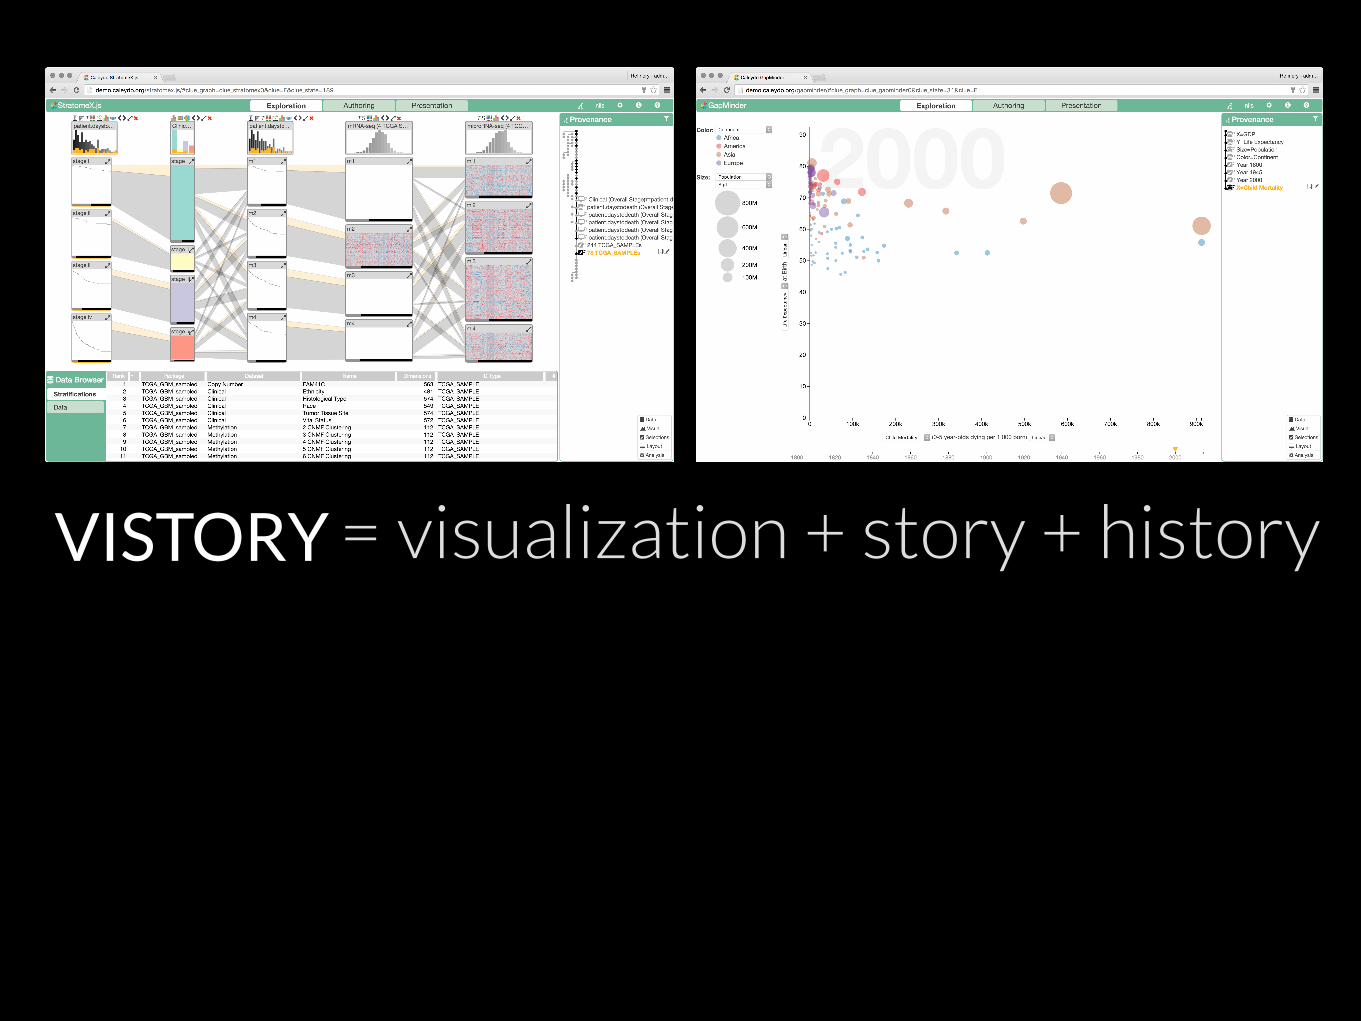
VISTORY = visualization + story + history
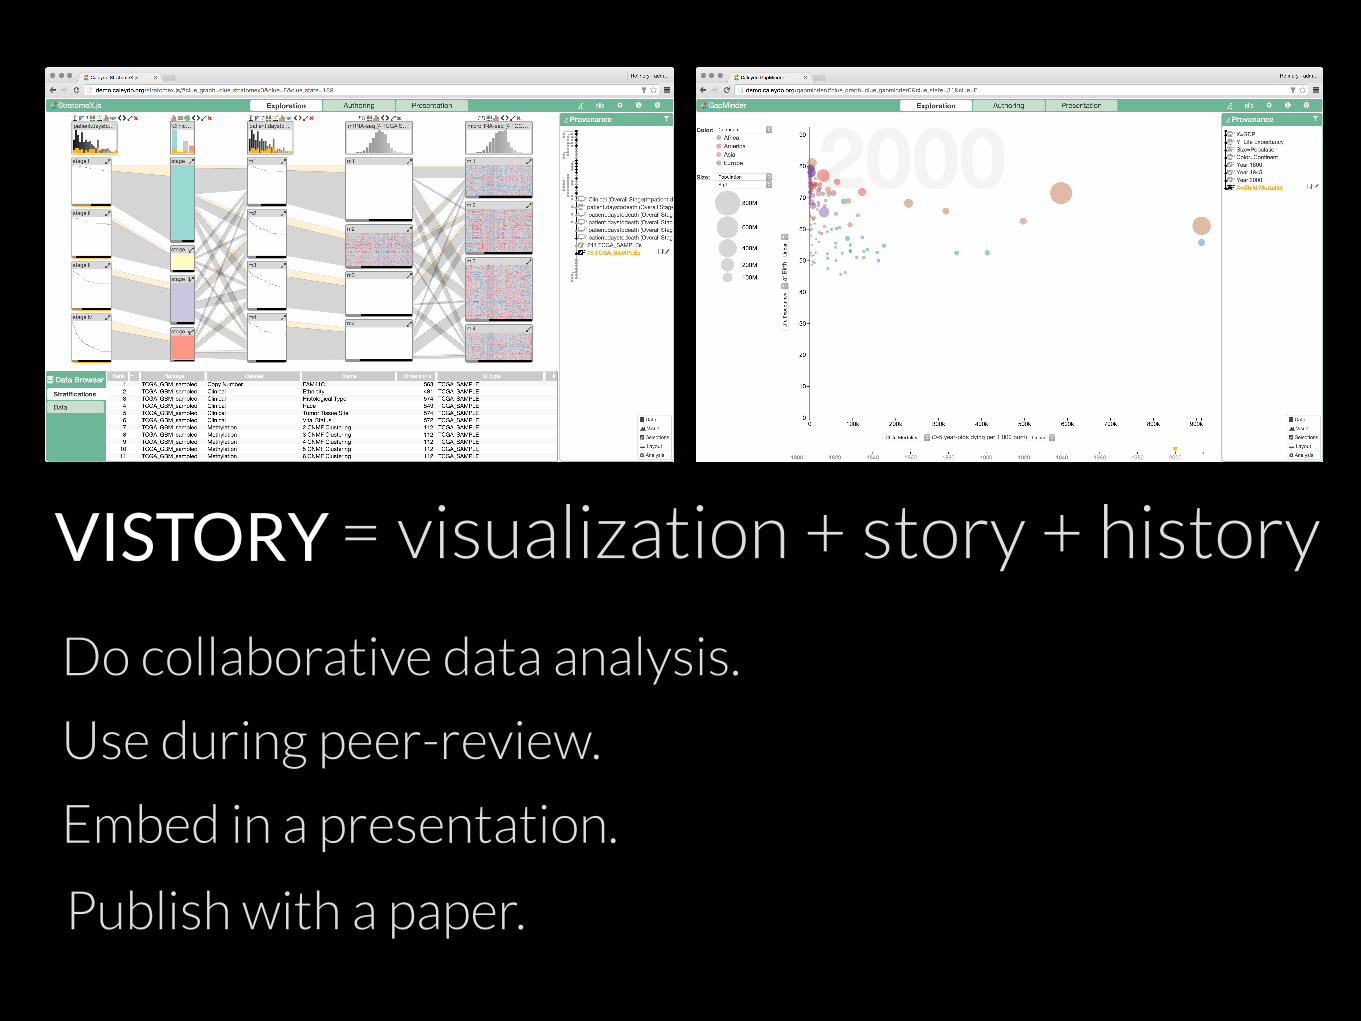
VISTORY = visualization + story + history
Do collaborative data analysis.
Use during peer-review.
Publish with a paper.
Embed in a presentation.
DATA-DRIVEN DISCOVERY
DATA-DRIVEN COMMUNICATION
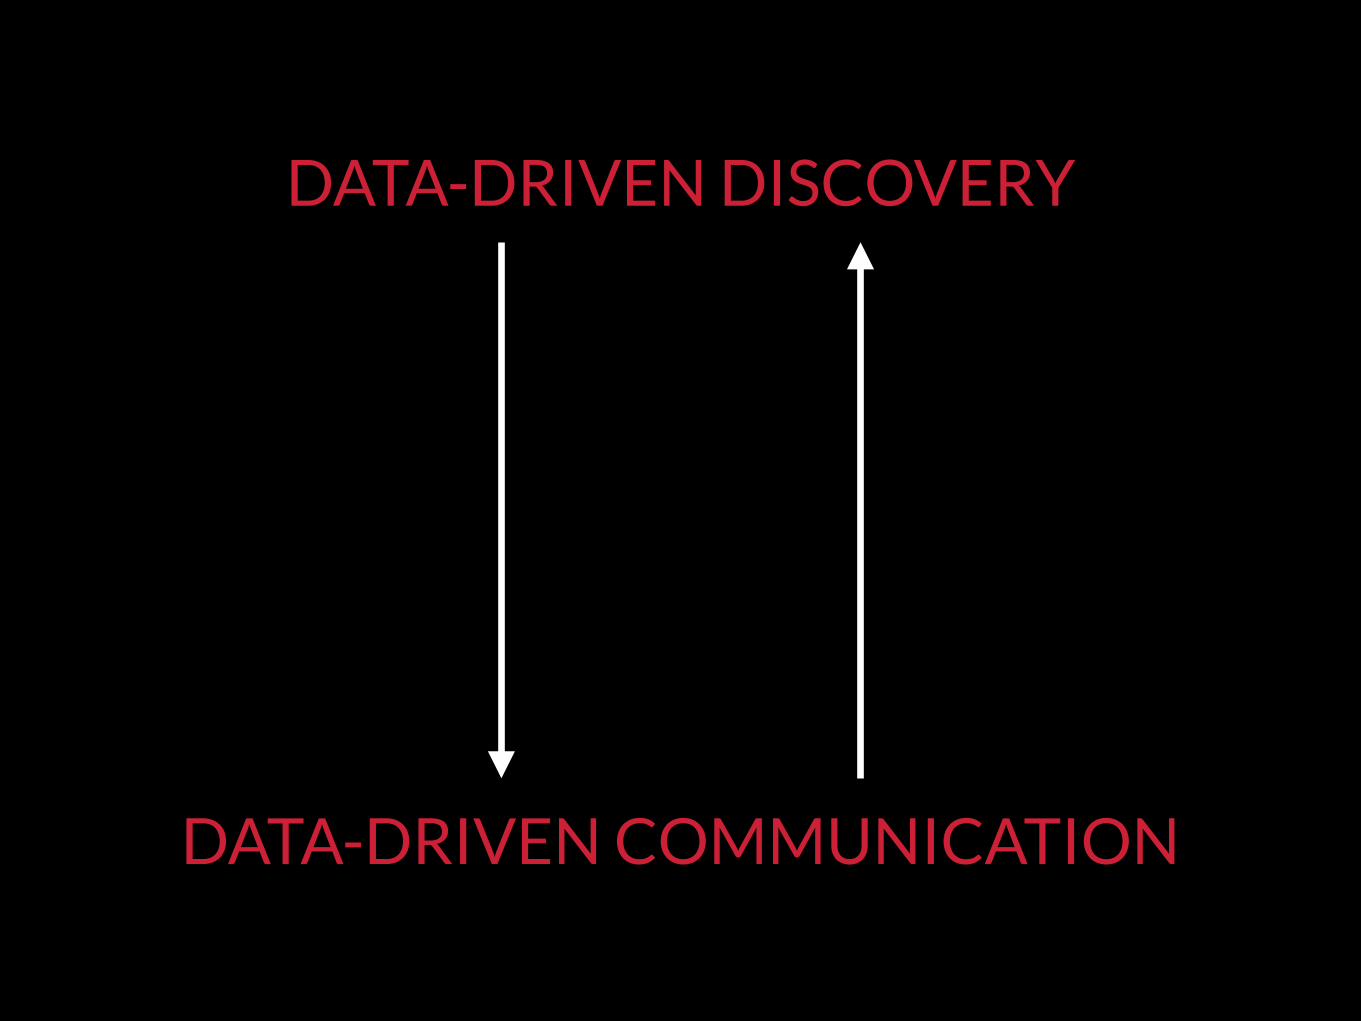
DATA-DRIVEN DISCOVERY
DATA-DRIVEN COMMUNICATION

DATA-DRIVEN DISCOVERY
DATA-DRIVEN COMMUNICATION
http://vistories.orgDemos and prototypes built with

SAMUEL GRATZL JOHANNES KEPLER UNIVERSITY LINZ
ALEXANDER LEX UNIVERSITY OF UTAH
MARC STREIT JOHANNES KEPLER UNIVERSITY LINZ
HOLGER STITZ JOHANNES KEPLER UNIVERSITY LINZ
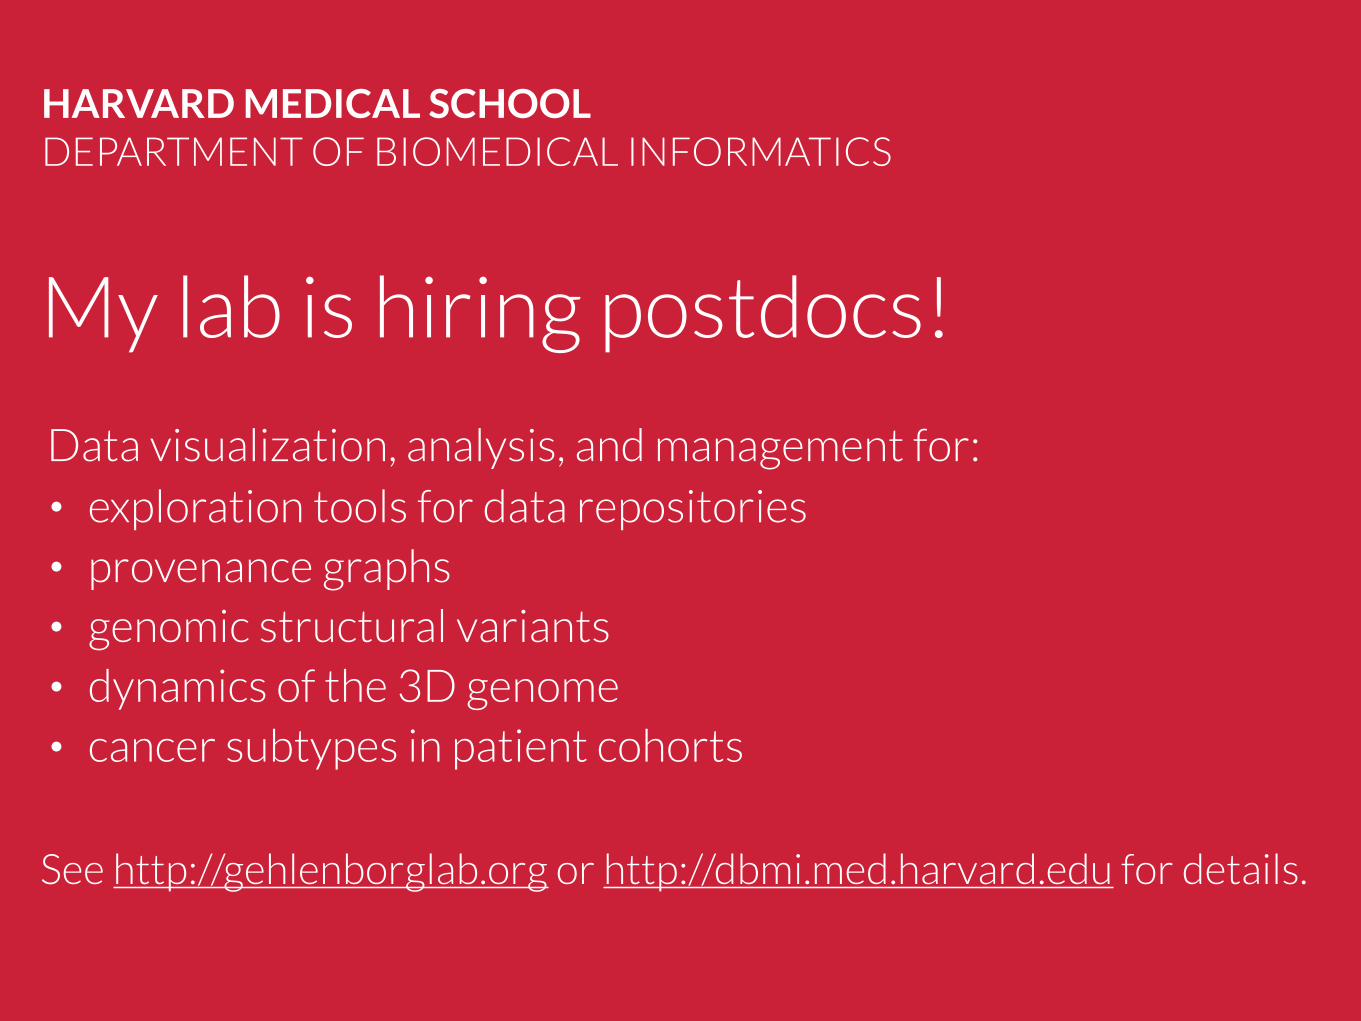
My lab is hiring postdocs!
HARVARD MEDICAL SCHOOL DEPARTMENT OF BIOMEDICAL INFORMATICS
See http://gehlenborglab.org or http://dbmi.med.harvard.edu for details.
Data visualization, analysis, and management for: • exploration tools for data repositories • provenance graphs • genomic structural variants • dynamics of the 3D genome • cancer subtypes in patient cohorts