Embed Size (px)
Citation preview
©2015 Waters Corporation 1
Ultra-Trace Level Quantitative Analysis of Food
Contaminants using LC and GC coupled to MS
©2015 Waters Corporation 2
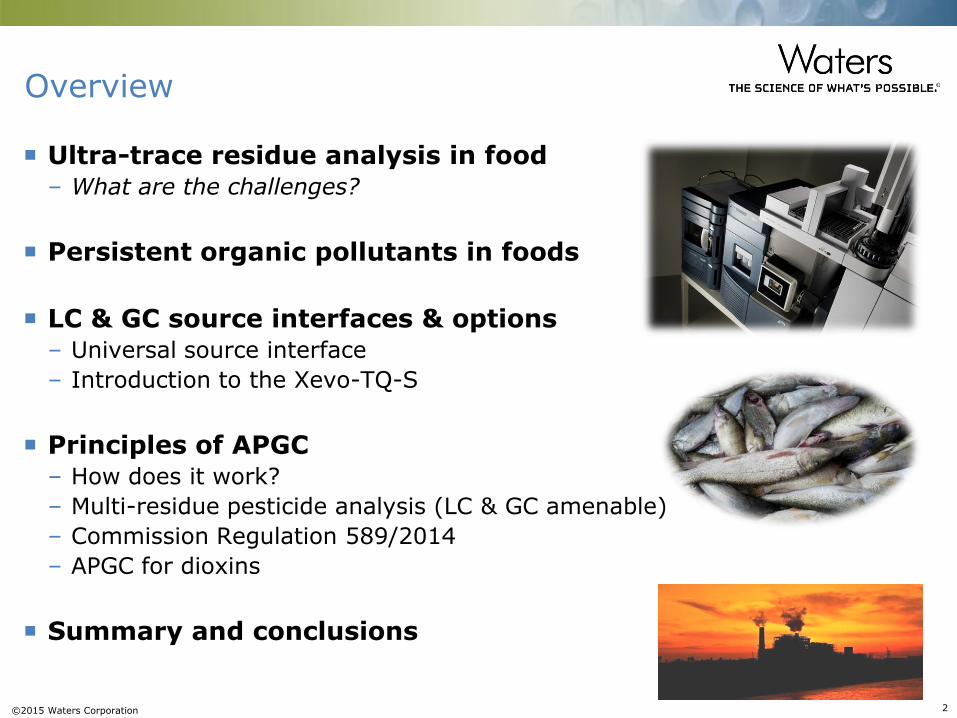
Overview
Ultra-trace residue analysis in food – What are the challenges?
Persistent organic pollutants in foods
LC & GC source interfaces & options – Universal source interface
– Introduction to the Xevo-TQ-S
Principles of APGC – How does it work?
– Multi-residue pesticide analysis (LC & GC amenable)
– Commission Regulation 589/2014
– APGC for dioxins
Summary and conclusions
©2015 Waters Corporation 3
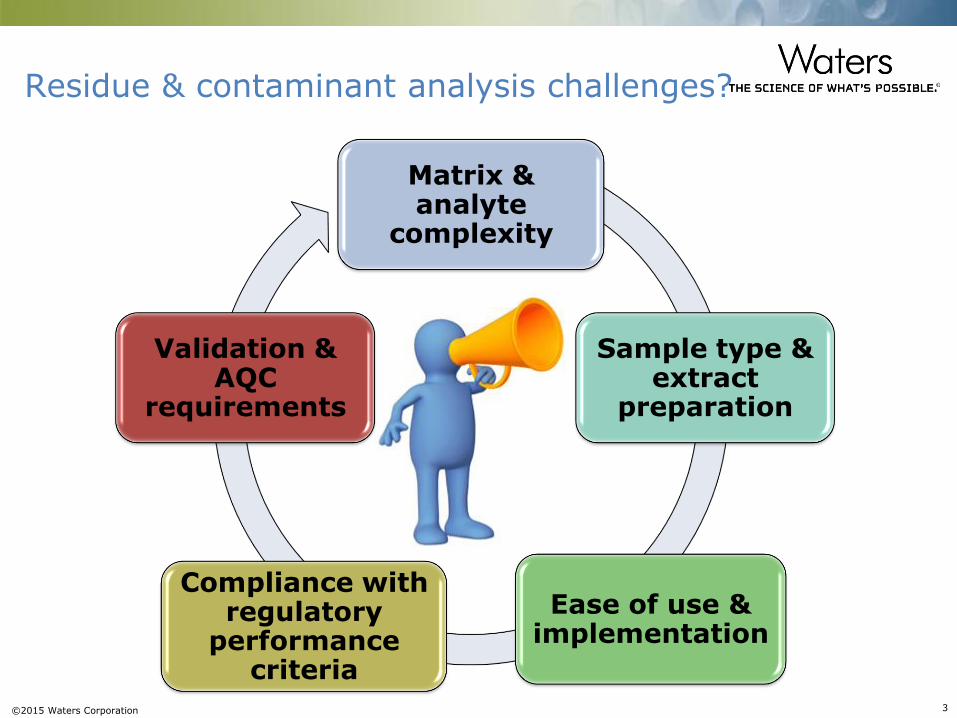
Residue & contaminant analysis challenges?
Matrix & analyte
complexity
Sample type & extract
preparation
Ease of use & implementation
Compliance with regulatory
performance criteria
Validation & AQC
requirements
©2015 Waters Corporation 4
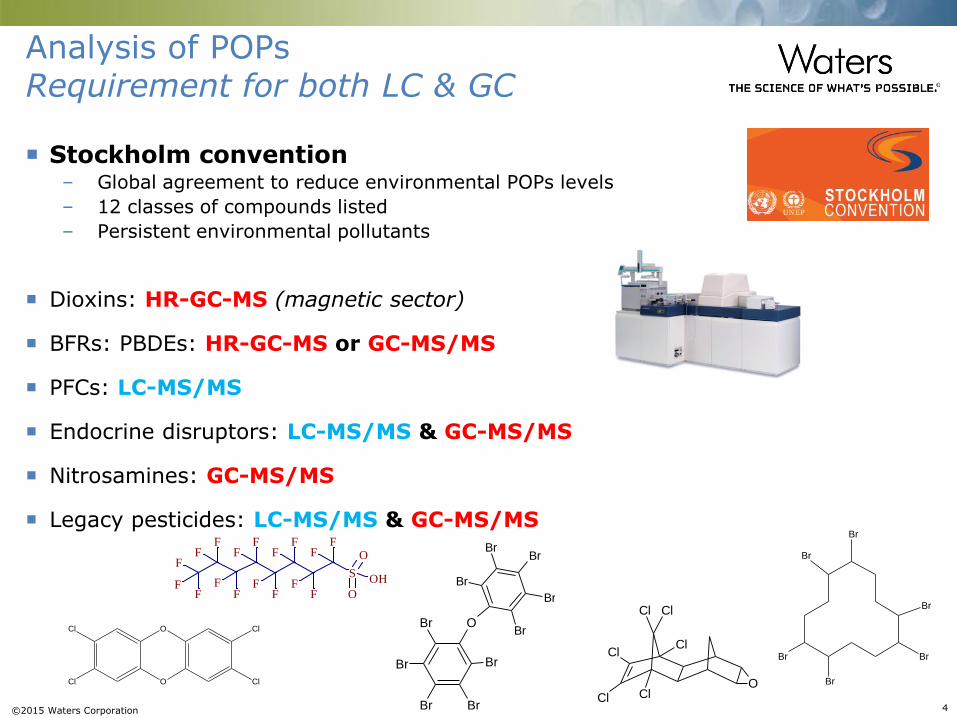
Analysis of POPs Requirement for both LC & GC
Stockholm convention – Global agreement to reduce environmental POPs levels
– 12 classes of compounds listed
– Persistent environmental pollutants
Dioxins: HR-GC-MS (magnetic sector)
BFRs: PBDEs: HR-GC-MS or GC-MS/MS
PFCs: LC-MS/MS
Endocrine disruptors: LC-MS/MS & GC-MS/MS
Nitrosamines: GC-MS/MS
Legacy pesticides: LC-MS/MS & GC-MS/MS
O
BrBr
Br
Br
Br
BrBr
Br
Br
Br
Cl
Cl
O
O
Cl
Cl
F
F
F
F
F
F
F
F
F
S
O
OF F
F
F
F
F
FFOH
Br
Br
Br
Br
Br
Br
Cl
Cl
OCl
Cl
Cl Cl
©2015 Waters Corporation 5
LC and GC Source Interfaces and
Options
©2015 Waters Corporation 6
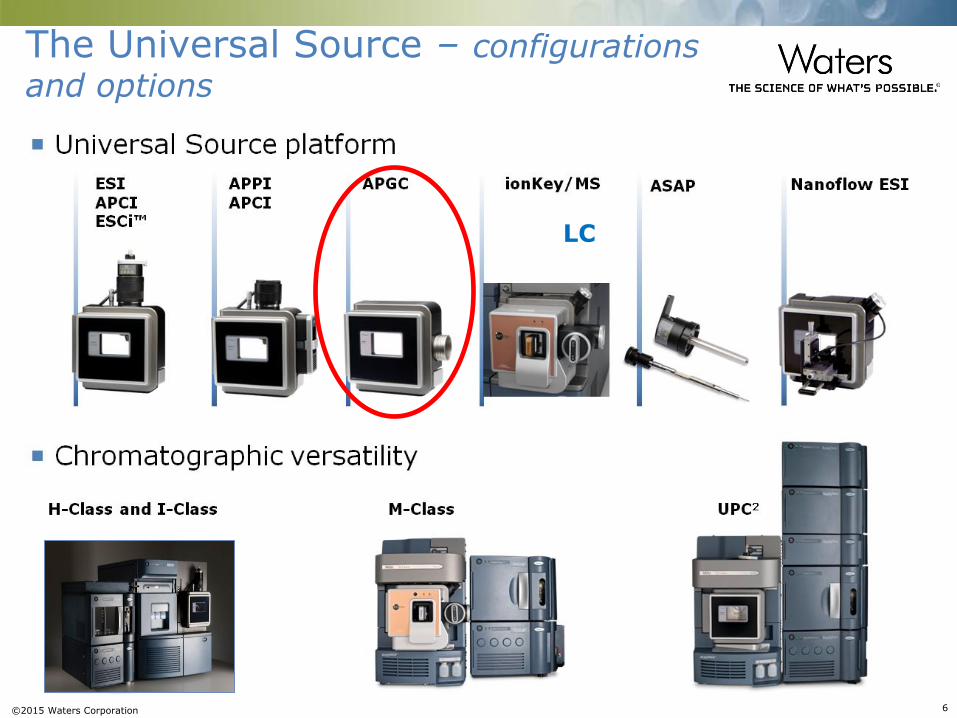
The Universal Source – configurations
and options
LC
©2015 Waters Corporation 7
APGC Overview
Waters APGC is an optional ion source for Xevo systems that provides
a highly sensitive GC-MS, MS/MS capability
Very easy to swap between APGC, UPLC, other ion sources without
instrument venting in minutes
APGC ionisation is soft (cf. APCI) and molecular ions are readily
detected
Fragmentation can be induced (CID) to provide information for
structural elucidation
Xevo tandem quad (Xevo TQ-S) is a powerful tool for routine
quantitation coupled to both LC & GC
– Capability of using the RADAR for exploratory experiments
©2015 Waters Corporation 8
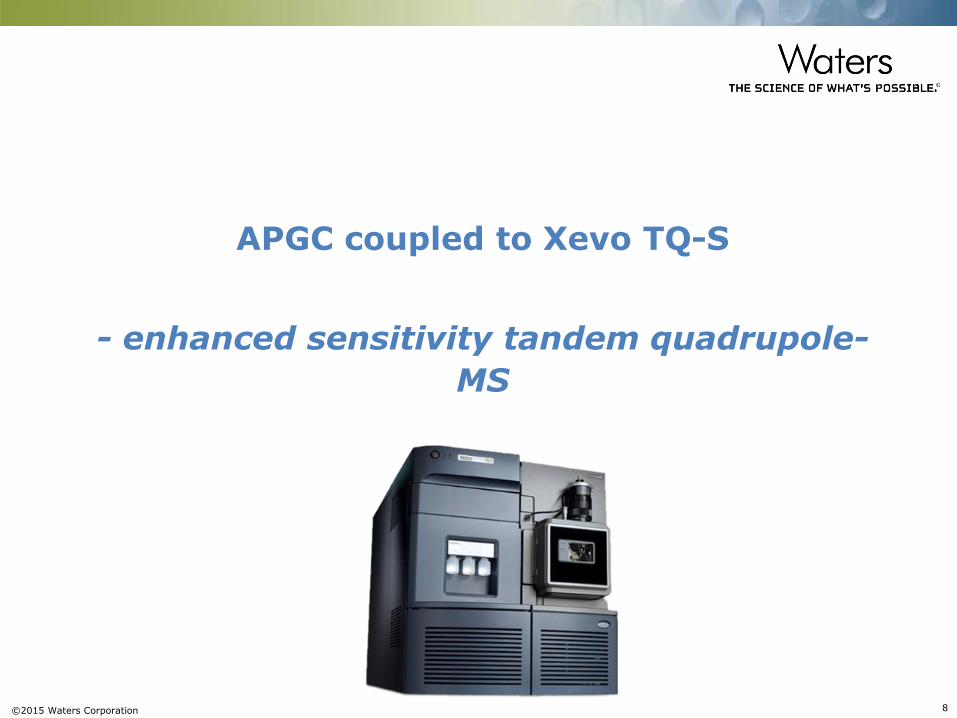
APGC coupled to Xevo TQ-S
- enhanced sensitivity tandem quadrupole-
MS
©2015 Waters Corporation 9
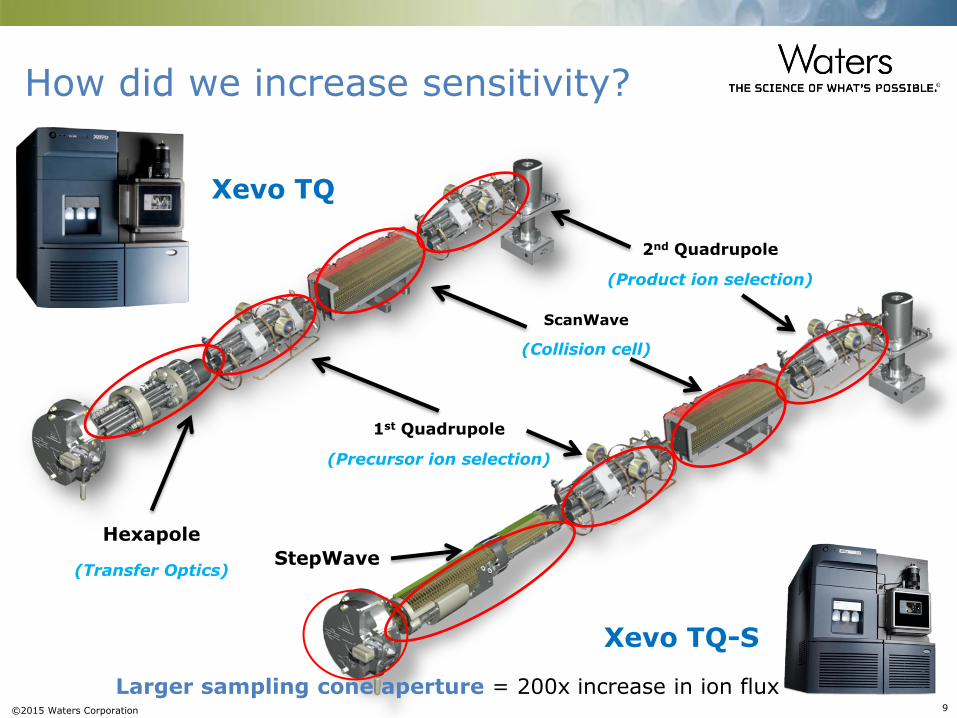
Xevo TQ
Xevo TQ-S
StepWave
ScanWave
(Collision cell)
How did we increase sensitivity?
Hexapole
(Transfer Optics)
1st Quadrupole
(Precursor ion selection)
2nd Quadrupole
(Product ion selection)
Larger sampling cone aperture = 200x increase in ion flux
©2015 Waters Corporation 10
Ele
ctr
ic F
ield
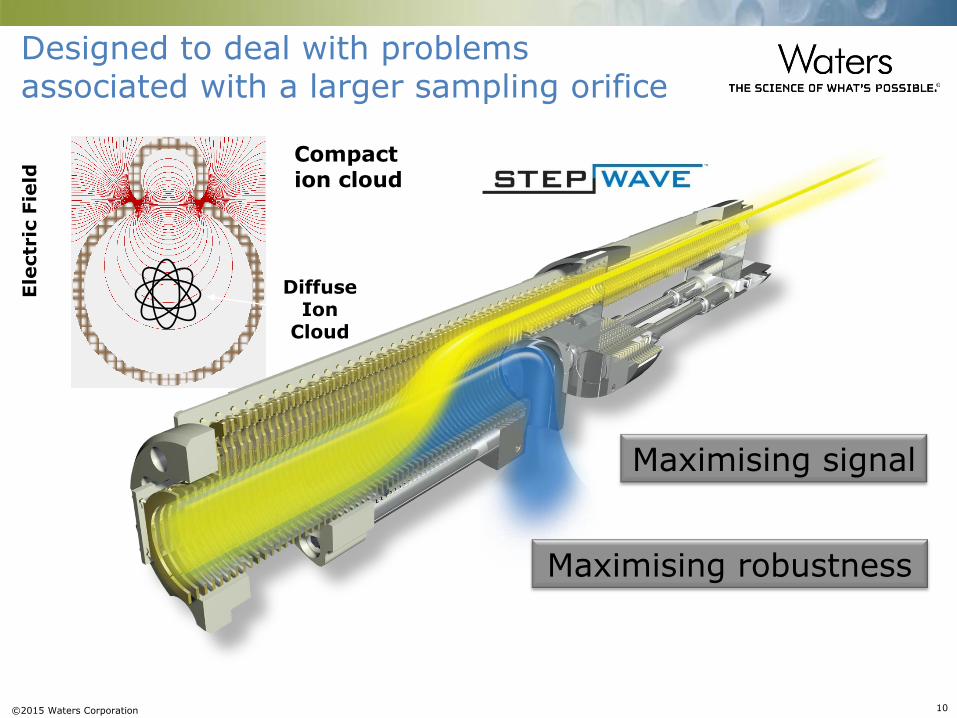
Diffuse Ion
Cloud
Maximising signal
Maximising robustness
Designed to deal with problems associated with a larger sampling orifice
Compact ion cloud
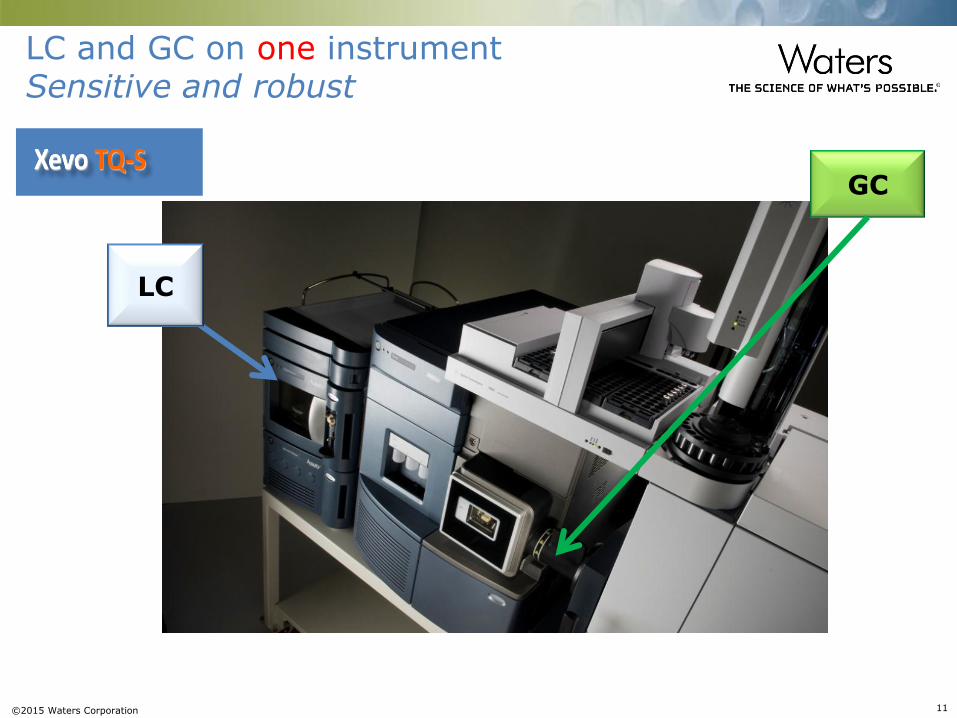
©2015 Waters Corporation 11
LC and GC on one instrument Sensitive and robust
GC
LC
©2015 Waters Corporation 12
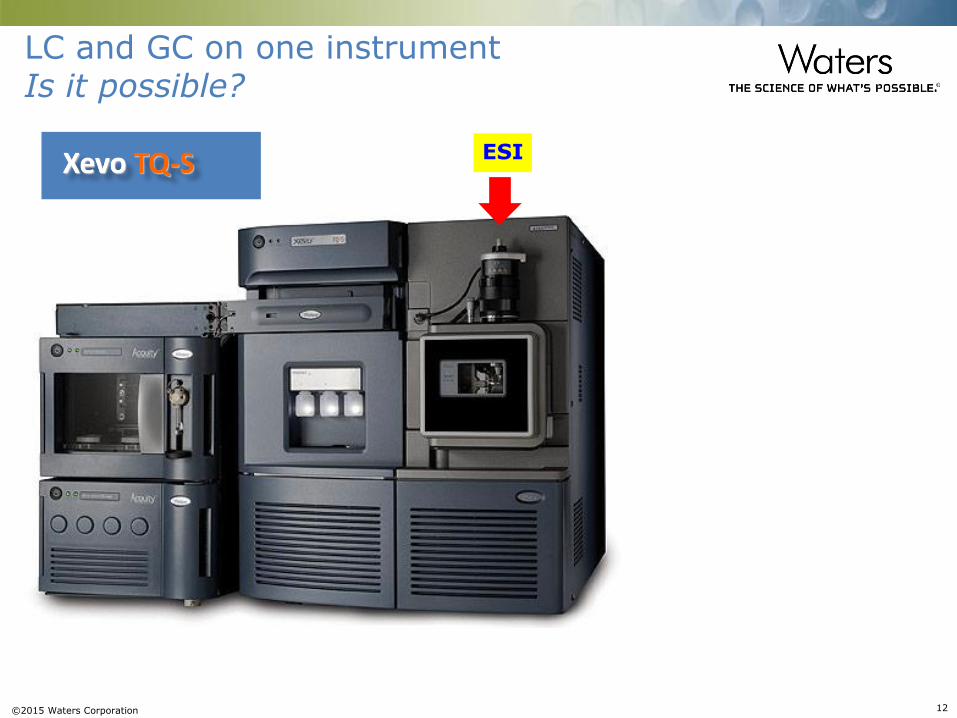
LC and GC on one instrument Is it possible?
ESI
©2015 Waters Corporation 13
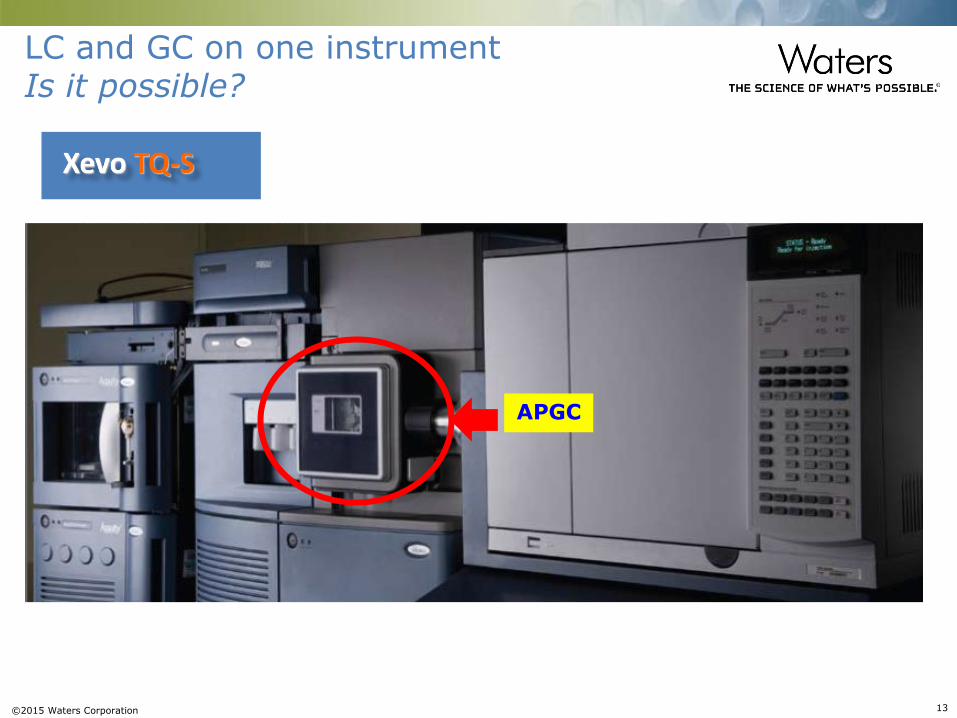
LC and GC on one instrument Is it possible?
APGC
©2015 Waters Corporation 14
Atmospheric Pressure Gas Chromatography
(APGC)
How does it work?
©2015 Waters Corporation 15
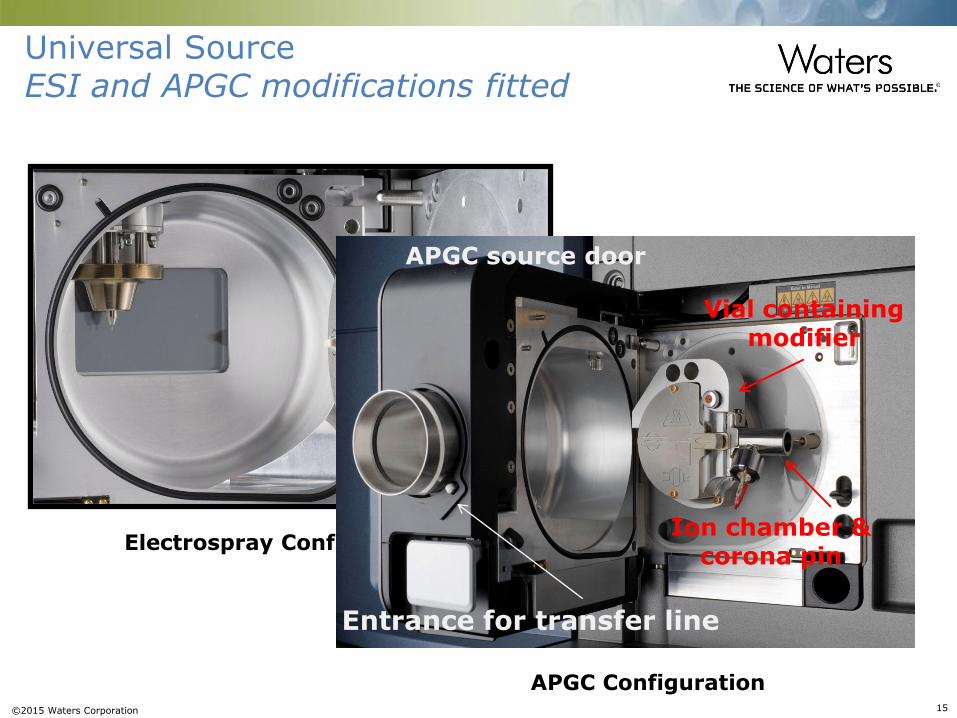
Universal Source ESI and APGC modifications fitted
Sampling cone
Electrospray Configuration
Vial containing modifier
Ion chamber & corona pin
APGC Configuration
APGC source door
Entrance for transfer line
©2015 Waters Corporation 16
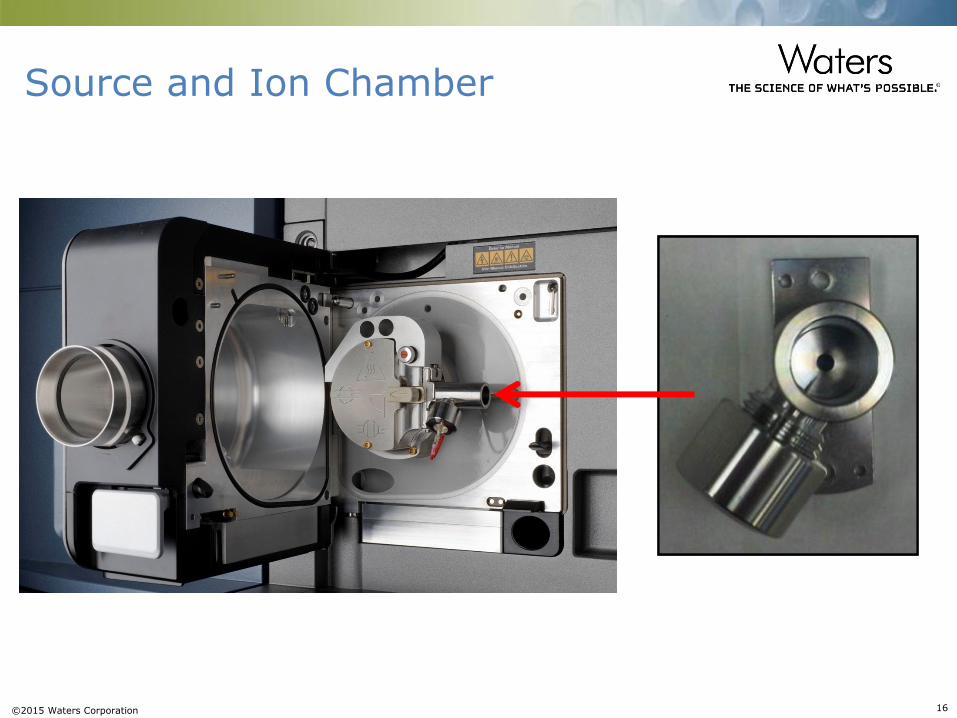
Source and Ion Chamber
©2015 Waters Corporation 17
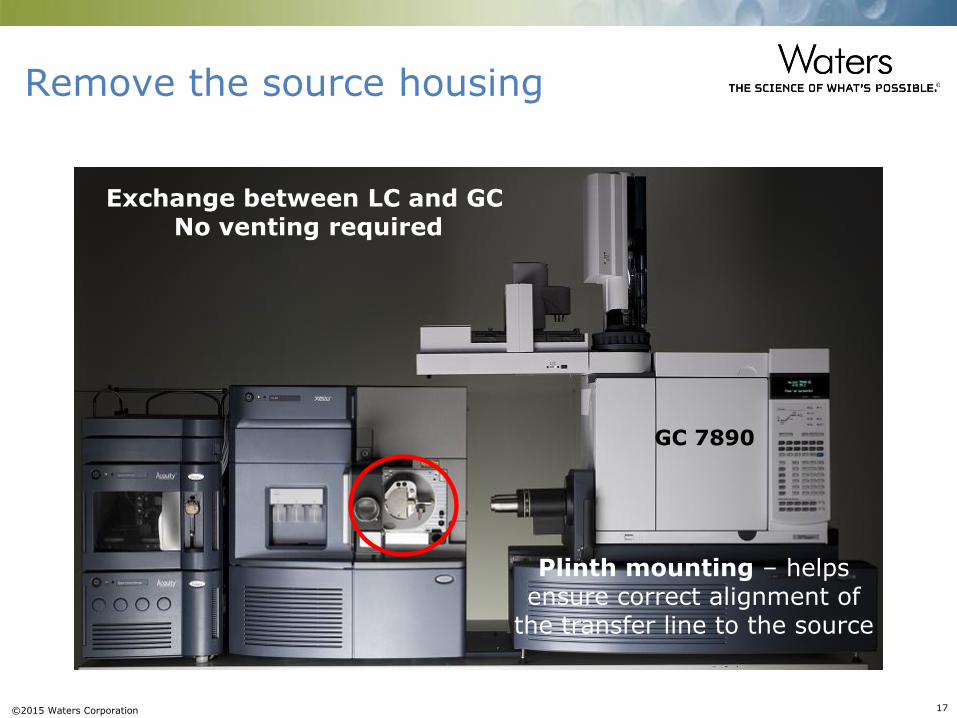
Remove the source housing
Plinth mounting – helps ensure correct alignment of
the transfer line to the source
GC 7890
Exchange between LC and GC No venting required
©2015 Waters Corporation 18
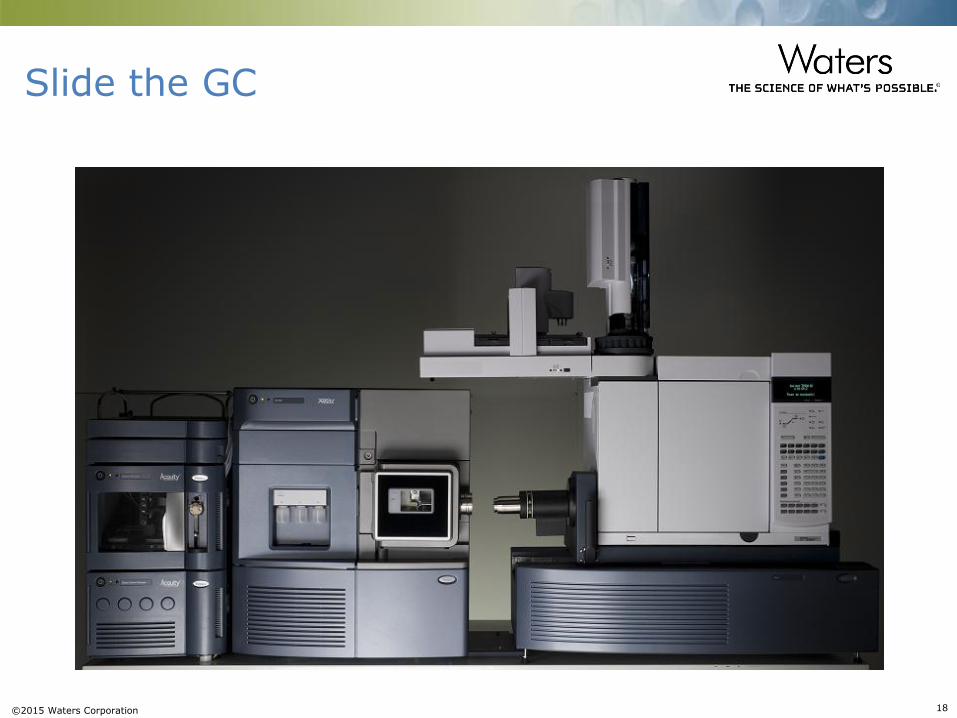
Slide the GC
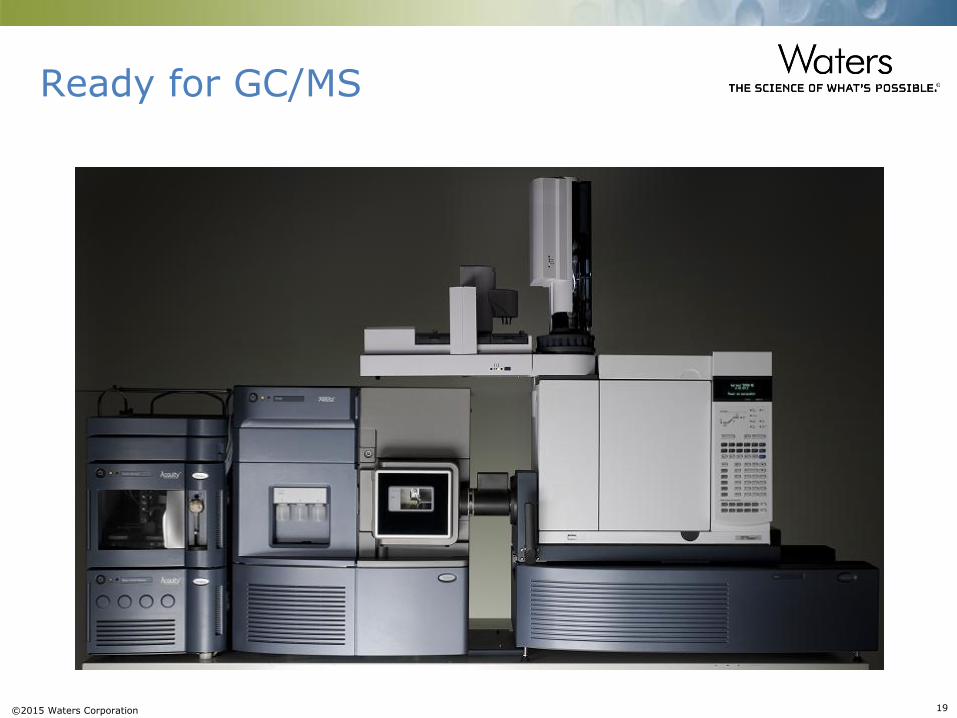
©2015 Waters Corporation 19
Ready for GC/MS
©2015 Waters Corporation 20
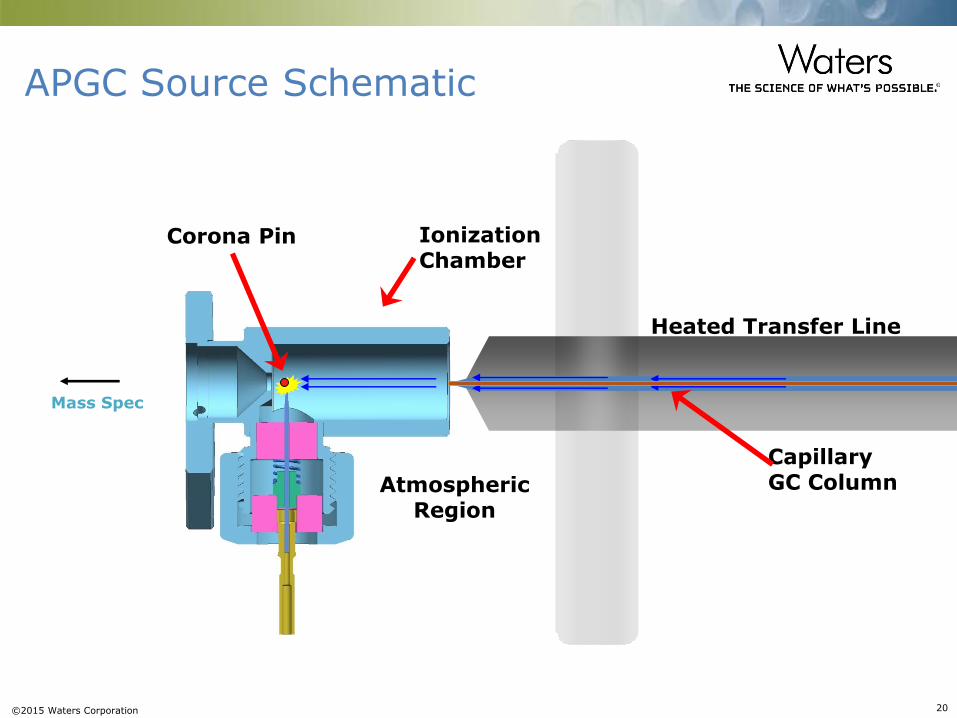
Mass Spec
Corona Pin
Atmospheric Region
Heated Transfer Line
Capillary GC Column
Ionization Chamber
APGC Source Schematic
©2015 Waters Corporation 21
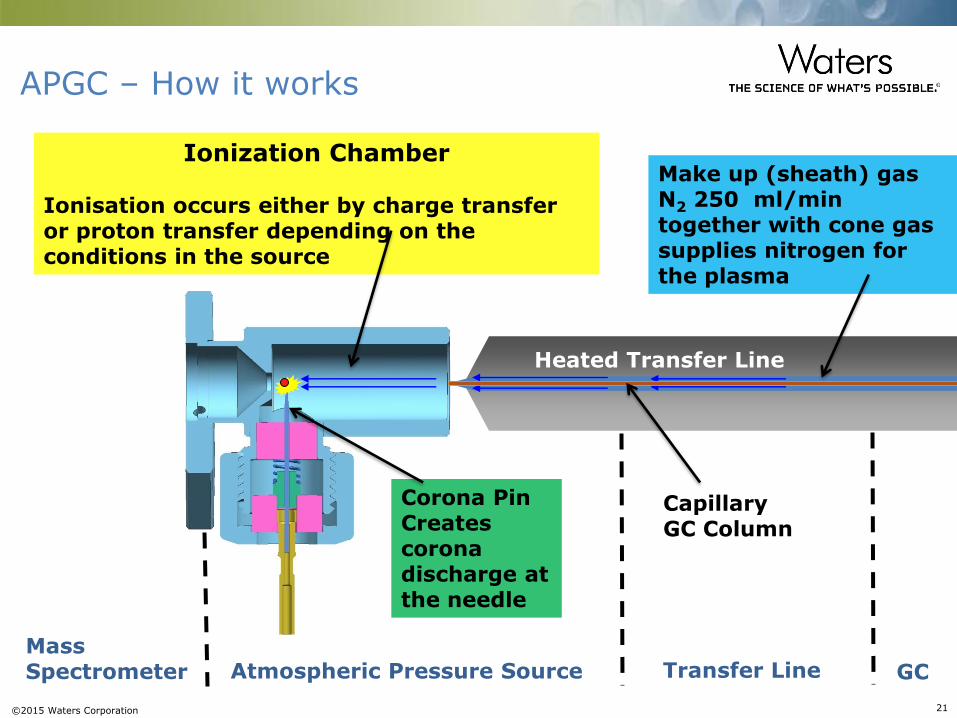
Corona Pin Creates corona discharge at the needle
Atmospheric Pressure Source
Capillary GC Column
Ionization Chamber Ionisation occurs either by charge transfer or proton transfer depending on the conditions in the source
Heated Transfer Line
Transfer Line GC
Make up (sheath) gas N2 250 ml/min together with cone gas supplies nitrogen for the plasma
Mass Spectrometer
APGC – How it works
©2015 Waters Corporation 22
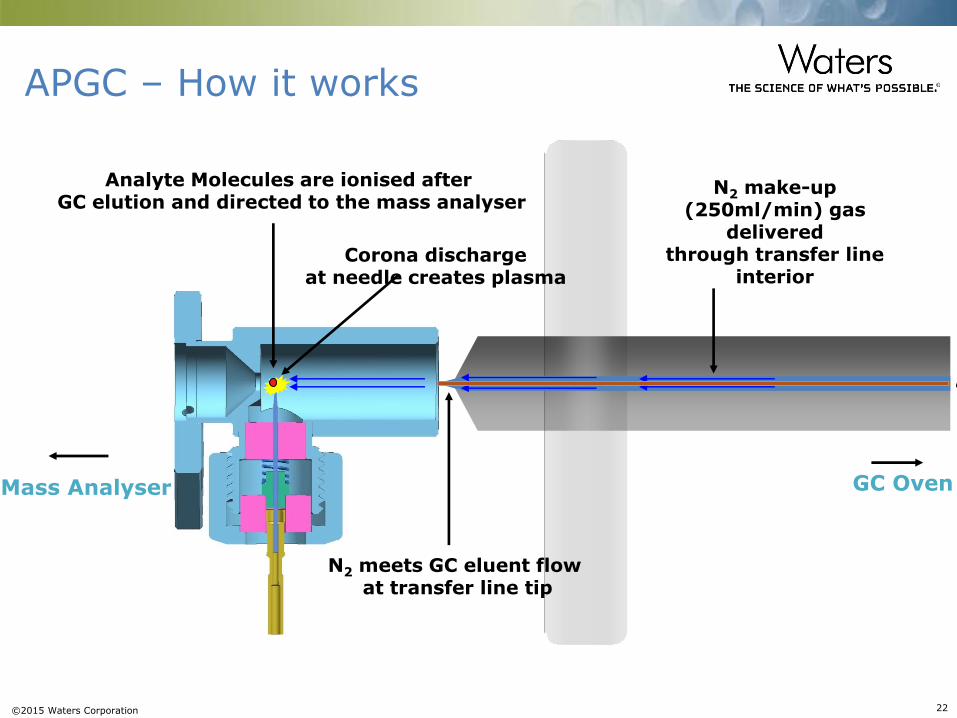
Mass Analyser GC Oven
Corona discharge at needle creates plasma
N2 make-up (250ml/min) gas
delivered through transfer line
interior
N2 meets GC eluent flow at transfer line tip
Analyte Molecules are ionised after GC elution and directed to the mass analyser
APGC – How it works
©2015 Waters Corporation 23
APGC Ionisation Modes & Advantages
©2015 Waters Corporation 24
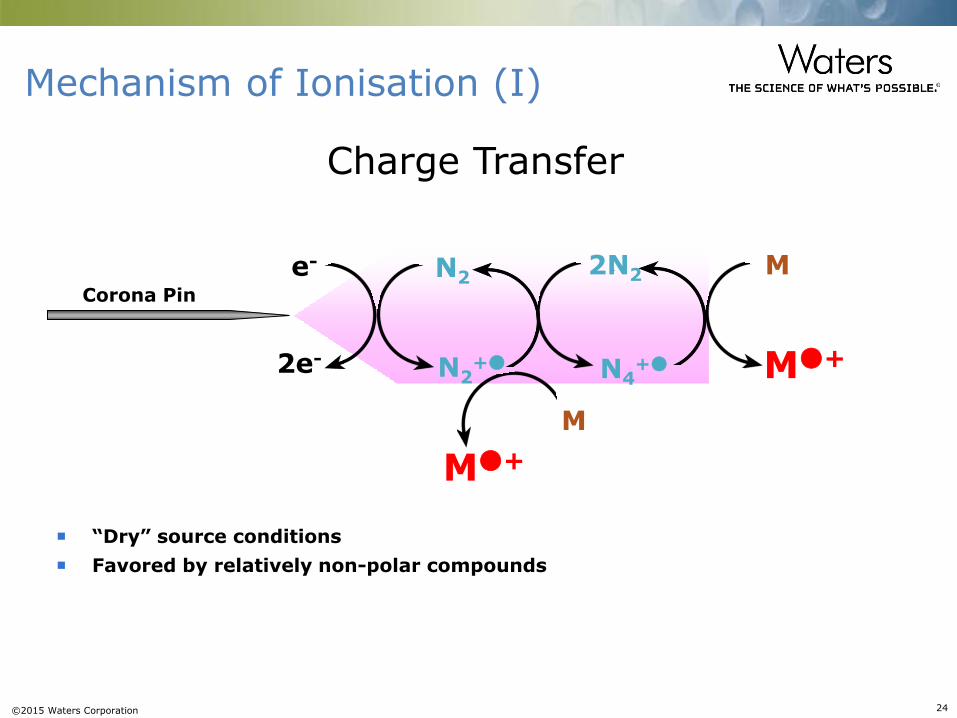
Mechanism of Ionisation (I)
N2+●
N2 e-
2e-
2N2
N4+● M●+
M Corona Pin
M●+
M
Charge Transfer
“Dry” source conditions
Favored by relatively non-polar compounds
©2015 Waters Corporation 25
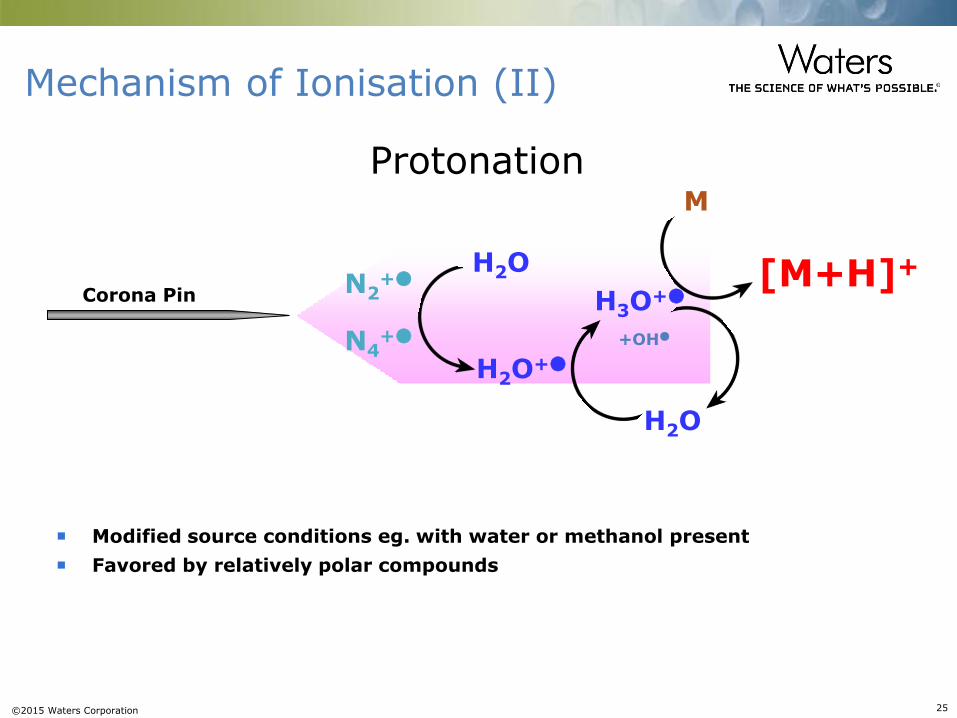
Mechanism of Ionisation (II)
N2+●
N4+●
H2O
H2O+●
H2O
H3O+●
+OH●
[M+H]+
M
Protonation
Modified source conditions eg. with water or methanol present
Favored by relatively polar compounds
Corona Pin
©2015 Waters Corporation 26 Time
2.00 4.00 6.00 8.00 10.00 12.00 14.00
%
0
100
ANAPGC240409TEST009 TOF MS AP+ 278.025 0.02Da
6718.75
0.01µg/ml BF Std
Time8.00 10.00 12.00 14.00 16.00 18.00 20.00 22.00
%
0
100
CSL_200306_204 TOF MS EI+ 277.018 0.02Da
298
15.98
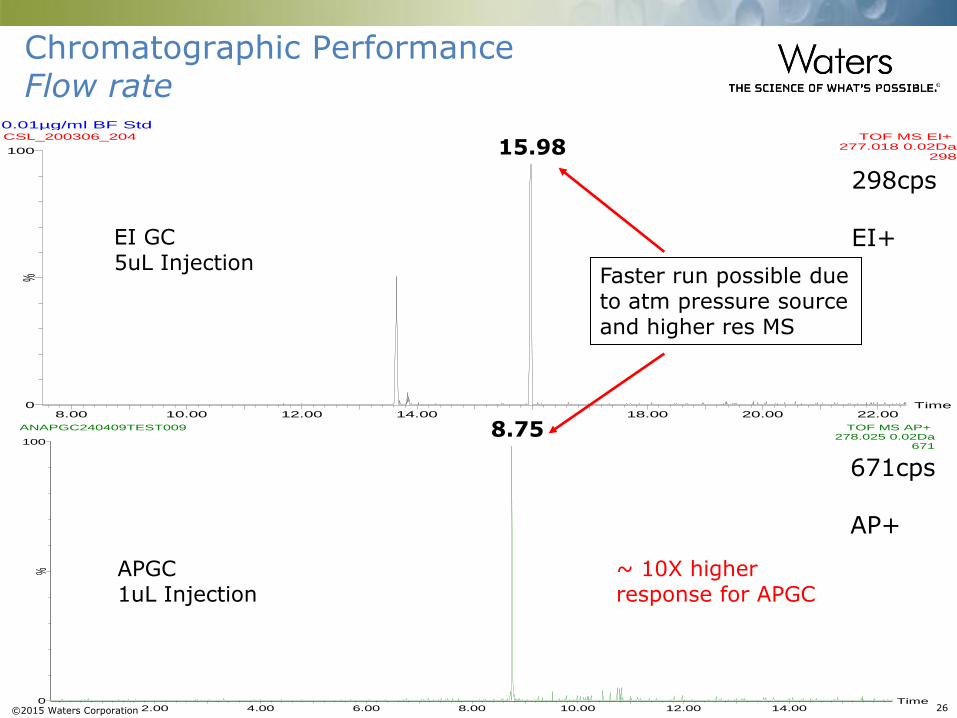
EI GC 5uL Injection
APGC 1uL Injection
298cps EI+
671cps AP+
Faster run possible due to atm pressure source and higher res MS
15.98
8.75
~ 10X higher response for APGC
Chromatographic Performance Flow rate
©2015 Waters Corporation 27
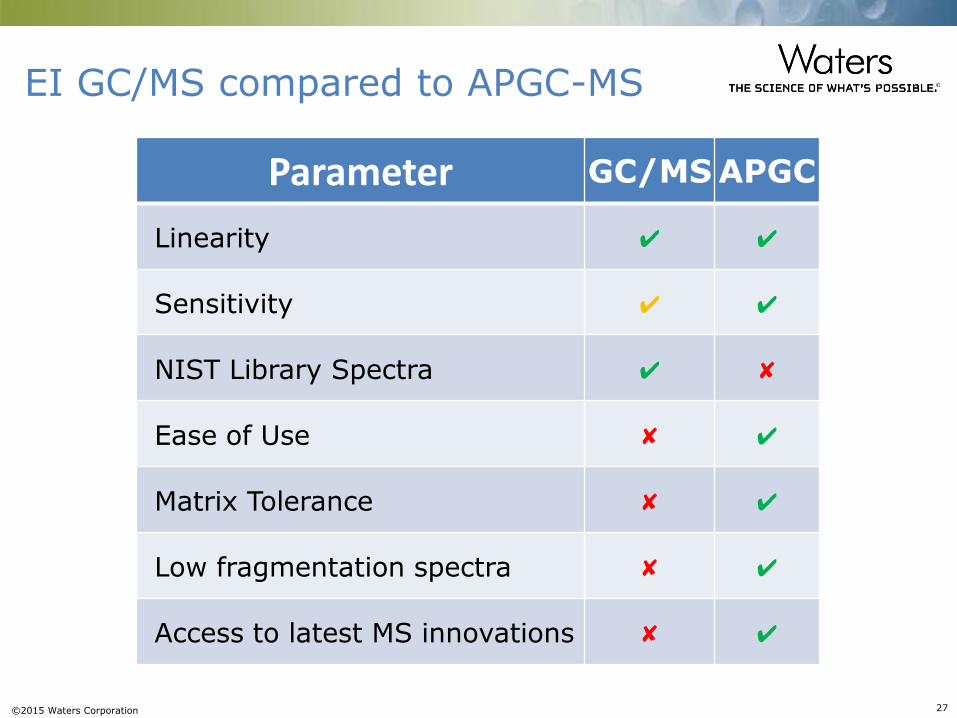
EI GC/MS compared to APGC-MS
Parameter GC/MS APGC
Linearity ✔ ✔
Sensitivity ✔ ✔
NIST Library Spectra ✔ ✘
Ease of Use ✘ ✔
Matrix Tolerance ✘ ✔
Low fragmentation spectra ✘ ✔
Access to latest MS innovations ✘ ✔
©2015 Waters Corporation 28
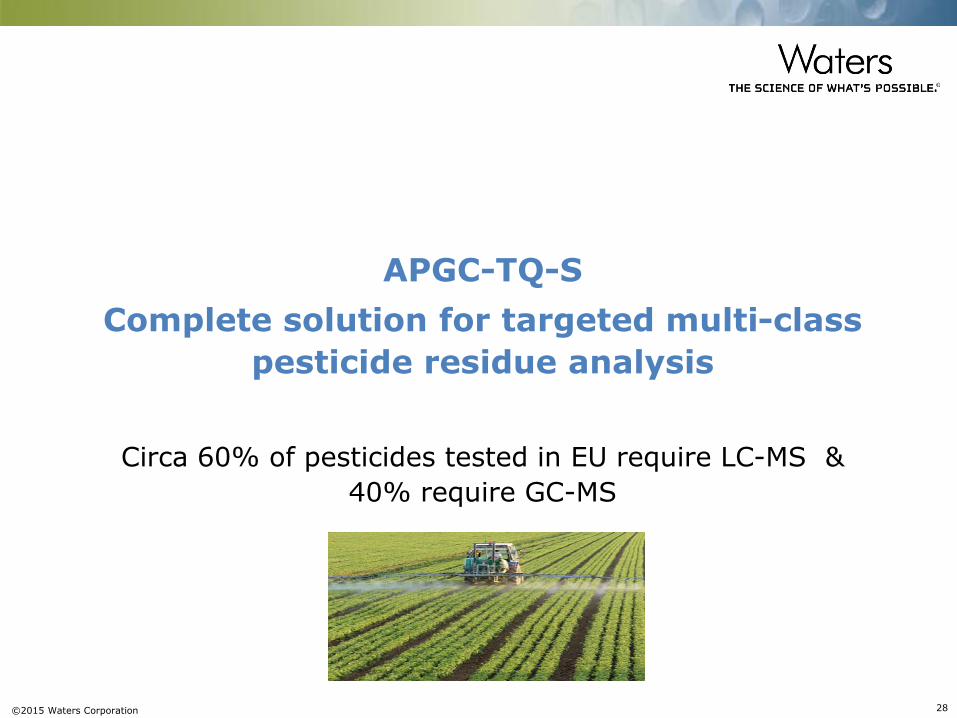
APGC-TQ-S
Complete solution for targeted multi-class
pesticide residue analysis
Circa 60% of pesticides tested in EU require LC-MS &
40% require GC-MS
©2015 Waters Corporation 29
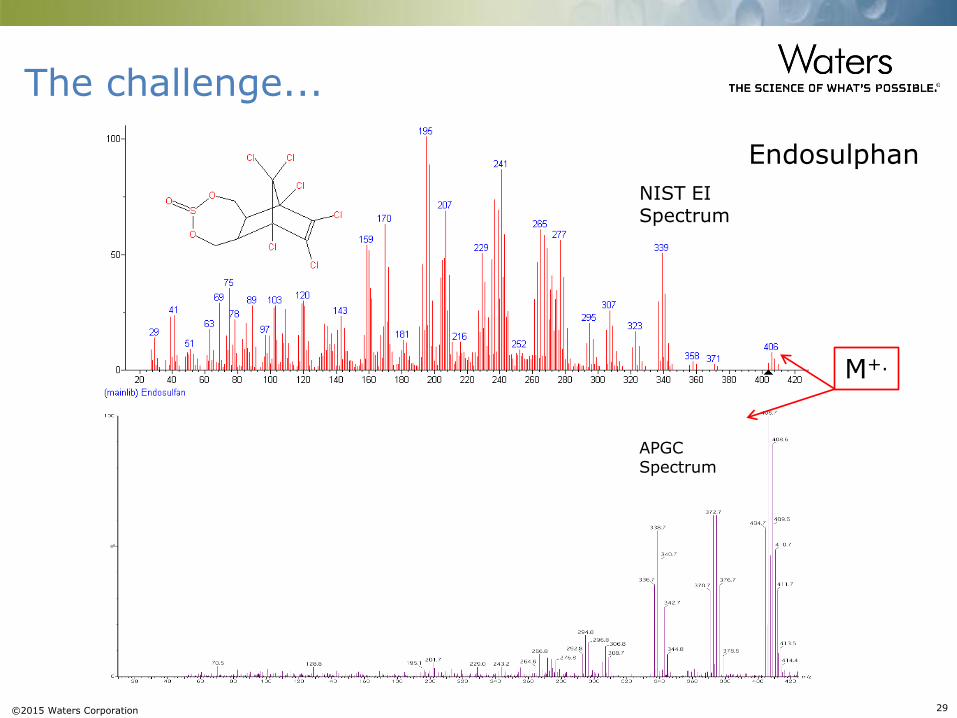
NIST EI Spectrum
APGC Spectrum
Endosulphan
M+.
The challenge...
©2015 Waters Corporation 30
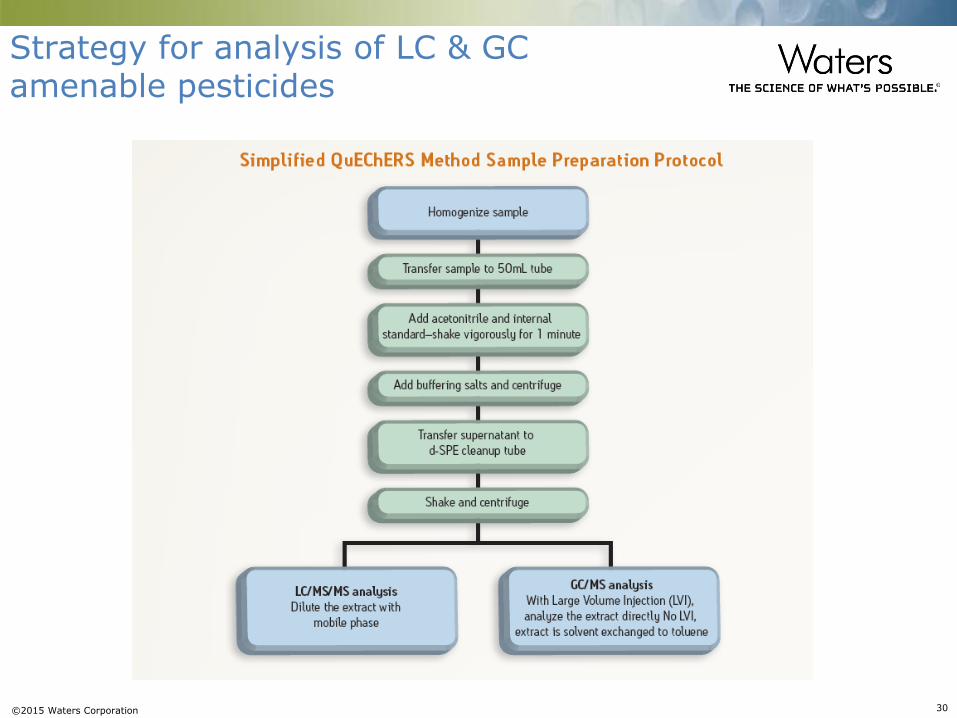
Strategy for analysis of LC & GC amenable pesticides
©2015 Waters Corporation 31
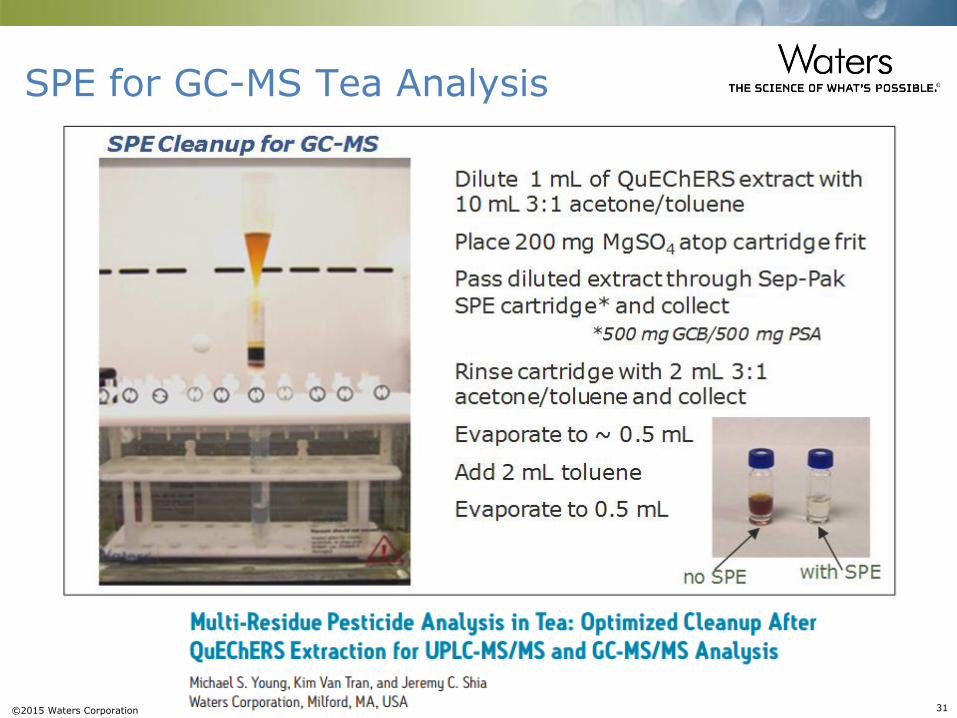
SPE for GC-MS Tea Analysis
©2015 Waters Corporation 32
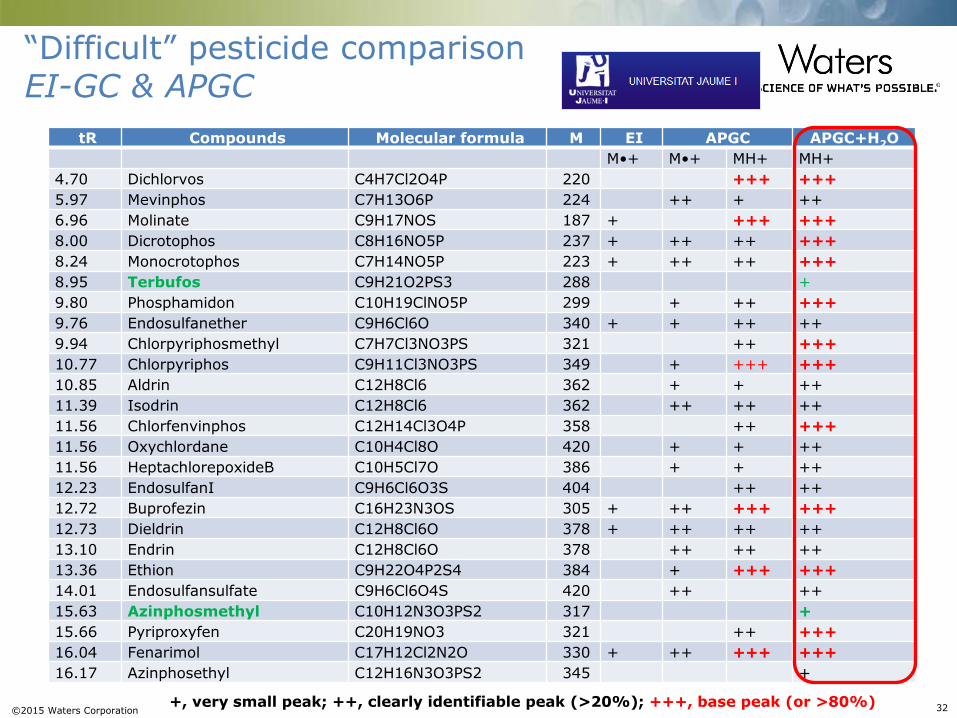
“Difficult” pesticide comparison EI-GC & APGC
tR Compounds Molecular formula M EI APGC APGC+H2O
M•+ M•+ MH+ MH+
4.70 Dichlorvos C4H7Cl2O4P 220 +++ +++
5.97 Mevinphos C7H13O6P 224 ++ + ++
6.96 Molinate C9H17NOS 187 + +++ +++
8.00 Dicrotophos C8H16NO5P 237 + ++ ++ +++
8.24 Monocrotophos C7H14NO5P 223 + ++ ++ +++
8.95 Terbufos C9H21O2PS3 288 +
9.80 Phosphamidon C10H19ClNO5P 299 + ++ +++
9.76 Endosulfanether C9H6Cl6O 340 + + ++ ++
9.94 Chlorpyriphosmethyl C7H7Cl3NO3PS 321 ++ +++
10.77 Chlorpyriphos C9H11Cl3NO3PS 349 + +++ +++
10.85 Aldrin C12H8Cl6 362 + + ++
11.39 Isodrin C12H8Cl6 362 ++ ++ ++
11.56 Chlorfenvinphos C12H14Cl3O4P 358 ++ +++
11.56 Oxychlordane C10H4Cl8O 420 + + ++
11.56 HeptachlorepoxideB C10H5Cl7O 386 + + ++
12.23 EndosulfanI C9H6Cl6O3S 404 ++ ++
12.72 Buprofezin C16H23N3OS 305 + ++ +++ +++
12.73 Dieldrin C12H8Cl6O 378 + ++ ++ ++
13.10 Endrin C12H8Cl6O 378 ++ ++ ++
13.36 Ethion C9H22O4P2S4 384 + +++ +++
14.01 Endosulfansulfate C9H6Cl6O4S 420 ++ ++
15.63 Azinphosmethyl C10H12N3O3PS2 317 +
15.66 Pyriproxyfen C20H19NO3 321 ++ +++
16.04 Fenarimol C17H12Cl2N2O 330 + ++ +++ +++
16.17 Azinphosethyl C12H16N3O3PS2 345 +
+, very small peak; ++, clearly identifiable peak (>20%); +++, base peak (or >80%)
©2015 Waters Corporation 33
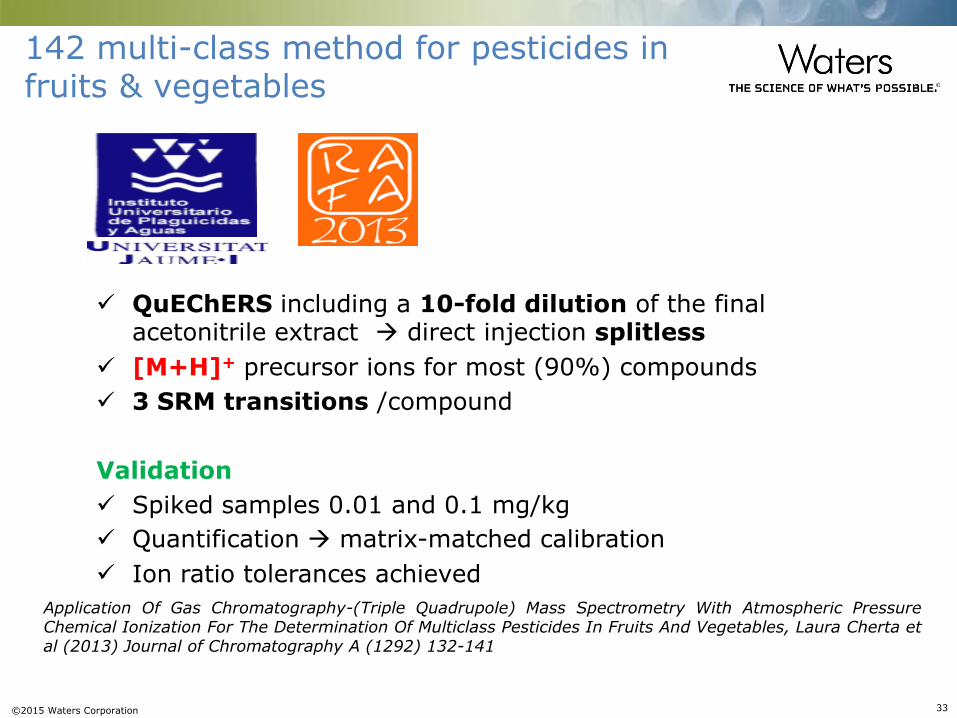
142 multi-class method for pesticides in fruits & vegetables
QuEChERS including a 10-fold dilution of the final acetonitrile extract direct injection splitless
[M+H]+ precursor ions for most (90%) compounds
3 SRM transitions /compound
Validation
Spiked samples 0.01 and 0.1 mg/kg
Quantification matrix-matched calibration
Ion ratio tolerances achieved
Application Of Gas Chromatography-(Triple Quadrupole) Mass Spectrometry With Atmospheric Pressure Chemical Ionization For The Determination Of Multiclass Pesticides In Fruits And Vegetables, Laura Cherta et al (2013) Journal of Chromatography A (1292) 132-141
©2015 Waters Corporation 34
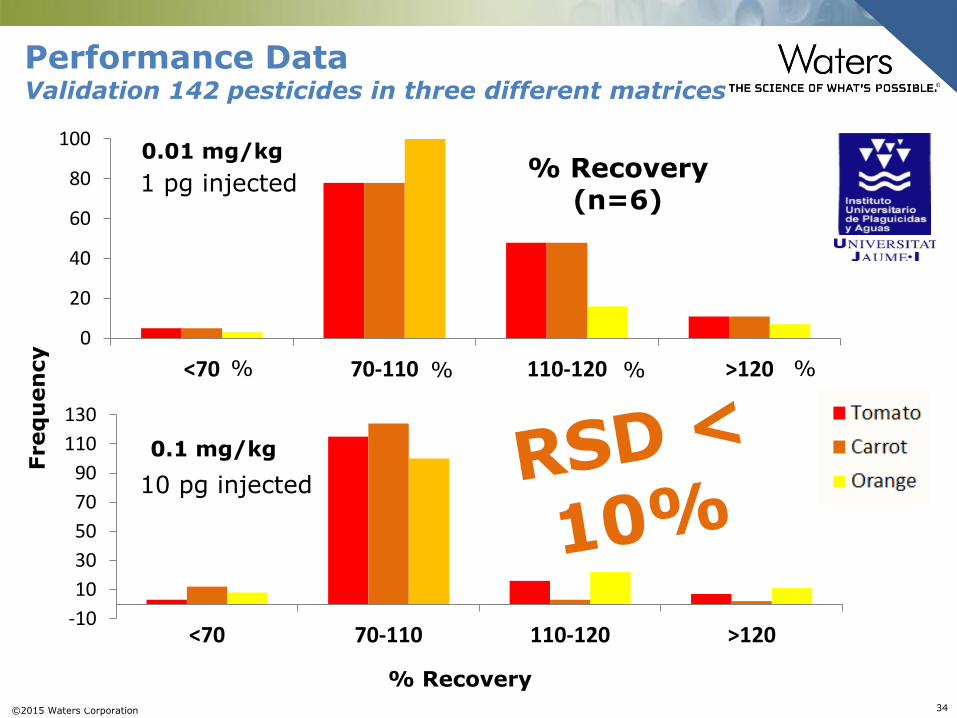
% Recovery
%
Freq
uen
cy
% % %
0
20
40
60
80
100
<70 70-110 110-120 >120
-10
10
30
50
70
90
110
130
<70 70-110 110-120 >120
0.01 mg/kg
0.1 mg/kg
% Recovery (n=6)
1 pg injected
10 pg injected
Performance Data Validation 142 pesticides in three different matrices
©2015 Waters Corporation 35
Authors’ Conclusions…
APCI allows a “universal” soft-ionization for GC-amenable compounds, which provides more selectivity and sensitivity due to the selection of the molecular ion/protonated molecule as precursor ion.
GC-APCI-(QqQ) MS/MS presents good analytical characteristics regarding linearity, precision and limits of detection for determination of target residues in food and environmental samples.
The novel APCI source reveals itself as a good choice to consider in GC-MS/MS for pesticide residue analysis, as well as a suitable alternative to HRMS in the dioxins field
©2015 Waters Corporation 36
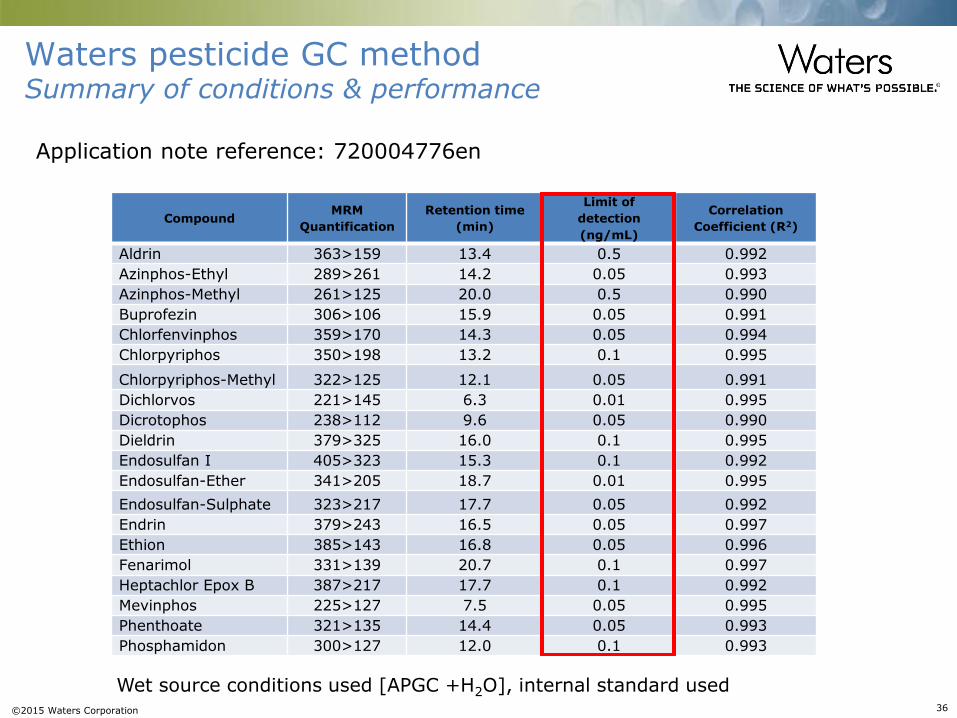
Waters pesticide GC method Summary of conditions & performance
Compound MRM
Quantification
Retention time
(min)
Limit of
detection
(ng/mL)
Correlation
Coefficient (R2)
Aldrin 363>159 13.4 0.5 0.992
Azinphos-Ethyl 289>261 14.2 0.05 0.993
Azinphos-Methyl 261>125 20.0 0.5 0.990
Buprofezin 306>106 15.9 0.05 0.991
Chlorfenvinphos 359>170 14.3 0.05 0.994
Chlorpyriphos 350>198 13.2 0.1 0.995
Chlorpyriphos-Methyl 322>125 12.1 0.05 0.991
Dichlorvos 221>145 6.3 0.01 0.995
Dicrotophos 238>112 9.6 0.05 0.990
Dieldrin 379>325 16.0 0.1 0.995
Endosulfan I 405>323 15.3 0.1 0.992
Endosulfan-Ether 341>205 18.7 0.01 0.995
Endosulfan-Sulphate 323>217 17.7 0.05 0.992
Endrin 379>243 16.5 0.05 0.997
Ethion 385>143 16.8 0.05 0.996
Fenarimol 331>139 20.7 0.1 0.997
Heptachlor Epox B 387>217 17.7 0.1 0.992
Mevinphos 225>127 7.5 0.05 0.995
Phenthoate 321>135 14.4 0.05 0.993
Phosphamidon 300>127 12.0 0.1 0.993
Wet source conditions used [APGC +H2O], internal standard used
Application note reference: 720004776en
©2015 Waters Corporation 37
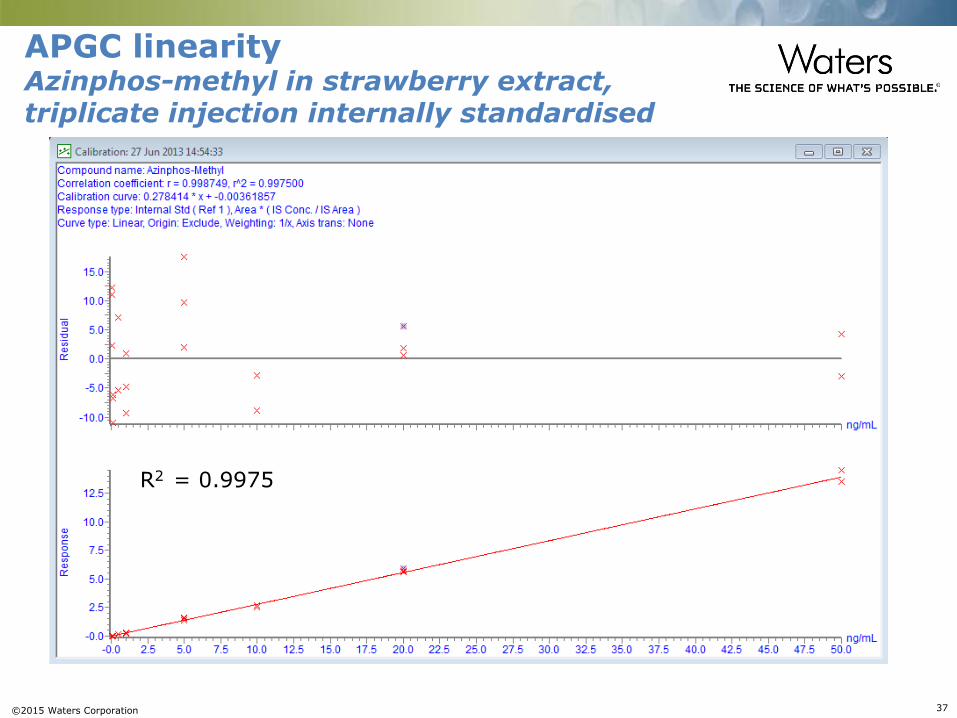
APGC linearity Azinphos-methyl in strawberry extract, triplicate injection internally standardised
R2 = 0.9975
©2015 Waters Corporation 38
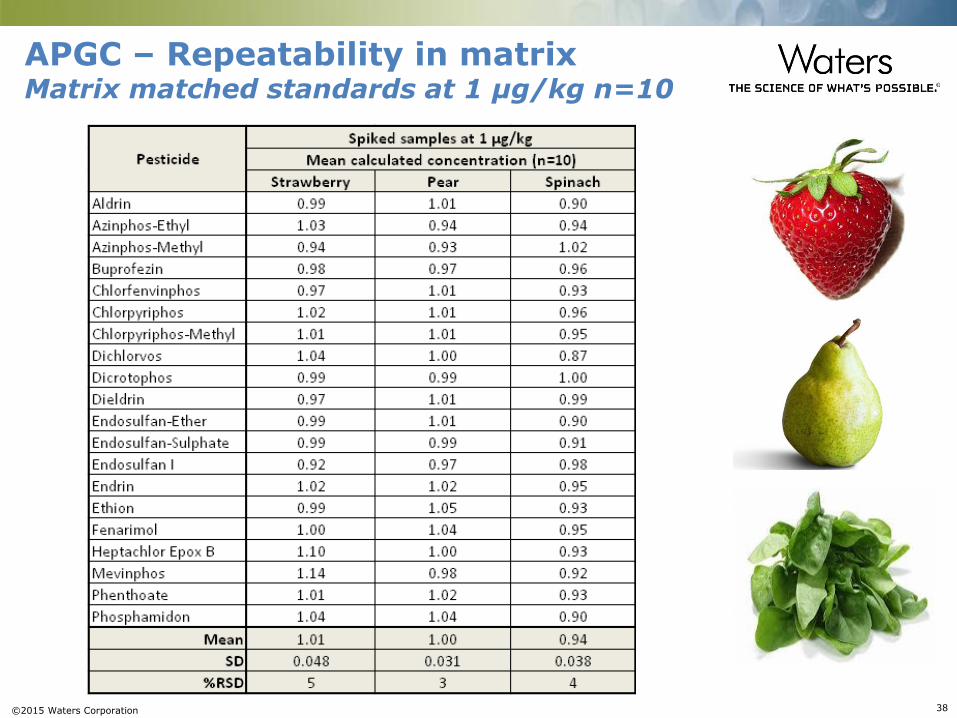
APGC – Repeatability in matrix Matrix matched standards at 1 μg/kg n=10
©2015 Waters Corporation 39
Dioxins & furans
EU legislation revision for screening &
confirmation June 2014
©2015 Waters Corporation 40
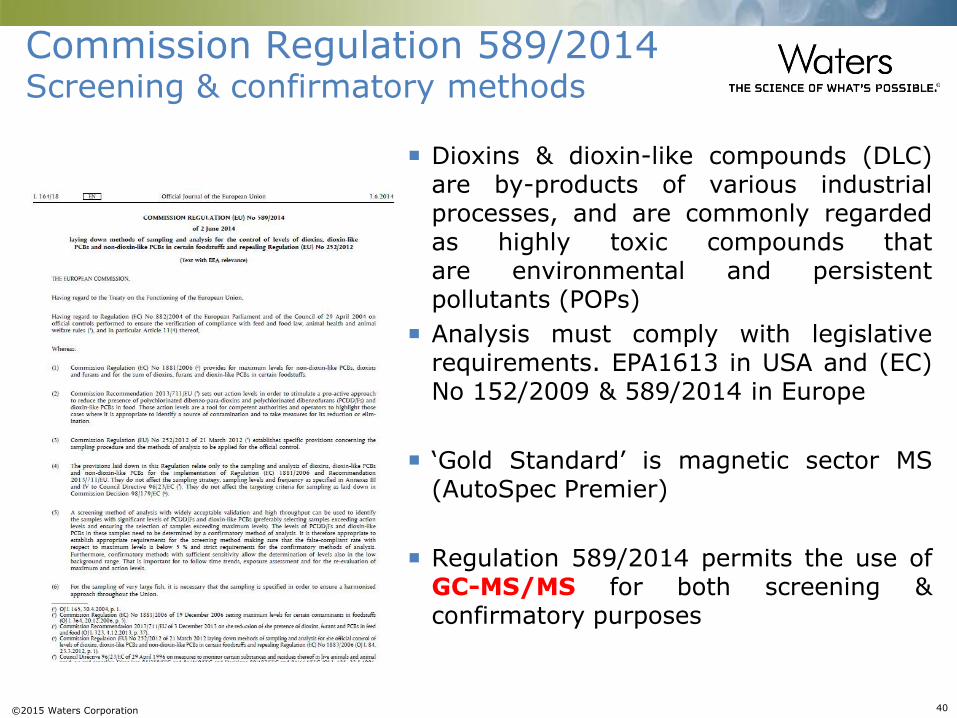
Dioxins & dioxin-like compounds (DLC)
are by-products of various industrial processes, and are commonly regarded as highly toxic compounds that are environmental and persistent pollutants (POPs)
Analysis must comply with legislative requirements. EPA1613 in USA and (EC) No 152/2009 & 589/2014 in Europe
‘Gold Standard’ is magnetic sector MS (AutoSpec Premier)
Regulation 589/2014 permits the use of GC-MS/MS for both screening & confirmatory purposes
Commission Regulation 589/2014 Screening & confirmatory methods
©2015 Waters Corporation 41
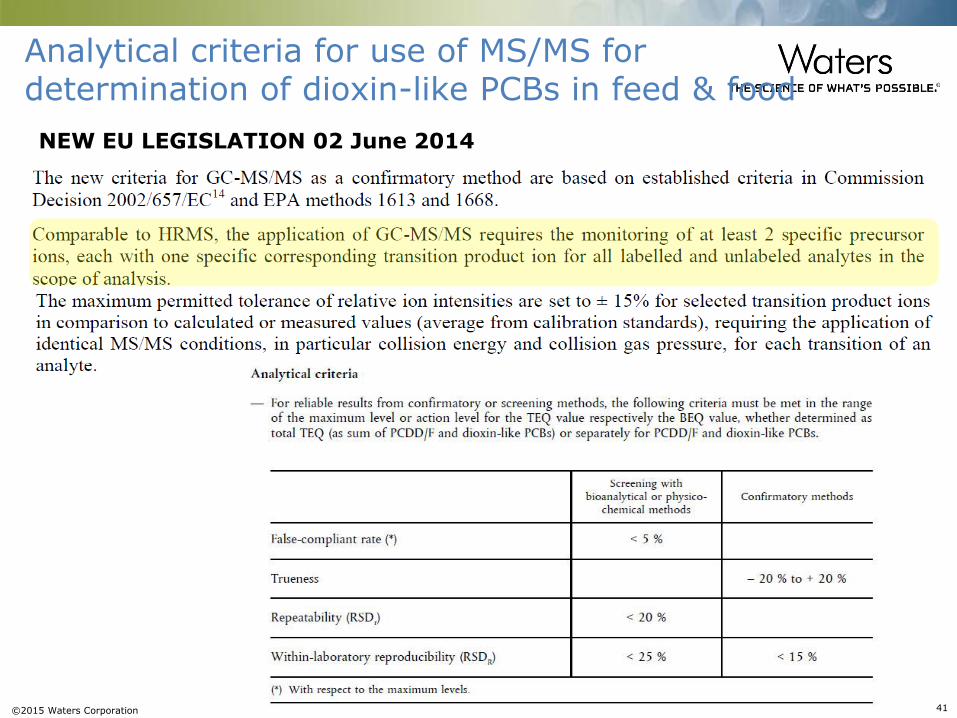
Analytical criteria for use of MS/MS for determination of dioxin-like PCBs in feed & food
NEW EU LEGISLATION 02 June 2014
©2015 Waters Corporation 42
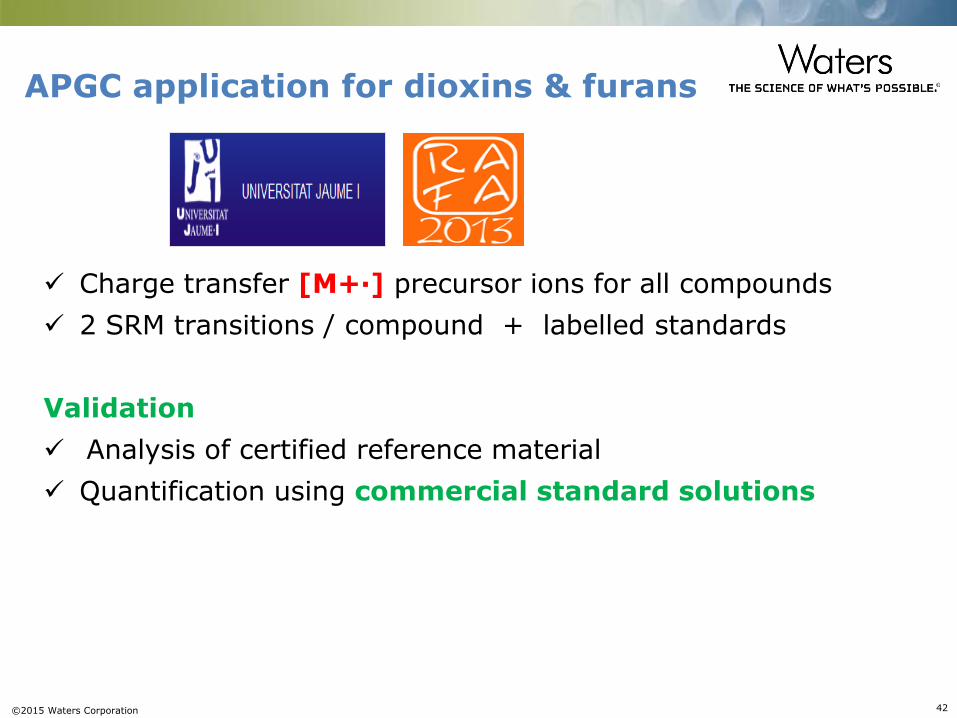
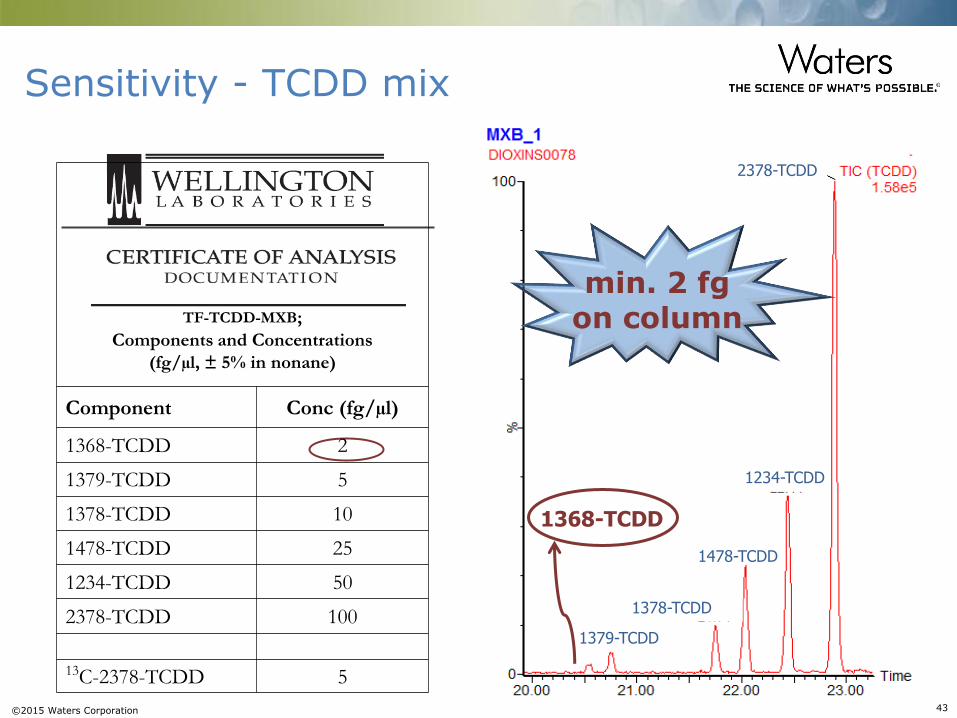
APGC application for dioxins & furans
Charge transfer [M+·] precursor ions for all compounds
2 SRM transitions / compound + labelled standards
Validation
Analysis of certified reference material
Quantification using commercial standard solutions
©2015 Waters Corporation 43
1368-TCDD
min. 2 fg on column
1379-TCDD
1378-TCDD
1478-TCDD
1234-TCDD
2378-TCDD
TF-TCDD-MXB;
Components and Concentrations
(fg/µl, ± 5% in nonane)
Component Conc (fg/µl)
1368-TCDD 2
1379-TCDD 5
1378-TCDD 10
1478-TCDD 25
1234-TCDD 50
2378-TCDD 100
13C-2378-TCDD 5
Sensitivity - TCDD mix
©2015 Waters Corporation 44
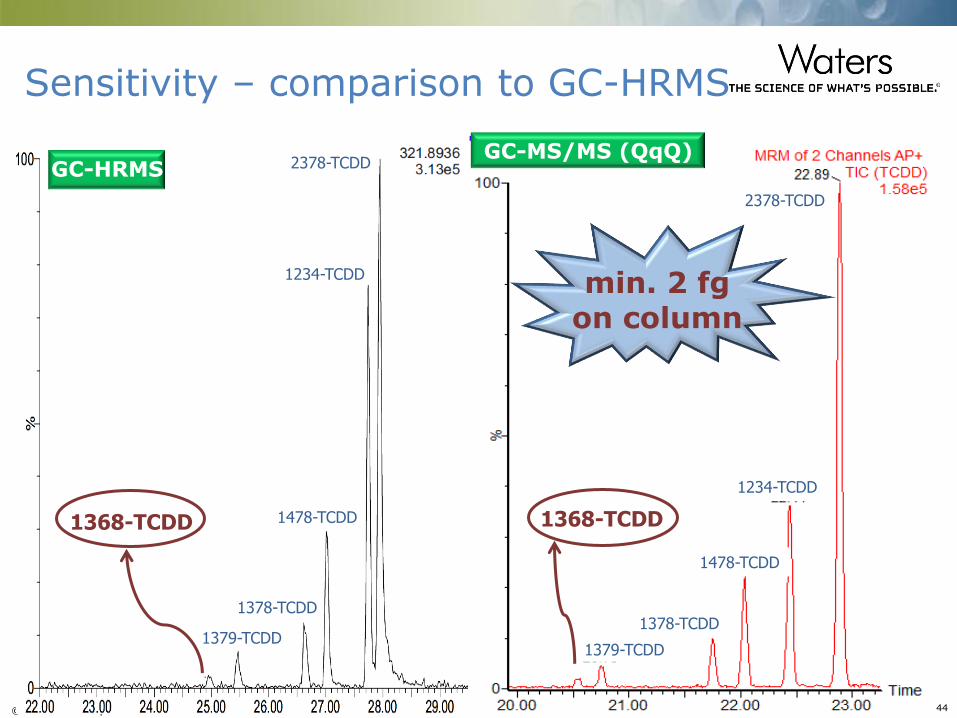
1368-TCDD
min. 2 fg on column
1379-TCDD 1379-TCDD
1368-TCDD
1378-TCDD 1378-TCDD
1478-TCDD
1478-TCDD
1234-TCDD
1234-TCDD
2378-TCDD
2378-TCDD GC-HRMS GC-MS/MS (QqQ)
Sensitivity – comparison to GC-HRMS
©2015 Waters Corporation 45
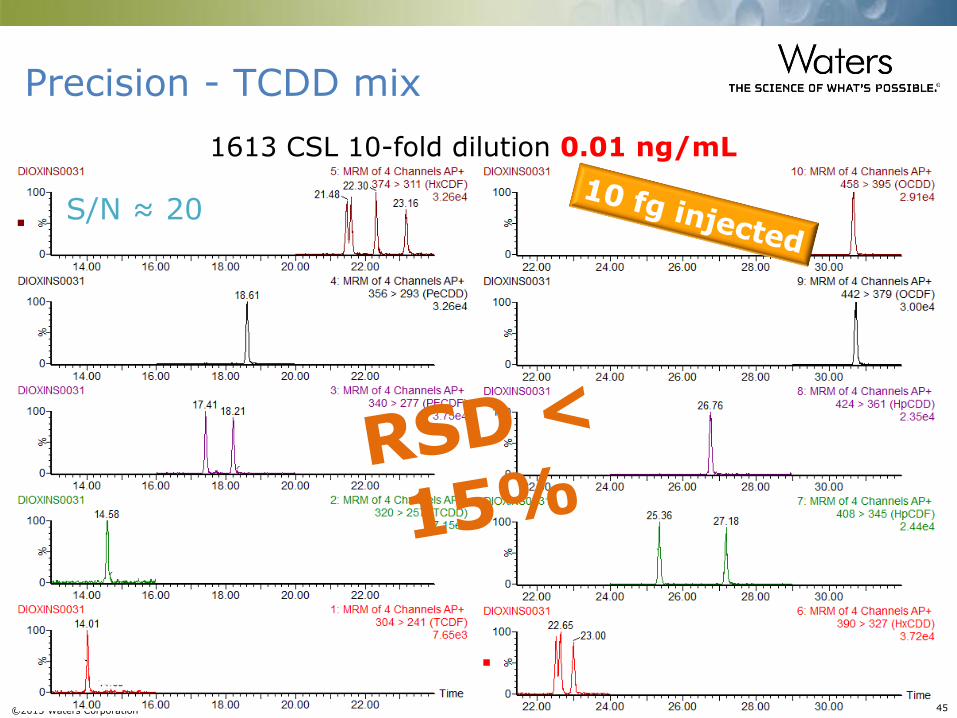
1613 CSL 10-fold dilution 0.01 ng/mL
S/N ≈ 20
Precision - TCDD mix
©2015 Waters Corporation 46
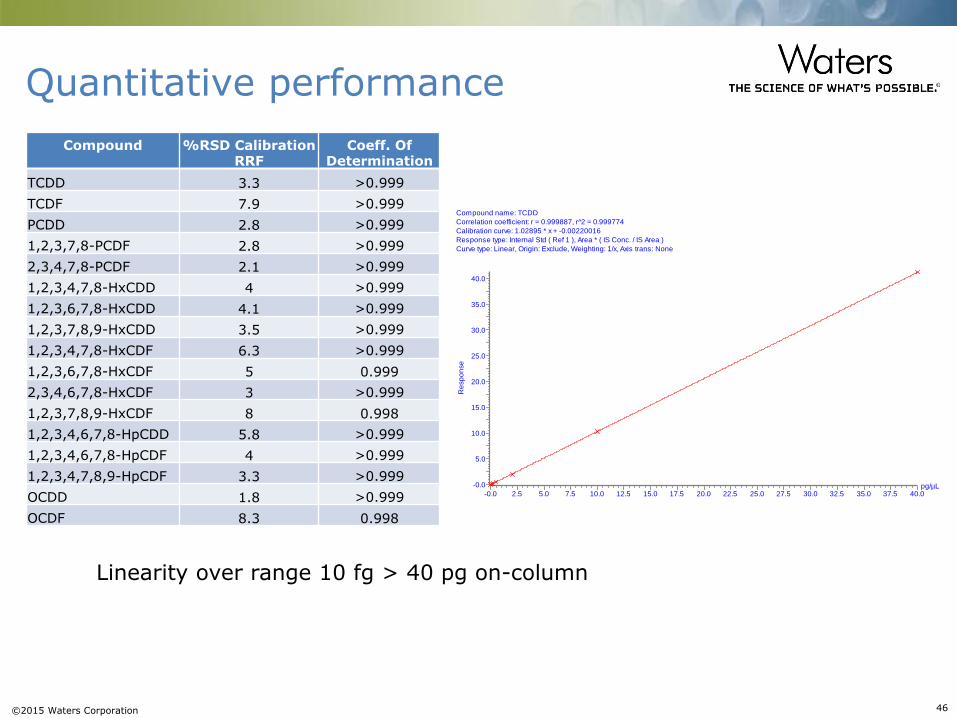
Quantitative performance
Linearity over range 10 fg > 40 pg on-column
Compound
%RSD Calibration RRF
Coeff. Of Determination
TCDD 3.3 >0.999
TCDF 7.9 >0.999
PCDD 2.8 >0.999
1,2,3,7,8-PCDF 2.8 >0.999
2,3,4,7,8-PCDF 2.1 >0.999
1,2,3,4,7,8-HxCDD 4 >0.999
1,2,3,6,7,8-HxCDD 4.1 >0.999
1,2,3,7,8,9-HxCDD 3.5 >0.999
1,2,3,4,7,8-HxCDF 6.3 >0.999
1,2,3,6,7,8-HxCDF 5 0.999
2,3,4,6,7,8-HxCDF 3 >0.999
1,2,3,7,8,9-HxCDF 8 0.998
1,2,3,4,6,7,8-HpCDD 5.8 >0.999
1,2,3,4,6,7,8-HpCDF 4 >0.999
1,2,3,4,7,8,9-HpCDF 3.3 >0.999
OCDD 1.8 >0.999
OCDF 8.3 0.998
Compound name: TCDD
Correlation coefficient: r = 0.999887, r^2 = 0.999774
Calibration curve: 1.02895 * x + -0.00220016
Response type: Internal Std ( Ref 1 ), Area * ( IS Conc. / IS Area )
Curve type: Linear, Origin: Exclude, Weighting: 1/x, Axis trans: None
pg/µL-0.0 2.5 5.0 7.5 10.0 12.5 15.0 17.5 20.0 22.5 25.0 27.5 30.0 32.5 35.0 37.5 40.0
Re
sp
on
se
-0.0
5.0
10.0
15.0
20.0
25.0
30.0
35.0
40.0
©2015 Waters Corporation 47
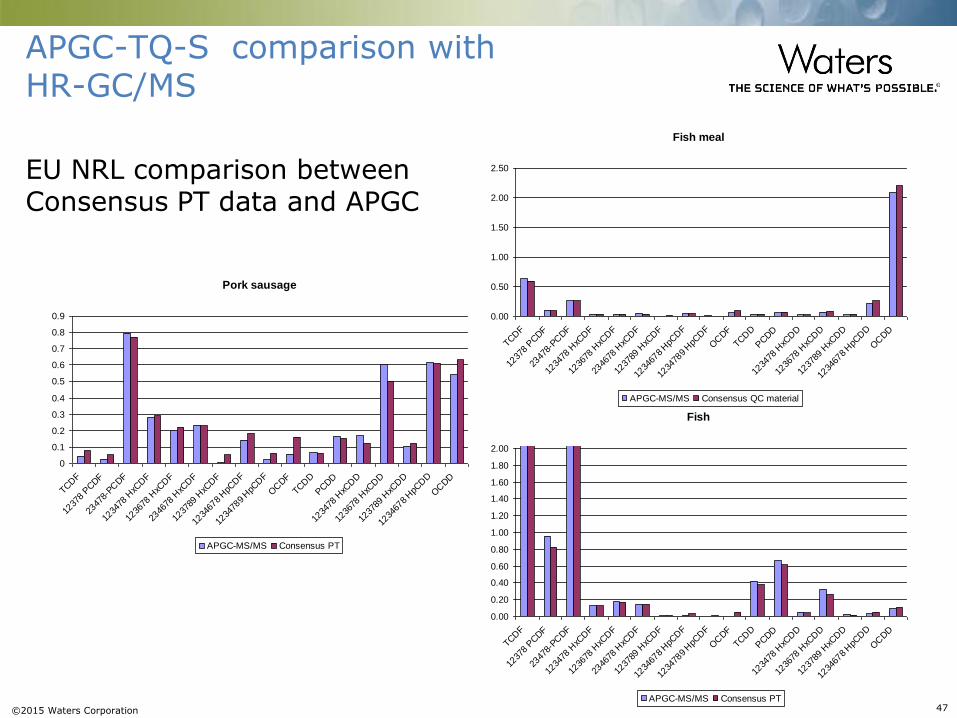
APGC-TQ-S comparison with HR-GC/MS
Fish
0.00
0.20
0.40
0.60
0.80
1.00
1.20
1.40
1.60
1.80
2.00
TCDF
1237
8 PCDF
2347
8-PC
DF
1234
78 H
xCDF
1236
78 H
xCDF
2346
78 H
xCDF
1237
89 H
xCDF
1234
678 HpC
DF
1234
789 HpC
DF
OCDF
TCDD
PCDD
1234
78 H
xCDD
1236
78 H
xCDD
1237
89 H
xCDD
1234
678 HpC
DD
OCDD
APGC-MS/MS Consensus PT
Fish meal
0.00
0.50
1.00
1.50
2.00
2.50
TCDF
1237
8 PCDF
2347
8-PC
DF
1234
78 H
xCDF
1236
78 H
xCDF
2346
78 H
xCDF
1237
89 H
xCDF
1234
678 HpC
DF
1234
789 HpC
DF
OCDF
TCDD
PCDD
1234
78 H
xCDD
1236
78 H
xCDD
1237
89 H
xCDD
1234
678 HpC
DD
OCDD
APGC-MS/MS Consensus QC material
Pork sausage
0
0.1
0.2
0.3
0.4
0.5
0.6
0.7
0.8
0.9
TCDF
1237
8 PCDF
2347
8-PC
DF
1234
78 H
xCDF
1236
78 H
xCDF
2346
78 H
xCDF
1237
89 H
xCDF
1234
678 HpC
DF
1234
789 HpC
DF
OCDF
TCDD
PCDD
1234
78 H
xCDD
1236
78 H
xCDD
1237
89 H
xCDD
1234
678 HpC
DD
OCDD
APGC-MS/MS Consensus PT
EU NRL comparison between Consensus PT data and APGC
©2015 Waters Corporation 48
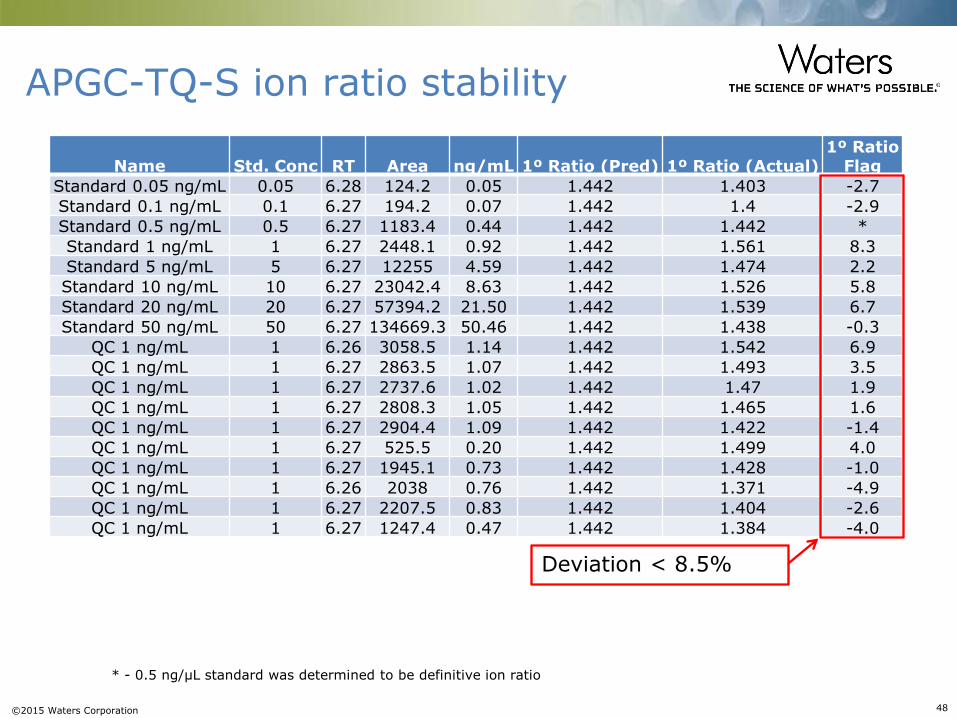
Name Std. Conc RT Area ng/mL 1º Ratio (Pred) 1º Ratio (Actual) 1º Ratio
Flag
Standard 0.05 ng/mL 0.05 6.28 124.2 0.05 1.442 1.403 -2.7
Standard 0.1 ng/mL 0.1 6.27 194.2 0.07 1.442 1.4 -2.9
Standard 0.5 ng/mL 0.5 6.27 1183.4 0.44 1.442 1.442 *
Standard 1 ng/mL 1 6.27 2448.1 0.92 1.442 1.561 8.3
Standard 5 ng/mL 5 6.27 12255 4.59 1.442 1.474 2.2
Standard 10 ng/mL 10 6.27 23042.4 8.63 1.442 1.526 5.8
Standard 20 ng/mL 20 6.27 57394.2 21.50 1.442 1.539 6.7
Standard 50 ng/mL 50 6.27 134669.3 50.46 1.442 1.438 -0.3
QC 1 ng/mL 1 6.26 3058.5 1.14 1.442 1.542 6.9
QC 1 ng/mL 1 6.27 2863.5 1.07 1.442 1.493 3.5
QC 1 ng/mL 1 6.27 2737.6 1.02 1.442 1.47 1.9
QC 1 ng/mL 1 6.27 2808.3 1.05 1.442 1.465 1.6
QC 1 ng/mL 1 6.27 2904.4 1.09 1.442 1.422 -1.4
QC 1 ng/mL 1 6.27 525.5 0.20 1.442 1.499 4.0
QC 1 ng/mL 1 6.27 1945.1 0.73 1.442 1.428 -1.0
QC 1 ng/mL 1 6.26 2038 0.76 1.442 1.371 -4.9
QC 1 ng/mL 1 6.27 2207.5 0.83 1.442 1.404 -2.6
QC 1 ng/mL 1 6.27 1247.4 0.47 1.442 1.384 -4.0
APGC-TQ-S ion ratio stability
* - 0.5 ng/µL standard was determined to be definitive ion ratio
Deviation < 8.5%
©2015 Waters Corporation 49
Summary and Conclusions
For many food safety and environmental applications (e.g.
POPs, Pesticides) both LC & GC techniques are required
– APGC very easy source exchange
– Robust and easy to use
– FID like chromatography performance (gas flow)
Commission Regulation 589/2014 permits the use of GC-MS/MS
as an acceptable approach for screening & confirmatory
methods of analysis for dioxins (June 2014)
APGC is highly selective for many GC methods
– Often use “precursor->product” transitions (MRM) from EI-GC
Sensitivity of Xevo TQ-S in GC or LC is uncompromised
– Very sensitive in both modes!
©2015 Waters Corporation 50
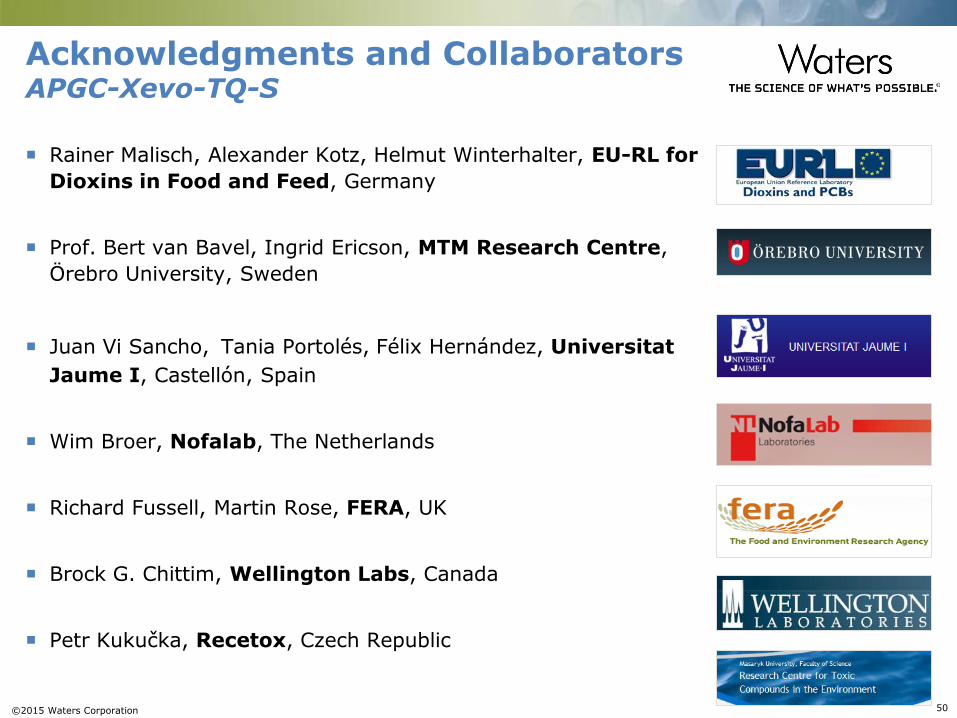
Acknowledgments and Collaborators APGC-Xevo-TQ-S
Rainer Malisch, Alexander Kotz, Helmut Winterhalter, EU-RL for
Dioxins in Food and Feed, Germany
Prof. Bert van Bavel, Ingrid Ericson, MTM Research Centre,
Örebro University, Sweden
Juan Vi Sancho, Tania Portolés, Félix Hernández, Universitat
Jaume I, Castellón, Spain
Wim Broer, Nofalab, The Netherlands
Richard Fussell, Martin Rose, FERA, UK
Brock G. Chittim, Wellington Labs, Canada
Petr Kukučka, Recetox, Czech Republic