Embed Size (px)
Citation preview
Curing a Sick Healthcare System?
Startups and venture capital in the US digital health sector
Ian Hathaway
July 2015
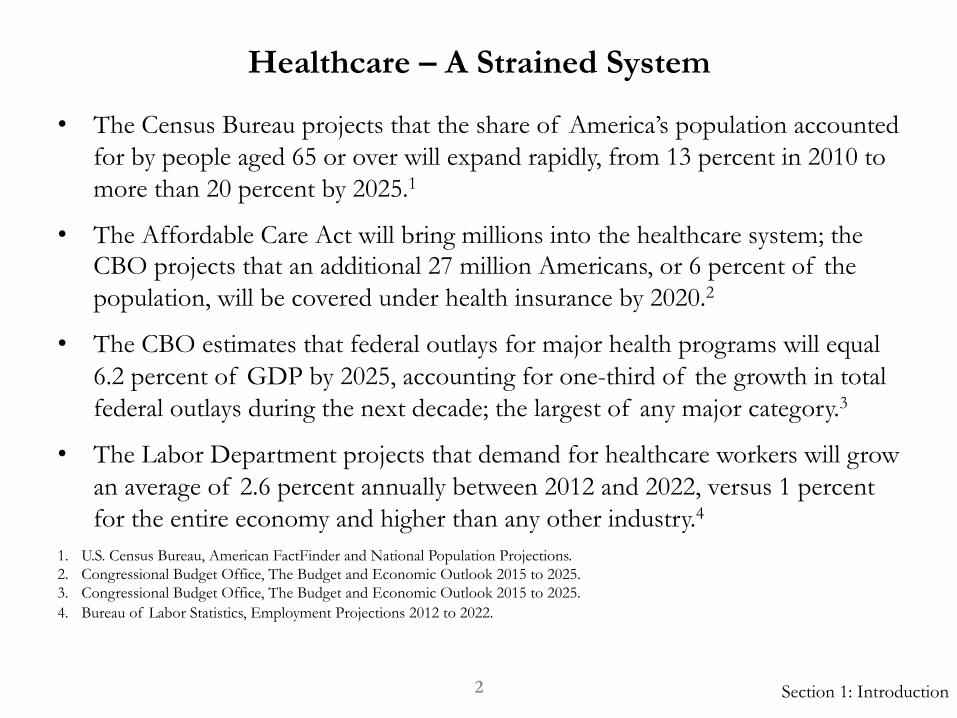
• The Census Bureau projects that the share of America’s population accounted for by people aged 65 or over will expand rapidly, from 13 percent in 2010 to more than 20 percent by 2025.1
• The Affordable Care Act will bring millions into the healthcare system; the CBO projects that an additional 27 million Americans, or 6 percent of the population, will be covered under health insurance by 2020.2
• The CBO estimates that federal outlays for major health programs will equal 6.2 percent of GDP by 2025, accounting for one-third of the growth in total federal outlays during the next decade; the largest of any major category.3
• The Labor Department projects that demand for healthcare workers will grow an average of 2.6 percent annually between 2012 and 2022, versus 1 percent for the entire economy and higher than any other industry.4
Section 1: Introduction
1. U.S. Census Bureau, American FactFinder and National Population Projections. 2. Congressional Budget Office, The Budget and Economic Outlook 2015 to 2025. 3. Congressional Budget Office, The Budget and Economic Outlook 2015 to 2025. 4. Bureau of Labor Statistics, Employment Projections 2012 to 2022.
Healthcare – A Strained System
2
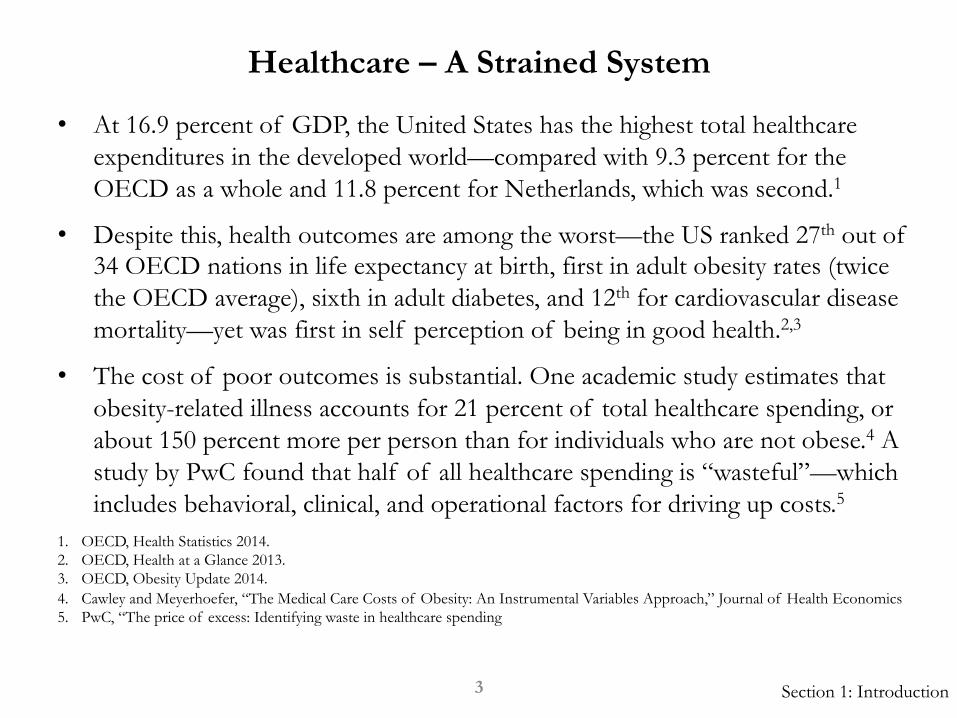
• At 16.9 percent of GDP, the United States has the highest total healthcare expenditures in the developed world—compared with 9.3 percent for the OECD as a whole and 11.8 percent for Netherlands, which was second.1
• Despite this, health outcomes are among the worst—the US ranked 27th out of 34 OECD nations in life expectancy at birth, first in adult obesity rates (twice the OECD average), sixth in adult diabetes, and 12th for cardiovascular disease mortality—yet was first in self perception of being in good health.2,3
• The cost of poor outcomes is substantial. One academic study estimates that obesity-related illness accounts for 21 percent of total healthcare spending, or about 150 percent more per person than for individuals who are not obese.4 A study by PwC found that half of all healthcare spending is “wasteful”—which includes behavioral, clinical, and operational factors for driving up costs.5
1. OECD, Health Statistics 2014. 2. OECD, Health at a Glance 2013. 3. OECD, Obesity Update 2014. 4. Cawley and Meyerhoefer, “The Medical Care Costs of Obesity: An Instrumental Variables Approach,” Journal of Health Economics 5. PwC, “The price of excess: Identifying waste in healthcare spending
Healthcare – A Strained System
Section 1: Introduction 3
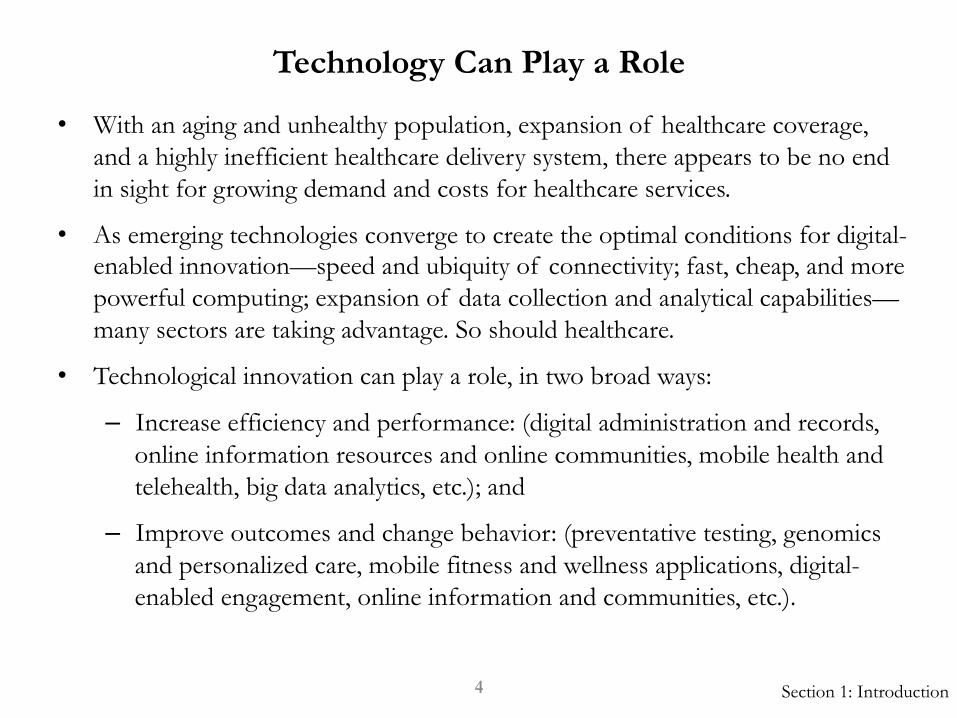
• With an aging and unhealthy population, expansion of healthcare coverage, and a highly inefficient healthcare delivery system, there appears to be no end in sight for growing demand and costs for healthcare services.
• As emerging technologies converge to create the optimal conditions for digital-enabled innovation—speed and ubiquity of connectivity; fast, cheap, and more powerful computing; expansion of data collection and analytical capabilities—many sectors are taking advantage. So should healthcare.
• Technological innovation can play a role, in two broad ways:
– Increase efficiency and performance: (digital administration and records, online information resources and online communities, mobile health and telehealth, big data analytics, etc.); and
– Improve outcomes and change behavior: (preventative testing, genomics and personalized care, mobile fitness and wellness applications, digital-enabled engagement, online information and communities, etc.).
Technology Can Play a Role
Section 1: Introduction 4
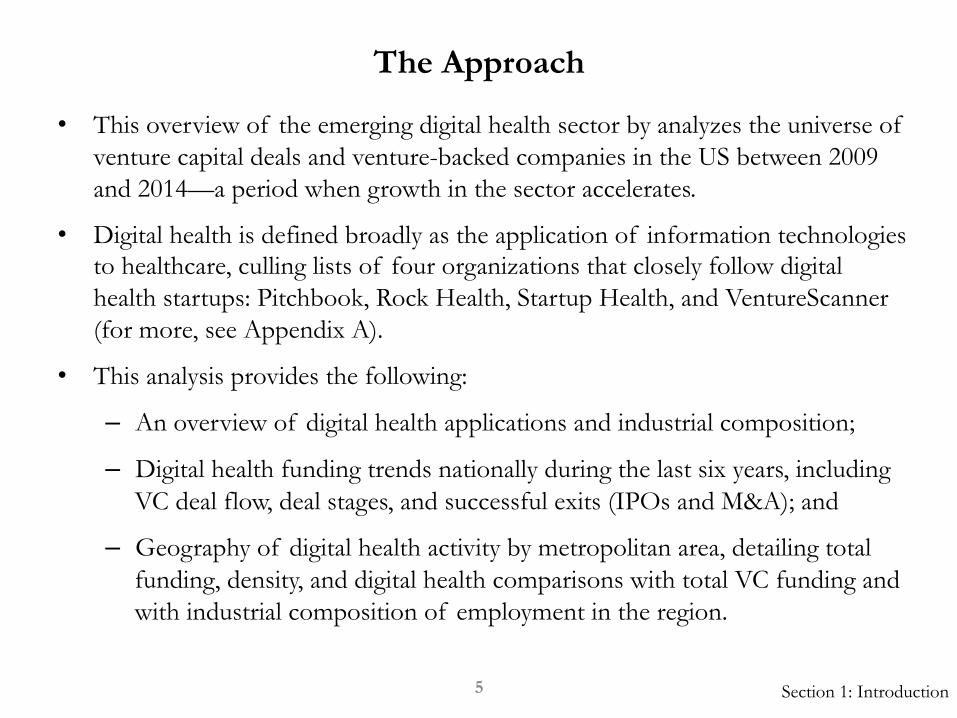
• This overview of the emerging digital health sector by analyzes the universe of venture capital deals and venture-backed companies in the US between 2009 and 2014—a period when growth in the sector accelerates.
• Digital health is defined broadly as the application of information technologies to healthcare, culling lists of four organizations that closely follow digital health startups: Pitchbook, Rock Health, Startup Health, and VentureScanner (for more, see Appendix A).
• This analysis provides the following:
– An overview of digital health applications and industrial composition;
– Digital health funding trends nationally during the last six years, including VC deal flow, deal stages, and successful exits (IPOs and M&A); and
– Geography of digital health activity by metropolitan area, detailing total funding, density, and digital health comparisons with total VC funding and with industrial composition of employment in the region.
The Approach
Section 1: Introduction 5
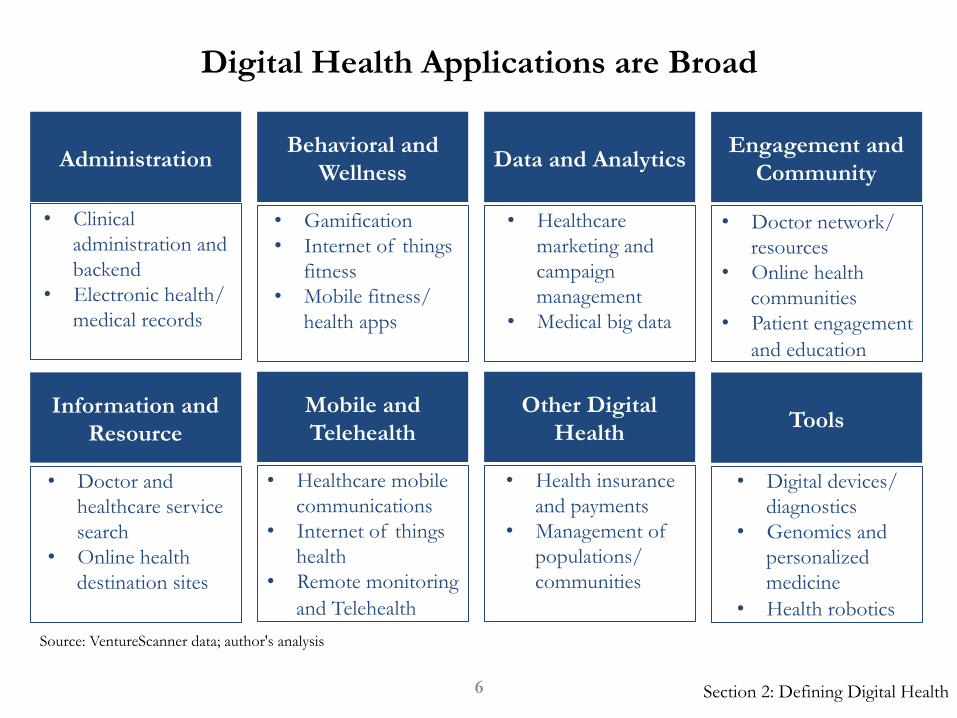
Digital Health Applications are Broad
Administration Behavioral and
Wellness Data and Analytics Engagement and
Community
• Clinical administration and backend
• Electronic health/medical records
• Gamification • Internet of things
fitness • Mobile fitness/
health apps
• Healthcare marketing and campaign management
• Medical big data
• Doctor network/ resources
• Online health communities
• Patient engagement and education
Information and Resource
• Doctor and healthcare service search
• Online health destination sites
Mobile and Telehealth
• Healthcare mobile communications
• Internet of things health
• Remote monitoring and Telehealth
Tools
• Digital devices/ diagnostics
• Genomics and personalized medicine
• Health robotics
Other Digital Health
• Health insurance and payments
• Management of populations/ communities
Source: VentureScanner data; author's analysis
Section 2: Defining Digital Health 6
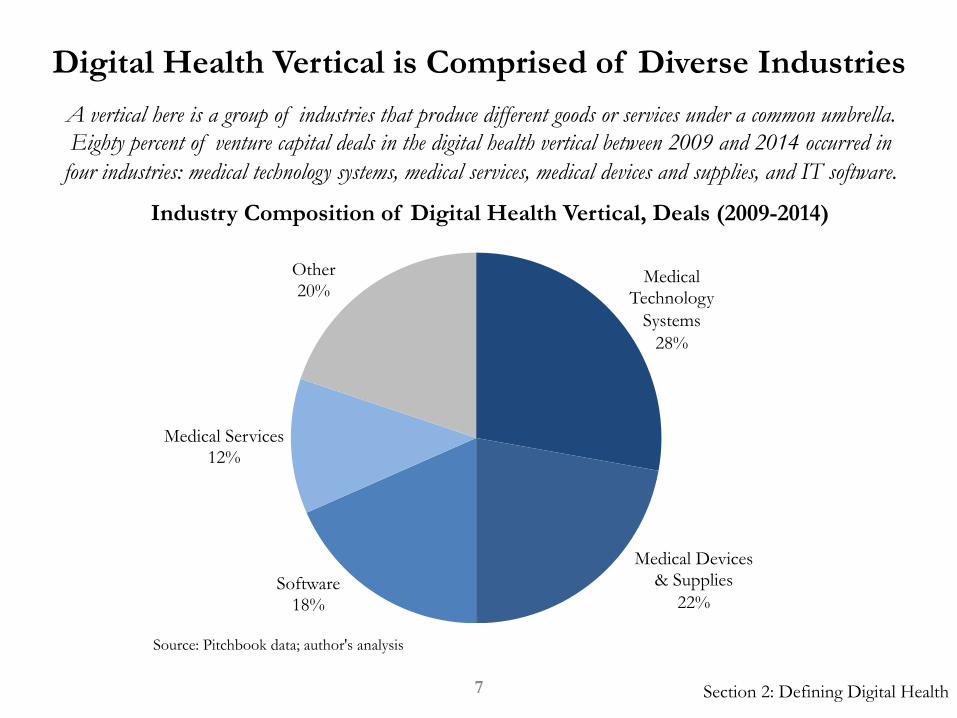
Digital Health Vertical is Comprised of Diverse Industries
Source: Pitchbook data; author's analysis
A vertical here is a group of industries that produce different goods or services under a common umbrella. Eighty percent of venture capital deals in the digital health vertical between 2009 and 2014 occurred in
four industries: medical technology systems, medical services, medical devices and supplies, and IT software.
Industry Composition of Digital Health Vertical, Deals (2009-2014)
Medical Technology
Systems 28%
Medical Devices & Supplies
22% Software
18%
Medical Services 12%
Other 20%
Section 2: Defining Digital Health 7
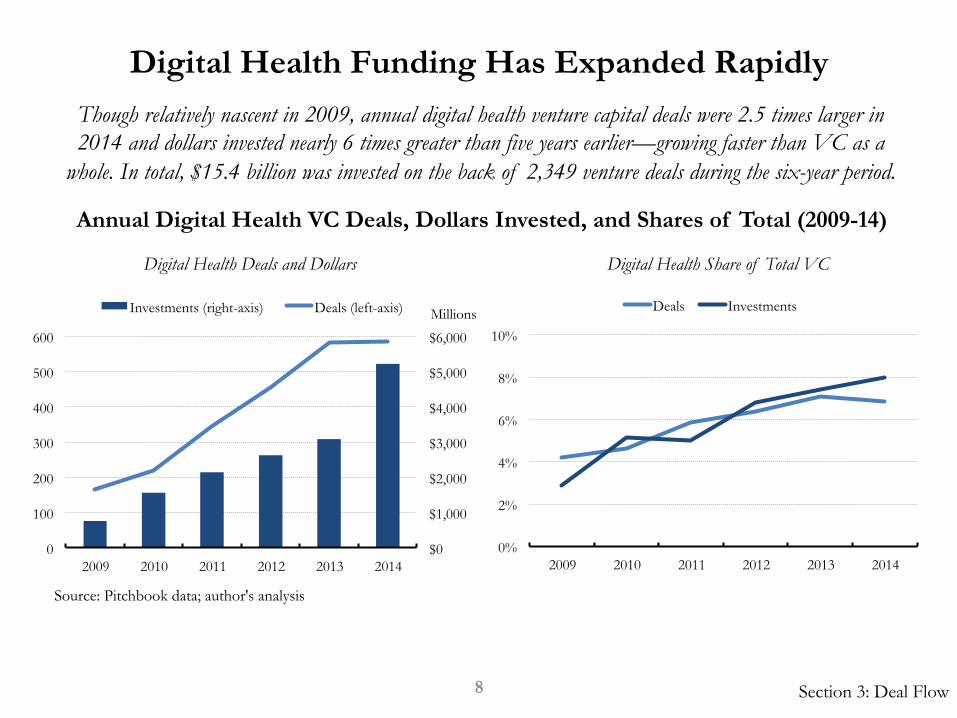
Digital Health Funding Has Expanded Rapidly
Source: Pitchbook data; author's analysis
Though relatively nascent in 2009, annual digital health venture capital deals were 2.5 times larger in 2014 and dollars invested nearly 6 times greater than five years earlier—growing faster than VC as a
whole. In total, $15.4 billion was invested on the back of 2,349 venture deals during the six-year period.
Annual Digital Health VC Deals, Dollars Invested, and Shares of Total (2009-14)
Digital Health Deals and Dollars Digital Health Share of Total VC
$0
$1,000
$2,000
$3,000
$4,000
$5,000
$6,000
0
100
200
300
400
500
600
2009 2010 2011 2012 2013 2014
Investments (right-axis) Deals (left-axis) Millions
0%
2%
4%
6%
8%
10%
2009 2010 2011 2012 2013 2014
Deals Investments
Section 3: Deal Flow 8
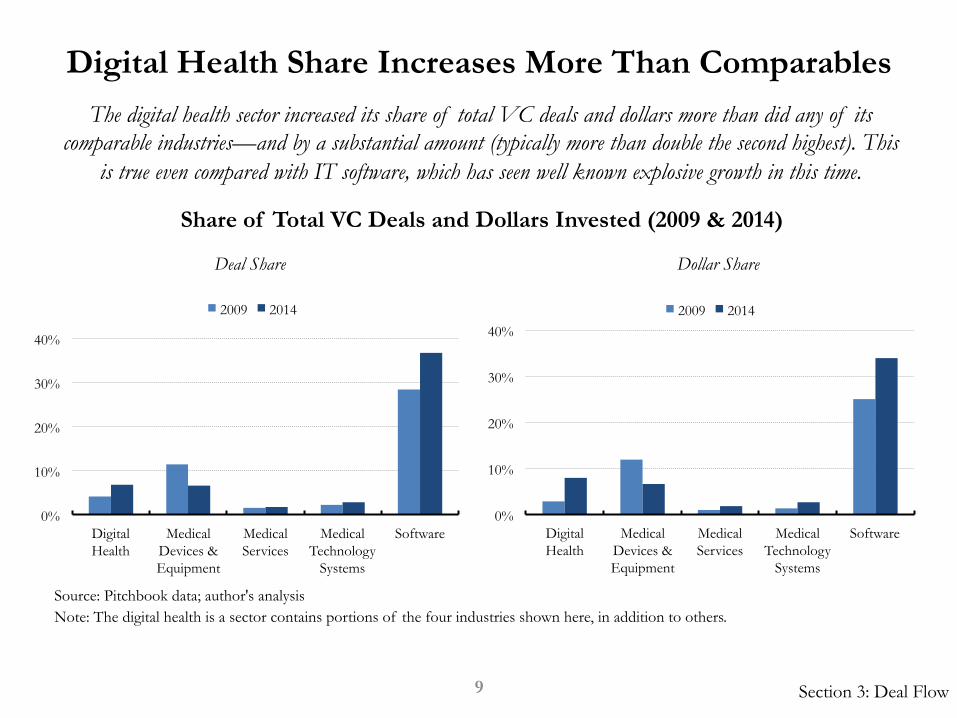
Digital Health Share Increases More Than Comparables
Source: Pitchbook data; author's analysis
The digital health sector increased its share of total VC deals and dollars more than did any of its comparable industries—and by a substantial amount (typically more than double the second highest). This
is true even compared with IT software, which has seen well known explosive growth in this time.
Share of Total VC Deals and Dollars Invested (2009 & 2014)
0%
10%
20%
30%
40%
Digital Health
Medical Devices & Equipment
Medical Services
Medical Technology
Systems
Software
2009 2014
0%
10%
20%
30%
40%
Digital Health
Medical Devices & Equipment
Medical Services
Medical Technology
Systems
Software
2009 2014
Deal Share Dollar Share
Note: The digital health is a sector contains portions of the four industries shown here, in addition to others.
Section 3: Deal Flow 9
Digital Health Deals Move to Later Stages
Source: Pitchbook data; author's analysis
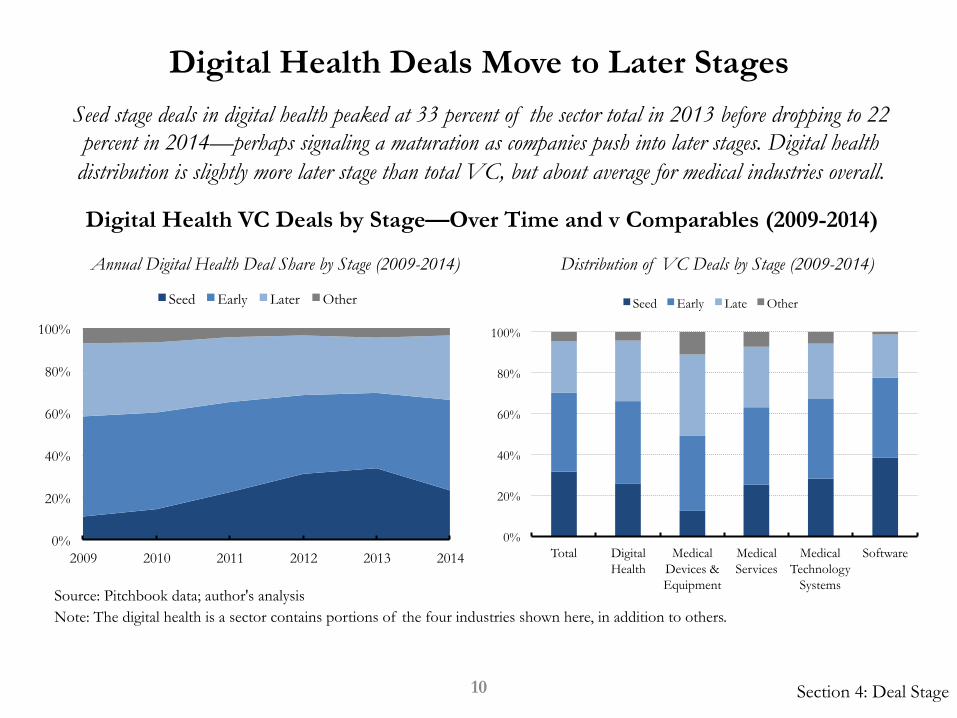
Seed stage deals in digital health peaked at 33 percent of the sector total in 2013 before dropping to 22 percent in 2014—perhaps signaling a maturation as companies push into later stages. Digital health
distribution is slightly more later stage than total VC, but about average for medical industries overall.
Digital Health VC Deals by Stage—Over Time and v Comparables (2009-2014)
Annual Digital Health Deal Share by Stage (2009-2014) Distribution of VC Deals by Stage (2009-2014)
0%
20%
40%
60%
80%
100%
2009 2010 2011 2012 2013 2014
Seed Early Later Other
0%
20%
40%
60%
80%
100%
Total Digital Health
Medical Devices & Equipment
Medical Services
Medical Technology
Systems
Software
Seed Early Late Other
Section 4: Deal Stage 10
Note: The digital health is a sector contains portions of the four industries shown here, in addition to others.
Diverse Digital Health Investors; Leaders with Health Focus
Source: Pitchbook data; author's analysis
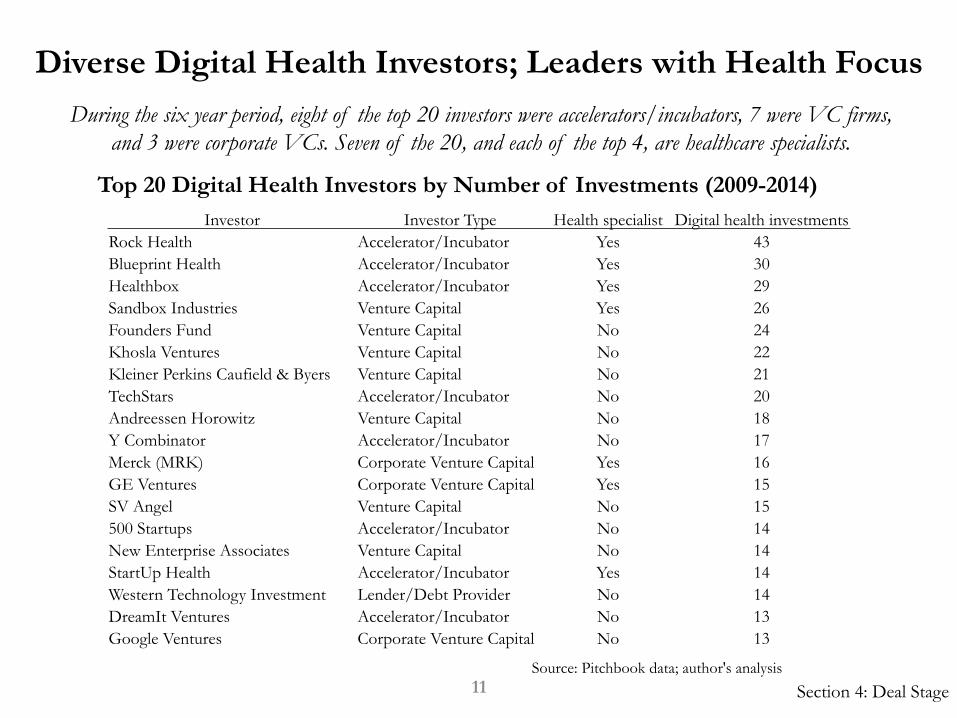
During the six year period, eight of the top 20 investors were accelerators/incubators, 7 were VC firms, and 3 were corporate VCs. Seven of the 20, and each of the top 4, are healthcare specialists.
Top 20 Digital Health Investors by Number of Investments (2009-2014)
11 Section 4: Deal Stage
Investor Investor Type Health specialist Digital health investments Rock Health Accelerator/Incubator Yes 43 Blueprint Health Accelerator/Incubator Yes 30 Healthbox Accelerator/Incubator Yes 29 Sandbox Industries Venture Capital Yes 26 Founders Fund Venture Capital No 24 Khosla Ventures Venture Capital No 22 Kleiner Perkins Caufield & Byers Venture Capital No 21 TechStars Accelerator/Incubator No 20 Andreessen Horowitz Venture Capital No 18 Y Combinator Accelerator/Incubator No 17 Merck (MRK) Corporate Venture Capital Yes 16 GE Ventures Corporate Venture Capital Yes 15 SV Angel Venture Capital No 15 500 Startups Accelerator/Incubator No 14 New Enterprise Associates Venture Capital No 14 StartUp Health Accelerator/Incubator Yes 14 Western Technology Investment Lender/Debt Provider No 14 DreamIt Ventures Accelerator/Incubator No 13 Google Ventures Corporate Venture Capital No 13
In 2014, Shift to Traditional VC, Away from Health Specialists
Source: Pitchbook data; author's analysis
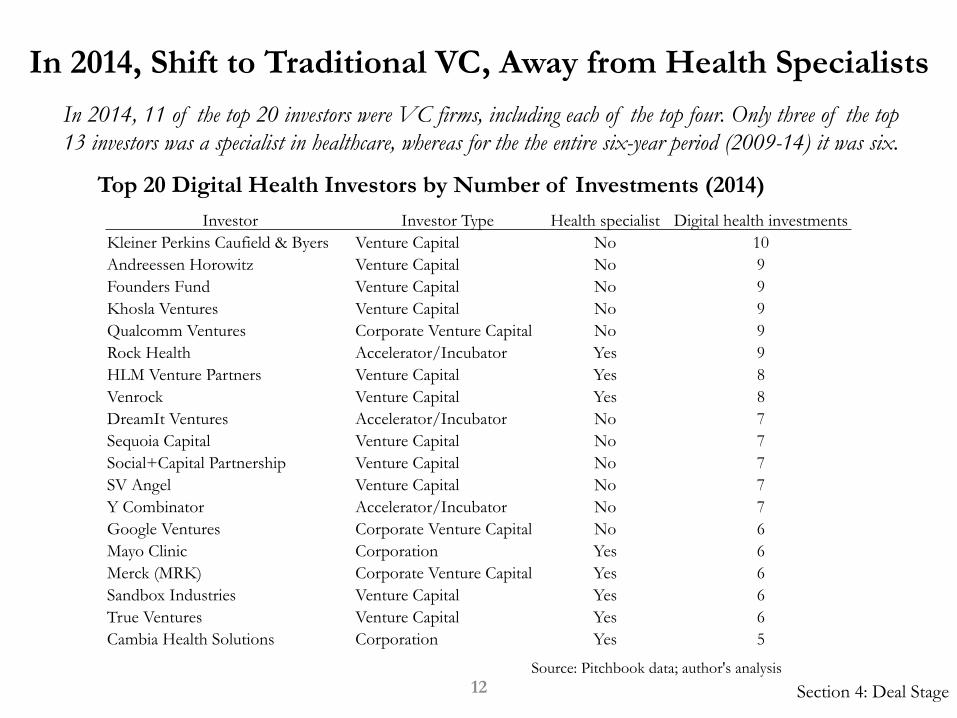
In 2014, 11 of the top 20 investors were VC firms, including each of the top four. Only three of the top 13 investors was a specialist in healthcare, whereas for the the entire six-year period (2009-14) it was six.
Top 20 Digital Health Investors by Number of Investments (2014)
12 Section 4: Deal Stage
Investor Investor Type Health specialist Digital health investments Kleiner Perkins Caufield & Byers Venture Capital No 10 Andreessen Horowitz Venture Capital No 9 Founders Fund Venture Capital No 9 Khosla Ventures Venture Capital No 9 Qualcomm Ventures Corporate Venture Capital No 9 Rock Health Accelerator/Incubator Yes 9 HLM Venture Partners Venture Capital Yes 8 Venrock Venture Capital Yes 8 DreamIt Ventures Accelerator/Incubator No 7 Sequoia Capital Venture Capital No 7 Social+Capital Partnership Venture Capital No 7 SV Angel Venture Capital No 7 Y Combinator Accelerator/Incubator No 7 Google Ventures Corporate Venture Capital No 6 Mayo Clinic Corporation Yes 6 Merck (MRK) Corporate Venture Capital Yes 6 Sandbox Industries Venture Capital Yes 6 True Ventures Venture Capital Yes 6 Cambia Health Solutions Corporation Yes 5
Digital Health Shows Rapid M&A and IPO Growth
Source: Pitchbook data; author's analysis
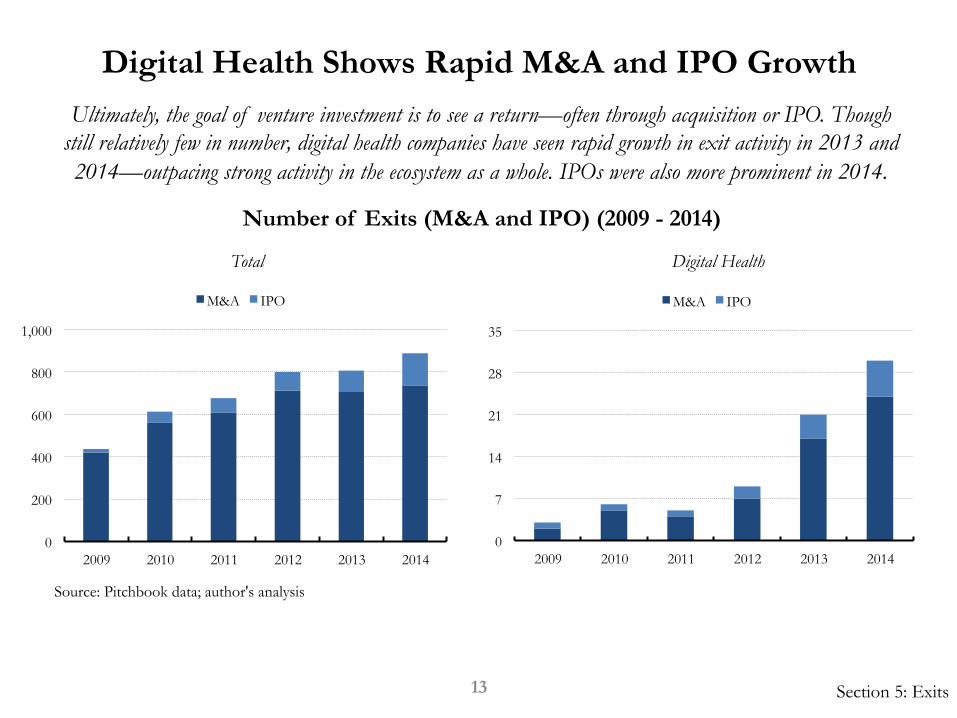
Ultimately, the goal of venture investment is to see a return—often through acquisition or IPO. Though still relatively few in number, digital health companies have seen rapid growth in exit activity in 2013 and 2014—outpacing strong activity in the ecosystem as a whole. IPOs were also more prominent in 2014.
Number of Exits (M&A and IPO) (2009 - 2014)
Total Digital Health
0
200
400
600
800
1,000
2009 2010 2011 2012 2013 2014
M&A IPO
Section 5: Exits 13
0
7
14
21
28
35
2009 2010 2011 2012 2013 2014
M&A IPO
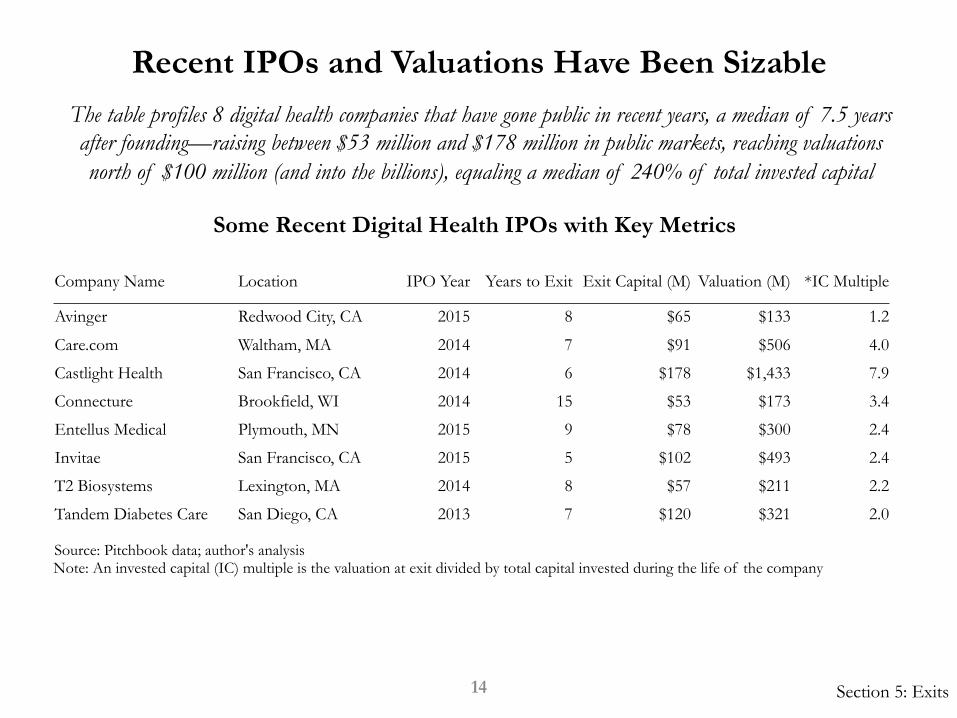
Recent IPOs and Valuations Have Been Sizable
14 Section 5: Exits
The table profiles 8 digital health companies that have gone public in recent years, a median of 7.5 years after founding—raising between $53 million and $178 million in public markets, reaching valuations north of $100 million (and into the billions), equaling a median of 240% of total invested capital
Company Name Location IPO Year Years to Exit Exit Capital (M) Valuation (M) *IC Multiple
Avinger Redwood City, CA 2015 8 $65 $133 1.2
Care.com Waltham, MA 2014 7 $91 $506 4.0
Castlight Health San Francisco, CA 2014 6 $178 $1,433 7.9
Connecture Brookfield, WI 2014 15 $53 $173 3.4
Entellus Medical Plymouth, MN 2015 9 $78 $300 2.4
Invitae San Francisco, CA 2015 5 $102 $493 2.4
T2 Biosystems Lexington, MA 2014 8 $57 $211 2.2
Tandem Diabetes Care San Diego, CA 2013 7 $120 $321 2.0
Some Recent Digital Health IPOs with Key Metrics
Source: Pitchbook data; author's analysis Note: An invested capital (IC) multiple is the valuation at exit divided by total capital invested during the life of the company
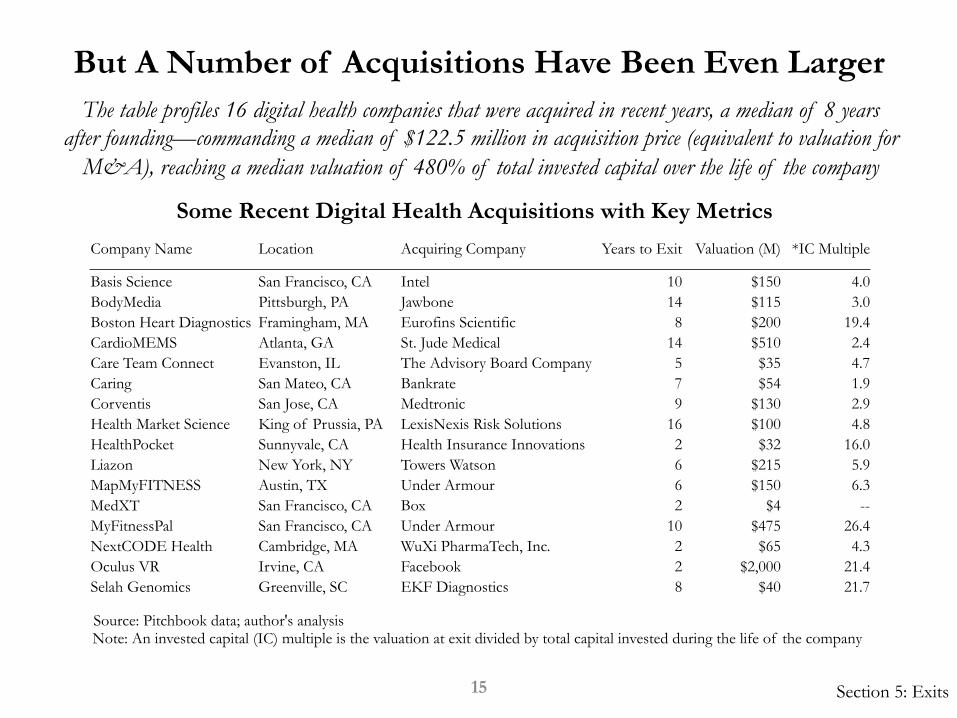
But A Number of Acquisitions Have Been Even Larger
Source: Pitchbook data; author's analysis
15 Section 5: Exits
Note: An invested capital (IC) multiple is the valuation at exit divided by total capital invested during the life of the company
The table profiles 16 digital health companies that were acquired in recent years, a median of 8 years after founding—commanding a median of $122.5 million in acquisition price (equivalent to valuation for
M&A), reaching a median valuation of 480% of total invested capital over the life of the company
Some Recent Digital Health Acquisitions with Key Metrics
Company Name Location Acquiring Company Years to Exit Valuation (M) *IC Multiple
Basis Science San Francisco, CA Intel 10 $150 4.0 BodyMedia Pittsburgh, PA Jawbone 14 $115 3.0 Boston Heart Diagnostics Framingham, MA Eurofins Scientific 8 $200 19.4 CardioMEMS Atlanta, GA St. Jude Medical 14 $510 2.4 Care Team Connect Evanston, IL The Advisory Board Company 5 $35 4.7 Caring San Mateo, CA Bankrate 7 $54 1.9 Corventis San Jose, CA Medtronic 9 $130 2.9 Health Market Science King of Prussia, PA LexisNexis Risk Solutions 16 $100 4.8 HealthPocket Sunnyvale, CA Health Insurance Innovations 2 $32 16.0 Liazon New York, NY Towers Watson 6 $215 5.9 MapMyFITNESS Austin, TX Under Armour 6 $150 6.3 MedXT San Francisco, CA Box 2 $4 -- MyFitnessPal San Francisco, CA Under Armour 10 $475 26.4 NextCODE Health Cambridge, MA WuXi PharmaTech, Inc. 2 $65 4.3 Oculus VR Irvine, CA Facebook 2 $2,000 21.4 Selah Genomics Greenville, SC EKF Diagnostics 8 $40 21.7
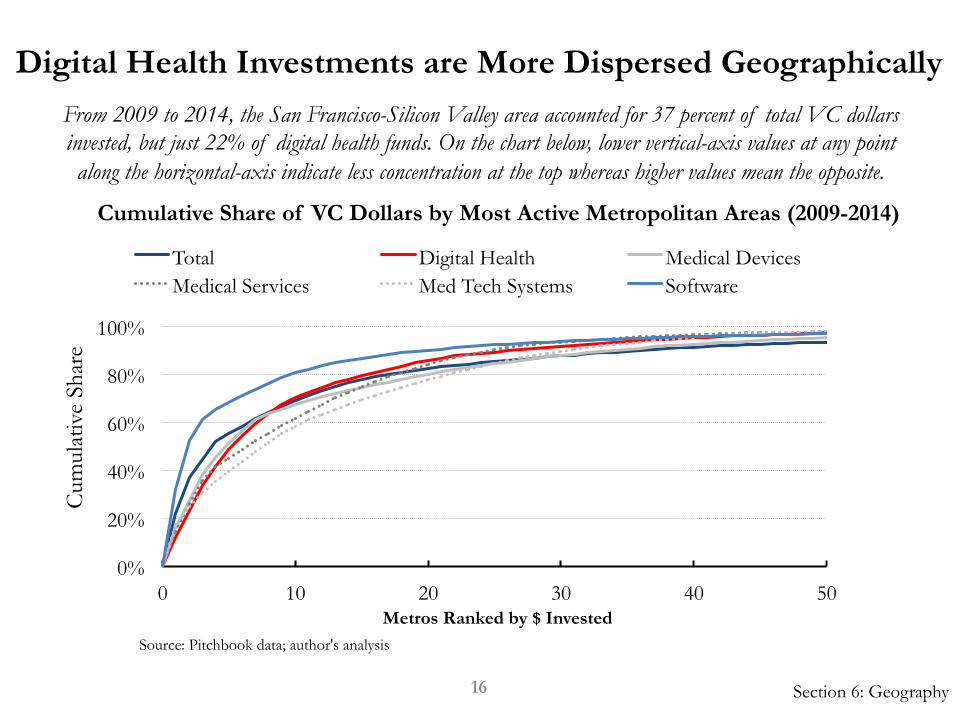
Digital Health Investments are More Dispersed Geographically
Source: Pitchbook data; author's analysis
From 2009 to 2014, the San Francisco-Silicon Valley area accounted for 37 percent of total VC dollars invested, but just 22% of digital health funds. On the chart below, lower vertical-axis values at any point along the horizontal-axis indicate less concentration at the top whereas higher values mean the opposite.
Cumulative Share of VC Dollars by Most Active Metropolitan Areas (2009-2014)
Section 6: Geography 16
Metros Ranked by $ Invested
0%
20%
40%
60%
80%
100%
0 10 20 30 40 50
Total Digital Health Medical Devices Medical Services Med Tech Systems Software
Cum
ulat
ive
Shar
e
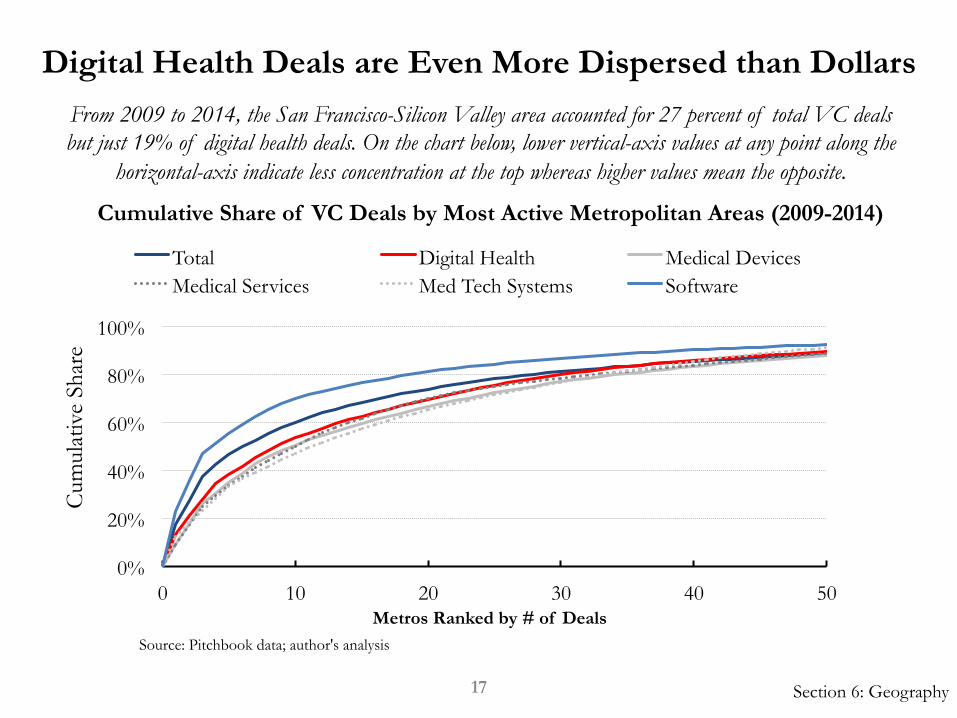
Digital Health Deals are Even More Dispersed than Dollars
Source: Pitchbook data; author's analysis
From 2009 to 2014, the San Francisco-Silicon Valley area accounted for 27 percent of total VC deals but just 19% of digital health deals. On the chart below, lower vertical-axis values at any point along the
horizontal-axis indicate less concentration at the top whereas higher values mean the opposite.
Cumulative Share of VC Deals by Most Active Metropolitan Areas (2009-2014)
Section 6: Geography 17
Metros Ranked by # of Deals
0%
20%
40%
60%
80%
100%
0 10 20 30 40 50
Total Digital Health Medical Devices Medical Services Med Tech Systems Software
Cum
ulat
ive
Shar
e
Top Digital Health Metros Overlap with Top Total VC Metros
Source: Pitchbook data; author's analysis
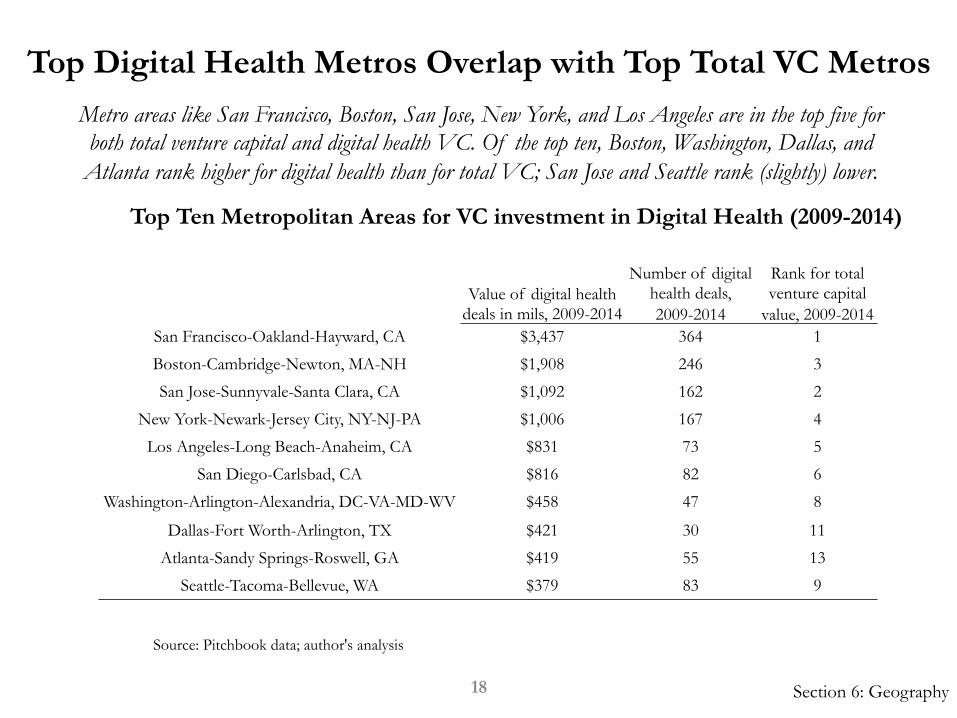
Metro areas like San Francisco, Boston, San Jose, New York, and Los Angeles are in the top five for both total venture capital and digital health VC. Of the top ten, Boston, Washington, Dallas, and Atlanta rank higher for digital health than for total VC; San Jose and Seattle rank (slightly) lower.
Top Ten Metropolitan Areas for VC investment in Digital Health (2009-2014)
Value of digital health deals in mils, 2009-2014
Number of digital health deals, 2009-2014
Rank for total venture capital
value, 2009-2014 San Francisco-Oakland-Hayward, CA $3,437 364 1
Boston-Cambridge-Newton, MA-NH $1,908 246 3
San Jose-Sunnyvale-Santa Clara, CA $1,092 162 2
New York-Newark-Jersey City, NY-NJ-PA $1,006 167 4
Los Angeles-Long Beach-Anaheim, CA $831 73 5
San Diego-Carlsbad, CA $816 82 6
Washington-Arlington-Alexandria, DC-VA-MD-WV $458 47 8
Dallas-Fort Worth-Arlington, TX $421 30 11
Atlanta-Sandy Springs-Roswell, GA $419 55 13
Seattle-Tacoma-Bellevue, WA $379 83 9
Section 6: Geography 18
Top Digital Health Metros Overlap with Top Total VC Metros
Source: Pitchbook, Moody’s Analytics data; author's analysis
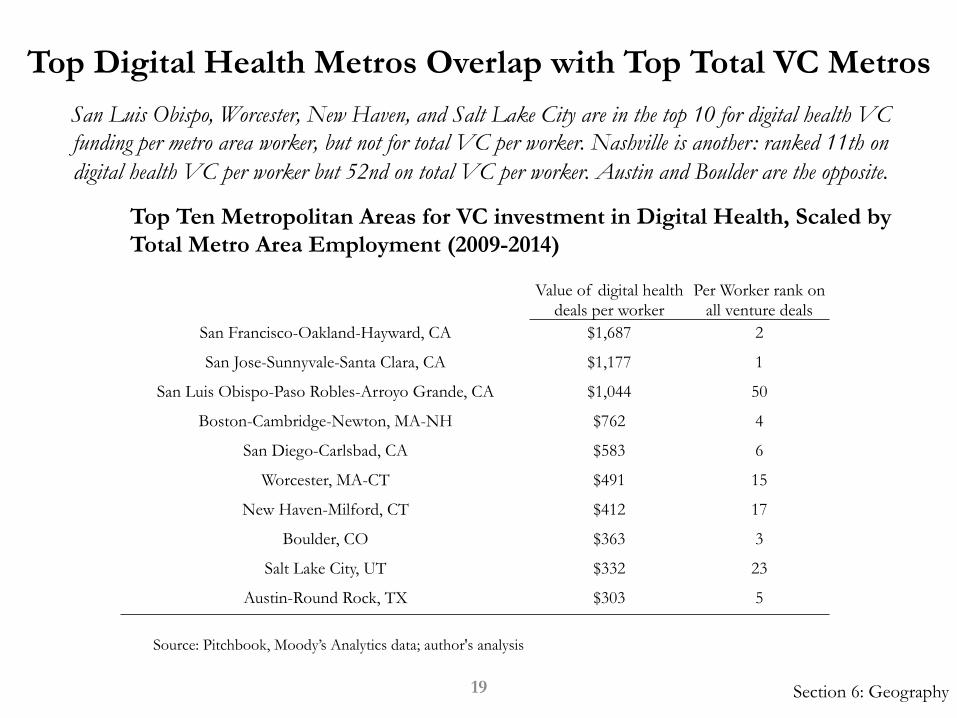
San Luis Obispo, Worcester, New Haven, and Salt Lake City are in the top 10 for digital health VC funding per metro area worker, but not for total VC per worker. Nashville is another: ranked 11th on digital health VC per worker but 52nd on total VC per worker. Austin and Boulder are the opposite.
Top Ten Metropolitan Areas for VC investment in Digital Health, Scaled by Total Metro Area Employment (2009-2014)
Value of digital health deals per worker
Per Worker rank on all venture deals
San Francisco-Oakland-Hayward, CA $1,687 2
San Jose-Sunnyvale-Santa Clara, CA $1,177 1
San Luis Obispo-Paso Robles-Arroyo Grande, CA $1,044 50
Boston-Cambridge-Newton, MA-NH $762 4
San Diego-Carlsbad, CA $583 6
Worcester, MA-CT $491 15
New Haven-Milford, CT $412 17
Boulder, CO $363 3
Salt Lake City, UT $332 23
Austin-Round Rock, TX $303 5
Section 6: Geography 19
Some Metro Areas Are Highly Concentrated in Digital Health
Source: Pitchbook data; author's analysis
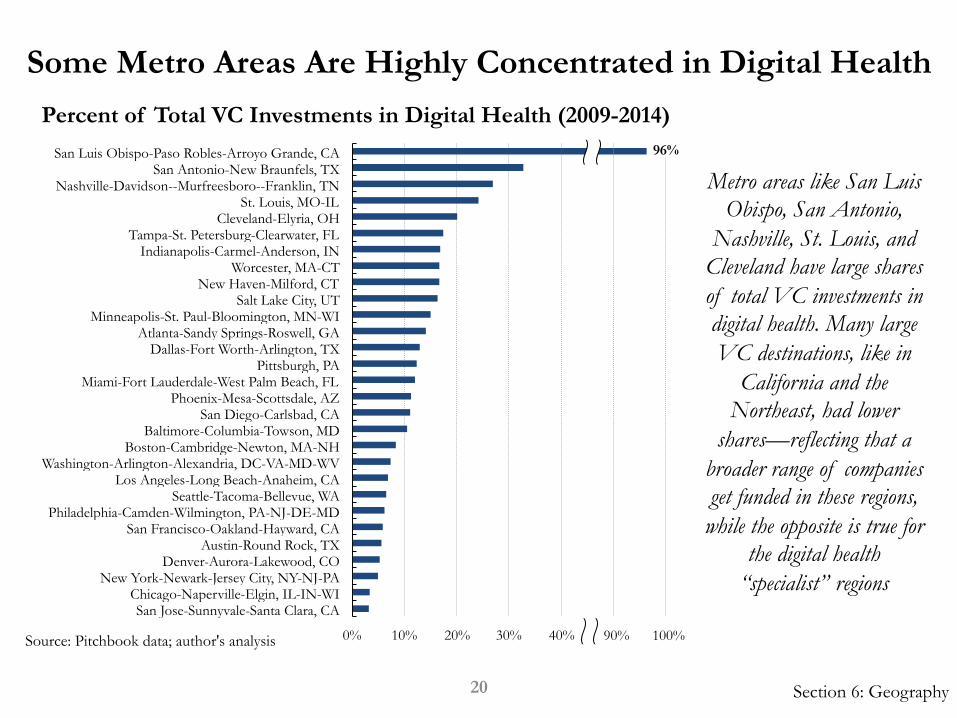
Metro areas like San Luis Obispo, San Antonio,
Nashville, St. Louis, and Cleveland have large shares of total VC investments in digital health. Many large VC destinations, like in
California and the Northeast, had lower
shares—reflecting that a broader range of companies get funded in these regions, while the opposite is true for
the digital health “specialist” regions
Percent of Total VC Investments in Digital Health (2009-2014)
0% 10% 20% 30% 40% 50% 60%
San Jose-Sunnyvale-Santa Clara, CA Chicago-Naperville-Elgin, IL-IN-WI
New York-Newark-Jersey City, NY-NJ-PA Denver-Aurora-Lakewood, CO
Austin-Round Rock, TX San Francisco-Oakland-Hayward, CA
Philadelphia-Camden-Wilmington, PA-NJ-DE-MD Seattle-Tacoma-Bellevue, WA
Los Angeles-Long Beach-Anaheim, CA Washington-Arlington-Alexandria, DC-VA-MD-WV
Boston-Cambridge-Newton, MA-NH Baltimore-Columbia-Towson, MD
San Diego-Carlsbad, CA Phoenix-Mesa-Scottsdale, AZ
Miami-Fort Lauderdale-West Palm Beach, FL Pittsburgh, PA
Dallas-Fort Worth-Arlington, TX Atlanta-Sandy Springs-Roswell, GA
Minneapolis-St. Paul-Bloomington, MN-WI Salt Lake City, UT
New Haven-Milford, CT Worcester, MA-CT
Indianapolis-Carmel-Anderson, IN Tampa-St. Petersburg-Clearwater, FL
Cleveland-Elyria, OH St. Louis, MO-IL
Nashville-Davidson--Murfreesboro--Franklin, TN San Antonio-New Braunfels, TX
San Luis Obispo-Paso Robles-Arroyo Grande, CA 96%
90% 100%
Section 6: Geography 20
• Venture capital activity in digital health has increased substantially in recent years, as this sector vertical has increased its share of total deals and dollars invested in the United States—at a time when total VC has grown rapidly.
• Digital health companies began pushing into later stages in 2014, driven by a shift towards traditional VC firms from healthcare or early-stage specialists.
• Exit activity—IPOs and M&A—has also grown significantly in recent years, with four times the activity in 2014 as compared with 2012. Despite a number of health IPOs during this period, typical valuations and invested capital multiples (returns on investment) have been higher for M&A deals.
• The digital health ecosystem is dispersed geographically throughout the United States, with less concentration of deals and dollars invested among the very top metropolitan areas for venture capital.
• While there is a high correlation between metro areas receiving the most digital and total VC funding, when scaled by the size of the local workforce or as a share of total within-region funding, a different list of areas emerges.
Conclusion
Section 7: Conclusion 21
• This list of digital health startups was culled from lists of four organizations that track companies in the digital health sector: Pitchbook, Rock Health, Startup Health, and VentureScanner. The first of these is also a data company that tracks venture capital deals and venture-backed companies.
• These four lists were merged together and then into the Pitchbook database, where the identity of each company was confirmed—either automatically or in many cases, manually. This was necessary because the names of early-stage companies frequently change, as does the ownership structure—businesses are regularly acquired or merged.
• This list was then reduced to include only companies headquartered in the United States, and those that received some venture funding between 2009 and 2014—either from venture capital firms, corporate venture investors, or other professional venture investors, such as angels or accelerators. This analysis culminated in a list of 1,022 digital health startups.
Appendix A: Defining Digital Health
Section 8: Appendices 22
• The author thanks the following people for various assistance with this report: Devin Christiansen, Nader Ghaffari, Nicole Kinsey, Alex Lee, Brian Lee, T. A. McCann, Christine Rasmussen, Jonathan Rothwell, and Aaron Sandoski
Appendix B: Acknowledgements
Section 8: Appendices 23

@IanHathaway