Embed Size (px)
Citation preview

Are big brands getting the most from YouTube? ��A study of how major brands in the UK are using the�video-based social network.��#UKYouTubeSurvey15 �������January 2015�

#UKYouTubeSurvey15
#Executive summary�Why should I read this report? Do you have an interest in how your organisa1on uses video? This report inves1gates how major brands in the UK are using YouTube, compares different sectors, highlights best prac1ces and draws conclusions on opportuni1es for the future.
What we found Our hypothesis holds true; against our criteria the 35 brands we studied scored an average of 20.4 points out of a possible 48. We found the majority of brands have a significant opportunity to improve their aLen1on to detail and level of consistency to significantly improve the audience experience. We iden1fied three core areas for brands to focus on: housekeeping of meta-‐data, more use of interac;ve features and taking a more programma;c approach. Vodafone, Money Supermarket and Peugeot took the top three places in our rankings, whilst from a sector perspec1ve it was the telco’s that performed best (three of the top ten spots) and the finance brands who did less well, filling three of the boLom eleven posi1ons.
Page 2 �
Top 5 brands in our 2015 YouTube Survey
The hypothesis Big brands aren’t using YouTube to its full poten1al. The approach We avoided the problem that many “social media brand surveys” experience, by using criteria which aren’t influenced by media spend. Avoiding metrics such as video views enabled us to focus on how brands are using YouTube -‐ for example how are channels setup and are the available features being used effec1vely?
Vodafone�
Money Supermarket �
Peugeot �
Aldi�
O2 �
1 �
2 �
3 �
4 �
5 �

#UKYouTubeSurvey15
#Contents �Where video’s at Page 4 The approach Page 5 The findings -‐ In summary Page 6 The findings -‐ In numbers Page 7 The findings -‐ How the sectors compared Page 8 The findings -‐ Brand rankings Page 9 Best prac1ce in ac1on Page 11 Conclusions Page 14 More informa1on Page 16 Appendix Page 17
Page 3 �
#UKYouTubeSurvey15
#Where video’s at �As a form of “branded content”, video con1nues to grow rapidly in the UK with more than a third of the popula1on watching at least one online video each week1. And with YouTube running a major through-‐the-‐line marke1ng campaign in October 2014 to highlight leading content creators such as The Slow Mo Guys and Zoella, it’s steadily entered the mass adop1on stage. Not only is YouTube an effec1ve way of hos1ng and syndica1ng video, but its integra1on into Google search means its importance as a driver of website traffic has never been greater.
With this hypothesis we surveyed 35 major brands ac1ve in the UK to find out how they were performing on YouTube.
1 Guardian: hLp://bit.ly/1IUIq73 2 YouTube: hLps://www.youtube.com/yt/press/en-‐GB/sta1s1cs.html
100 hours of video are uploaded to YouTube…
… every minute
However, while more than one billion unique users are visi1ng the plahorm each month and 100 hours of video are uploaded every minute2, we no1ced many large brands struggling to get to grips with the granddaddy of social video networks.
Whether failing to structure their channel effec1vely or delivering a disjointed customer experience, we wondered was this limited to specific sectors, or was it a wider problem experienced by large brands?
Page 4 �

#UKYouTubeSurvey15
Third party studies into brands’ use of social networks are limited to the data that’s publically available. This presents a challenge, because this data is oien skewed by the amount of media budget available -‐ for example when a brand purchases video views. Plus, the data which reveals really juicy insights (e.g. video comple1on rates) can only be seen by the channel administrator. Therefore we looked at factors which aren’t affected by media spend, but demonstrate how widely a brand is using the features and environment of YouTube. To minimise subjec1ve bias, we excluded the quality of video produc1on in our assessment, so a truly awful presenter or tedious soundtrack wouldn’t count against them! The study was conducted in the first week of December 2014, more detail on the approach is contained in the Appendix. Our analysis was broken down into three areas:
#The approach�
1. Channel setup
Were basic channel features being used
effec1vely?
2. In-‐video approach
Were in-‐video op1ons used to enhance the viewer experience?
3. Delivery
Was the channel treated as more than
just a video repository?
Page 5 �

#UKYouTubeSurvey15
#The findings - In summary�Each of the brands in the study had established a YouTube channel and were regularly crea1ng content; in fact most channels had hundreds of videos uploaded to them. However, in general we found a lack of aLen1on to detail and a failure to maximise the opportuni1es that online video presents -‐ valida1ng our hypothesis. With an average score of just 20.4 from a poten1al 48 points available, there’s significant opportunity for brands to grow engagement, increase subscribers and enhance search performance. The other key theme we iden1fied was a need for greater consistency. Even those brands towards the top of the rankings (see page 9) could have applied best-‐prac1ces much more frequently to their content. We iden1fied three key areas for brands to focus on improving:
Vodafone, Money Supermarket and Peugeot took the top three places in our list, reflec1ng their ability to effec1vely create and op1mise content that u1lises YouTube’s features. From a sector perspec1ve it was the telco’s that performed best, taking three of the top ten posi1ons while finance brands filled three of the boNom eleven spots.
META DATA HOUSE-‐KEEPING
Such as the descrip1on accompanying a video.
Such as using clickable annota1ons in videos.
Such as consistently publishing content using regular formats.
USING INTERACTIVE FEATURES PROGRAMMATIC APPROACH
Page 6 �

#UKYouTubeSurvey15
Ϯϲй�ŽĨ�ďƌĂŶĚƐ�ĚŝƐĂďůĞĚ�ĐŽŵŵĞŶƚƐ�ŽŶ�ƚŚĞŝƌ�ǀŝĚĞŽƐ͘
ϱϰй��®�Ä͛ã�®Ä�½ç���½®Ä»Ý�ãÊ�Êã«�Ù�ÝÊ�®�½ Ä�ãóÊÙ»Ý
used byϴϲй�WEREPLAYLISTSO F B R A N D S T O O R G A N I S E T H E I R Y O U T U B E C H A N N E L S
ϮϬй�OF BRANDS CHOSE TO CUSTOMISEvideo-thumbnails
Ê Ä ½ù
of brands were
ÖÙʦÙ�ÃÃ�ã®��¥ÊÙÃ�ã
ϭϭй�Ù�¦ç½�Ù½ù�Öç�½®Ý«®Ä¦��ÊÄã�Äã�®Ä��
t��<>z��W/^K��^
2 3/ of brandsdidn’t direct
ã«�®Ù�ò®��ÊÝVIEWERS TO MORE CONTENT AT THE END OF
Ϯϵй�ǁĞƌĞ�ŵĂŬŝŶŐ�ƌĞŐƵůĂƌ�ƵƐĞ�ŽĨ�ŝŶͲǀŝĚĞŽ�ĂŶŶŽƚĂƟŽŶƐ
0:29/1:00
O N L Y
ϵй�of brandshad a dedicated
�«�ÄÄ�½s / � � K � d K � / E d Z K � h � � � d , � / Z � z K h d h � �
ϭϰй�of brandsregularly
�ÊÃÃ�Äã«���ÖÙ�Ý�Äã�ÙÝ��Ý»®Ä¦�ò®�ó�ÙÝ�ãÊ�Ýç�Ý�Ù®���ÊÙ
#The findings - In numbers�
Page 7 �
1 Where content is published on a regular basis, e.g. the same 1me each week, around a regular theme. 2 Where a specific image is used as the “cover image” for the video, rather than being auto-‐selected by YouTube.
2
1

#UKYouTubeSurvey15
#The findings - How the sectors compared�Telco & u;lity brands topped the list taking first, fourth, ninth and tenth spot; the areas they performed best in were using in-‐video features and having consistency across their videos. Meanwhile finance brands filled three of the boLom eleven posi1ons. It was notable that 71% of finance brands chose not to enable comments on their videos. The automo;ve sector performed rela1vely well across the board, whilst retail was the most varied in terms of distribu1on across the final list. It’s important to caveat that the sample size in some cases was rela=vely small; for example only three automo=ve brands were in the list.
Rank% Sector% Channel%setup%%(17)%
In3video%approach%%(21)%
Delivery%(10)%
TOTAL%(48))
1" Telco"&"Utilities% 11% 11% 5% 26%2" Automotive" 12" 8" 4" 25"3" Retail" 12" 6" 3" 21"4" Finance" 8" 7" 4" 19"5" FMCG" 10" 5" 4" 19"6" Service" 7" 5" 3" 15"
"
Sector performance, ranked by average total score
Page 8 �
The maximum score a brand could achieve in each area is shown in brackets, with a total maximum score of 48.

#UKYouTubeSurvey15
#The findings - Brand rankings �
Rank% Brand! Channel%setup%% In2video%approach%% Delivery% TOTAL%
1% Vodafone% 16% 15% 5% 36%2" Money"Supermarket" 12" 16" 5" 33"3" Peugeot" 12" 13" 6" 31"4" Aldi" 11" 12" 5" 28"5" O2" 11" 12" 5" 28"6" Sainsbury's" 16" 8" 4" 28"7" Argos" 12" 12" 3" 27"8" Heineken" 13" 9" 4" 26"9" British"Gas" 7" 12" 7" 26"10" EE" 10" 9" 5" 24"11" Boots" 12" 8" 3" 23"12" Marks"&"Spencer" 12" 8" 3" 23"13" Volkswagen" 14" 6" 3" 23"14" Barclays" 11" 6" 4" 21"15" TalkTalk" 11" 7" 3" 21"16" Direct"Line" 11" 4" 5" 20"17" Microsoft" 10" 5" 5" 20"18" Sky" 7" 7" 5" 19"19" Asda" 11" 6" 1" 18"20" Barclaycard" 7" 8" 3" 18"
"
Page 9 �
Con=nued…

#UKYouTubeSurvey15
#The findings - Brand rankings �
Page 10 �

#UKYouTubeSurvey15
#Best practice in action�We picked out some of the best examples we found to illustrate the three areas of our survey; channel setup, in-‐video approach and delivery.
Channel setup Vodafone’s introductory video gives clarity of what to expect and why to subscribe to the channel. youtube.com/vodafoneUK
TalkTalk’s playlists provide clear naviga1on, with full descrip1ons and tailored thumbnails as a visual prompt. youtube.com/talktalk
Page 11 �
#UKYouTubeSurvey15
#Best practice in action�In-‐video approach
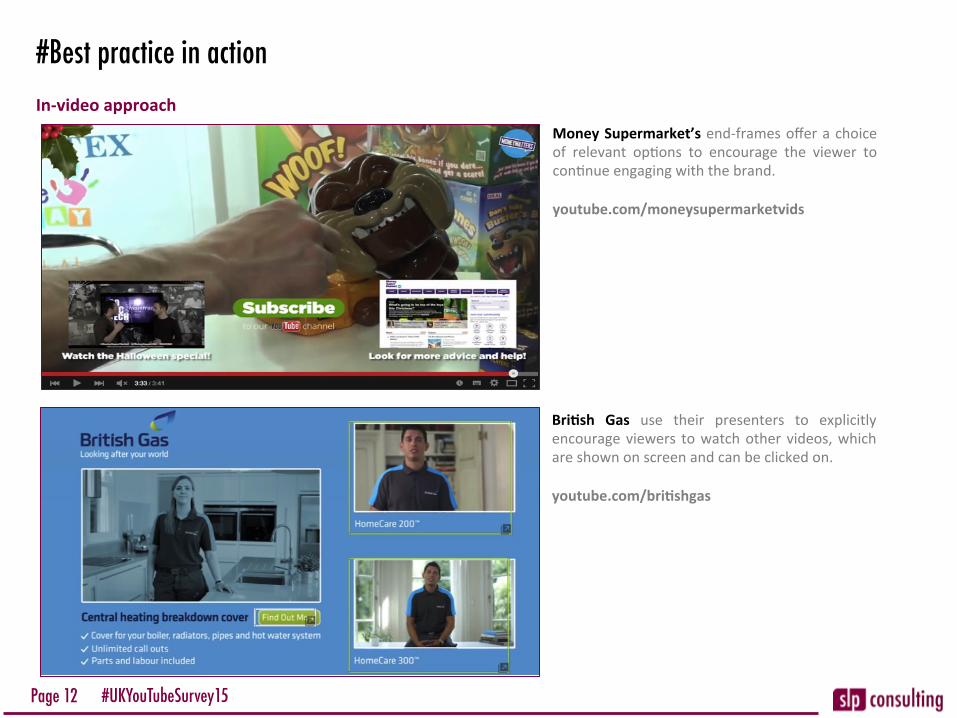
Money Supermarket’s end-‐frames offer a choice of relevant op1ons to encourage the viewer to con1nue engaging with the brand. youtube.com/moneysupermarketvids
Page 12 �
Bri;sh Gas use their presenters to explicitly encourage viewers to watch other videos, which are shown on screen and can be clicked on. youtube.com/bri;shgas
#UKYouTubeSurvey15
#Best practice in action�Delivery
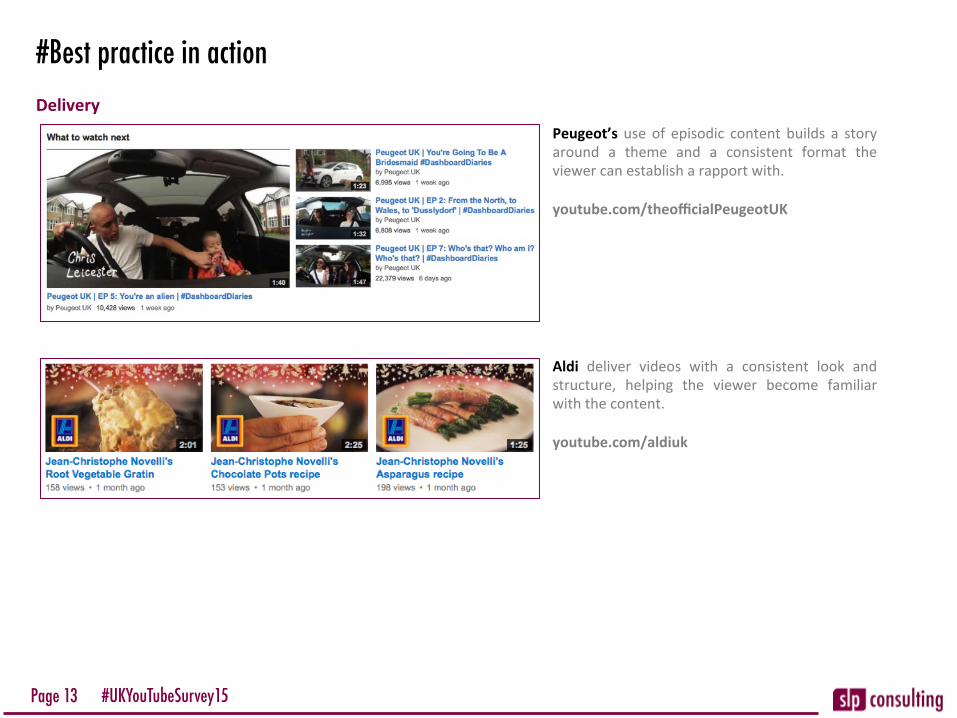
Peugeot’s use of episodic content builds a story around a theme and a consistent format the viewer can establish a rapport with. youtube.com/theofficialPeugeotUK
Aldi deliver videos with a consistent look and structure, helping the viewer become familiar with the content. youtube.com/aldiuk
Page 13 �

#UKYouTubeSurvey15
#Conclusions �Our findings strongly supported the original hypothesis that many large brands aren’t using YouTube as effec1vely as they could, which means there’s plenty of opportunity for improvement and growth.
The other major conclusion is that in many cases just a few changes are required in how channels are structured and how videos are op1mised to improve maLers. In fact in-‐video op;misa;on is one of biggest areas of opportunity and one of the quickest and easiest to address. There’s really no excuse for brands failing to setup some of the basic features on their channels, such as including links to their website and other social networks.
Page 14 �
For finance brands, it will be interes1ng to see if they start opening up their use of YouTube by enabling comments, as they already do on other social networks like Facebook, turning the dial from “broadcast” to “interact”. Con=nued…

#UKYouTubeSurvey15
#Conclusions �Looking at delivery, this is the area which undoubtedly requires the biggest change. A different mind-‐set for planning and crea1ng video content is needed by brands to truly get the most from YouTube. Publishing content consistency (e.g. at the same 1me each week), being setup to incorporate user feedback and managing video distribu;on across mul;ple social networks requires planning and commitment. This can be par1cularly challenging for large organisa1ons where video content is being commissioned and produced by mul1ple teams. However, mirroring the mindset of successful na1ve YouTube creators, like Fleur de Force and Vsauce, will help brands build dedicated, engaged and trus1ng audiences.
Page 15 �
Whilst this study focused on YouTube, the video landscape is fast evolving with Facebook and TwiLer’s na1ve video players quickly maturing. However, regardless of the social network being used, brands must ensure they take an audience-‐focused approach to crea1ng video which draws upon the unique features each plahorm provides.

#UKYouTubeSurvey15
#More information�slp consul;ng was founded by Simon Preece to help organisa1ons navigate the risks and opportuni1es that social media presents in a hyper-‐connected world.
And for our most recent thinking, follow the blog at: www.slpconsul1ng.co.uk/blog
We run audits and training workshops to help brands extract the most value from the 1me and resources they allocate to social media. If you would like more informa1on about this survey, or are interested in talking to us, please get in touch: E: [email protected] M: 07970 890468 W: www.slpconsul1ng.co.uk
Page 16 �

Appendix��������

#UKYouTubeSurvey15
#Methodology detail �Weigh;ng criteria We selected twelve criteria across our three areas of research, and added a weigh1ng to each based on its importance in the overall context of YouTube. So for example, enabling comments on videos scored five points, whilst two points were awarded if presenters/narrators encouraged viewers to engage. The criteria used were: Brand selec;on We picked 35 of the biggest brands ac1ve in the UK, with an addi1onal criteria that they must be “consumer facing”. For that reason the likes of Unilever are not included. Our research was grouped into six sector areas; telco & u1li1es, FMCG, finance, service & entertainment, automo1ve and retail.
Timing We reviewed how brands were using their main YouTube channel up to December 2014, with the main emphasis on videos from the previous 12 months. We assessed mul1ple videos and playlists to avoid a single video/playlist giving an unfair representa1on.
Channel selec;on In each case the brand’s UK-‐specific channel, where applicable, was assessed. In those instances where a brand has mul1ple channels, we selected the core channel, for example O2UKOffical was used instead of O2 Guru TV.
Page 18 �

#UKYouTubeSurvey15
#Extensions�One aspect not factored into the survey was the brands’ use of other social networks for the delivery of video. If a brand decided to focus all of its video content on Facebook for example, it would not be reflected. However, from our wider observa1ons this was not the case. Furthermore this should not be a reason for failing to follow best prac1ce. By only assessing core channels we weren’t able to account for brands’ other channels that might be shining examples of YouTube best prac1ce. However, our perspec1ve is that brands should be applying these best prac1ces to all video output. An addi1onal area for inves1ga1on, out of scope for this report, would be to understand more about how brands are using all of their digital touch-‐points to distribute video content. How are other social plahorms, email and websites for example being used collec1vely as part of the video distribu1on mix?
Page 19 �