Embed Size (px)
Citation preview

arX
iv:1
404.
6540
v2 [
astro
-ph.
GA
] 16
Feb
201
5Accepted by the ApJPreprint typeset using LATEX style emulateapj v. 05/12/14
EVIDENCE FOR A MASSIVE, EXTENDED CIRCUMGALACTIC MEDIUM AROUND THE ANDROMEDAGALAXY1
Nicolas Lehner2, J. Christopher Howk2, and Bart P. Wakker3
Accepted by the ApJ
ABSTRACT
We demonstrate the presence of an extended and massive circumgalactic medium (CGM) aroundMessier 31 using archival HST COS ultraviolet spectroscopy of 18 QSOs projected within two virialradii of M31 (Rvir = 300 kpc). We detect absorption from Si III at −300 ∼< vLSR ∼< −150 km s−1
toward all 3 sightlines at R ∼< 0.2Rvir, 3 of 4 sightlines at 0.8 ∼< R/Rvir ∼< 1.1, and possibly 1 of11 at 1.1 < R/Rvir ∼< 1.8. We present several arguments that the gas at these velocities observedin these directions originates from the CGM of M31 rather than the Local Group or Milky WayCGM or Magellanic Stream. We show that the dwarf galaxies located in the CGM of M31 have verysimilar velocities over similar projected distances from M31. We find a non-trivial relationship onlyat these velocities between the column densities (N) of all the ions and R, whereby N decreases withincreasing R. Singly ionized species are only detected in the inner CGM of M31 at < 0.2Rvir. AtR < 0.8Rvir, the covering fraction is close to unity for Si III and C IV (fc ∼ 60%–97% at the 90%confidence level), but drops to fc ∼< 10–20% at R ∼> Rvir. We show that the M31 CGM gas is bound,multiphase, predominantly ionized (i.e., H II≫H I), and becomes more highly ionized gas at largerR. We estimate using Si II, Si III, and Si IV a CGM metal mass of at least 2 × 10⁶ M⊙ and gasmass of ∼> 3× 10⁹ (Z⊙/Z) M⊙ within 0.2Rvir, and possibly a factor ∼10 larger within Rvir, implyingsubstantial metal and gas masses in the CGM of M31. Compared with galaxies in the COS-Halossurvey, the CGM of M31 appears to be quite typical for a L∗ galaxy.Keywords: galaxies: halos — galaxies: individual (M31) — intergalactic medium — Local Group —
quasars: absorption lines
1. INTRODUCTION
The circumgalactic medium (CGM), loosely definedas the diffuse gas between the thick disk of galaxies andabout a virial radius of galaxies is the scene where large-scale inflow and outflow from galaxies takes place. Thecompetition between these processes is thought to shapegalaxies and drive their evolution (e.g., Keres et al.2005; Dekel & Birnboim 2006; Faucher-Giguere & Keres2011; Putman et al. 2012). Observations of the proper-ties of the CGM are therefore critical to test theoriesof galaxy evolution. Recent discoveries using highquality ultraviolet observations show that the CGM isa pivotal component of galaxies with significant massof baryons and metals (e.g., Wakker & Savage 2009;Chen et al. 2010; Prochaska et al. 2011; Tumlinson et al.2011; Churchill et al. 2012; Kacprzak et al. 2012,2014; Werk et al. 2013, 2014; Lehner et al. 2013;Stocke et al. 2013; Peeples et al. 2014; Werk et al. 2014;Liang & Chen 2014; Bordoloi et al. 2014).Observations of the CGM at z > 0 typically provide
only average properties of the CGM along one sightline(in some rare cases, 2–3 sightlines, e.g., Keeney et al.
1 Based on observations made with the NASA/ESA HubbleSpace Telescope, obtained at the Space Telescope Science In-stitute, which is operated by the Association of Universities forResearch in Astronomy, Inc. under NASA contract No. NAS5-26555.
2 Department of Physics, University of Notre Dame, 225Nieuwland Science Hall, Notre Dame, IN 46556
3 Supported by NASA/NSF, affiliated with the Departmentof Astronomy, University of Wisconsin, 475 N. Charter Street,Madison, WI 53706
2013), and therefore the CGM properties such as gaskinematics, metal mass distribution, and ionizationstates as a function of galaxy geometry and propertiesare not well constrained. One way to alleviate in part thisissue is to determine the properties of the CGM for simi-lar type or mass of galaxies with sightlines piercing theirCGM at various impact parameters. This is the strategyused in the COS-Halos survey (Tumlinson et al. 2013).With a controlled sample of L∗ galaxies, the COS-Halossurvey provided strong evidence for extended highly ion-ized CGM by demonstrating that typical star-formingL∗ galaxies have O VI column densities NOVI ∼> 1014.3
cm−2, while more passive L∗ galaxies show weaker orno O VI absorption in their CGM (Tumlinson et al.2011). While this experiment has been extremely fruit-ful (Thom et al. 2011, 2012; Tumlinson et al. 2011, 2013;Werk et al. 2013, 2014; Peeples et al. 2014), the COS-Halos galaxies have enough spread in their propertiesthat even collectively they do not mimic a single galaxy.With several tens of QSO sightlines going through
the Milky Way (MW) CGM (e.g., Savage et al. 2003;Sembach et al. 2003; Wakker et al. 2003, 2012; Fox et al.2006; Shull et al. 2009; Lehner et al. 2012), the MWwould appear a perfect candidate for a “zoom-in” experi-ment, i.e., in which we can study the CGM along differentsightlines of a single galaxy. However, our understand-ing of the MW CGM has remained somewhat limitedby our position within the MW disk. The high-velocityclouds (HVCs, clouds that have typically |vLSR| ≥ 90km s−1 at |b| ∼> 20◦, e.g., Wakker 2001 ) that coverthe Galactic sky were thought to possibly probe the ex-

2 Lehner, Howk, & Wakker
tended MW CGM. Their distances are now largely de-termined (Ryans et al. 1997; Wakker 2001; Thom et al.2006, 2008; Wakker et al. 2007, 2008; Lehner & Howk2010; Smoker et al. 2011 for H I HVC complexes andLehner & Howk 2011; Lehner et al. 2012 for the diffuseionized HVCs, iHVCs), but this created another puzzlesince they place most of the H I HVCs and iHVCs within5–15 kpc of the sun, not at 100–300 kpc, the expectedsize of the MW CGM, and hence the HVCs only repre-sent a comparatively very small mass (since M ∝ d2).Only the Magellanic Stream (MS, e.g., Putman et al.1998; Bruns et al. 2005; Nidever et al. 2008; Fox et al.2014) is more distant, possibly extending to 80–200kpc (Besla et al. 2012), providing some indirect evi-dence for an extended corona around the MW (e.g.,Stanimirovic et al. 2002; Sembach et al. 2003; Fox et al.2013, 2014).The high O VI column density found by COS-Halos is
another element that shows that the iHVCs do not probethe extended MW CGM since NOVI for the MW iHVCsis on average a factor 5 times smaller (see the results inSembach et al. 2003; Fox et al. 2006). Only if the entireMW thick disk and halo absorption is integrated, wouldNOVI in the MW approach 1014.3 cm−2 (i.e., by combin-ing the results of Savage et al. 2003 and Sembach et al.2003). This would mean that most of the column den-sity of the MW CGM might be hidden in part in thelow-velocity gas often associated with the thin and thickdisks (see Peek et al. 2009 and Y. Zheng et al. 2015, inpreparation). However, it is also plausible that the MWCGM has properties that are different from z ∼ 0.5 L∗
galaxies.Studies of the gas content of nearby galaxies of-
fer major advantages over both the MW and higherredshift galaxies. Nearby galaxies span a large an-gular extent and can be studied over multiple lines-of-sight and offer a direct mapping between the stel-lar distribution and the gas content. This experimenthas been conducted for the Large Magellanic Cloud(Howk et al. 2002; Lehner & Howk 2007; Lehner et al.2009; Barger et al. 2014; N. Lehner et al., 2015 in prep.),showing in particular the presence of large-scale outflowsfrom a sub-L∗ galaxy feeding in metals the CGM of a L∗galaxy (the MW).The L∗ galaxy that can be observed with the most
detail is the Andromeda Nebula (M31). The stellardisk and halo of M31 have been subject to intensestudy (e.g., Brown et al. 2006; McConnachie et al. 2009;Gilbert et al. 2012, 2014; Dalcanton et al. 2012), withwell-determined local and global properties, includingits inclination (Walterbos & Kennicutt 1987), stellar andvirial masses (Geehan et al. 2006; van der Marel et al.2012), dust and ISM disk mass (Draine et al. 2014), ro-tation curve (e.g., Chemin et al. 2009), and its galaxysatellites (McConnachie 2012). These studies all im-ply that M31 is fairly typical of massive star-forminggalaxies,which has undergone several major interactionswith its satellites (e.g., Gordon et al. 2006; Putman et al.2009), and possibly in a phase of transformation into ared galaxy (Mutch et al. 2011; Davidge et al. 2012). Thespecific star-formation rate of M31, sSFR≡ SFR/M⋆ =(5 ± 1) × 10−12 yr−1 (using the stellar mass M⋆ andSFR from Geehan et al. 2006; Kang et al. 2009), places
M31 just between the passively evolving and star form-ing galaxies in COS-Halos (Tumlinson et al. 2011). Aswe show in this paper, the value of NOVI in the CGM ofM31 and the sSFR of M31 are also consistent with M31being in the “green valley”.Parallel to this intensive observational effort, there
is also a major theoretical effort to understand thetwo massive galaxies, the MW and M31, of the Lo-cal Group (LG) (Richter 2012; Garrison-Kimmel et al.2014; Nuza et al. 2014). With this large amount ofempirical results, M31 could become a benchmark forassessing the validity of the physics implemented inthese simulations. This requires to have also knowl-edge of its extended diffuse ionized CGM. Both deepand shallower observations of the H I 21-cm emis-sion have reported detections of H I clouds mostlywithin 50 kpc (Thilker et al. 2004; Westmeier et al. 2005,2008), and at farther distances along the M31–M33 axis(Braun & Thilker 2004). The H I 21-cm emission 49′
resolution map in Braun & Thilker (2004) gave the im-pression of an H I bridge between M31 and M33, butsubsequent deep Green Bank Telescope (GBT) 9.′1 res-olution observations show that they appear to be smallconcentrations of H I with ∼ 105 M⊙ on scale of a fewkpc (Lockman et al. 2012; Wolfe et al. 2013). As for theMW, these H I clouds might only be the tip of the ice-berg and H I alone does not provide information on thegas-phases, the metal content, and hence the total metaland baryon masses of the gas in the CGM of M31.We therefore mined the HST Cosmic Origins Spectro-
graph (COS) archive for high resolution UV QSO spec-tra with sufficient signal-to-noise (S/N) to search andmodel the weak metal-line absorption features that maybe signatures of the diffuse CGM gas of M31. Oursearch radius is within about 2 virial radii of M31. Weadopt throughout a distance of 752 kpc and a virialradius of Rvir = 300 kpc for M31 (Riess et al. 2012;van der Marel et al. 2012).4 In §2, we describe in detailhow the sample was selected, while in §3 we present sev-eral arguments that point to an association to the diffuseCGM of M31 for the absorption at −300 ∼< vLSR ∼< −150
km s−1 observed along some of the sightlines in our sam-ple . In §4, we determine the properties of the M31CGM, including its kinematics, ionization, covering frac-tion, and baryon and metal masses. We discuss the im-plications of our findings in §5 and finally summarize ourresults in §6.
2. SAMPLE AND DATA ANALYSIS
In the HST COS archive at the Mikulski Archive forSpace Telescopes (MAST), we identify 31 targets at pro-jected distances R < 2Rvir from M31 that were ob-
4 We emphasize that the exact definition of CGM and even Rvir
is far from settled, as recently discussed by Shull (2014). For exam-ple, the overdensity ∆vir = 18π2 = 178 ≈ 200 of a collapsed objectto estimate Rvir is often calculated assuming a “top-hat” modelin an Einstein-de Sitter cosmology, but this value changes withthe adopted cosmological models (e.g., Klypin et al. 2002 adopted∆vir = 340; see discussion in Shull 2014). For ease of comparisonwith previous studies and in view of the distribution of our targetswe choose for this paper Rvir = 300 kpc for Andromeda. As weshow in this paper, the gas that we associate with the CGM of M31is at velocities consistent with the material being gravitationallybound to M31 (even beyond Rvir), which implies that the extendedCGM gas of M31 is bound.

The Circumgalactic Medium of M31 3
M33
PG2345+241
MRK335
HS0033+4300
RXJ0048.3+3941
HS0058+4213
3C66A
PG0122+214
NGC 7469
Local GroupBarycenter
150 kpc
Rvir = 300 kp
c
450 kpc
UGC12163
PG0003+158M
31 major axis
M31 m
inor a
xis
MW halo stars (Lehner et al. 2012)Rao et al. (2013)
This work: detectionsThis work: non-detectionsThis work: rejected
Figure 1. Distribution of our targets in our adopted (circles) and rejected (squares) samples used to probe the CGM of M31 (rightascension increases from right to left, declination increases from bottom to top, see Table 1). All these these sightlines were observed withCOS G130M and/or G160M and some were also observed with FUSE. Targets with UV absorption at LSR velocities −300 ≤ vLSR ≤ −150km s−1 associated with the CGM of M31 are shown in red. Note that the sightline HS0058+4213 is near the 0.2Rvir boundary. Overplottedis the H I 21-cm emission map around M31 adapted from Braun & Thilker (2004) where the lowest contour has logNHI = 17.5 in the 40′
beam, with 0.5 dex increment between contours (this provides in our opinion a better representation of the H I distribution around M31according to recent GBT observations, see Lockman et al. 2012; Wolfe et al. 2013). The yellow crosses show for reference the targets fromthe COS G140L M31 program where low ions (e.g., Mg II) were detected only within the H I disk contour (i.e., R ≤ 32 kpc, see Rao et al.2013). The two MW stars in blue are distant halo stars, allowing us to determine that absorption at vLSR ∼> −170 km s−1 traces MW gas.We also indicate the position of the Local Group barycenter with the green cross.
served with the COS G130M and/or G160M gratings(Rλ ≈ 16, 000). In Table 1, we summarize the 18 sight-lines that are included in the adopted sample and the13 sightlines rejected for the main analysis of the M31CGM absorption. The two chief reasons for excludingsightlines are either the signal-to-noise (S/N) level is toolow (S/N∼< 4) or there is a clear contamination from theMS or unrelated absorbers; the exact reasons for the ex-clusion of each sightline are given in the table footnotes
and in §3, where we discuss the absorption velocity struc-ture toward M31. In Fig. 1, we show the distributionof the targets in our sample overplotted with the H I
contours from Braun & Thilker (2004). The three innertargets are also part of another paper that will considerin more detail the relation (if any) between the gas andstellar halos of M31 (C. Danforth et al. 2015, in prep.);only these targets were initially from a program aimed tostudy specifically the halo of M31 (HST program 11632,PI: R. Rich).
Table 1Sample of COS G130M-G160M Targets Piercing the CGM of M31
Target RA DEC zem R COS S/N(◦) (◦) (kpc) Note
Adopted Sample
RXJ0048.3+3941 12.08 +39.69 0.134 25 G130M–G160M 23 1HS0033+4300 9.096 +43.28 0.120 31 G130M–G160M 5 1HS0058+4213 15.38 +42.49 0.190 49 G130M–G160M 6 13C66A 35.67 +43.04 0.340 239 G130M–G160M 16 1MRK335 1.58 +20.20 0.034 287 G130M–G160M 20 1PG0003+158 1.50 +16.16 0.450 334 G130M–G160M 16 1UGC12163 340.66 +29.73 0.025 340 G130M–G160M 9 1

4 Lehner, Howk, & Wakker
Table 1 — Continued
Target RA DEC zem R COS S/N(◦) (◦) (kpc) Note
MRK1502 13.40 +12.69 0.061 361 G130M 7 1MRK1501 2.63 +10.984 0.090 389 G130M 9 1SDSSJ015952.95+134554.3 29.97 +13.77 0.504 401 G130M 7 13C454.3 343.49 +16.15 0.859 424 G130M–G160M 5 1SDSSJ225738.20+134045.0 344.41 +13.68 0.594 440 G130M–G160M 6 1NGC7469 345.82 +8.87 0.016 475 G130M–G160M 24 1HS2154+2228 329.20 +22.713 1.290 476 G160M 7 1PHL1226 28.62 +4.81 0.404 482 G130M 8 1MRK304 334.30 +14.24 0.067 499 G130M–G160M 20 1MRK595 40.40 +7.19 0.027 514 G130M 8 1MRK1014 29.96 +0.40 0.164 527 G130M 22 1
Rejected Sample
PG0026+129 7.31 +13.277 0.142 355 G130M 12 2SDSSJ014143.20+134032.0 25.43 +13.685 0.045 381 G130M 3 3IRAS01477+1254 27.62 +13.159 0.147 396 G130M–G160M 3 3SDSSJ021348.53+125951.4 33.45 +13.007 0.228 427 G130M–G160M 2 3PG0044+030 11.77 +3.331 0.624 462 G130M 6 44C10.08 40.62 +11.026 2.680 484 G130M 0 3LBQS0052-0038 13.86 −0.363 0.167 501 G130M–G160M 4 3NGC7714 354.06 +2.165 0.009 502 G130M–G160M 8 5PG2349-014 357.98 −1.153 0.174 522 G130M 7 6LBQS0107-0232 17.56 −2.282 0.728 522 G160M 9 7LBQS0107-0233 17.57 −2.314 0.956 523 G130M–G160M 9 8LBQS0107-0235 17.56 −2.331 0.960 523 G130M–G160M 9 8SDSSJ234500.43-005936.0 356.25 −0.993 0.789 525 G130M–G160M 5 9
Note. — 1: All the targets in the adopted sample satisfiedthe following criteria: i) S/N∼> 5 in at least one transition, ii)there is no obvious contamination in the −300 ∼< vLSR ∼< −150
km s−1 component from the MS in the direction of the target. 2:Weak absorption features are observed between −300 and −180km s−1 in the profiles of C II, Si II, Si III, and Si IV, but thereis no match in the velocity centroids between all the observedtransitions (including for the Si IV doublet), implying that thereis some contamination from unrelated absorbers for several of theobserved transitions. 3: These data have too low S/N. 4: Twoabsorption components at −290 and −210 km s−1, but at thisRA, DEC, both are more likely to have a MS origin. 5. Smearedabsorption lines owing to the extended background object. 6: Thissightline pierces the MS and has a MS component centered at −300km s−1 that extends from −400 to −190 km s−1. 7: Only C IVis available and both transitions of the doublet are contaminated.8: Absorption is observed at −250 km s−1 in Si III and C IV, butat this RA, DEC, it is likely from the MS (this sightline is about20◦ off the MS body). 9: This sightline pierces the MS and has aMS component centered at −250 kms−1 that extends from −350to −150 km s−1.
We also searched the Far Ultraviolet Spectroscopic Ex-plorer (FUSE, Rλ ≈ 15, 000) archive to complementthe COS data with the O VI absorption. The follow-ing targets have FUSE observations with adequate S/N(i.e., ∼> 5): RXJ0048.3+3941, MRK335, UGC12163, andNGC7469. We, however, do not consider FUSE datawith no COS observation because the available UV tran-sitions in the far-UV spectrum (O VI, C II, C III, Si II)are either too weak or too contaminated to allow us toreliably identify individual velocity components in theirabsorption profiles.Information on the design and performance of COS
and FUSE can be found in Green et al. (2012) andMoos et al. (2000), respectively. Detailed informationabout the COS and FUSE data processing can be foundin Fox et al. (2014) and Wakker et al. (2003). In short,the exposures are aligned in wavelength space by match-ing the centroids of all the absorption lines visible in
individual spectra. The coadded spectrum for each ob-ject is then shifted into the local standard of rest (LSR)velocity frame by matching the centroids of the GalacticH I 21-cm emission in that direction from the LAB sur-vey (Kalberla et al. 2005) to the absorption of neutraland singly ionized species. We normalize the QSO con-tinua with low order Legendre polynomials within about±1000 km s−1 from the absorption under consideration;typically polynomials with orders m ≤ 4 are fitted. InFig. 2, we show an example of the normalized profilesof selected ions for RXJ0048.1+3941. In the figures ofthe Appendix, we show all the normalized profiles of ourselected targets against the LSR velocity. The O VI canbe contaminated by H2 absorption, and we remove thiscontamination following the method described in Wakker(2006). We show the H2 model in the figures of the Ap-pendix. Based on previous experience, this contamina-tion can be removed fairly accurately with an uncertaintyof about ±0.1 dex on the column density (Wakker et al.2003).To search for M31 CGM absorption and to determine
the properties of the CGM gas, we consider the followingatomic and ionic and transitions: O I λ1302, C II λ1334,C III λ977, C IV λλ1548, 1550, Si II λ1193 (Si II λ1260is blended with S II λ1259 near the systemic velocity ofM31), Si III λ1206, Si IV λλ1393, 1402, as well as O VI
λλ1031, 1037 for the four sightlines observed with FUSE.Other transitions are typically too weak to be detectedand do not produce interesting limits.We use the apparent optical depth (AOD) method de-
scribed by Savage & Sembach (1991) to estimate the to-tal column density and average velocity of the metalions. The absorption profiles are converted into ap-parent column densities per unit velocity, Na(v) =3.768 × 10¹⁴ ln[Fc(v)/Fobs(v)]/(fλ) cm−2 (km s−1)−1,where Fc(v) and Fobs(v) are the modeled continuumand observed fluxes as a function of velocity, respec-

The Circumgalactic Medium of M31 5
tively, f is the oscillator strength of the transition andλ is the wavelength in A. The atomic parameters arefor the UV transitions from Morton (2003). When nodetection was observed, we estimated a 3σ upper limitfollowing the method described by Lehner et al. (2008).The total column density was obtained by integratingover the absorption profile N =
! v2v1
Na(v)dv and theaverage velocity was determined from the first moment⟨v⟩ =
! v2v1
vNa(v)dv/! v2v1
Na(v)dv.We consider absorption over the velocities that we as-
sociate with the CGM of M31 (see the component in redin Fig. 2); see §3 for several arguments that support thisassociation. In Table 2, we summarize the integrationrange for each sightline and the velocity and column den-sity results for each species. We find a good agreementbetween the column densities estimated for the doublettransitions (C IV, Si IV), showing no indication of sat-uration or contamination. We note, however, that C II
and Si III for the 3 targets at R ≤ 50 kpc (R ≤ 0.2Rvir)could be somewhat saturated owing the peak apparentoptical depth being τa ∼> 1. In this table, we also list theaverage velocity (defined as ⟨vall⟩) based on all the reli-able transitions for a given sightline. For the sightlineswhere no M31 absorption is found, we derive a 3σ upperusing generally the velocity interval [−280,−150] km s−1
to mimic the velocity range of the absorption attributedto the M31 CGM observed within 0.2Rvir.
Table 2Kinematics and Column Densities
Species (v1, v2) ⟨v⟩ logN(km s−1) (km s−1) [cm−2]
RXJ0048.3+3941, R = 25 kpc, ⟨vall⟩ = −213.1± 8.7 kms−1
O I λ1302 −306,−150 · · · < 13.63C II λ1334 −306,−150 −188.7 : 14.57 :Si II λ1193 −306,−150 −197.4 ± 2.0 13.43 ± 0.02C III λ977 −306,−150 −220.7 : > 14.08Si III λ1206 −306,−150 −215.5 ± 0.8 13.42 ± 0.01Si IV λ1393 −306,−150 −212.9 ± 1.3 13.38 ± 0.01Si IV λ1402 −306,−150 −211.3 ± 2.6 13.41 ± 0.03C IV λ1548 −306,−150 −218.8 ± 1.1 14.08 ± 0.02C IV λ1550 −306,−150 −222.7 ± 2.0 14.11 ± 0.02O VI λ1031 −306,−130 −209.4 ± 5.0 14.38 ± 0.12
HS0033+4300, R = 31 kpc, ⟨vall⟩ = −204.1± 2.0 kms−1
O I λ1302 −280,−150 · · · < 14.26C II λ1334 −280,−150 −204.1 ± 5.9 14.34 :Si II λ1193 −280,−150 −223.8 : 13.36 ± 0.18Si III λ1206 −280,−150 −201.2 ± 6.4 13.31 ± 0.10Si IV λ1402 −280,−150 −206.8 ± 6.7 13.26 ± 0.09C IV λ1548 −280,−150 −203.6 ± 3.0 14.04 ± 0.05C IV λ1550 −280,−150 −204.6 ± 5.5 14.07 ± 0.08
HS0058+4213, R = 48 kpc, ⟨vall⟩ = −211.1± 3.9 kms−1
O I λ1302 −280,−150 · · · < 14.02C II λ1334 −280,−150 −214.1 ± 2.9 14.41 ± 0.06Si II λ1193 −280,−150 −217.3 ± 5.9 13.45 ± 0.08Si III λ1206 −280,−150 −210.5 ± 3.2 13.44 ± 0.08Si IV λ1393 −280,−150 −207.4 ± 5.1 13.42 ± 0.07Si IV λ1402 −280,−150 −212.4 ± 8.7 13.43 ± 0.12C IV λ1548 −280,−150 −210.5 ± 4.3 13.95 ± 0.06C IV λ1550 −280,−150 −205.8 ± 7.6 14.00 ± 0.10
3C66A, R = 239 kpc, ⟨vall⟩ = −256.0± 4.9 kms−1
O I λ1302 −321,−214 · · · < 13.54C II λ1334 −321,−214 · · · < 13.10
Table 2 — Continued
Species (v1, v2) ⟨v⟩ logN(km s−1) (km s−1) [cm−2]
Si II λ1193 −321,−214 · · · < 12.54Si III λ1206 −321,−214 −256.0± 4.9 ≤ 12.48 ± 0.07Si IV λ1393 −321,−214 · · · < 13.04C IV λ1548 −321,−214 · · · < 13.02
MRK335, R = 287 kpc, ⟨vall⟩ = −240.1 ± 5.2 km s−1
O I λ1302 −275,−180 · · · < 13.43C II λ1334 −275,−180 · · · < 12.98C III λ977 −275,−180 −222.4 : > 14.09Si II λ1193 −275,−180 · · · < 12.42Si III λ1206 −275,−150 −238.5± 5.6 12.41 ± 0.06Si IV λ1393 −275,−180 −241.1± 6.3 12.62 ± 0.09Si IV λ1402 −275,−150 −247.9 ± 15.5 12.69 ± 0.15C IV λ1548 −275,−180 −233.7± 2.5 13.48 ± 0.04C IV λ1550 −275,−180 −239.1± 5.6 13.40 ± 0.10O VI λ1031 −275,−180 −222.0± 1.0 14.10 ± 0.13
PG0003+158, R = 334 kpc, ⟨vall⟩ = −232.8 ± 4.4 km s−1
O I λ1302 −275,−186 · · · < 13.59Si II λ1193 −275,−186 · · · < 12.48Si III λ1206 −275,−186 −235.6± 2.4 12.63 ± 0.04Si IV λ1393 −275,−186 −226.5± 7.2 12.51 ± 0.13C IV λ1548 −275,−186 −235.8± 2.9 13.28 ± 0.06C IV λ1550 −275,−186 −233.4± 6.6 13.22 ± 0.16
UGC12163, R = 339 kpc, ⟨vall⟩ = −274.3± 5.1 km s−1
O I λ1302 −280,−150 · · · < 14.08C II λ1334 −280,−150 · · · < 13.53Si II λ1193 −280,−150 · · · < 13.00Si III λ1206 −280,−150 · · · < 12.54Si IV λ1393 −280,−150 · · · < 12.95C IV λ1548 −280,−150 · · · < 13.35O VI λ1031 −320,−200 −274.3± 5.1 ≤ 14.20 ± 0.17
MRK1502, R = 361 kpc
C II λ1334 −280,−150 · · · < 13.48Si II λ1193 −280,−150 · · · < 12.85Si III λ1206 −280,−150 · · · < 12.57Si IV λ1393 −280,−150 · · · < 12.97
MRK1501, R = 389 kpc
C II λ1334 −280,−150 · · · < 13.33
SDSSJ015952.95+134554.3, R = 401 kpc
C II λ1334 −280,−150 · · · < 13.56Si II λ1193 −280,−150 · · · < 12.96Si III λ1206 −270,−220 · · · < 12.29Si IV λ1393 −280,−150 · · · < 12.93
3C454.3, R = 424 kpc
C II λ1334 −280,−150 · · · < 13.70Si II λ1193 −280,−150 · · · < 13.19Si III λ1206 −280,−150 · · · < 12.79Si IV λ1393 −280,−150 · · · < 13.07C IV λ1548 −280,−150 · · · < 13.29
SDSSJ225738.20+134045.0, R = 440 kpc
C II λ1334 −280,−150 · · · < 13.64Si II λ1193 −280,−150 · · · < 13.14Si III λ1206 −280,−150 · · · < 12.66Si IV λ1393 −280,−150 · · · < 13.06C IV λ1550 −280,−150 · · · < 13.71
NGC7469, R = 475 kpc, ⟨vall⟩ = −239.4± 3.3 kms−1
O I λ1302 −260,−205 · · · < 13.28C II λ1334 −260,−205 −239.3± 2.6 13.16 ± 0.07Si II λ1193 −260,−205 · · · < 12.23Si III λ1206 −260,−205 −241.9± 1.0 12.60 ± 0.03Si IV λ1393 −260,−205 −234.6± 1.7 12.74 ± 0.05Si IV λ1402 −260,−205 −243.6± 4.0 12.69 ± 0.10

6 Lehner, Howk, & Wakker
Table 2 — Continued
Species (v1, v2) ⟨v⟩ logN(km s−1) (km s−1) [cm−2]
C IV λ1548 −260,−205 −237.0 ± 1.9 13.20 ± 0.05C IV λ1550 −260,−205 −240.0 ± 2.8 13.27 ± 0.08O VI λ1031 −260,−205 −230.3 ± 2.4 13.87 ± 0.15
HS2154+2228, R = 476 kpc
C IV λ1550 −270,−150 · · · < 13.31
PHL1226, R = 482 kpc
C II λ1334 −280,−150 · · · < 13.51Si II λ1193 −280,−150 · · · < 12.92Si III λ1206 −280,−150 · · · < 12.46Si IV λ1402 −280,−150 · · · < 13.14
MRK304, R = 495 kpc
C II λ1334 −280,−150 · · · < 13.02Si II λ1193 −280,−150 · · · < 12.57Si III λ1206 −280,−150 · · · < 12.14Si IV λ1393 −280,−150 · · · < 12.47C IV λ1548 −280,−150 · · · < 13.03
MRK595, R = 514 kpc
C II λ1334 −310,−180 · · · < 13.47Si II λ1193 −310,−180 · · · < 12.95Si III λ1206 −310,−180 · · · < 12.51Si IV λ1393 −310,−180 · · · < 12.86
MRK1014, R = 527 kpc
C II λ1334 −280,−150 · · · < 13.33Si II λ1193 −280,−150 · · · < 12.63Si III λ1206 −280,−150 · · · < 12.18Si IV λ1402 −280,−150 · · · < 12.84
Note. — All the velocities are in the LSR frame. The velocitiesv1 and v2 are the velocities used for the integration of the AODprofiles. A colon means that the estimate value is uncertain owingto blending. A “< ” indicates that no absorption is detected and a3σ upper limit is reported. A “> ” sign is lower limit because theabsorption reaches the zero-flux level. A “≤” sign indicates thatonly one transition of one ion is detected; this sign emphasizesthat the line could be contaminated. For the O VI, the errors aredominated by systematics from the correction of the H2 contam-ination. When more than one transition is detected, ⟨vall⟩ is theaverage velocity between all the ions (observed with COS) wherethe detection is not blended or uncertain.
3. ABSORPTION VELOCITY STRUCTURE ANDASSOCIATION WITH M31
In the general direction of M31, the absorption seenin the QSO spectra is complex, with absorption pos-sibly arising from the MW thick disk and halo, MS,M31 CGM, Local Group (LG), or unrelated absorbersat higher redshifts, z. Unrelated absorbers are ruled outbecause for all but two sightlines we use several speciesand different transitions of the same species to identifyhigher redshift absorbers. In Fig. 2, we show an ex-ample of the normalized profiles of C II, Si II, Si III
and C IV for RXJ0048.1+3941 at a projected distanceR = 25 kpc from M 31 (see the normalized spectrain the Appendix for the entire sample). This sightlineshows absorption in several complexes stretching from−490 km s−1 to +90 km s−1. As we show below the ab-sorption at vLSR ∼> −150 km s−1 is associated with theMW disk and halo; when detected, the absorption at−430 ∼< vLSR ∼< −300 km s−1 is mostly associated withthe MS, while we associate the −300 ∼< vLSR ∼< −150
RXJ0048.3+3941
MWdisk
MW HVCs
MS
Contamination
M31CGM
Figure 2. Normalized profiles of RXJ0048.1+3941 (R = 25 kpc)as a function of the LSR velocity, where we highlight the originof each component, the MS, the CGM of M31, and the MW diskand HVCs based on the arguments presented in §3. All the speciesfor each selected sightline studied in this work are shown in theAppendix.
km s−1 component with the CGM of M31.
3.1. MW: absorption at vLSR ∼> −150 km s−1
Both the MW thick disk and halo absorption can bereadily identified in the direction of M31. Toward allthe sightlines, saturated absorption is observed in C II,Si II, and Si III between about −90 and +50 km s−1.This absorption arises principally from the MW thickdisk based on the Galactic disk rotation curve (Clemens1985) and countless studies of the MW in UV absorption(e.g., Shull et al. 2009; Lehner et al. 2012; Wakker et al.2012).Toward many sightlines in our sample, absorption is
also observed at velocities between about −170 and −90km s−1. This absorption is from the MW iHVCs that areat distances of d ∼< 10–15 kpc from the sun. We cometo this conclusion for two reasons. First Lehner & Howk(2011) and Lehner et al. (2012) statistically constrainedthe distance of the iHVC population, showing that ab-sorption at 90 ≤ |vLSR| ∼< 170 km s−1 is found typicallyin the lower halo of the MW, as it is observed at aboutthe same rate toward MW halo stars and extragalacticAGN. Thus the gas seen in absorption toward M31 at−170 ∼< vLSR ∼< −90 km s−1 corresponds to MW gaswithin 5–15 kpc of the sun. Second we show in Fig. 1the locations of two MW halo stars near on the sky toM31 and M33 that were observed with COS (HST pro-grams 12982 and 11592; PI: Lehner). These two starsare PG0122+214 (d = 9.6 kpc), where HVC absorptionis observed at vLSR ≃ −160 km s−1 (see Lehner et al.2012), and PG2345+241 (d = 4.9 kpc, near the MRK335

The Circumgalactic Medium of M31 7
sightline; see Fig. 1), where HVC absorption is seen atvLSR ≃ −120 km s−1. In both cases, the HVC absorp-tion is very weak and detected only in Si II and C II,not in C IV or Si IV, which are typically observed at−300 ∼< vLSR ∼< −150 km s−1 (Si III cannot be usedin stellar spectra owing to the strong damping wings ofLyα). Thus gas at −150 ∼< vLSR ∼< −90 km s−1 is rela-tively close to the sun in this direction, and we thereforeassign any absorption in our sample with velocity com-ponents centered on vLSR ∼> −150 km s−1 to the MWdisk and its halo.
3.2. Identifying M31 CGM Gas
Several of our sightlines show absorption at vLSR ∼<−170 km s−1. Gas at these velocities has not been seentoward halo stars at d ∼< 20 kpc from the sun (see §3.1).We identify the absorption at −300 ∼< vLSR ∼< −150
km s−1 with the CGM of M31 for the following reasons:
1. These velocities differ by more than 200 km s−1 forsome of the targets from the expected velocities ofthe MS in this direction (§3.2.1).
2. These velocities are similar to the velocities of theM31 dwarf satellites (§3.2.1).
3. There is a non-trivial relationship between the col-umn densities of this component and the projecteddistances from M31 that only exists for gas in thisvelocity range (§3.2.2).
4. The detection rate of this component is high withina projected distance of 300 kpc (the virial radius)from M31 and plummets beyond 300 kpc, anotherproperty only observed for this velocity component(§3.2.2).
5. The H I emission observations have detected cloudsin the M31 CGM at similar LSR velocities at pro-jected distances ∼< 100 kpc (§3.2.3).
Each of these independent reasons alone points towarda M31 CGM origin. Combining all these observed prop-erties of the absorption at −300 ∼< vLSR ∼< −150 km s−1
allows us to associate with very little doubt this popula-tion of clouds with the CGM of M31.
3.2.1. Velocities
The MS extends over this part of the sky. In order tounderstand its potential signature in our observations,it is useful to plot the LSR velocity as a function ofthe MS longitude, lMS (see Nidever et al. 2008 for thedefinition of the Magellanic Stream coordinate) sinceNidever et al. (2008) found a tight relationship betweenthe LSR velocity of the MS seen in H I emission andlMS. In Fig. 3, the dashed line represents the average H I
LSR velocity of the MS with lMS determined from Fig. 9of Nidever et al. (2008), which has a very small scatterin the velocity (∼ 20–30 km s−1) at these lMS; there isno detection in H I emission (with the LAB sensitivity)beyond lMS ∼< −100◦. In each spectrum, we estimatethe average velocities of the individual components in
Nid
ever
MS fi
tMilky Way HVCs
M31
MS contamination
M31 CGM
Figure 3. LSR velocity of the individual components centeredat vLSR < −170 km s−1 identified in the spectra of the targetssummarized in Table 1. The red and blue circles are from theadopted sample, while the blue squares are from the rejected sam-ple. The cyan circle represents the systemic velocity of M31 at theM31 location. The dashed line represents the average velocitiesLSR velocities of H I estimated from the results by Nidever et al.(2008).
the velocity ranges −450 ∼< vLSR ∼< −300 km s−1 and
−300 ∼< vLSR ∼< −150 km s−1, which are represented bythe blue and red circles in Fig. 3. We also show in thisfigure with blue squares the data from the rejected sam-ple sightlines for individual components at vLSR ∼< −170
km s−1.The blue squares are all at lMS ≥ −90◦ where the MS
is still observed in H I emission and where the expectedMS are in the velocity range at −300 ∼< vLSR ∼< −200
km s−1. That apparent association with the MS at−300 ∼< vLSR ∼< −200 km s−1 led us to reject them fromthe sample, so it is not surprising that the blue squares liequite close to the dashed line. At −110◦ ≤ lMS ≤ −95◦,the blue circles are scattered around the general contin-uation of the dashed line. These mostly likely trace gasfrom the MS that extends beyond the dense H I body ofthe MS.The −130◦ ≤ lMS ≤ −110◦ longitudes are more than
30◦–40◦ from the MS seen in H I 21-cm emission. How-ever, Sembach et al. (2003) and Fox et al. (2014) foundUV absorption at the expected MS velocities extend-ing 30◦ from the body of the MS tip seen in H I emis-sion and concluded that this gas represents a diffuse ex-tension of the MS seen only in metal line absorption.Braun & Thilker (2004) also noted extended H I emis-sion filaments at the level logNHI > 17.3 (i.e., a factorof 10 or more deeper than previous H I surveys) for ve-locities −430 ∼< vLSR ∼< −330 km s−1 that align with theexpected extension of the MS (see their Figs. 3 and 5).5
Based on these studies, it is likely that the blue circles inFig. 3 at −130◦ ≤ lMS ≤ −120◦ trace predominantly the
5 The apparent smooth structures seen in Fig. 3 ofBraun & Thilker (2004) are, however, questionable based onfollow-up higher angular resolution GBT observations that revealat least for the gas between M31 and M33 that the H I emission istypically resolved into cloud-like structure the size of a GBT beam-width or smaller rather than elongated filamentary structure, andat much higher column densities (Lockman et al. 2012; Wolfe et al.2013).

8 Lehner, Howk, & Wakker
Figure 4. Comparison of the M31-centric velocities of the gascomponents seen in UV absorption and H I emission associatedwith the M31 CGM and the M31 galaxy satellites as a functionof the projected distances from M31. For the blue circles, we onlyconsider the data at lMS ≤ −120◦. The color coding for the circlesis the same as those in Fig. 3. The color coding of the upsidedown triangles follows that of the circles. The dashed curves showthe escape velocity for a 1012 M⊙ point mass. The H I emissiondata are at R < 0.2Rvir from Westmeier et al. (2008) and at R ≥0.2Rvir from Lockman et al. (2012) and Wolfe et al. (2013). Thedata for the galaxies associated with M31 were estimated from theparameters derived by McConnachie (2012).
MS, extending the tip of the MS observed in H I emissionby more than 30◦. If they are part of the MS, the veloc-ity of the MS appears to flatten between lMS ∼ −130◦
and −100◦. All the blue components at lMS ∼> −110◦
in Fig. 3 are within ∼< 50 km s−1 of the expected MSvelocities.On the other hand, the red circles at −130◦ ≤ lMS ≤
−120◦ are at velocities incompatible with a MS origin bymore than 100–200 km s−1. At −110◦ ≤ lMS ≤ −95◦,they are about 100 km s−1 from the expected MS veloc-ities determined by the dashed line, but only 50 km s−1
from some of the components marked as blue cirlces.Given their proximity to MS velocities, the origin ofthe component vLSR ∼ −220 km s−1 toward MRK335,PG0003+158, and NGC7469 could potentially arise inthe Stream. The first 2 sightlines have a MS latitude∼ 12◦, while NGC7469 has bMS ≃ −5◦, i.e., NGC7469goes through some of the H I emission from the MS (seeFig. 8 in Nidever et al. 2008), making NGC7469 the mostuncertain sightline. NGC7469 is also the farther sightlinefrom M31 with R ≃ 1.6Rvir. The other two sightlines lieat projected distances from M31 R ≈ Rvir.From Fig. 3, it is also noticeable how the red and blue
circles together appear quasi-symmetrically distributedaround the systemic velocity of M31 at lMS ∼< −120◦.The component at negative velocities relative to M31is, however, not observed in all the inner region sight-lines, only toward RXJ0048.1+3941 (R = 25 kpc) andHS0033+4300 (R = 31 kpc) at vLSR ≃ −380 km s−1
and farther away toward UGC12163 (R = 339 kpc) atvLSR ≃ −430 km s−1 (strong absorption, see figure in Ap-pendix), and −360 km s−1 (weak absorption). The MSmost certainly dominates the absorption of these com-ponents because 1) the properties of the absorption arereminiscent of those observed toward sightlines known to
probe the MS with strong absorption in C II and Si IIas well as absorption in Si III, Si IV, and C IV (see,e.g., Fox et al. 2014), and 2) there is no difference in thestrength of the absorption at projected distances fromM31 of 25–31 kpc and 339 kpc (see §3.2.2). However, it isplausible that there is some absorption at these velocitiesfrom the M31 CGM gas that is strongly contaminated bythe Magellanic Stream.In order to learn more about the observed velocity
distribution and determine if there is any similarity, weconsider the dwarf galaxies that are located within theCGM of M31. McConnachie (2012) recently summa-rized the properties of the Local group galaxies, find-ing 23 of them associated with M31. For this compari-son, it is useful to consider a “M31-centric” velocity de-fined as vM31 = vGSR(Obj) − vGSR(M31) cos(θ), wherevGSR = vLSR + 220 sin(l) cos(b) is the velocity of in theGalactic standard-of-rest (GSR) frame and θ the angu-lar separation of the galaxy or QSOs from M31. Thesevelocities are very similar to the vM31 values listed in Ta-ble 2 of McConnachie (2012). Using the positions andradial velocities listed in Table 2 of his paper, we cal-culate the projected distances from M31 following thesame method used for our sample and vM31 for each gascloud in our sample and for each dwarf galaxy in theMcConnachie (2012) sample. We use the projected dis-tances since we do not know the distance of the absorbersin our sample from the M31. However, we stress themembership of each dwarf galaxies with M31 is based ondistances from the sun that are between 525 kpc and 920kpc and within < 2Rvir from M31 (see for more detailMcConnachie 2012).In Fig. 4, the distribution of vM31 as a function of
R/Rvir is shown for the dwarf satellites and the gasseen in absorption at −300 ∼< vLSR ∼< −150 km s−1
(red circles) and −420 ∼< vLSR ∼< −300 km s−1 with−130◦ ≤ lMS ≤ −120◦ (blue circles). The similar ve-locity distribution between the gas and dwarf satellitesin the CGM of M31 is striking, adding more weightthat the absorption features at −300 ∼< vLSR ∼< −150
km s−1 are indeed probing the CGM gas of M31. Thiscomparison also suggests that the absorption features at−420 ∼< vLSR ∼< −300 km s−1 could arise in part fromthe CGM of M31. However, the other properties of thiscomponent are more similar to those seen in the MS; wetherefore treat this possible component of the M31 CGMlargely contaminated by the MS.
3.2.2. Column Densities and Detection Rates versus R
In Fig. 5, we show the total column densities of thecomponents at −300 ∼< vLSR ∼< −150 km s−1 for C II,Si II, Si III, Si IV, C IV, and O VI as a function of theprojected distances from M31, R/Rvir (using the valueslisted in Table 2). For all the species, we observe a de-crease in the column densities as R increases. We stressthat this relationship between N and R seen in all theions is not trivial and is extremely unlikely to happen bychance. In Fig. 6, we show the column densities for thesame component but now as a function of the angularseparation from the LG barycenter (∆θLGB) (where forthe LG barycenter, we use l = 147◦ and b = −25◦ fromEinasto & Lynden-Bell 1982; Blitz et al. 1999). There is

The Circumgalactic Medium of M31 9
Figure 5. Total column density of various ions for the M31 CGMcomponent along each sightline as a function of the impact param-eter. Data with no visible error bars mean the errors are smallerthan the circles. Gray data with downward arrows are 3σ upperlimits. Red data with downward arrows indicate that the absorp-tion is detected in a single transition of a single ion.
no relationship between N and ∆θLGB. Although we donot show it here, there is no trend of N with R in Si IIIand C IV for the component at −430 ∼< vLSR ∼< −300
km s−1 (i.e., the MS component).Using Si III as a sensitive probe of the diffuse
ionized gas (e.g., Collins et al. 2009; Shull et al. 2009;Lehner et al. 2012), Fig. 5 also shows that Si III at−300 ∼< vLSR ∼< −150 km s−1 is detected toward all thesightlines within about Rvir, while only 2 of 11 sight-lines beyond Rvir have a detection of Si III. As we arguein §3.2.1, these two sightlines could be contaminated bythe MS. This abrupt change in the detection rate of M31near Rvir is again a non-trivial property.The simplest interpretation of the decrease in the col-
umn densities and drop in the detection rate with R isthat the absorption seen at −300 ∼< vLSR ∼< −150 km s−1
traces the CGM of M31.
3.2.3. H I Emission and UV Absorption
The CGM of M31 was previously observed in H I
21-cm emission (Thilker et al. 2004; Braun & Thilker
Figure 6. Total column density of various ions for the M31 CGMcomponent along each sightline as a function of the angular dis-tance from the Local Group barycenter. Data with no visible errorbars mean the errors are smaller than the circles. Gray data withdownward arrows are 3σ upper limits. Red data with downwardarrows indicate that the absorption is detected in a single transitionof a single ion.
2004; Westmeier et al. 2005, 2008; Lockman et al. 2012;Wolfe et al. 2013). Several studies have also reportedon the H I observations around M33 that occupies theCGM of M31 (Grossi et al. 2008; Putman et al. 2009).The M31 observations found a concentration of H I
clouds within 50 kpc of M31 at −520 ≤ vLSR ∼< −150
km s−1. For some of these clouds, there is evidencefor interaction with M31 or M33 (Thilker et al. 2004;Putman et al. 2009). Both the spatial and kinematicproperties of the HVC population around M31 stronglysuggest its association with M31 (e.g., Thilker et al.2004; Westmeier et al. 2008).From the tabulated velocity components of the
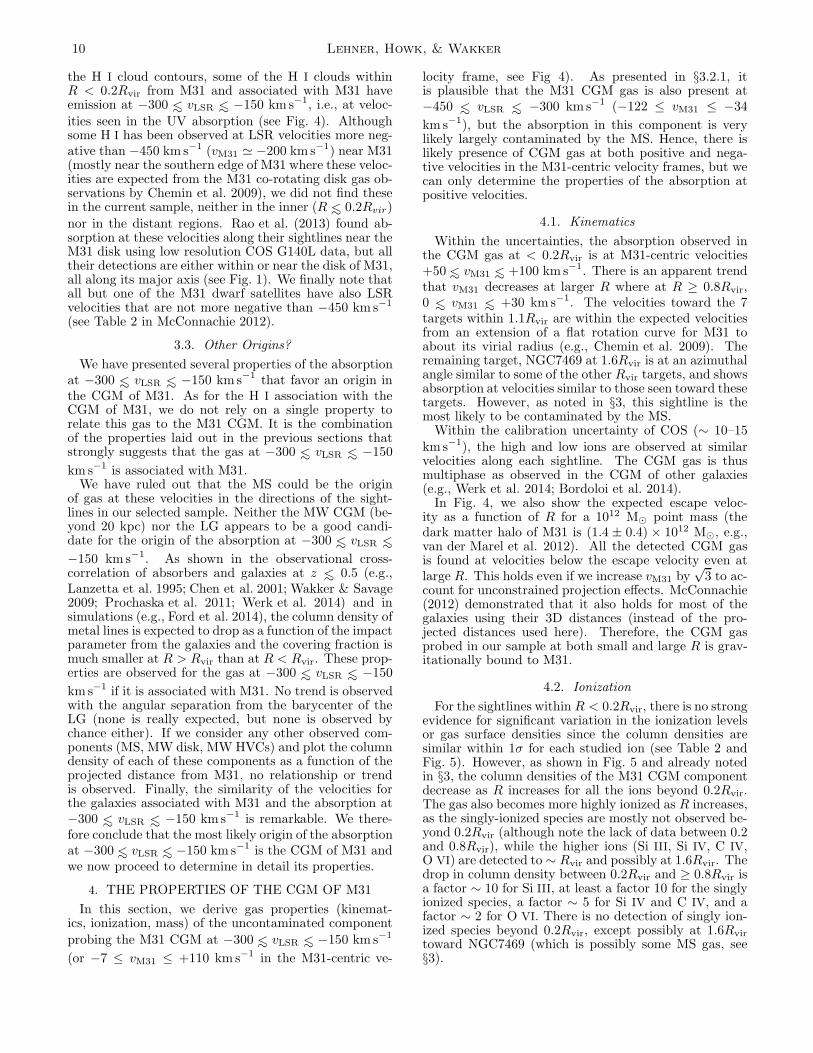
H I emission associated with the CGM of M31 byWestmeier et al. (2008) (R < 0.2Rvir), Lockman et al.(2012), and Wolfe et al. (2013) (R ∼> 0.2Rvir), we esti-mate vM31 and plot them in Fig. 4 with upside-downtriangle symbols. It is apparent that there is also anoverlap in the velocities seen in H I emission and UVabsorption. While none of our sightlines passes within
10 Lehner, Howk, & Wakker
the H I cloud contours, some of the H I clouds withinR < 0.2Rvir from M31 and associated with M31 haveemission at −300 ∼< vLSR ∼< −150 km s−1, i.e., at veloc-ities seen in the UV absorption (see Fig. 4). Althoughsome H I has been observed at LSR velocities more neg-ative than −450 km s−1 (vM31 ≃ −200 km s−1) near M31(mostly near the southern edge of M31 where these veloc-ities are expected from the M31 co-rotating disk gas ob-servations by Chemin et al. 2009), we did not find thesein the current sample, neither in the inner (R ∼< 0.2Rvir)nor in the distant regions. Rao et al. (2013) found ab-sorption at these velocities along their sightlines near theM31 disk using low resolution COS G140L data, but alltheir detections are either within or near the disk of M31,all along its major axis (see Fig. 1). We finally note thatall but one of the M31 dwarf satellites have also LSRvelocities that are not more negative than −450 km s−1
(see Table 2 in McConnachie 2012).
3.3. Other Origins?
We have presented several properties of the absorptionat −300 ∼< vLSR ∼< −150 km s−1 that favor an origin inthe CGM of M31. As for the H I association with theCGM of M31, we do not rely on a single property torelate this gas to the M31 CGM. It is the combinationof the properties laid out in the previous sections thatstrongly suggests that the gas at −300 ∼< vLSR ∼< −150
km s−1 is associated with M31.We have ruled out that the MS could be the origin
of gas at these velocities in the directions of the sight-lines in our selected sample. Neither the MW CGM (be-yond 20 kpc) nor the LG appears to be a good candi-date for the origin of the absorption at −300 ∼< vLSR ∼<−150 km s−1. As shown in the observational cross-correlation of absorbers and galaxies at z ∼< 0.5 (e.g.,Lanzetta et al. 1995; Chen et al. 2001; Wakker & Savage2009; Prochaska et al. 2011; Werk et al. 2014) and insimulations (e.g., Ford et al. 2014), the column density ofmetal lines is expected to drop as a function of the impactparameter from the galaxies and the covering fraction ismuch smaller at R > Rvir than at R < Rvir. These prop-erties are observed for the gas at −300 ∼< vLSR ∼< −150
km s−1 if it is associated with M31. No trend is observedwith the angular separation from the barycenter of theLG (none is really expected, but none is observed bychance either). If we consider any other observed com-ponents (MS, MW disk, MWHVCs) and plot the columndensity of each of these components as a function of theprojected distance from M31, no relationship or trendis observed. Finally, the similarity of the velocities forthe galaxies associated with M31 and the absorption at−300 ∼< vLSR ∼< −150 km s−1 is remarkable. We there-fore conclude that the most likely origin of the absorptionat −300 ∼< vLSR ∼< −150 km s−1 is the CGM of M31 andwe now proceed to determine in detail its properties.
4. THE PROPERTIES OF THE CGM OF M31
In this section, we derive gas properties (kinemat-ics, ionization, mass) of the uncontaminated componentprobing the M31 CGM at −300 ∼< vLSR ∼< −150 km s−1
(or −7 ≤ vM31 ≤ +110 km s−1 in the M31-centric ve-
locity frame, see Fig 4). As presented in §3.2.1, itis plausible that the M31 CGM gas is also present at−450 ∼< vLSR ∼< −300 km s−1 (−122 ≤ vM31 ≤ −34
km s−1), but the absorption in this component is verylikely largely contaminated by the MS. Hence, there islikely presence of CGM gas at both positive and nega-tive velocities in the M31-centric velocity frames, but wecan only determine the properties of the absorption atpositive velocities.
4.1. Kinematics
Within the uncertainties, the absorption observed inthe CGM gas at < 0.2Rvir is at M31-centric velocities+50 ∼< vM31 ∼< +100 km s−1. There is an apparent trendthat vM31 decreases at larger R where at R ≥ 0.8Rvir,0 ∼< vM31 ∼< +30 km s−1. The velocities toward the 7targets within 1.1Rvir are within the expected velocitiesfrom an extension of a flat rotation curve for M31 toabout its virial radius (e.g., Chemin et al. 2009). Theremaining target, NGC7469 at 1.6Rvir is at an azimuthalangle similar to some of the other Rvir targets, and showsabsorption at velocities similar to those seen toward thesetargets. However, as noted in §3, this sightline is themost likely to be contaminated by the MS.Within the calibration uncertainty of COS (∼ 10–15
km s−1), the high and low ions are observed at similarvelocities along each sightline. The CGM gas is thusmultiphase as observed in the CGM of other galaxies(e.g., Werk et al. 2014; Bordoloi et al. 2014).In Fig. 4, we also show the expected escape veloc-
ity as a function of R for a 1012 M⊙ point mass (thedark matter halo of M31 is (1.4 ± 0.4) × 1012 M⊙, e.g.,van der Marel et al. 2012). All the detected CGM gasis found at velocities below the escape velocity even atlarge R. This holds even if we increase vM31 by
√3 to ac-
count for unconstrained projection effects. McConnachie(2012) demonstrated that it also holds for most of thegalaxies using their 3D distances (instead of the pro-jected distances used here). Therefore, the CGM gasprobed in our sample at both small and large R is grav-itationally bound to M31.
4.2. Ionization
For the sightlines within R < 0.2Rvir, there is no strongevidence for significant variation in the ionization levelsor gas surface densities since the column densities aresimilar within 1σ for each studied ion (see Table 2 andFig. 5). However, as shown in Fig. 5 and already notedin §3, the column densities of the M31 CGM componentdecrease as R increases for all the ions beyond 0.2Rvir.The gas also becomes more highly ionized as R increases,as the singly-ionized species are mostly not observed be-yond 0.2Rvir (although note the lack of data between 0.2and 0.8Rvir), while the higher ions (Si III, Si IV, C IV,O VI) are detected to ∼ Rvir and possibly at 1.6Rvir. Thedrop in column density between 0.2Rvir and ≥ 0.8Rvir isa factor ∼ 10 for Si III, at least a factor 10 for the singlyionized species, a factor ∼ 5 for Si IV and C IV, and afactor ∼ 2 for O VI. There is no detection of singly ion-ized species beyond 0.2Rvir, except possibly at 1.6Rvirtoward NGC7469 (which is possibly some MS gas, see§3).

The Circumgalactic Medium of M31 11
The gas is therefore more highly ionized at larger Rthan in the inner region. This can be directly quan-tified using the ratios of several ions of the same ele-ment. At R < 0.2Rvir, we find NCII/NCIV ∼> 2–3 andNSiII ∼ NSiIII ∼ NSiIV; however, at R > 0.8Rvir, we es-timate NCII/NCIV ∼< 1 and NSiII/NSiIV < 0.6. We alsonote that the observed ratio NCIV/NSiIV ∼ 5 throughoutthe CGM of M31 is on the high end of those observedin the MW disk and halo gas (e.g., Lehner et al. 2011;Wakker et al. 2012).We can directly limit the fractional ionization of the
gas by comparing the O I column to the column den-sities of Si II, Si III, and Si IV (Lehner et al. 2001;Zech et al. 2008). O I is an excellent proxy of H I
since they have nearly identical ionization potentials andare strongly coupled through charge exchange reactions(Field & Steigman 1971). O and Si have also the samenucleosynthetic origin (they are both α-elements) andhave similar levels of dust depletion in the diffuse gas(Savage & Sembach 1996; Jenkins 2009). Whereas O I
arises only in neutral gas, Si II is found in both neu-tral and ionized gas and Si III and Si IV arise only inionized gas. Therefore a subsolar ratio of [O I/Si] =log(NOI/NSi) − log(O/Si)⊙ is expected if the ionizationis important.6 Except for HS0033+4300 and UGC12163,the S/N of the data allows us to place stringent limits onthe column density of O I.Using the results listed in Table 2 we find: [O I/Si] <
−1.4 and < −1.1 toward RXJ0048.3+3941 andHS0058+4213 at R < 0.2Rvir, [O I/Si II] < −0.1 to-ward 3C66A at 0.8Rvir, [O I/Si] < −0.6 toward MRK335and < −0.5 toward PG0003+158 at about Rvir, and[O I/Si] < −0.9 toward NGC7469 at 1.6Rvir. This im-plies hydrogen ionization fractions ≥ 93–97% at R <0.2Rvir. It is very likely that the large impact parameterregions are almost entirely ionized too, especially sincethe mixture of gas-phases favors the more highly ionizedphases. However, the weaker absorption at larger R pro-duces less stringent limits on the ionization fraction. TheCGM gas of M31 is therefore mostly ionized toward allthe targets in our sample. It is also more highly ionizedat larger R.The detections of C IV and O VI are also particularly
important since they provide some evidence for ∼ 105 Kgas. It is also an indirect evidence for an extended coronaaround M31 if thermal instabilities in the hot corona areimportant or the high ions are at the interface betweencool and hot gas. For example, thermal instabilities ina hot corona can produce a warm multiphase, extendedCGM if the thermal instability growth time is a factor
∼< 10 times smaller than the free-fall time of the hot gas(McCourt et al. 2012; Sharma et al. 2012). We also notethere is detection of O VI (logNOVI ≃ 13.9–14.1) towardMRK352, PG0052+251, and MRK357 at LSR velocitiesof about −190 km s−1 (see the component marked “LG”in Table 1 of Sembach et al. 2003), possibly consistentwith an origin from the M31 CGM. These targets are at14◦ ∼< RA ∼< 21◦, 23◦ ∼< DEC ∼< 32◦, and probe the M31CGM at 0.4 < R/Rvir < 0.9. They are not in our sam-ple because only FUSE data exist (see §2). Future COS
6 We also note that in regions with significant dust, the gas-phaseO/Si is expected to be supersolar.
observations of these targets would be extremely valu-able to confirm such an interpretation. The hot coronaalso provides an alternative explanation for the existenceof H I clouds in the CGM of M31 to that proposed byWolfe et al. (2013) where they argued that the H I cloudsare embedded in an intergalactic filament.
4.3. Covering fractions
Within Rvir, the covering fraction for Si III and thehigh ions is close to unity. Each sightline shows Si III
absorption from the M31 CGM gas, and hence the cov-ering fraction is 100% (> 70% at the 68% confidencelevel for a sample size of 5) for a 3σ sensitivity limit oflogNSiIII ≃ 12.4 (assuming FHWM≃ 40 km s−1). ForC IV, 4/5 of the sightlines show absorption down to asensitivity of logNCIV ≃ 12.9, which corresponds to acovering fraction of 80% (> 48% at the 68% confidencelevel for a sample size of 5). For O VI, we have only twotargets in the inner-most and outer-most regions, andthey all show O VI absorption associated with the M31CGM gas.Beyond Rvir, the covering fraction for Si III and the
high ions is much smaller in view of the many non-detections. If we a set a 3σ sensitivity limit of logNSiIII ≃12.6 based on the detection of Si III, then the detectionis rate is 10–20% for 1 ∼< R/Rvir ∼< 1.8 (< 35% at the68% confidence level for a sample size of 10). For C IV
with a sensitivity limit of logNCIV ≃ 13.3, the coveringfraction is about 20–30% (< 60% at the 68% confidencelevel for a sample size of 6).For the singly ionized species, the covering fraction is
about 100% for R ≤ 0.2Rvir and ≪ 1 at R ∼> 0.8Rvir (seeFig. 5). It would be critical to gain information between0.2Rvir and 0.8Rvir to determine at which projected dis-tance from M31 the covering fraction of singly ionizedspecies becomes much smaller than 1.
4.4. Metal and Gas Mass
The metal mass of the CGM is independent of themetallicity and can be directly determined from thecolumn densities estimated in Table 2. FollowingPeeples et al. (2014), the mass of metals in the CGM isMZ =
!
2πRΣZ(R)dR. Using Si as a tracer of the met-als, the mass surface density of metals is defined as ΣSi
Z =µ−1Si mSiNSi where µSi = 0.064 is the solar mass fraction
of metals in silicon (i.e., 12 + log(Si/H)⊙ = 7.51 andZ⊙ = 0.0142 from Asplund et al. 2009), mSi = 28mp,and NSi = NSiII + NSiIII + NSiIV. We use Si here be-cause we have information on its 3 dominant ionizationstages in the T < 7 × 10⁴ K ionized gas, requiring noassumptions on the ionization of the cool gas.We first consider the region R < 0.2Rvir where we
noted in §4.2 that the column densities for each ion to-ward the 3 sightlines in this region do not vary much (seeFig. 5). Using the column densities summarized in Ta-ble 2 and averaging the values for Si II, Si III, and Si IVfor sightlines at R < 0.2Rvir, we find ⟨NSi⟩ = 7.4 × 10¹³
cm−2. The mass surface density of metals in the CGMof M31 is then:
logΣSi
Z
M⊙kpc−2= 2.6,
which is similar to the observed range of metal surface

12 Lehner, Howk, & Wakker
densities found for z ∼ 0.2 L∗ galaxies (logΣZ = 3.2–2.0 at R = 26–50 kpc Peeples et al. 2014). Assuminga covering fraction of 100% based on the detections ofSi II, Si III, Si IV in the spectra of the 3 targets in oursample, the CGM metal mass of M31 within R ≤ 0.2Rvir(R ≤ 50 kpc) is
MSiZ = 2.1× 10⁶ M⊙.
This is a factor ∼25 smaller times than the dust mass inthe disk of M31, Md(disk) = 5.4× 10⁷ M⊙ (Draine et al.2014). The corresponding total gas mass of the CGMof M31 within 50 kpc can be estimated from the metalmass as:
Mg = 1435MSi
"Z⊙
Z
#
= 2.9× 10⁹"Z⊙
Z
#
M⊙.
Although we do not know the metallicity Z/Z⊙ of theM31 CGM gas, it is unlikely to be much larger thansolar. For the dense region of the CGM of galaxiesat z ∼< 1, Lehner et al. (2013) found that metallicitiesrange between about ∼< 0.01Z⊙ and ∼ 3Z⊙, the highestmetallicities being associated only with massive outflows(Tripp et al. 2011). In the disk of M31, Sanders et al.(2012) found a scatter between 0.3 ∼< Z/Z⊙ ∼< 4. Thehighest allowed metallicity values could therefore not de-crease the mass by more than a factor ∼ 3–4. On theother hand, the total mass could be much larger if themetallicity is sub-solar. Within 0.2Rvir, the gas massin the CGM of M31 is therefore comparable to that inits disk, since Mg(disk) ≈ 6 × 10⁹ M⊙ using the recentresults from Draine et al. (2014).This mass does not include the more highly ionized
gas traced by O VI and C IV. If we use C IV (whereµC = 0.23, Asplund et al. 2009) and assume an ioniza-tion fraction of fCIV = 0.3 (which is an upper limiton fCIV in collisionally or photoionized gas, see e.g.,Gnat & Sternberg 2007; Oppenheimer & Schaye 2013),we find MCIV
Z ≥ 1.4×10⁶(0.3/fCIV)(R/50 kpc)2 M⊙, i.e.,the highly ionized CGM gas has a similar mass as the coolphotoionized CGM gas.The current sample of sightlines is too small to deter-
mine how the mass changes with radius or azimuth angle.There is also some uncertainty at R ∼> Rvir owing to aplausible contamination from the MS (see §3). Neverthe-less, there is undoubtedly a sharp decrease in the columndensities at R ∼> Rvir compared to R < 0.2Rvir, and thisdrop in N would be even larger if there is some contam-ination from the MS. This is displayed in Fig. 5 for allthe ions and in Fig. 7, where we show the total columndensity of Si (where Si= Si II+Si III+Si IV) as a functionof R/Rvir. For the data at R ≥ 0.8Rvir, the vertical barsinclude the range of possible values if the non-detectionsare either near their 3σ limits or so low as to be negligi-ble (see Table 2 and figures in the Appendix). With noinformation between the inner and outer regions of theCGM, a linear fit provides the simplest model for charac-terizing this observed change in the column density of Siwith R, which yields NSi(R) = 1012.9 (R/Rvir)−0.9 cm−2.This fit is of course poorly constrained and would requiremore data to model accurately N(R) and hence M(R).In Fig. 7, we also overlay the COS-Halos results fromWerk et al. (2014). The experiments that led to theseresults are very different since for COS-Halos, there is
0.1 1.0R/Rvir
12
13
14
15
log
NSi
[cm
−2]
COS−Halos passive galaxiesCOS−Halos star−forming galaxiesAndromeda (M31)
0.1 1.0R/Rvir
12
13
14
15
log
NSi
[cm
−2]
Figure 7. Comparison of the total column density of Si versusthe impact parameters from M31 and the COS-Halos galaxies fromWerk et al. (2014). For the COS-Halos data, the vertical errorbar shows the range allowed by the Cloudy photoionization model(see Werk et al. 2014). For M31, the values of NSi are directlyconstrained by our estimates on NSiII, NSiIII, and NSiIV from theobservations; the error bars are less than the size of the squareand the vertical blue bars at large impact parameters include therange of possible values if the non-detections are either near their3σ limits or so low as to be negligible. The power-law fit from alinear regression analysis to the data is shown as a green dashedline for the COS-Halos sample (with the light beige shaded arearepresenting the 1σ uncertainty in the fit parameters) and a reddashed line for the M31 sample.
one data point per galaxy while there are 7 measure-ments (and more including the non-detections) for M31.Even given this difference, similar trends are observed.The column densities for M31 are systematically on thelow side of the COS-Halos distribution, possibly becausesome of the absorption may be blended, in particular,with the MS absorption, and hence not taken into ac-count in the total column density (see §3.2.1). For ex-ample, making the unreasonable assumption that all theobserved absorption arises from the M31 CGM towardHS0058+4213 at R ∼ 0.2Rvir, we find logNSi > 14.8. Itis quite plausible that the total column density of Si forthe M31 CGM lies between that limit and 13.9 dex, arange of values consistent with COS-Halos.To estimate the mass within the volume at Rvir, we use
the result from our fit to integrateM(R) to Rvir. We findMSi
Z (Rvir) ∼ 1.4 × 10⁷ M⊙ and Mg(Rvir) ∼ 2.1 × 10¹⁰
M⊙. As we saw above, the mass of the highly ionizedgas is about of the same order. It is also likely thatthis represents only a lower limit to the total mass ofthe M31 CGM gas since some of the absorption is likelycontaminated by the Magellanic Stream (see §3.2.1). Asthe stellar mass of M31 is 1011 M⊙ (e.g., Geehan et al.2006; Tamm et al. 2012), the mass of the diffuse weaklyand highly ionized CGM of M31 is therefore a substantialfraction of the total baryonic mass of M31.
5. DISCUSSION
Prior to this work, the CGM of M31 beyondits optical radius has been only explored with deepH I 21-cm emission observations at a sensitivity oflogNHI ≥ 17 (Thilker et al. 2004; Braun & Thilker 2004;Lockman et al. 2012; Wolfe et al. 2013). Within about50 kpc (0.2Rvir), Thilker et al. (2004) found low NHI fil-amentary gas within ∼ 80 km s−1 of M31 systemic veloc-

The Circumgalactic Medium of M31 13
ity, i.e., with a velocity separation similar to that seenin the UV data presented here (see Fig 4). They de-rived a total mass for the H I gas observed through theGBT 9.′1 beam of 3–4 × 10⁷M⊙. At R > 50 kpc, the49′ Westerbork H I survey by Braun & Thilker (2004)suggested a filament of H I gas between M31 and M33,but this structure has dissolved into very small clouds ofdiameters less than a few kpc and masses of a few 105
M⊙ when observed with the GBT (Lockman et al. 2012;Wolfe et al. 2013). While the H I mass is still poorlyconstrained, it is evident the mass of the M31 CGM isdominated by the diffuse ionized gas (see §4.4). Oursample is still small within Rvir, but each sightline withits pencil beam shows detection of M31 CGM gas for atleast Si III, with most showing absorption from multipleions (Si II, Si III, Si IV, C II, C IV, O VI). It would be ofcourse important to fill the radial and azimuthal spaceswith more COS observations of QSOs behind the CGMof M31 in order to confirm these results and more ac-curately characterize its physical structure. Neverthelessthe present observations provide already strong evidencethat the CGM of M31 is filled with multiphase, diffuseionized gas (see §4.3). We do not detect any O I ab-sorption in any of the QSO spectra piercing the CGM ofM31, which puts stringent limits on the ionization level,H II/H I∼> 93–97% (see §4.2), consistent with the smallcovering fraction of H I detectable with 21-cm emissionobservations. Although deep H I emission observationswith logNHI > 17 reveal only the tip of the iceberg ofthe CGM, it will be critical that future radio H I surveyscan achieve this type of sensitivity with a good angularresolution in order to bring to light the spatial distribu-tion of the H I gas beyond the optical radii of galaxies.The present COS UV sample provides therefore the firststrong evidence in the LG for CGM gas beyond 50 kpc(see Lehner et al. 2012).As displayed in Fig. 3, the associated components with
the CGM of M31 are found at −300 ∼< vLSR ∼< −150
km s−1 (−7 ≤ vM31 ≤ +110 km s−1). As shown inFig. 4, the comparison with the velocity distribution ofthe dwarf satellites suggests that some of the absorp-tion observed at −121 ≤ vM31 ≤ −34 km s−1 (−450 ∼<vLSR ∼< −300 km s−1) is a mixture of the MS and M31CGM components, where the absorption is dominatedby the MS (see §3.2.1). We also find that
√3vM31 < vesc
(see Fig. 4 and §4.1), implying that the gas is bound toM31 even at large R.These results could suggest that the CGM of the MW
might be similarly large, but to characterize it will bedifficult, since in view of our findings for the M31 CGM,the MW CGM absorption may also be dominated bylow-velocity halo clouds (LVHCs, |vLSR| ∼< 90 km s−1),where the absorption is strongly blended with the MWdisk and low halo. Except for the MS, most of theHVCs and iHVCs have been indeed found to be within5–15 kpc (see, e.g., Thom et al. 2008; Wakker et al.2008; Lehner & Howk 2011; Lehner et al. 2012, and alsoRichter 2012 who found a characteristic radial extent of50 kpc for the H I HVCs of the MW and M31 usinga model with a radial exponential decline of the meanH I volume-filling factor). The LVHCs may be the bestcandidate for an extended MW CGM (Peek et al. 2009),
along with some of the very high-velocity clouds not as-sociated with the MS (Lehner et al. 2012).We determine that the baryonic mass of the weakly
and highly ionized CGM gas of M31 is at least about30% of the total baryonic mass of M31 (see §4.4), butthis does not include the hot ≥ 106 K CGM coronalcomponent. The ubiquitous detection of high ions in oursample suggests the presence of hot (> 106 K) diffuse gassurrounding M31 within its virial radius and possibly be-yond (see §4.2) if the production mechanisms of the highions are dominated by thermal instabilities in the hotcorona or interfaces between the cool (Si II, Si III) andputative hot gas (see §4.2). In cosmological simulations,substantial amounts of O VI are produced through colli-sional ionization in the CGM of galaxies as it transistionsfrom cooling of hot gas (Oppenheimer et al. 2012; Cen2013; Ford et al. 2013, 2014), although some of the O VI
could be photoionized in very low densities at impact pa-rameters ≥ 100 kpc (≥ 1/3Rvir) (Ford et al. 2014). Cen(2013) show that collisional ionization dominates the pro-duction of strong (NOVI > 1014 cm−2) O VI absorbers.For M31 we only find NOVI < 1014 cm−2 beyond Rvir(see Fig. 5 and §4.2).The hot galaxy coronae are one of the fundamental pre-
dictions of galaxy formation models (White & Rees 1978;White & Frenk 1991), but their direct detection has beenvery difficult. Progress has been made recently with thedetection of diffuse X-ray emission that appears to ex-tend to about 30–70 kpc around a handful of massive,non-starbursting galaxies (Anderson & Bregman 2011;Bogdan et al. 2013a,b) or in stacked images of galaxies(Anderson et al. 2013). The mass estimate for these hothalos at these radii are about a few times 109 M⊙, whichis comparable to the mass found in the cooler (< 105
K) gas of the CGM of M31 (see §4.4), and hence the to-tal mass of the CGM of M31 including all the gas-phasescould be as large as∼ 1010 M⊙ within 50 kpc. Beyond 50kpc, the CGM is too diffuse to be traced with X-ray imag-ing, even though a large mass could be present. Extrap-olating to about the virial radius, Anderson & Bregman(2011) estimate that the hot halo mass of the massive spi-ral galaxy NGC1961 might be about 1011 M⊙ (the stellarmass of NGC1961 is ∼ 3 times that of M31), a factor 5larger than the mass of the cool CGM of M31 for thevolume within Rvir (see §4.4). For the MW, Gupta et al.(2012) argue that the mass of the 2× 10⁶ K CGM out to160 kpc could be as high as 1011 M⊙. However, there isstill a large disagreement on the interpretation of the X-ray observations and their implications for an extendedhot MW CGM (Gupta et al. 2012, 2014; Wang & Yao2012; Henley & Shelton 2014; Sakai et al. 2014). Themost recent estimate for the MW implies a smaller massfor the 2 × 10⁶ K MW CGM gas of about 4× 10¹⁰ M⊙
within 50 or 240 kpc (Miller & Bregman 2015). Basedon these X-ray observations, a substantial mass of theM31 CGM could also be present in its hot (> 106 K)diffuse corona.Our results echo the findings from the COS-Halos sur-
vey of L∗ galaxies at z ∼ 0.2 (Tumlinson et al. 2011;Werk et al. 2013, 2014; Peeples et al. 2014). In Figs. 7and 8, we reproduce two COS-Halos figures with our M31results included. Fig. 7 was already presented in §4.4,which shows a similar distribution for NSi as a function

14 Lehner, Howk, & Wakker
10−13 10−12 10−11 10−10 10−9
sSFR [yr−1]
13
14
15
log
NO
VI [
cm−2]
Andromeda (M31)COS−Halos star−forming galaxiesCOS−Halos passive galaxies
10−13 10−12 10−11 10−10 10−9
sSFR [yr−1]
13
14
15
log
NO
VI [
cm−2]
Figure 8. Comparison of the total column density of O VI versusthe specific star-formate rate of the galaxy between M31 and theCOS-Halos program (Tumlinson et al. 2011). For M31, we onlyconsider the sightline with R = 25 kpc since the COS-Halos tar-geted galaxies with R ≤ 150 kpc.
of R/Rvir between the COS-halos and the present study,which implies similar masses for their cool (probed bySi II, Si III, Si IV) and warm-hot (probed by C IV andO VI) ionized CGM. The typical dark matter halos ofthe COS-Halos galaxies is 1012 M⊙, similar to M31 (e.g.,van der Marel et al. 2012). In Fig. 8, we show NOVIagainst the specific star-formation rate of the COS-Halosgalaxies and M31.7 M31 is right between the COS-Halospassively-evolving and star-forming galaxies where star-forming systems have typically logNOVI ∼> 14.3. Thecolumn density of O VI through the M31 CGM is there-fore consistent with the transition observed between theCOS-Halos passively-evolving and star-forming galax-ies, providing additional evidence – independent of thatbased on its colors – that M31 might be indeed transi-tioning from a blue to a red galaxy (Mutch et al. 2011;Dalcanton et al. 2012). We emphasize that although themass and luminosity of M31 are comparable to the COS-Halos galaxies, their environments might be quite differ-ent: M31 lives in a galaxy environment with close bycompanions (M32, M33, MW, etc.) while the COS-halosgalaxies were selected to be fairly isolated. The influenceof the MW (750 kpc from M31) on the CGM within 300kpc of M31 may be thus be relatively small. While theM31 CGM has properties similar to other L∗ galaxies, wefind CGM masses at least about 5–6 times larger than es-timated for the sub-L∗ galaxies at z ∼ 0 (Bordoloi et al.2014).The origin of this diffuse ionized CGM gas is an
open question. The distribution and composition ofthe CGM gas have been addressed in several high-resolution cosmological hydrodynamic simulations withvarious level of star formation and feedback prescriptions(e.g., Klypin et al. 2002; Joung et al. 2012; Cen 2013;Nuza et al. 2014; Ford et al. 2014). Notably, despite thevarious treatments and different levels of the feedback inthese simulations, there is some agreement regarding thedistribution of the baryons in the CGM between these
7 As for Si, the total amount of O VI could be larger if some ofthe O VI absorption of the CGM of M31 is blended with the MS orthe MW. However, for O VI, the total column would only increaseby about 0.3 dex.
simulations and with our empirical results as we nowoutline.One of the basic requirement of all these simulations
is that a large fraction of the baryons are in the CGM ofgalaxies. For example, the ΛCDM-models of the Milkyand M31 by Klypin et al. (2002) requires that 1/4 to1/2 of the baryons within the virial radius of the halomust not be in the disk or bulge of the MW and M31in the absence of any feedback, which is consistent withour empirical results (see §4.4). Cen (2013) predicts thatover half of the gas mass within 150 kpc of red or bluegalaxies is in the cool phase of the CGM. Nuza et al.(2014) studied the gas properties in the CGM of MW andM31 analogs using a cosmological simulation of the LG.They find masses for the cool CGM within 0.2Rvir andRvir that are consistent with our results. The coveringfraction of the CGM gas with logNHI > 15 (i.e., tracingsome of the ionized gas reported in our work) in theirsimulation appears also to be broadly consistent withour observations, being close to 1 at R ∼< 0.4Rvir andthen progressively decreasing to ∼< 0.3 at R ∼> Rvir. Itis worth noting also that in their simulation as well asthe more general simulations of galaxies at z ∼ 0 (e.g.,Cen 2013; Ford et al. 2014), the cool CGM dominates themass of the CGM within 0.2Rvir (by a factor ∼ 4 relativeto the mass of the hot gas), but there is a turnover atlarger radii where at Rvir the mass of the hot gas is afactor 3 larger than the mass of the cool gas. Whilewe cannot observe the hot gas associated with the CGMof M31, we find that the gas becomes more ionized andmore highly ionized at R > 0.8Rvir than at R < 0.2Rvir(see §4.2). Ford et al. (2014) specifically investigated thedistribution of similar ions studied in our work and findthat the covering fractions of the low (e.g., C II) andhigh (C IV, O VI) ions are all typically high (near 100%)at R < 0.2Rvir and drops much more rapidly at higherimpact parameter for the low ions than the high ions,again consistent with our empirical results (see §4). Thesimilarity in the distribution of the column densities ofC IV and Si IV with R in the simulations of Ford et al.(2014) (see their Fig. 7) and our observations (see Fig. 5)is striking, with a comparable trend and magnitude in thevariation of N with R (only C IV and Si IV are commonin both studies).In the Nuza et al. and Ford et al. cosmological sim-
ulations, the CGM gas belongs to the ambient mediumrather than being associated with satellites. Ford et al.(2014) also show most of the metal mass comes from re-cycled accretion at any R (i.e., gas that was once ejectedin a wind at least once before), but this is different forthe baryons where if the total mass at R < 0.2Rvir islargely dominated by recycled accretion, at R > 0.2Rvirthe ambient gas (i.e., gas is not going to accrete onto agalaxy and that have never been in a wind by z ∼ 0)dominates the total mass.This comparison between cosmological models and our
observations is extremely encouraging and demonstratesthat a larger sample of targets observed with COS thatpopulate in particular the 0.2 ≤ R/Rvir ∼< 1 region ofthe M31 CGM would make M31 a perfect testbed fortheories of galaxy formation and evolution. With ourpresent sample, we cannot accurately assess how the sur-faces densities of the different ions change with R (with

The Circumgalactic Medium of M31 15
an absence of data points at 0.2 < R/Rvir < 0.8) orazimuthal angle (e.g., to determine how the surface den-sities and kinematics vary along the major and minorprojected axes of M31). This would also help us to bet-ter understand the origins of the metals and baryons inthe CGM of M31.
6. SUMMARY
With HST/COS G130M and G160M and FUSEarchival observations, we compile a sample of 18 sight-lines that pierce the CGM of M31, 3 at small (R <0.2Rvir) and 15 at large (0.8 ≤ R/Rvir ∼< 2) projecteddistances to determine the properties of the CGM at var-ious radii. Along these sightlines, the gas seen in absorp-tion at −300 ∼< vLSR ∼< −150 km s−1 in the 3/3 inner-region sightlines and in 4/15 outer-region sightlines isneither associated with the MW (its disk or CGM) norwith the MS. These velocities are about 40–90 km s−1
from the systemic velocity of M31. Only for this com-ponent do we observe a non-trivial relationship betweenthe column densities of the observed ions (Si II, Si III,Si IV, C II, C IV, O VI) and the projected distance fromM31 whereby N decreases with R. These and other ar-guments presented in §3 imply that the absorption at−300 ∼< vLSR ∼< −150 km s−1 observed in the directionsprobed by our selected sightlines must in all likelihoodarise from the CGM of the M31. We determine the fol-lowing properties for the CGM of M31 traced by thisabsorption:
1. The M31 CGM gas is observed at similar velocitiesto that of the satellites galaxies located in the CGMof M31. These velocities are small enough relativeto the escape velocity to conclude that the observedCGM gas is gravitationally bound even at large R.
2. Low (Si II, C II), intermediate (Si III), and highions (Si IV, C IV) are all observed in absorptiontoward the 3 sightlines at R < 0.2Rvir, while typ-ically only Si III and high ions are observed atR ≥ 0.8Rvir. The CGM gas of M31 is thereforemore highly ionized at larger projected distances.
3. Within Rvir, the covering fraction for Si III and thehigh ions is close to unity. Beyond Rvir, the cov-ering fraction for Si III and the high ions drops to< 20%. For the singly ionized species, the coveringfraction is about 100% for R ≤ Rvir and ≪ 1 atR ∼> 0.8Rvir.
4. With sensitive limits on the column density O I
and its comparison to the total column density ofSi (Si II+Si III+Si IV), we show that the CGMof M31 is predominantly ionized (∼> 95%). TheM31 CGM gas is therefore multiphase, dominantlyionized (i.e., H II≫H I), and becomes more highlyionized gas at larger R. The presence of a largeamount of multiphase gas suggests that M31 hasvery likely a hot corona extending all the way toRvir and possibly beyond.
5. We derive using Si II, Si III, and Si IV a CGMmetalmass of 2.1×10⁶ M⊙ and gas mass of 3×10⁹ (Z⊙/Z)M⊙ within 0.2Rvir, implying a substantial mass of
metal and gas within 0.2Rvir. In the volume withinRvir, we estimate MSi ∼ 1.4 × 10⁷ M⊙ and Mg ∼2.1× 10¹⁰ M⊙; there is, however, a substantial un-certainty in the masses estimated at Rvir given thelack of observations between 0.2 ≤ R/R ≤ 0.8.The highly ionized CGM gas of M31 probed byC IV (and O VI) have most likely similar masses.The baryonic mass of the weakly and highly ion-ized CGM gas of M31 is about 30% of the totalbaryonic mass of M31 (not including the hot ≥ 106
K CGM coronal gas).
6. The above conclusions imply that M31 has an ex-tended, massive, multiphase CGM as observed inhigher redshift L∗ galaxies. With the current data,there is a broad agreement between our empiri-cal results and recent cosmological simulations interms of baryonic mass and change in the ionizationlevels with projected distances. However, a largersample will be critical to determine the propertiesin the 0.2 ∼< R/Rvir < 1 range where currentlythere is no information. Despite an environmentthat is different from the isolated galaxies in theCOS-Halos survey, the properties of the CGM ofM31 is fairly typical of a L∗ disk galaxy that mightbe transitioning from a blue to red galaxy.
ACKNOWLEDGEMENTS
We thank Jason Tumlinson and Jessica Werk for shar-ing the COS-Halos data and the IDL codes that helpedproducing Figs. 7 and 8. We thank Kate Rubin, MaryPutman, Filippo Fraternali, Prateek Sharma, DavidValls-Gabaud, and Daniel Wang for useful suggestionsand discussions and the anonymous referee for providingfeedback, which helped us to improve the content andclarity of our manuscript. NL and JCH acknowledge sup-port for this research provided by National Science Foun-dation under grant no. AST-1212012 and NASA throughgrants HST-GO-12604, HST-AR-12854, and HST-GO-12982 from the Space Telescope Science Institute, whichis operated by the Association of Universities for Re-search in Astronomy, Incorporated, under NASA con-tract NAS5-26555. BPW acknowledges support fromthe National Science Foundation under grant no. AST-1108913 and NASA through grant HST-GO-12604 fromthe Space Telescope Science Institute. All of the datapresented in this paper were obtained from the MikulskiArchive for Space Telescopes (MAST). STScI is operatedby the Association of Universities for Research in As-tronomy, Inc., under NASA contract NAS5-26555. Thisresearch has made use of the NASA’s Astrophysics DataSystem Abstract Service and the SIMBAD database, op-erated at CDS, Strasbourg, France.
REFERENCES
Anderson, M. E., & Bregman, J. N. 2011, ApJ, 737, 22Anderson, M. E., Bregman, J. N., & Dai, X. 2013, ApJ, 762, 106Asplund, M., Grevesse, N., Sauval, A. J., & Scott, P. 2009,
ARA&A, 47, 481Barger, K. A., Lehner, N., & Howk, J. C. 2014, ApJ, submittedBesla, G., Kallivayalil, N., Hernquist, L., et al. 2012, MNRAS,
421, 2109Blitz, L., Spergel, D. N., Teuben, P. J., Hartmann, D., & Burton,
W. B. 1999, ApJ, 514, 818Bogdan, A., Forman, W. R., Kraft, R. P., & Jones, C. 2013a,
ApJ, 772, 98

16 Lehner, Howk, & Wakker
Bogdan, A., Forman, W. R., Vogelsberger, M., et al. 2013b, ApJ,772, 97
Bordoloi, R., Tumlinson, J., Werk, J. K., et al. 2014, ApJ, 796,136
Braun, R., & Thilker, D. A. 2004, A&A, 417, 421Brown, T. M., Smith, E., Ferguson, H. C., et al. 2006, ApJ, 652,
323Bruns, C., Kerp, J., Staveley-Smith, L., et al. 2005, A&A, 432, 45Cen, R. 2013, ApJ, 770, 139Chemin, L., Carignan, C., & Foster, T. 2009, ApJ, 705, 1395Chen, H.-W., Helsby, J. E., Gauthier, J.-R., et al. 2010, ApJ, 714,
1521Chen, H.-W., Lanzetta, K. M., & Webb, J. K. 2001, ApJ, 556, 158Churchill, C. W., Kacprzak, G. G., Steidel, C. C., et al. 2012,
ApJ, 760, 68Clemens, D. P. 1985, ApJ, 295, 422Collins, J. A., Shull, J. M., & Giroux, M. L. 2009, ApJ, 705, 962Dalcanton, J. J., Williams, B. F., Lang, D., et al. 2012, ApJS,
200, 18Davidge, T. J., McConnachie, A. W., Fardal, M. A., et al. 2012,
ApJ, 751, 74Dekel, A., & Birnboim, Y. 2006, MNRAS, 368, 2Draine, B. T., Aniano, G., Krause, O., et al. 2014, ApJ, 780, 172Einasto, J., & Lynden-Bell, D. 1982, MNRAS, 199, 67Faucher-Giguere, C.-A., & Keres, D. 2011, MNRAS, 412, L118Field, G. B., & Steigman, G. 1971, ApJ, 166, 59Ford, A. B., Oppenheimer, B. D., Dave, R., et al. 2013, MNRAS,
432, 89Ford, A. B., Dave, R., Oppenheimer, B. D., et al. 2014, MNRAS,
444, 1260Fox, A. J., Richter, P., Wakker, B. P., et al. 2013, ApJ, 772, 110Fox, A. J., Savage, B. D., & Wakker, B. P. 2006, ApJS, 165, 229Fox, A. J., Wakker, B. P., Barger, K. et al. 2014, ApJ, 787, 147Garrison-Kimmel, S., Boylan-Kolchin, M., Bullock, J. S., & Lee,
K. 2014, MNRAS, 438, 2578Geehan, J. J., Fardal, M. A., Babul, A., & Guhathakurta, P.
2006, MNRAS, 366, 996Gilbert, K. M., Guhathakurta, P., Beaton, R. L., et al. 2012,
ApJ, 760, 76Gilbert, K. M., Kalirai, J. S., Guhathakurta, P., et al. 2014, ApJ,
796, 76Gnat, O., & Sternberg, A. 2007, ApJS, 168, 213Gordon, K. D., Bailin, J., Engelbracht, C. W., et al. 2006, ApJ,
638, L87Green, J. C., Froning, C. S., Osterman, S., et al. 2012, ApJ, 744,
60Grossi, M., Giovanardi, C., Corbelli, E., et al. 2008, A&A, 487,
161Gupta, A., Mathur, S., Galeazzi, M., & Krongold, Y. 2014,
Ap&SS, 352, 775Gupta, A., Mathur, S., Krongold, Y., Nicastro, F., & Galeazzi,
M. 2012, ApJ, 756, LL8Henley, D. B., & Shelton, R. L. 2014, ApJ, 784, 54Howk, J. C., Savage, B. D., Sembach, K. R., & Hoopes, C. G.
2002, ApJ, 572, 264Jenkins, E. B. 2009, ApJ, 700, 1299Joung, M. R., Putman, M. E., Bryan, G. L., Fernandez, X., &
Peek, J. E. G. 2012, ApJ, 759, 137Kacprzak, G. G., Churchill, C. W., Steidel, C. C., Spitler, L. R.,
& Holtzman, J. A. 2012, MNRAS, 427, 3029Kacprzak, G. G., Martin, C. L., Bouche, N., et al. 2014, ApJ,
792, LL12Kalberla, P. M. W., Burton, W. B., Hartmann, D., et al. 2005,
A&A, 440, 775Kang, Y., Bianchi, L., & Rey, S. 2009, ApJ, 703, 614Keeney, B. A., Stocke, J. T., Rosenberg, J. L., et al. 2013, ApJ,
765, 27Keres, D., Katz, N., Weinberg, D. H., & Dave, R. 2005, MNRAS,
363, 2Klypin, A., Zhao, H., & Somerville, R. S. 2002, ApJ, 573, 597Lanzetta, K. M., Bowen, D. V., Tytler, D., & Webb, J. K. 1995,
ApJ, 442, 538Lehner, N., & Howk, J. C. 2007, MNRAS, 377, 687Lehner, N., & Howk, J. C. 2010, ApJ, 709, L138Lehner, N., & Howk, J. C. 2011, Science, 334, 955Lehner, N., Howk, J. C., Keenan, F. P., & Smoker, J. V. 2008,
ApJ, 678, 219Lehner, N., Howk, J. C., Thom, C., et al. 2012, MNRAS, 424,
2896Lehner, N., Howk, J. C., Tripp, T. M., et al. 2013, ApJ, 770, 138Lehner, N., Keenan, F. P., & Sembach, K. R. 2001, MNRAS, 323,
904Lehner, N., Staveley-Smith, L., & Howk, J. C. 2009, ApJ, 702, 940Lehner, N., Zech, W. F., Howk, J. C., & Savage, B. D. 2011, ApJ,
727, 46Liang, C. J., & Chen, H.-W. 2014, MNRAS, 445, 2061Lockman, F. J., Free, N. L., & Shields, J. C. 2012, AJ, 144, 52
McConnachie, A. W. 2012, AJ, 144, 4McConnachie, A. W., Irwin, M. J., Ibata, R. A., et al. 2009,
Nature, 461, 66McCourt, M., Sharma, P., Quataert, E., & Parrish, I. J. 2012,
MNRAS, 419, 3319Miller, M. J., & Bregman, J. N. 2015, ApJ, 800, 14Moos, H. W., Cash, W. C., Cowie, L. L., et al. 2000, ApJ, 538, L1Morton, D. C. 2003, ApJS, 149, 205Mutch, S. J., Croton, D. J., & Poole, G. B. 2011, ApJ, 736, 84Nidever, D. L., Majewski, S. R., & Burton, W. B. 2008, ApJ, 679,
432Nuza, S. E., Parisi, F., Scannapieco, C., et al. 2014, MNRAS,
submitted arXiv:1403.7528Oppenheimer, B. D., Dave, R., Katz, N., Kollmeier, J. A., &
Weinberg, D. H. 2012, MNRAS, 420, 829Oppenheimer, B. D., & Schaye, J. 2013, MNRAS, 434, 1043Peek, J. E. G., Heiles, C., Putman, M. E., & Douglas, K. 2009,
ApJ, 692, 827Peeples, M. S., Werk, J. K., Tumlinson, J., et al. 2014, ApJ, 786,
54Penton, S. V., Stocke, J. T., & Shull, J. M. 2002, ApJ, 565, 720Prochaska, J. X., Weiner, B., Chen, H.-W., Mulchaey, J., &
Cooksey, K. 2011, ApJ, 740, 91Putman, M. E., Gibson, B. K., Staveley-Smith, L., et al. 1998,
Nature, 394, 752Putman, M. E., Peek, J. E. G., & Joung, M. R. 2012, ARA&A,
50, 491Putman, M. E., Peek, J. E. G., Muratov, A., et al. 2009, ApJ,
703, 1486Rao, S. M., Sardane, G., Turnshek, D. A., et al. 2013, MNRAS,
432, 866Richter, P. 2012, ApJ, 750, 165Riess, A. G., Fliri, J., & Valls-Gabaud, D. 2012, ApJ, 745, 156Ryans, R. S. I., Keenan, F. P., Sembach, K. R., & Davies, R. D.
1997, MNRAS, 289, 83Sakai, K., Yao, Y., Mitsuda, K., et al. 2014, PASJ, 66, 83Sanders, N. E., Caldwell, N., McDowell, J., & Harding, P. 2012,
ApJ, 758, 133Savage, B. D., & Sembach, K. R. 1991, ApJ, 379, 245Savage, B. D., & Sembach, K. R. 1996, ARA&A, 34, 279Savage, B. D., Sembach, K. R., Wakker, B. P., et al. 2003, ApJS,
146, 125Sembach, K. R., Wakker, B. P., Savage, B. D., et al. 2003, ApJS,
146, 165Sharma, P., McCourt, M., Quataert, E., & Parrish, I. J. 2012,
MNRAS, 420, 3174Shull, J. M. 2014, ApJ, 784, 142Shull, J. M., Jones, J. R., Danforth, C. W., & Collins, J. A. 2009,
ApJ, 699, 754Smoker, J. V., Fox, A. J., & Keenan, F. P. 2011, MNRAS, 415,
1105Spitzer, L., Jr. 1956, ApJ, 124, 20Stanimirovic, S., Dickey, J. M., Krco, M., & Brooks, A. M. 2002,
ApJ, 576, 773Stocke, J. T., Keeney, B. A., Danforth, C. W., et al. 2013, ApJ,
763, 148Tamm, A., Tempel, E., Tenjes, P., Tihhonova, O., & Tuvikene, T.
2012, A&A, 546, A4Thilker, D. A., Braun, R., Walterbos, R. A. M., et al. 2004, ApJ,
601, L39Thom, C., Peek, J. E. G., Putman, M. E., et al. 2008, ApJ, 684,
364Thom, C., Putman, M. E., Gibson, B. K., et al. 2006, ApJ, 638,
L97Thom, C., Tumlinson, J., Werk, J. K., et al. 2012, ApJ, 758, LL41Thom, C., Werk, J. K., Tumlinson, J., et al. 2011, ApJ, 736, 1Tripp, T. M., Meiring, J. D., Prochaska, J. X., et al. 2011,
Science, 334, 952Tumlinson, J., Thom, C., Werk, J. K., et al. 2011, Science, 334,
948Tumlinson, J., Thom, C., Werk, J. K., et al. 2013, ApJ, 777, 59van der Marel, R. P., Fardal, M., Besla, G., et al. 2012, ApJ, 753,
8Wakker, B. P. 2001, ApJS, 136, 463Wakker, B. P. 2006, ApJS, 163, 282Wakker, B. P., & Savage, B. D. 2009, ApJS, 182, 378Wakker, B. P., Savage, B. D., Fox, A. J., Benjamin, R. A., &
Shapiro, P. R. 2012, ApJ, 749, 157Wakker, B. P., Savage, B. D., Sembach, K. R., et al. 2003, ApJS,
146, 1Wakker, B. P., York, D. G., Howk, J. C., et al. 2007, ApJ, 670,
L113Wakker, B. P., York, D. G., Wilhelm, R., et al. 2008, ApJ, 672,
298Walterbos, R. A. M., & Kennicutt, R. C., Jr. 1987, A&AS, 69, 311Wang, Q. D., & Yao, Y. 2012, arXiv:1211.4834Westmeier, T., Braun, R., & Thilker, D. 2005, A&A, 436, 101

The Circumgalactic Medium of M31 17
Westmeier, T., Bruns, C., & Kerp, J. 2008, MNRAS, 390, 1691Werk, J. K., Prochaska, J. X., Thom, C., et al. 2013, ApJS, 204,
17Werk, J. K., Prochaska, J. X., Tumlinson, J., et al. 2014, ApJ,
submitted [arXiv:1403.0947]White, S. D. M., & Rees, M. J. 1978, MNRAS, 183, 341
White, S. D. M., & Frenk, C. S. 1991, ApJ, 379, 52Wolfe, S. A., Pisano, D. J., Lockman, F. J., McGaugh, S. S., &
Shaya, E. J. 2013, Nature, 497, 224Zech, W. F., Lehner, N., Howk, J. C., Dixon, W. V. D., & Brown,
T. M. 2008, ApJ, 679, 460
APPENDIX
In this appendix, we show all the absorption profilesused in this work as well as describe in detail each lineof sight. Figs. A1 to A18 show the HST/COS and FUSEabsorption-line normalized profiles for the 18 QSO tar-gets in the sample, sorted by increasing projected dis-tances from the center of M31. The red region in eachspectrum shows the component that is associated withthe CGM of M31 (see §3). Absorption at vLSR > −150km s−1 is associated with the MW disk and halo. Whendetected, the absorption at −430 ∼< vLSR ∼< −300 km s−1
is typically associated with the MS. We now give someadditional information on the observed HVC componentsvLSR ∼< −170 km s−1 (i.e., here defined as the gas that isnot part of the Milky disk or halo) for each sightline.- RXJ0048.1+3941: In Fig. A1, we show its normalized
profiles. HVCs are observed at LSR velocities centeredon −380,−325 km s−1 that we associate with the MSextension and −242,−182 km s−1 that we associate withthe M31 CGM. We estimate the total column densities oftwo velocity-components at −242 and −182 km s−1 forthe M31 CGM component. Absorption is observed forall the ions but O I in the M31 CGM component.- HS0033+4300: In Fig. A2, we show its normalized
profiles. HVCs are observed at LSR velocities centeredon −375 km s−1 that we associate with the MS extensionand −204 km s−1 that we associate with the M31 CGM.In the M31 CGM component, there might be more than1 component, but the S/N is too low to discern the exactvelocity structure. Absorption is observed for all the ionsbut O I in the M31 CGM component.- HS0058+4213: In Fig. A3, we show its normalized
profiles. An HVC is observed at LSR velocity centeredon −211 km s−1 that we associate with the M31 CGM.In the M31 CGM component, there might be more than1 component, but the S/N is too low to discern the ex-act velocity structure. No absorption at more negativevelocity is observed. Absorption is observed for all theions but O I in the M31 CGM component.- 3C66A: In Fig. A4, we show its normalized pro-
files. An HVC is observed at LSR velocity centered on−256 km s−1 that we associate with the M31 CGM. Ab-sorption is only observed in Si II λ1206 at nearly 7σ(Wλ = 57.1 ± 8.4 mA). Because it is observed in onlyone transition, we report the column density as a lowerlimit to emphasize that this absorption could be contam-inated by an unrelated absorber.- PG0003+158: In Fig. A6, we show its normalized
profiles (C II λ1334 is not shown because it is heavilycontaminated by unrelated absorbers). Several HVCsare observed at vLSR = −390,−325 km s−1 that we asso-ciate with the possible MS extension and at −232 km s−1
that we associate with the M31 CGM. In the M31 CGMcomponent, no O I or singly ionized species are detected.
- UGC12163: In Fig. A7, we show its normalizedprofiles. Several HVCs are observed in several ions atvLSR = −428,−325 km s−1 that we associate with thepossible MS extension. Absorption at −274 km s−1 isonly observed in O VI λ1031 that we associate with theM31 CGM. In this case there is no evidence for MWor MS O VI absorption along this sightline, and henceO VI is not blended as seen in other sightlines. However,because it is observed in only one transition, we reportthe column density as a lower limit to emphasize thatthis absorption could be contaminated by an unrelatedabsorber.- MRK1502: In Fig. A8, we show its normalized pro-
files where no HVC absorption is observed at the 3σ level.- MRK1501: In Fig. A9, we show its normalized pro-
files where no HVC absorption is observed at the 3σ level,but we note the S/N is very low in Si II, Si III, and Si IV.- SDSSJ015952.95+134554.3: In Fig. A10, we show its
normalized profiles where no HVC absorption is observedat the 3σ level.- 3C454.3: In Fig. A11, we show its normalized pro-
files where no HVC absorption is observed at the 3σ levelbetween −300 and −150 km s−1. There is a strong ab-sorption centered at −380 km s−1 that we associate withthe MS.- SDSSJ225738.20+134045.0: In Fig. A12, we show
its normalized profiles where no absorption is observedat the 3σ level between −300 and −150 km s−1. Thereis a strong absorption centered at −360 km s−1 that weassociate with the MS.- NGC7469: In Fig. A13, we show its normalized pro-
files. HVCs are observed at LSR velocities centeredon −330 km s−1 that we associate with the MS and−239 km s−1 that we associate with the M31 CGM.We note that an additional HVC is observed centeredat about −170 km s−1 and spanning the velocity inter-val [−200,−110] km s−1that is likely associated with theMW halo (see §3).- HS2154+2228: In Fig. A14, we show its normalized
profiles. This target was only observed with G160M.The absorption seen in C IV at −320 km s−1 cannot beconfirmed because C IV λ1550 is contaminated. We onlyreport a non-detection of C IV in the range [−270,−150]km s−1.- PHL1226: In Fig. A15, we show its normalized pro-
files where no absorption is observed at the 3σ level. Thestrong absorption seen in Si III λ1206 at vLSR < −300km s−1 is not confirmed in any other ions and is likelynot a MS component (especially since C II absorptionis not observed while it is typically observed in the MScomponent towartd other sightlines with similar Si III
absorption).- MRK304: In Fig. A16, we show its normalized pro-
files where no absorption is observed at the 3σ level forthe M31 CGM component. There is, however, strong ab-sorption in C II, Si III, Si IV, and C IV at −340 km s−1
that we associate with the MS extension.

18 Lehner, Howk, & Wakker
- MRK595: In Fig. A17, we show its normalized pro-files where no HVC absorption is observed at the 3σ levelfor the MS or M31 CGM component.- MRK1014: In Fig. A18, we show its normalized pro-
files where no HVC absorption is observed at the 3σ levelfor the MS or M31 CGM component.
Figure A1. Normalized profiles of RXJ0048.1+3941 at R = 25kpc. The spectra were obtained with COS G130M and G160M,except for C III and O VI, which were obtained with FUSE. Thered region shows the absorption from the M31 CGM gas. TheMW and HVC absorption is at vLSR ∼> −170 km s−1, while the
MS absorption is at −430 ∼< vLSR ∼< −310 km s−1. In the O VI
panel, we overplot the H2 model that was used to correct the O VIabsorption from the H2 contamination. Note that O I is affectedby O I airglow emission line at vLSR ∼> −100 km s−1.

The Circumgalactic Medium of M31 19
Figure A2. Same as Fig. A1, but for HS0033+4300 at R = 31kpc.
Figure A3. Same as Fig. A1, but for HS0058+4213 at R = 49kpc. There is no evidence of MS absortpion toward this sightline.

20 Lehner, Howk, & Wakker
Figure A4. Same as Fig. A1, but for 3C66A at R = 239 kpc.
Figure A5. Same as Fig. A1, but for MRK335 at R = 287 kpc.

The Circumgalactic Medium of M31 21
Figure A6. Same as Fig. A1, but for PG0003+158 at R = 334kpc.
Figure A7. Same as Fig. A1, but for UGC12163 at R = 339 kpc.
Figure A8. Same as Fig. A1, but for MRK1502 at R = 361 kpc.

22 Lehner, Howk, & Wakker
Figure A9. Same as Fig. A1, but for MRK1501 at R = 389 kpc.
Figure A10. Same as Fig. A1, but for SDSSJ015952.95+134554.3at R = 401 kpc.
Figure A11. Same as Fig. A1, but for 3C454.3 at R = 424 kpc.
Figure A12. Same as Fig. A1, but for SDSSJ225738.20+134045.0at R = 440 kpc.

The Circumgalactic Medium of M31 23
Figure A13. Same as Fig. A1, but for NGC7469 at R = 475 kpc.
Figure A14. Same as Fig. A1, but for HS2154+2228 at R = 476kpc.
Figure A15. Same as Fig. A1, but for PHL1226 at R = 482 kpc.

24 Lehner, Howk, & Wakker
Figure A16. Same as Fig. A1, but for MRK304 at R = 495 kpc.
Figure A17. Same as Fig. A1, but for MRK595 at R = 514 kpc.
Figure A18. Same as Fig. A1, but for MRK1014 at R = 527kpc.