Embed Size (px)
Citation preview
1!
Powers and Problems of Integrating Social Media Data with Public Health and Safety
Bloomberg D4GX28 September 2015
Bloomberg HQ
Cody Buntain and Jennifer Golbeck{cbuntain,golbeck}@cs.umd.edu
Human-Computer Interaction LabUniversity of Maryland
Gary [email protected]
START CenterUniversity of Maryland
What is the point of this talk?!
2!
The Point
3!
Social media data can augment !public survey-based research efforts!
The Point
4!
Social media data can augment !public survey-based research efforts!
The Point
5!
Social media data can augment !public survey-based research efforts!
The Point
6!
Social media data can augment !public survey-based research efforts!
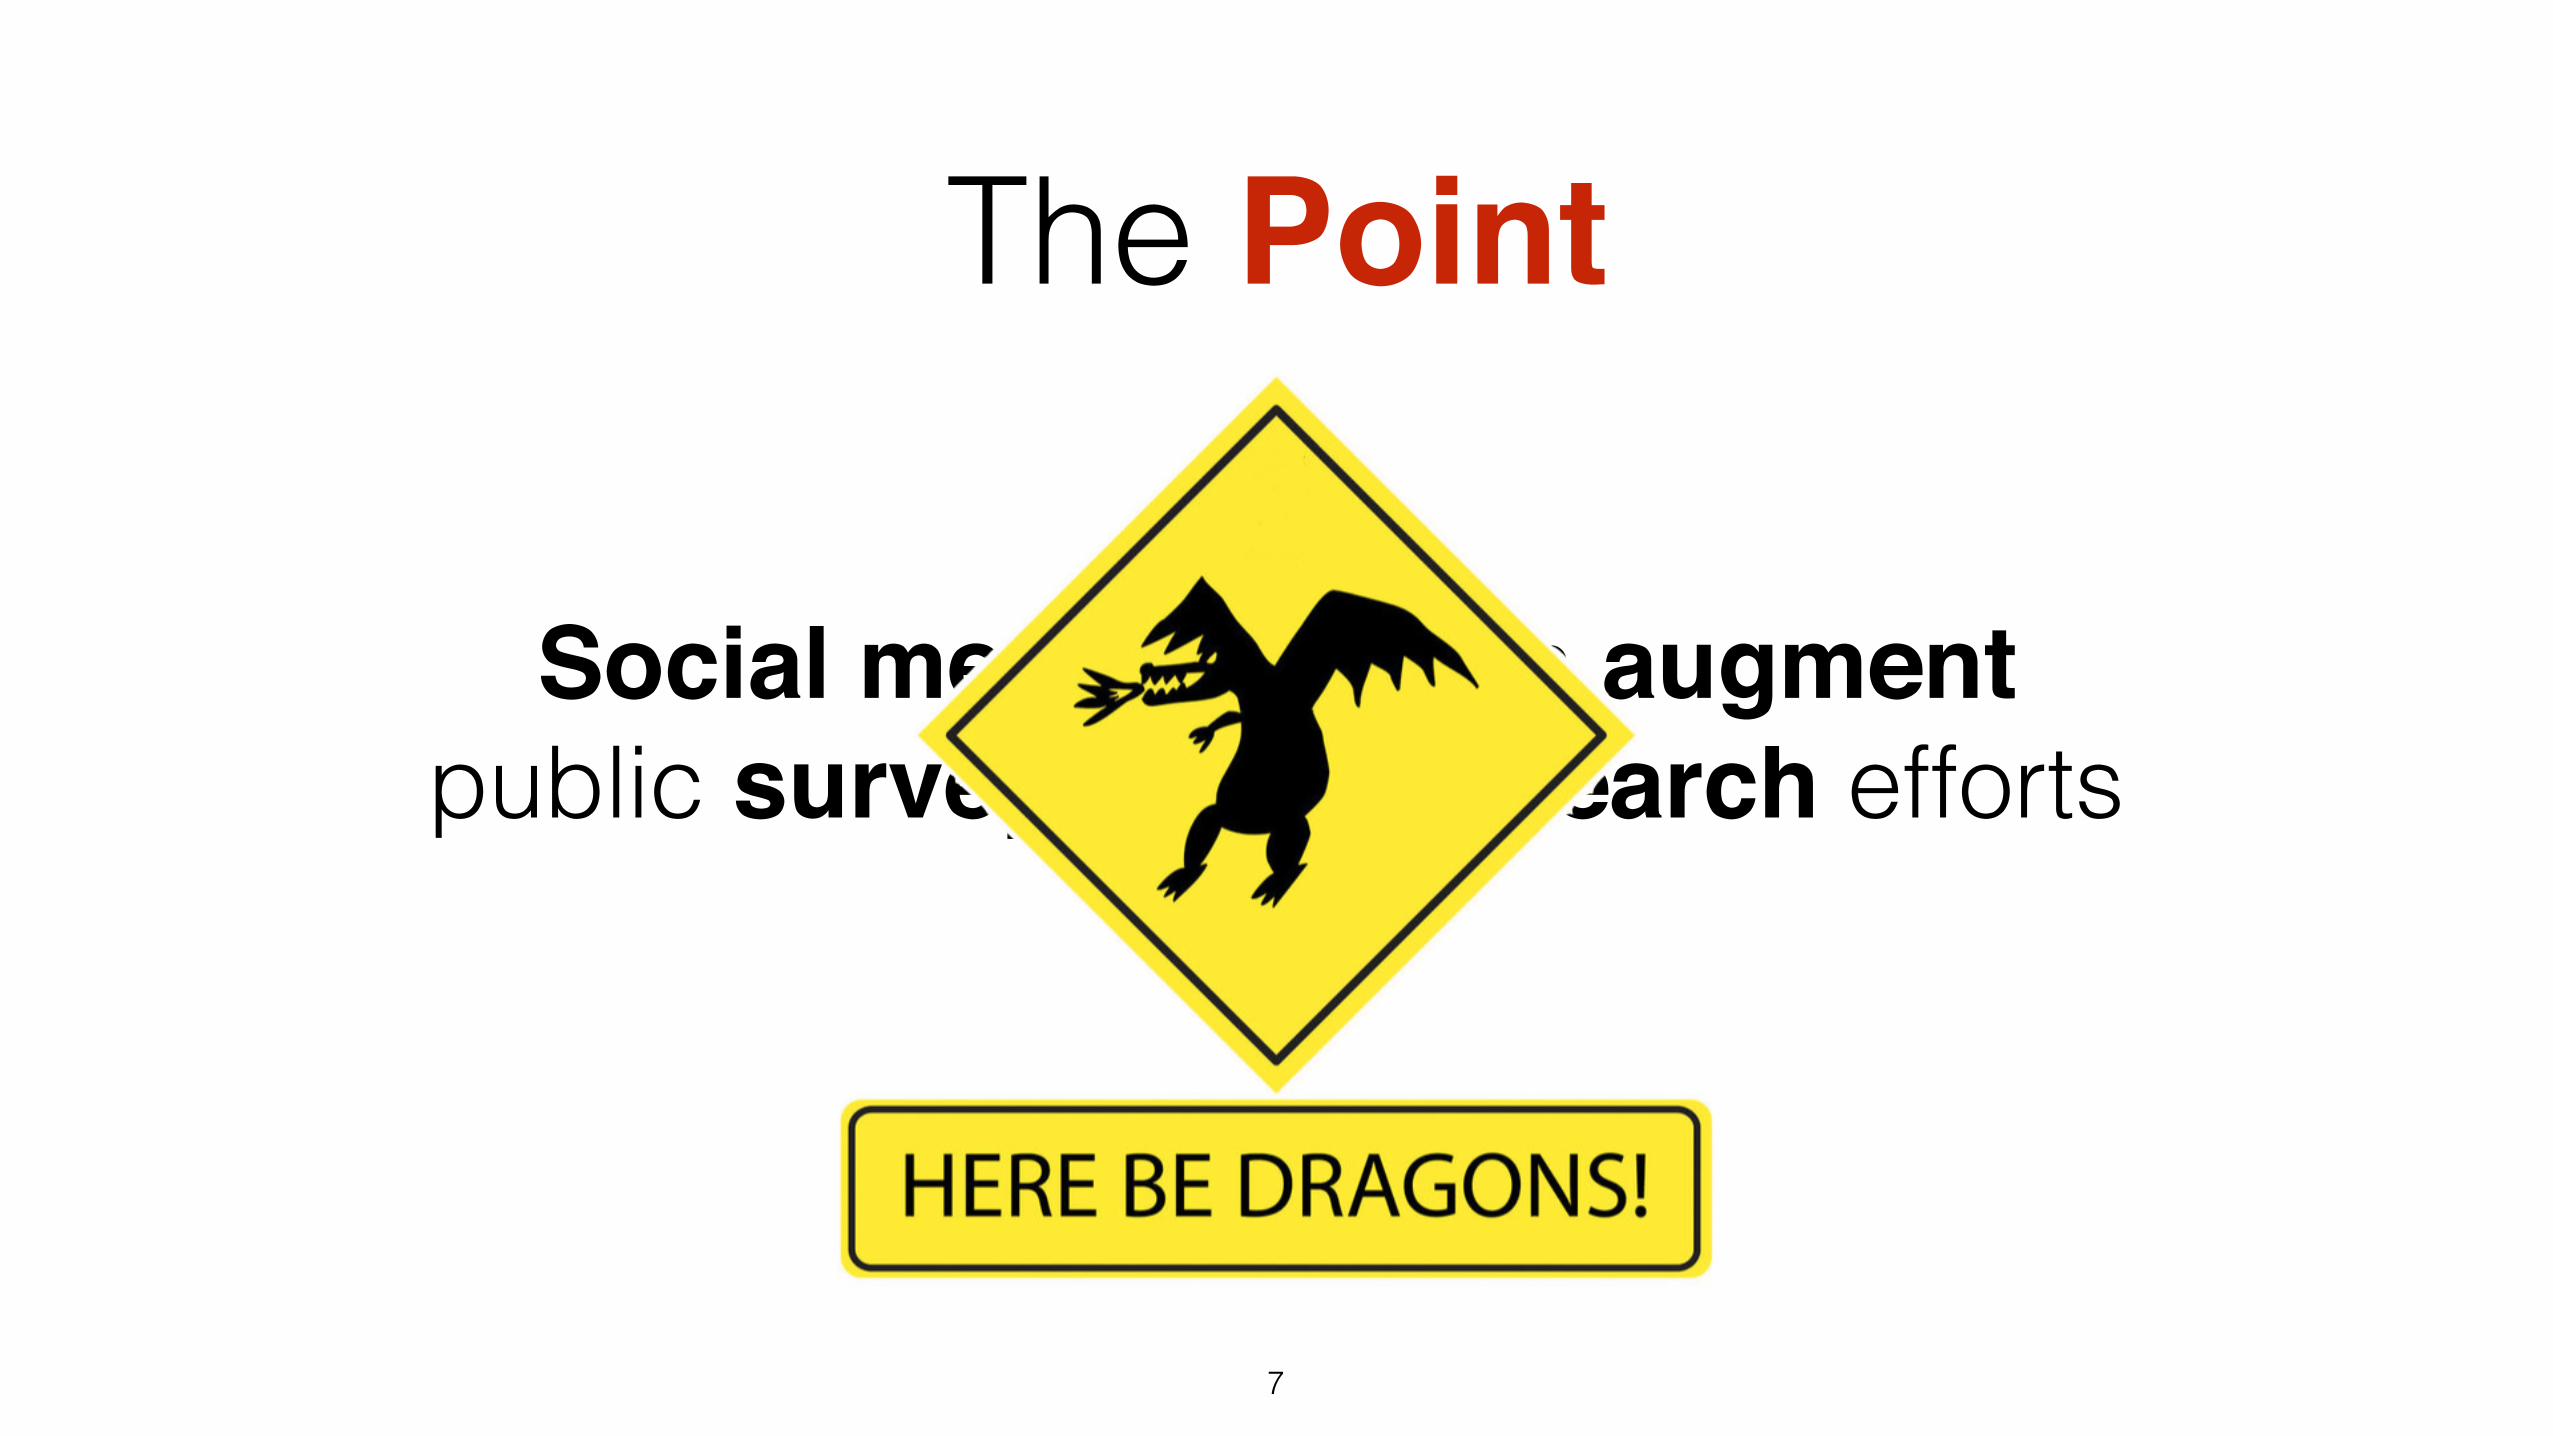
The Point
7!
Social media data can augment !public survey-based research efforts!
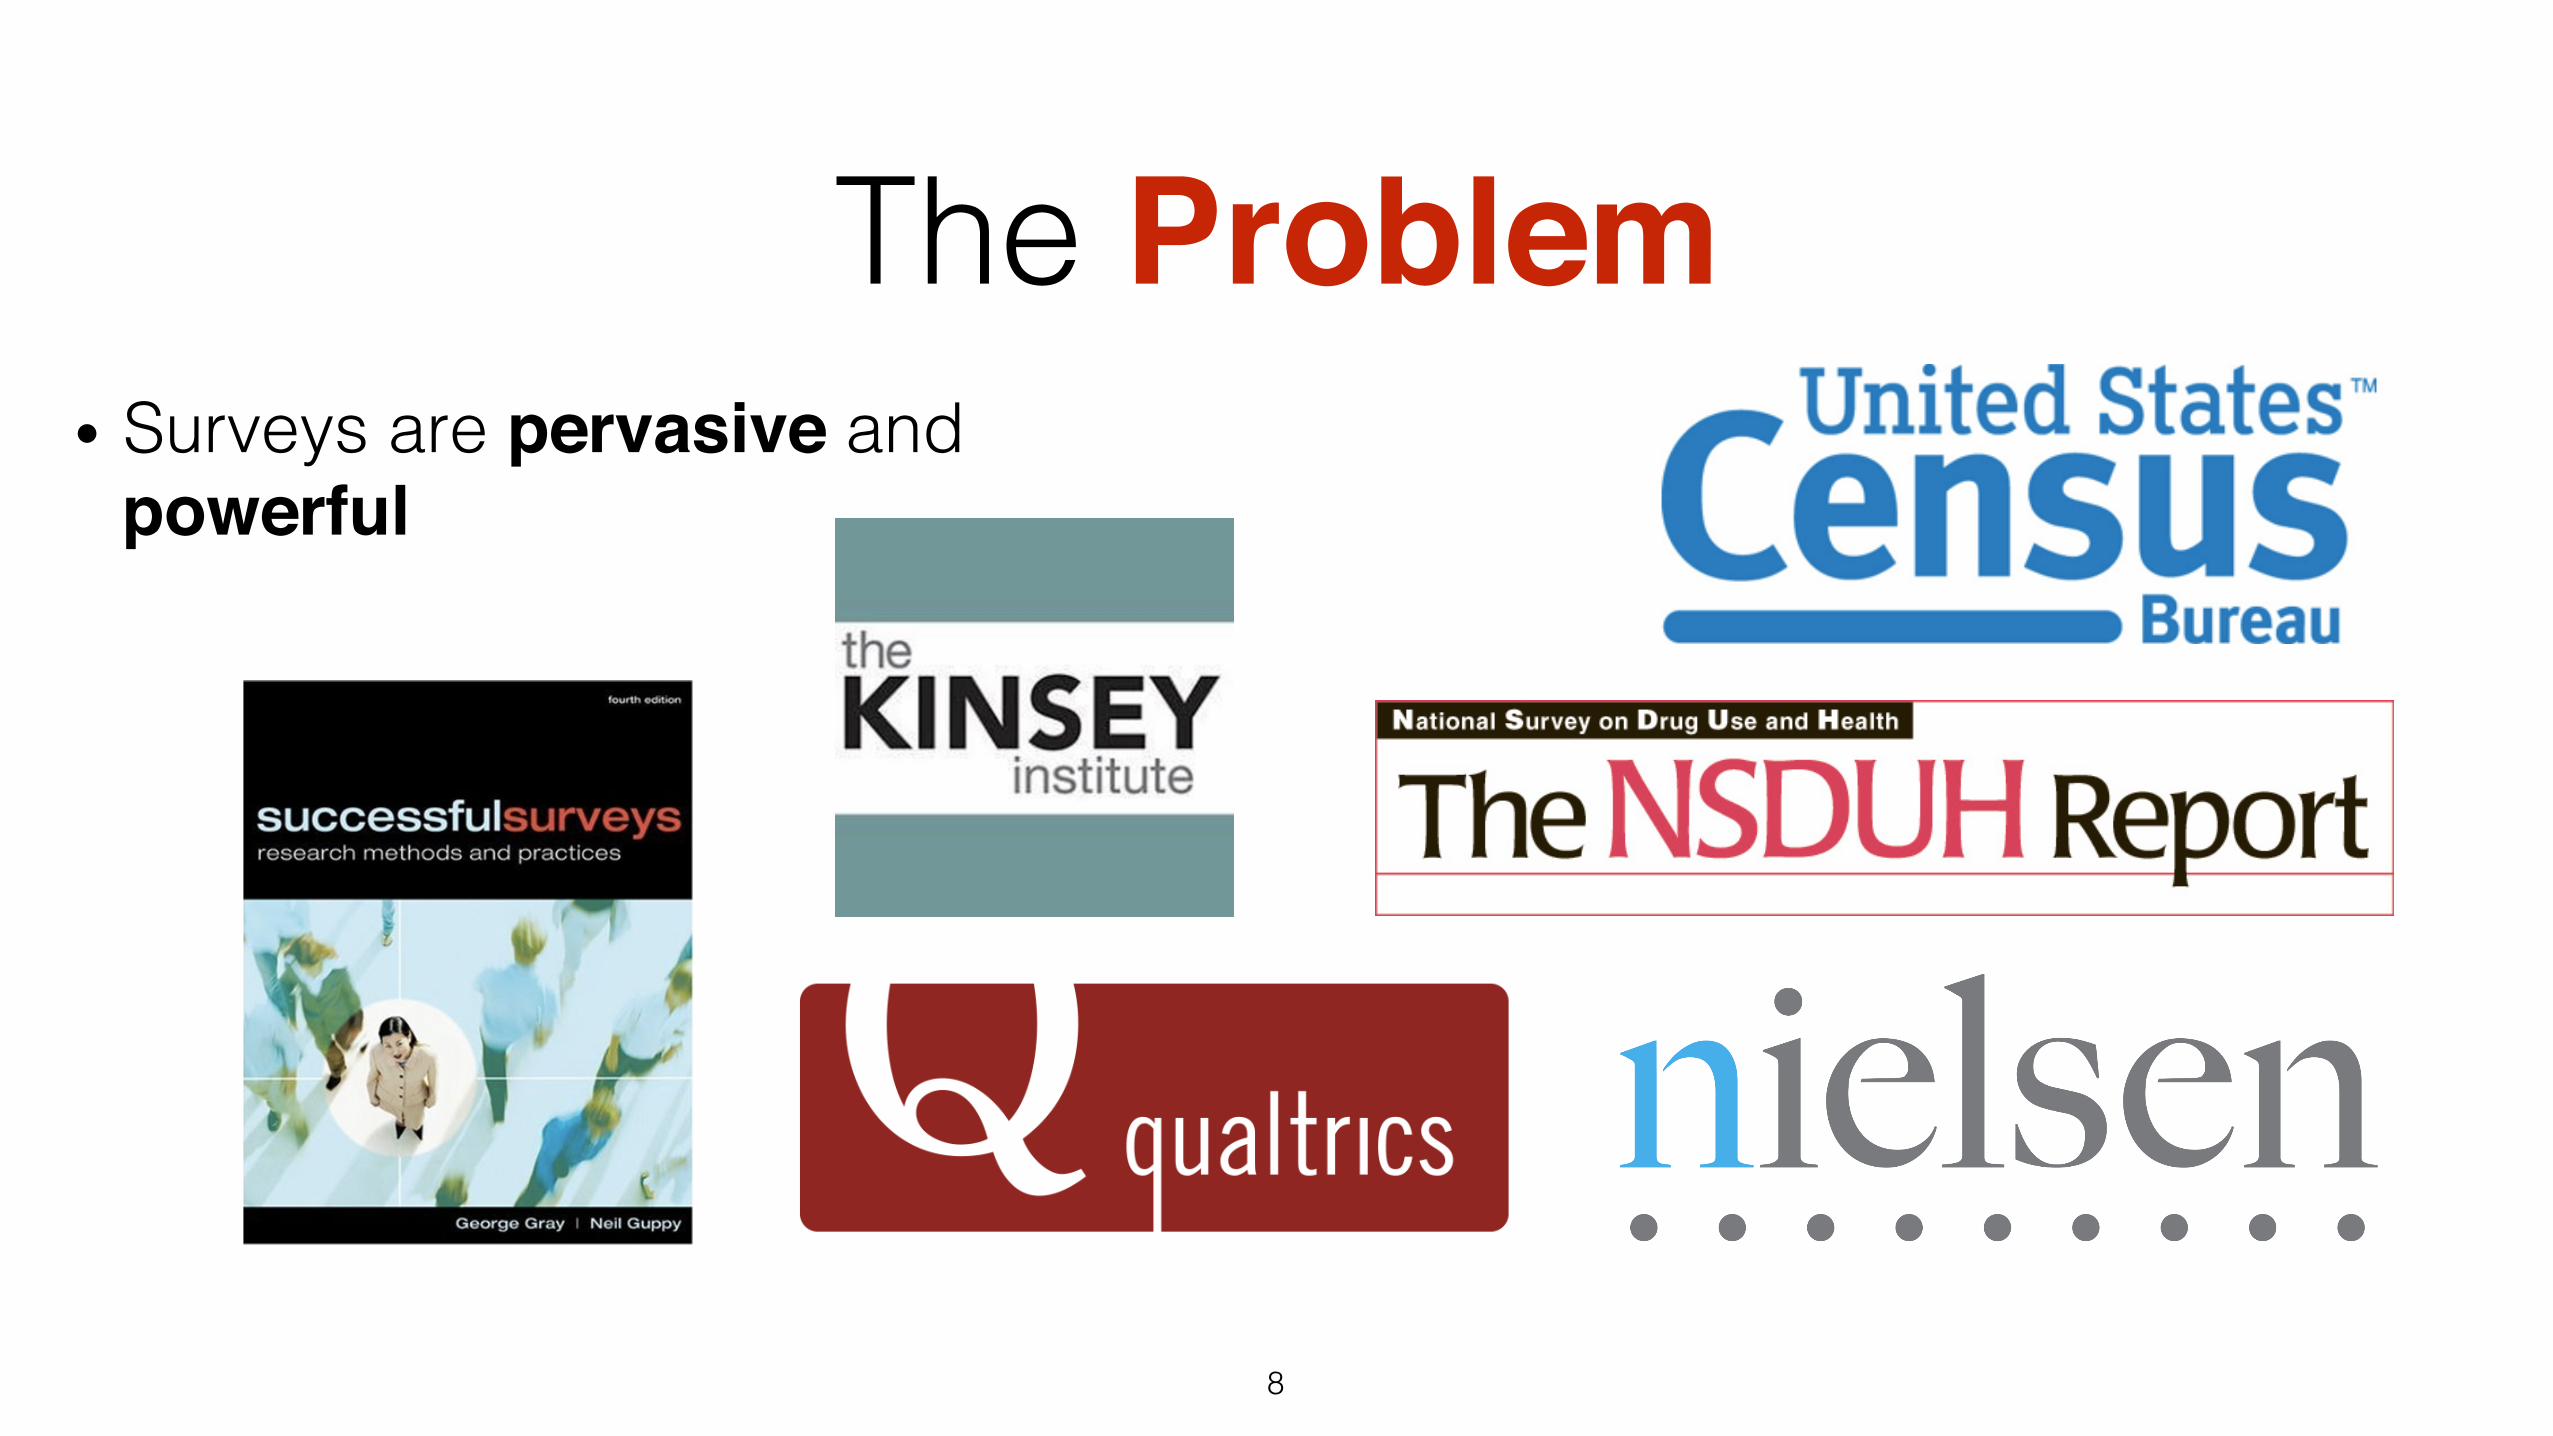
The Problem• Surveys are pervasive and
powerful
8!
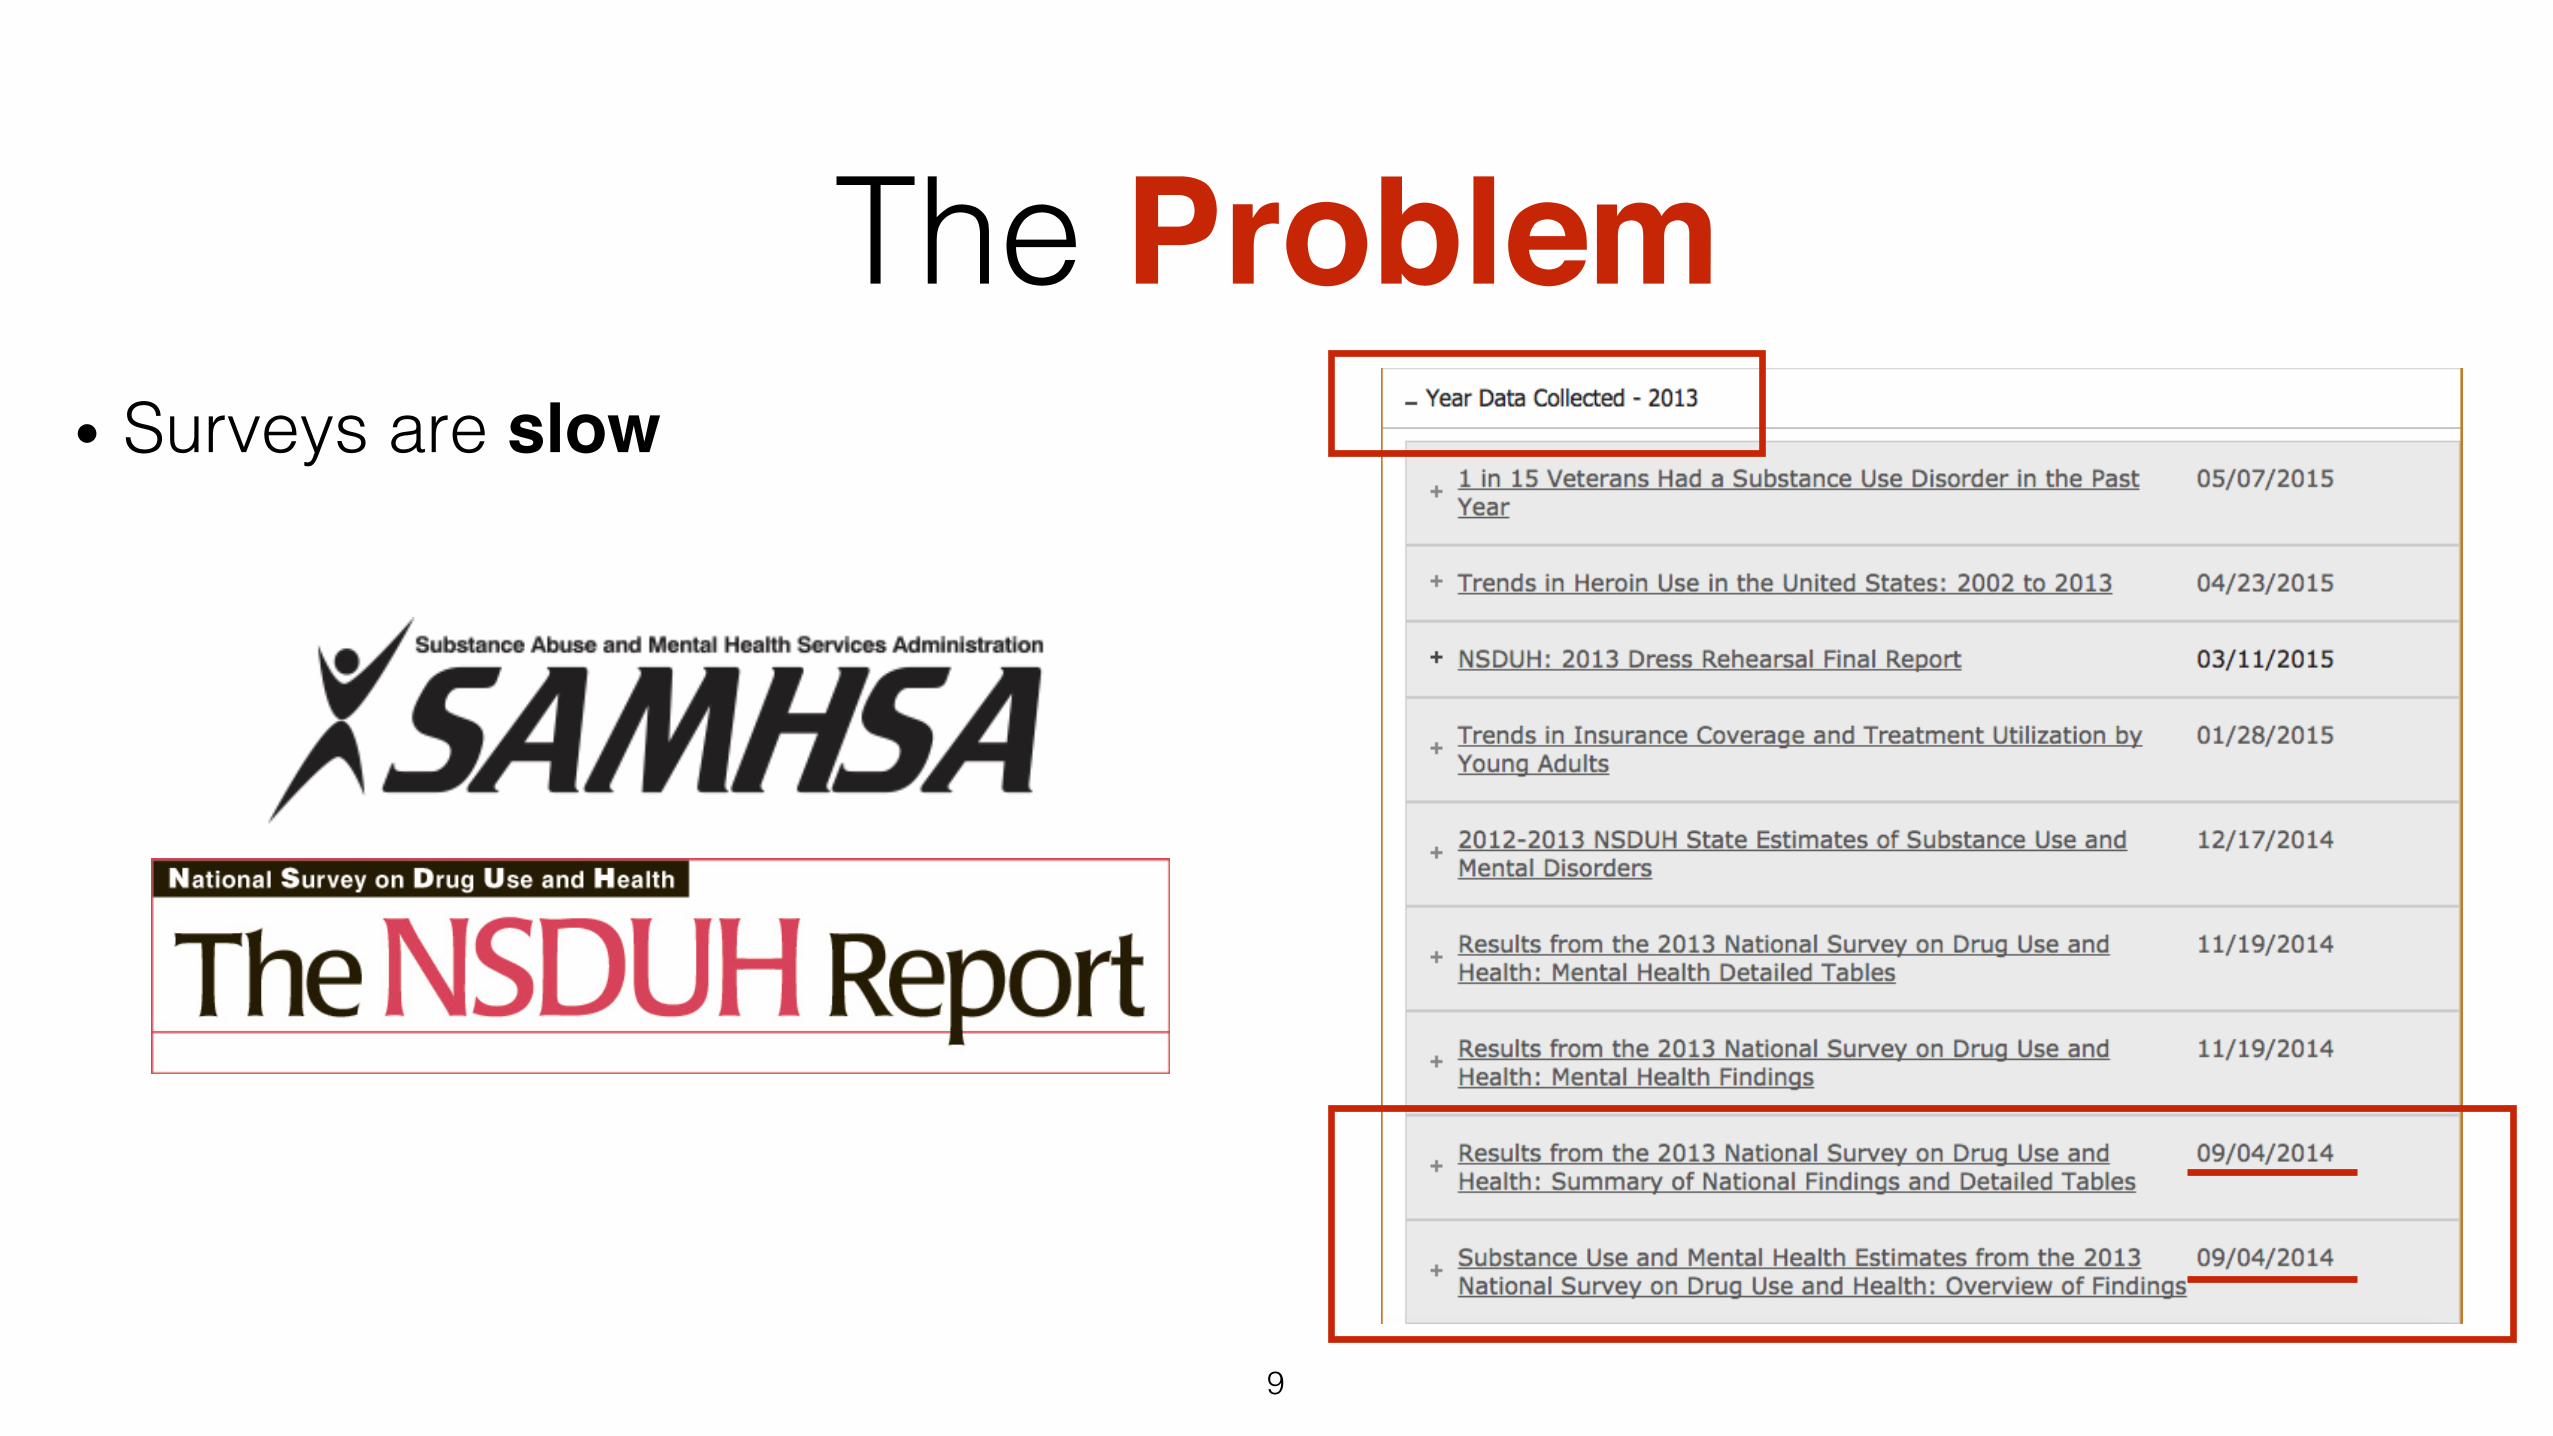
The Problem• Surveys are slow
9!
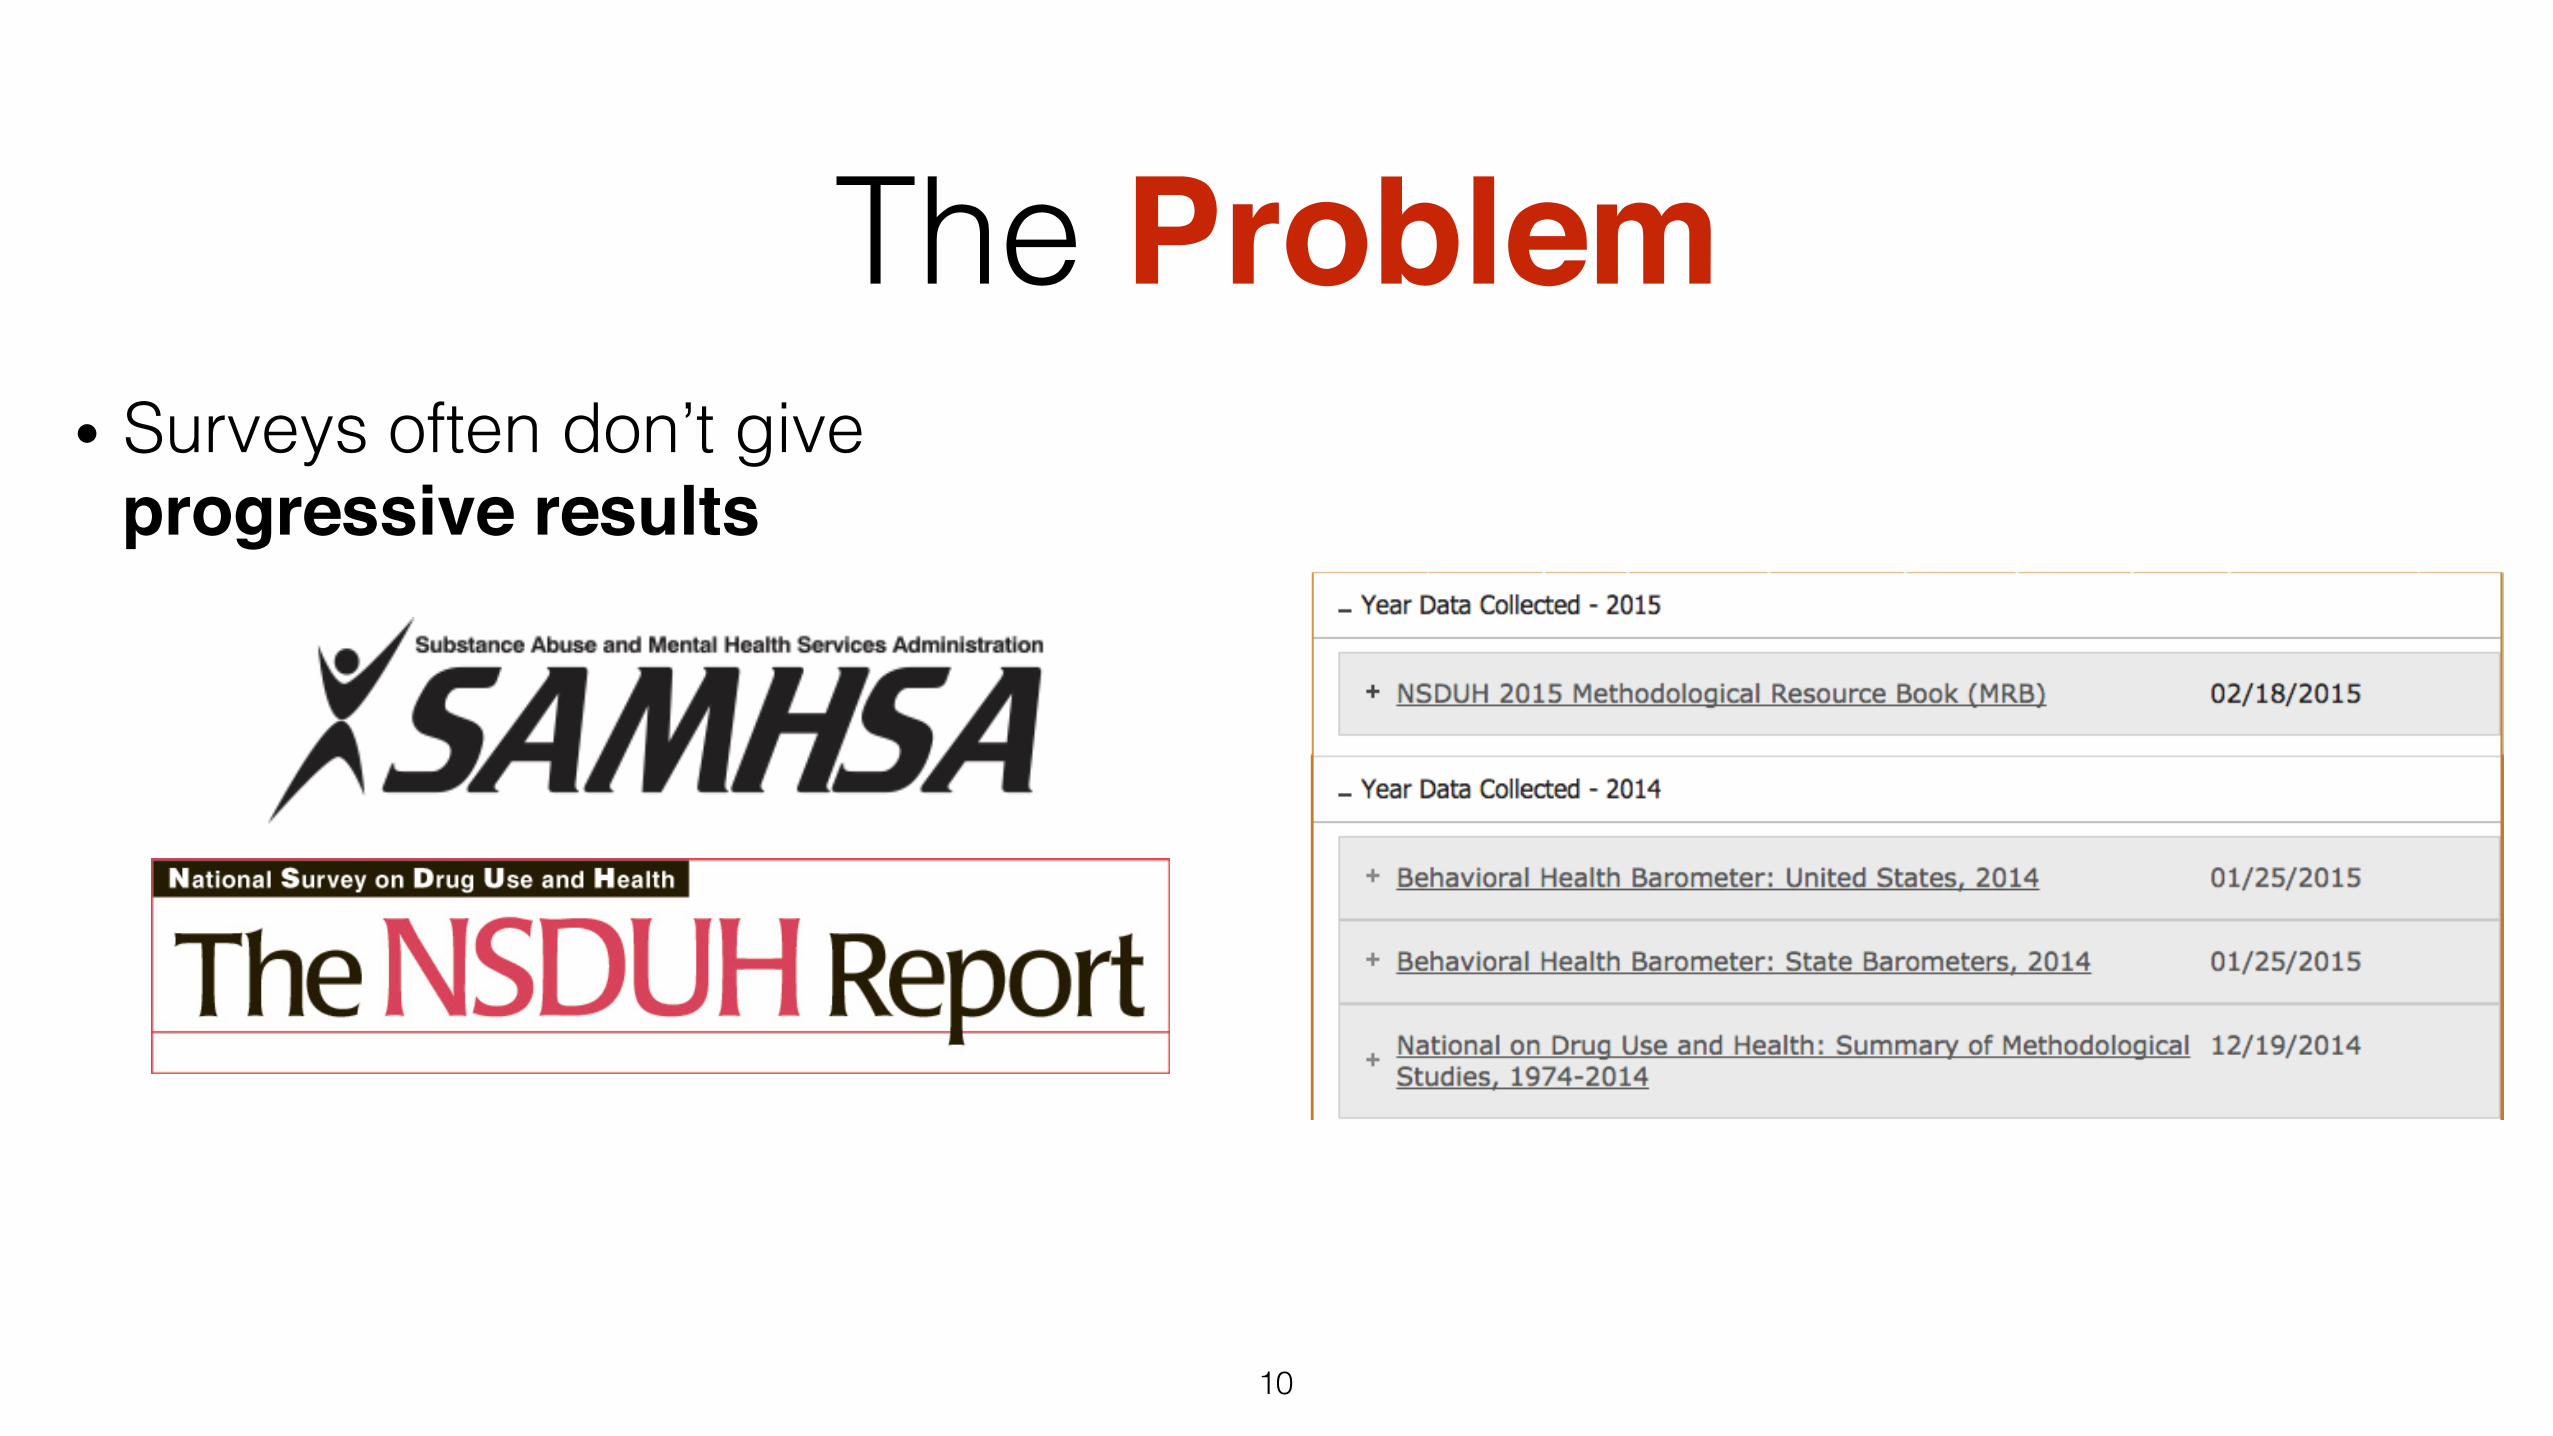
The Problem• Surveys often don’t give
progressive results
10!
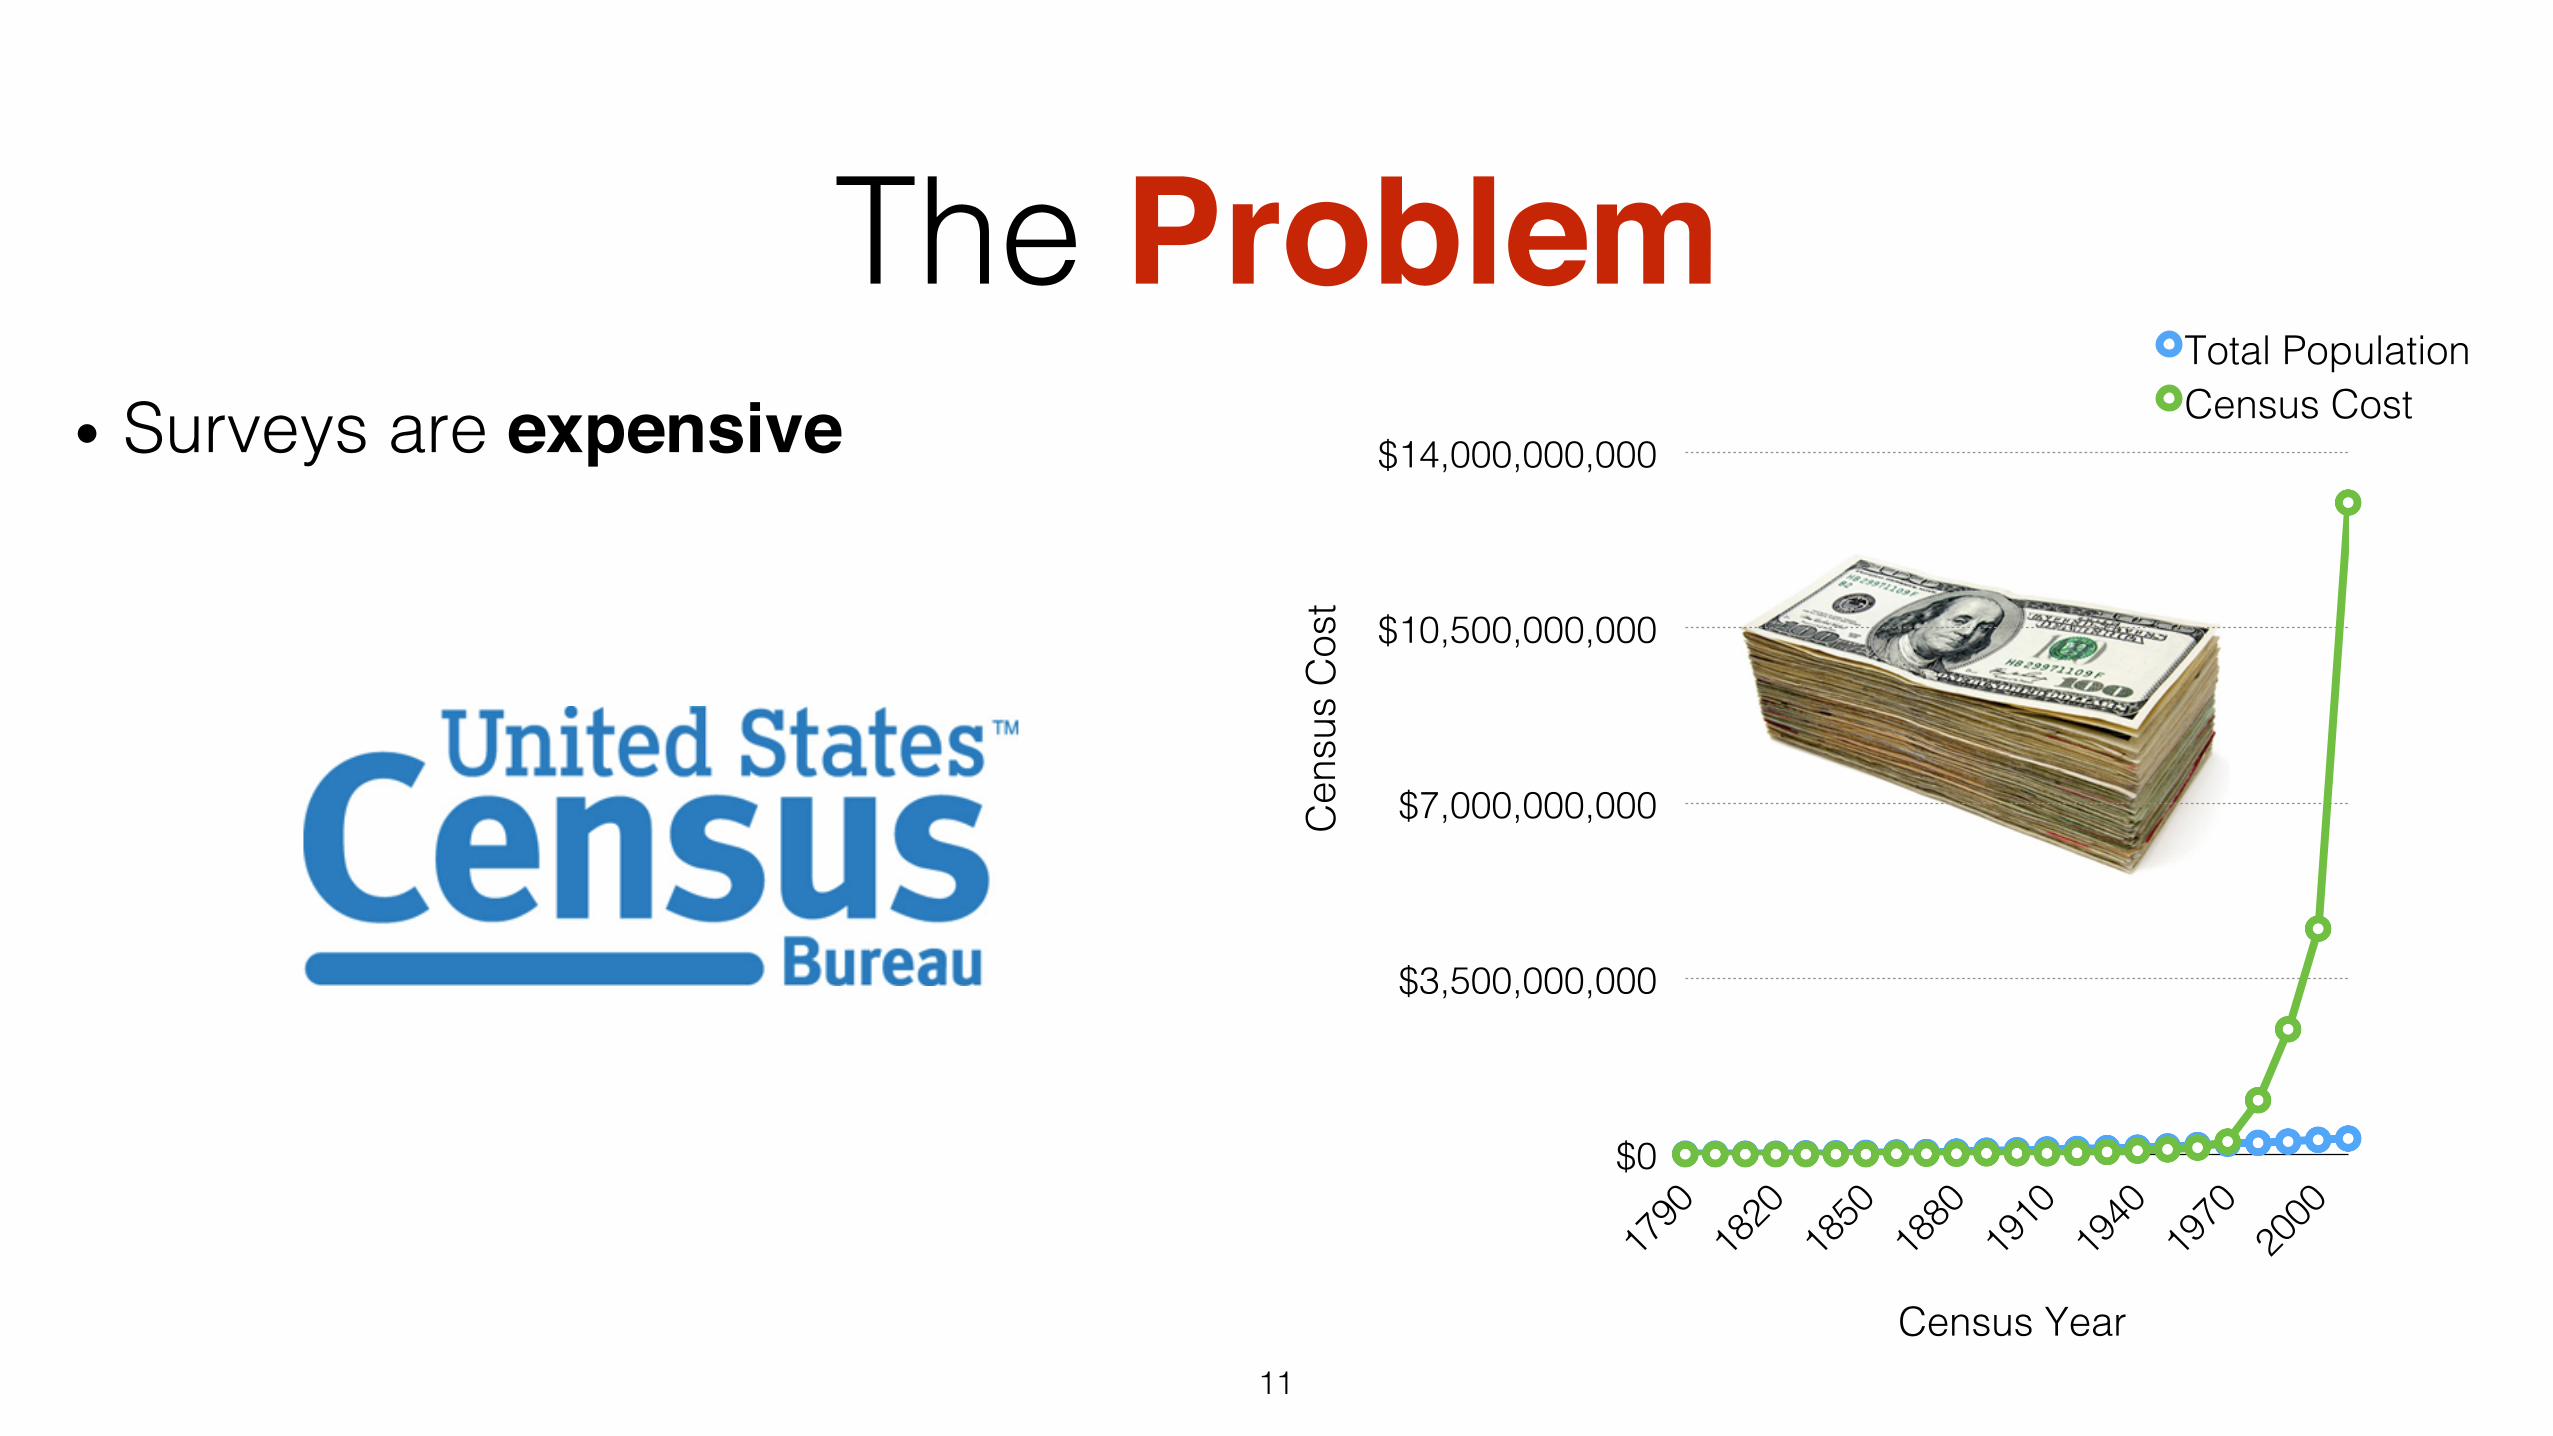
The Problem• Surveys are expensive
11!
$0!
$3,500,000,000!
$7,000,000,000!
$10,500,000,000!
$14,000,000,000!
Total Population!Census Cost!
Census Year!C
ensu
s C
ost!
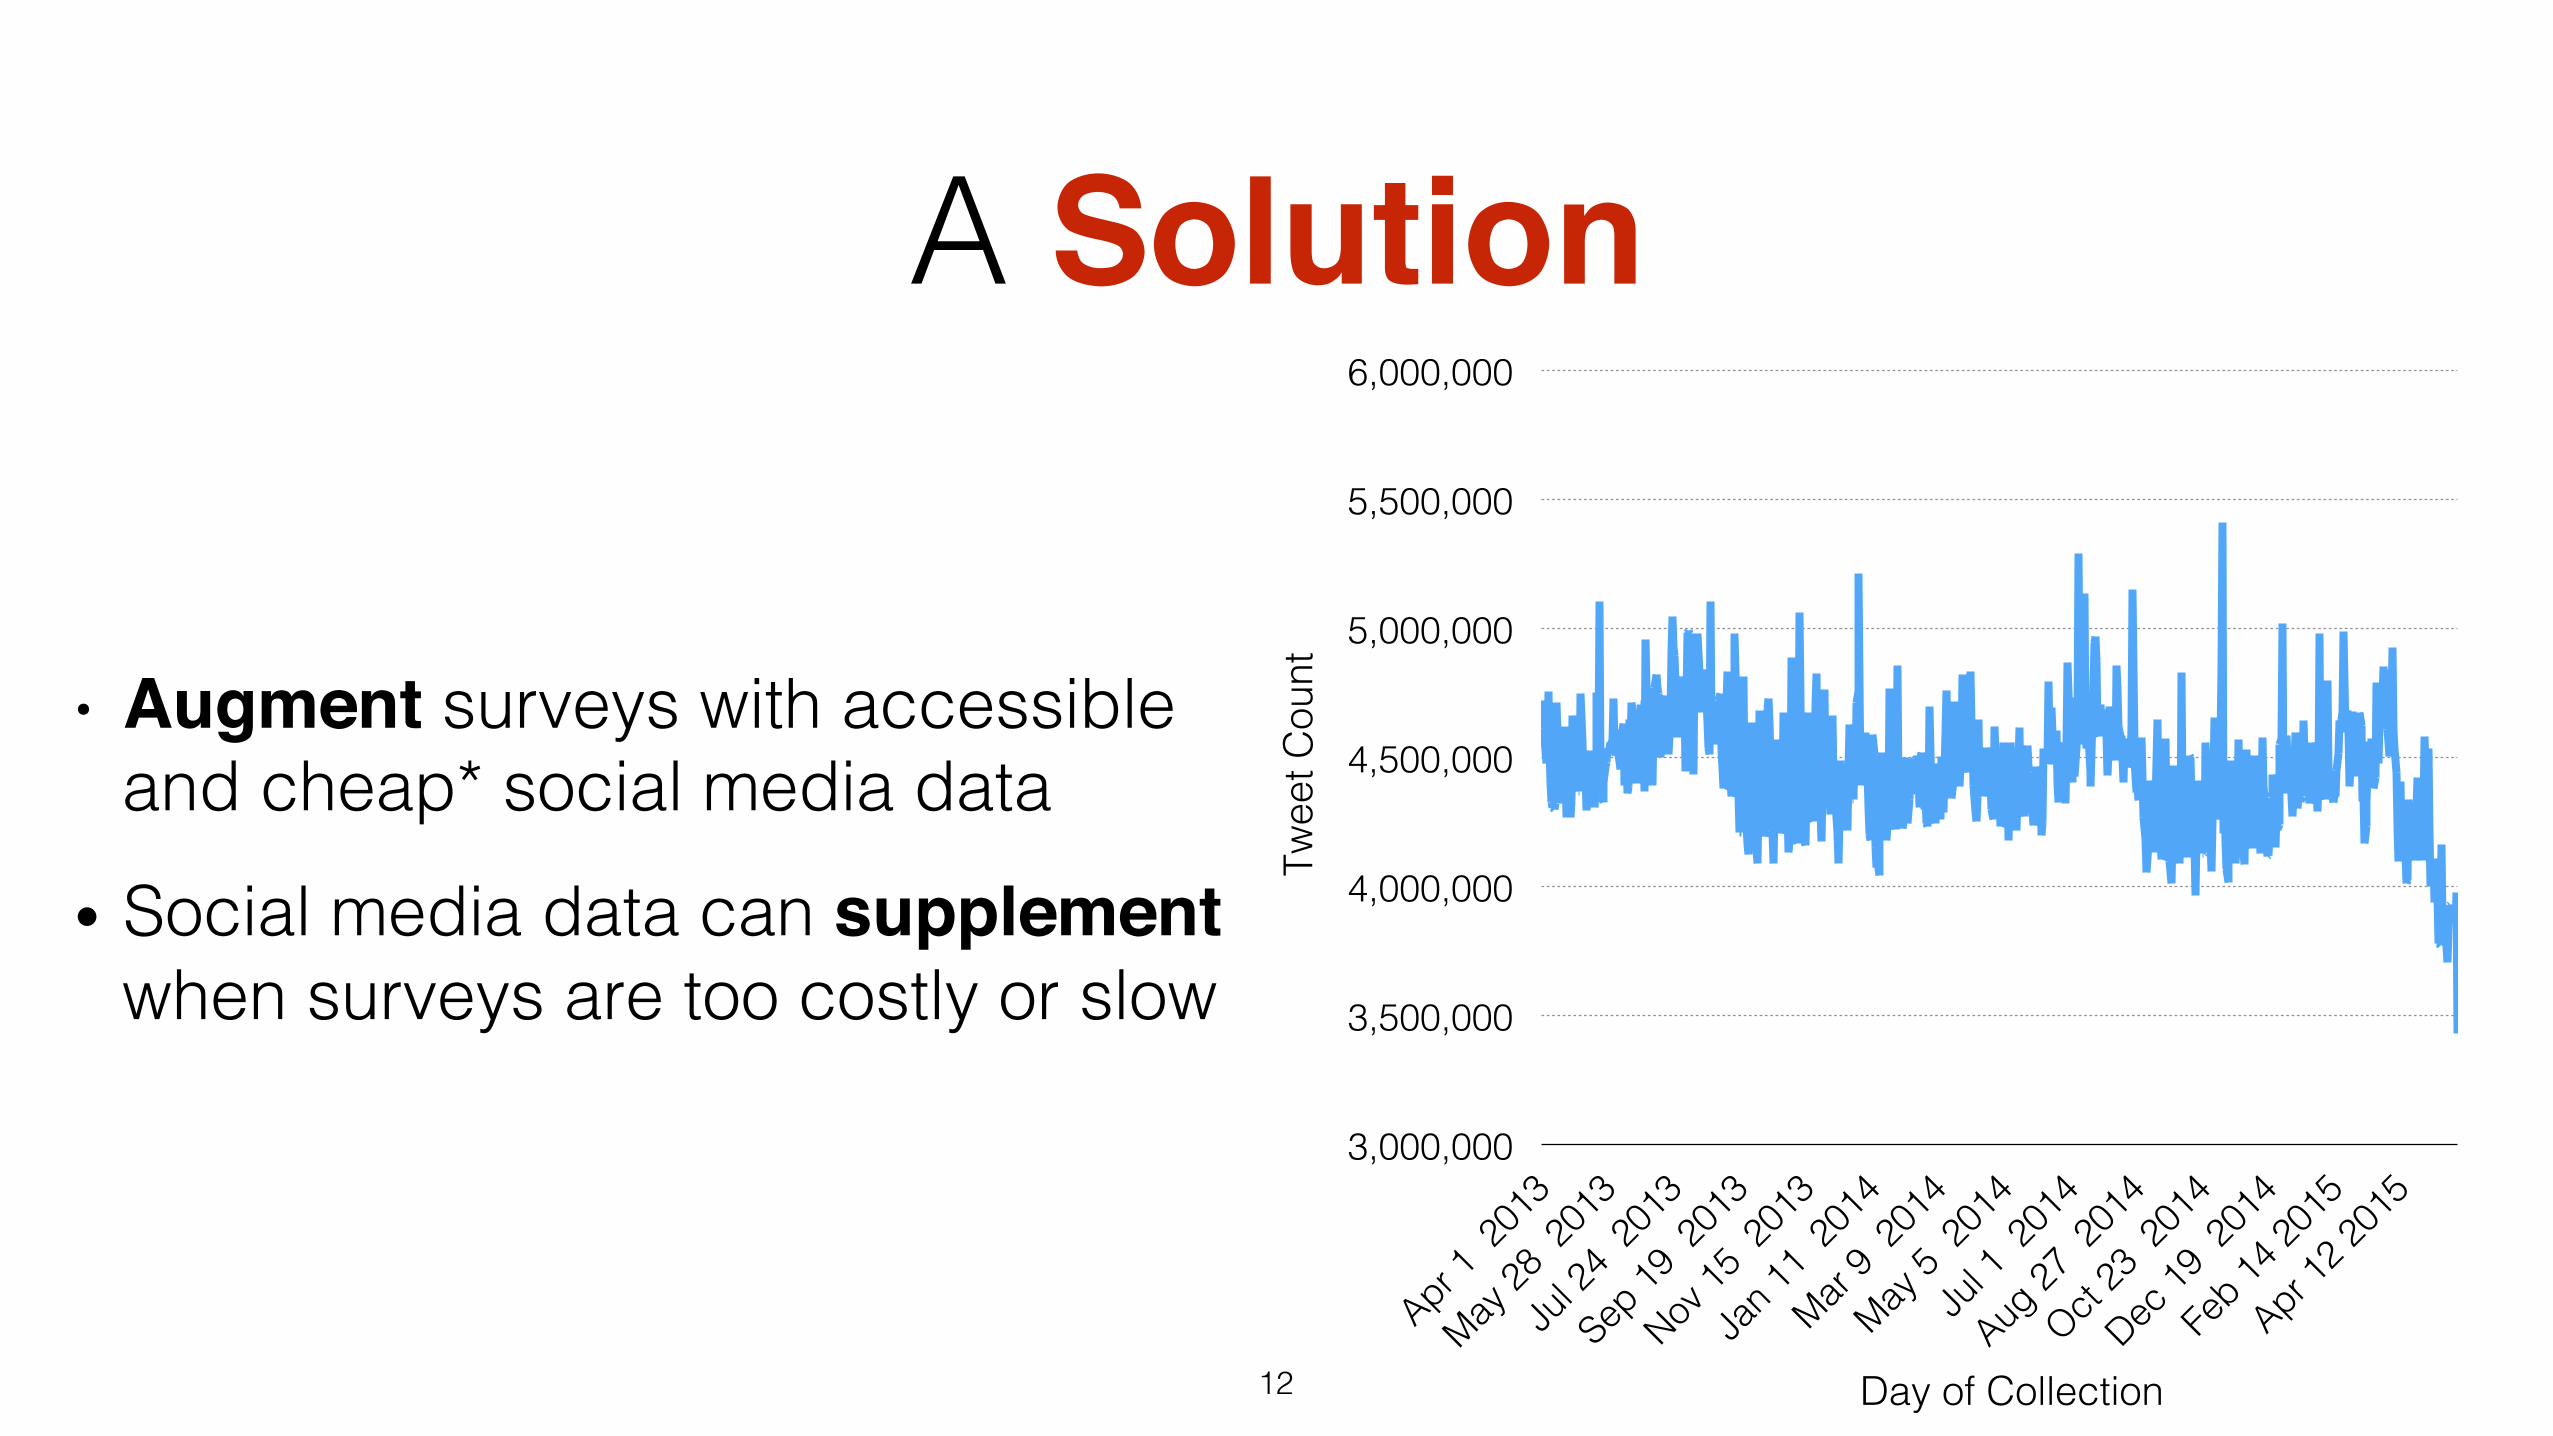
A Solution
• Augment surveys with accessible and cheap* social media data!
• Social media data can supplement when surveys are too costly or slow!
12!
3,000,000!
3,500,000!
4,000,000!
4,500,000!
5,000,000!
5,500,000!
6,000,000!
Day of Collection!
Twee
t Cou
nt!
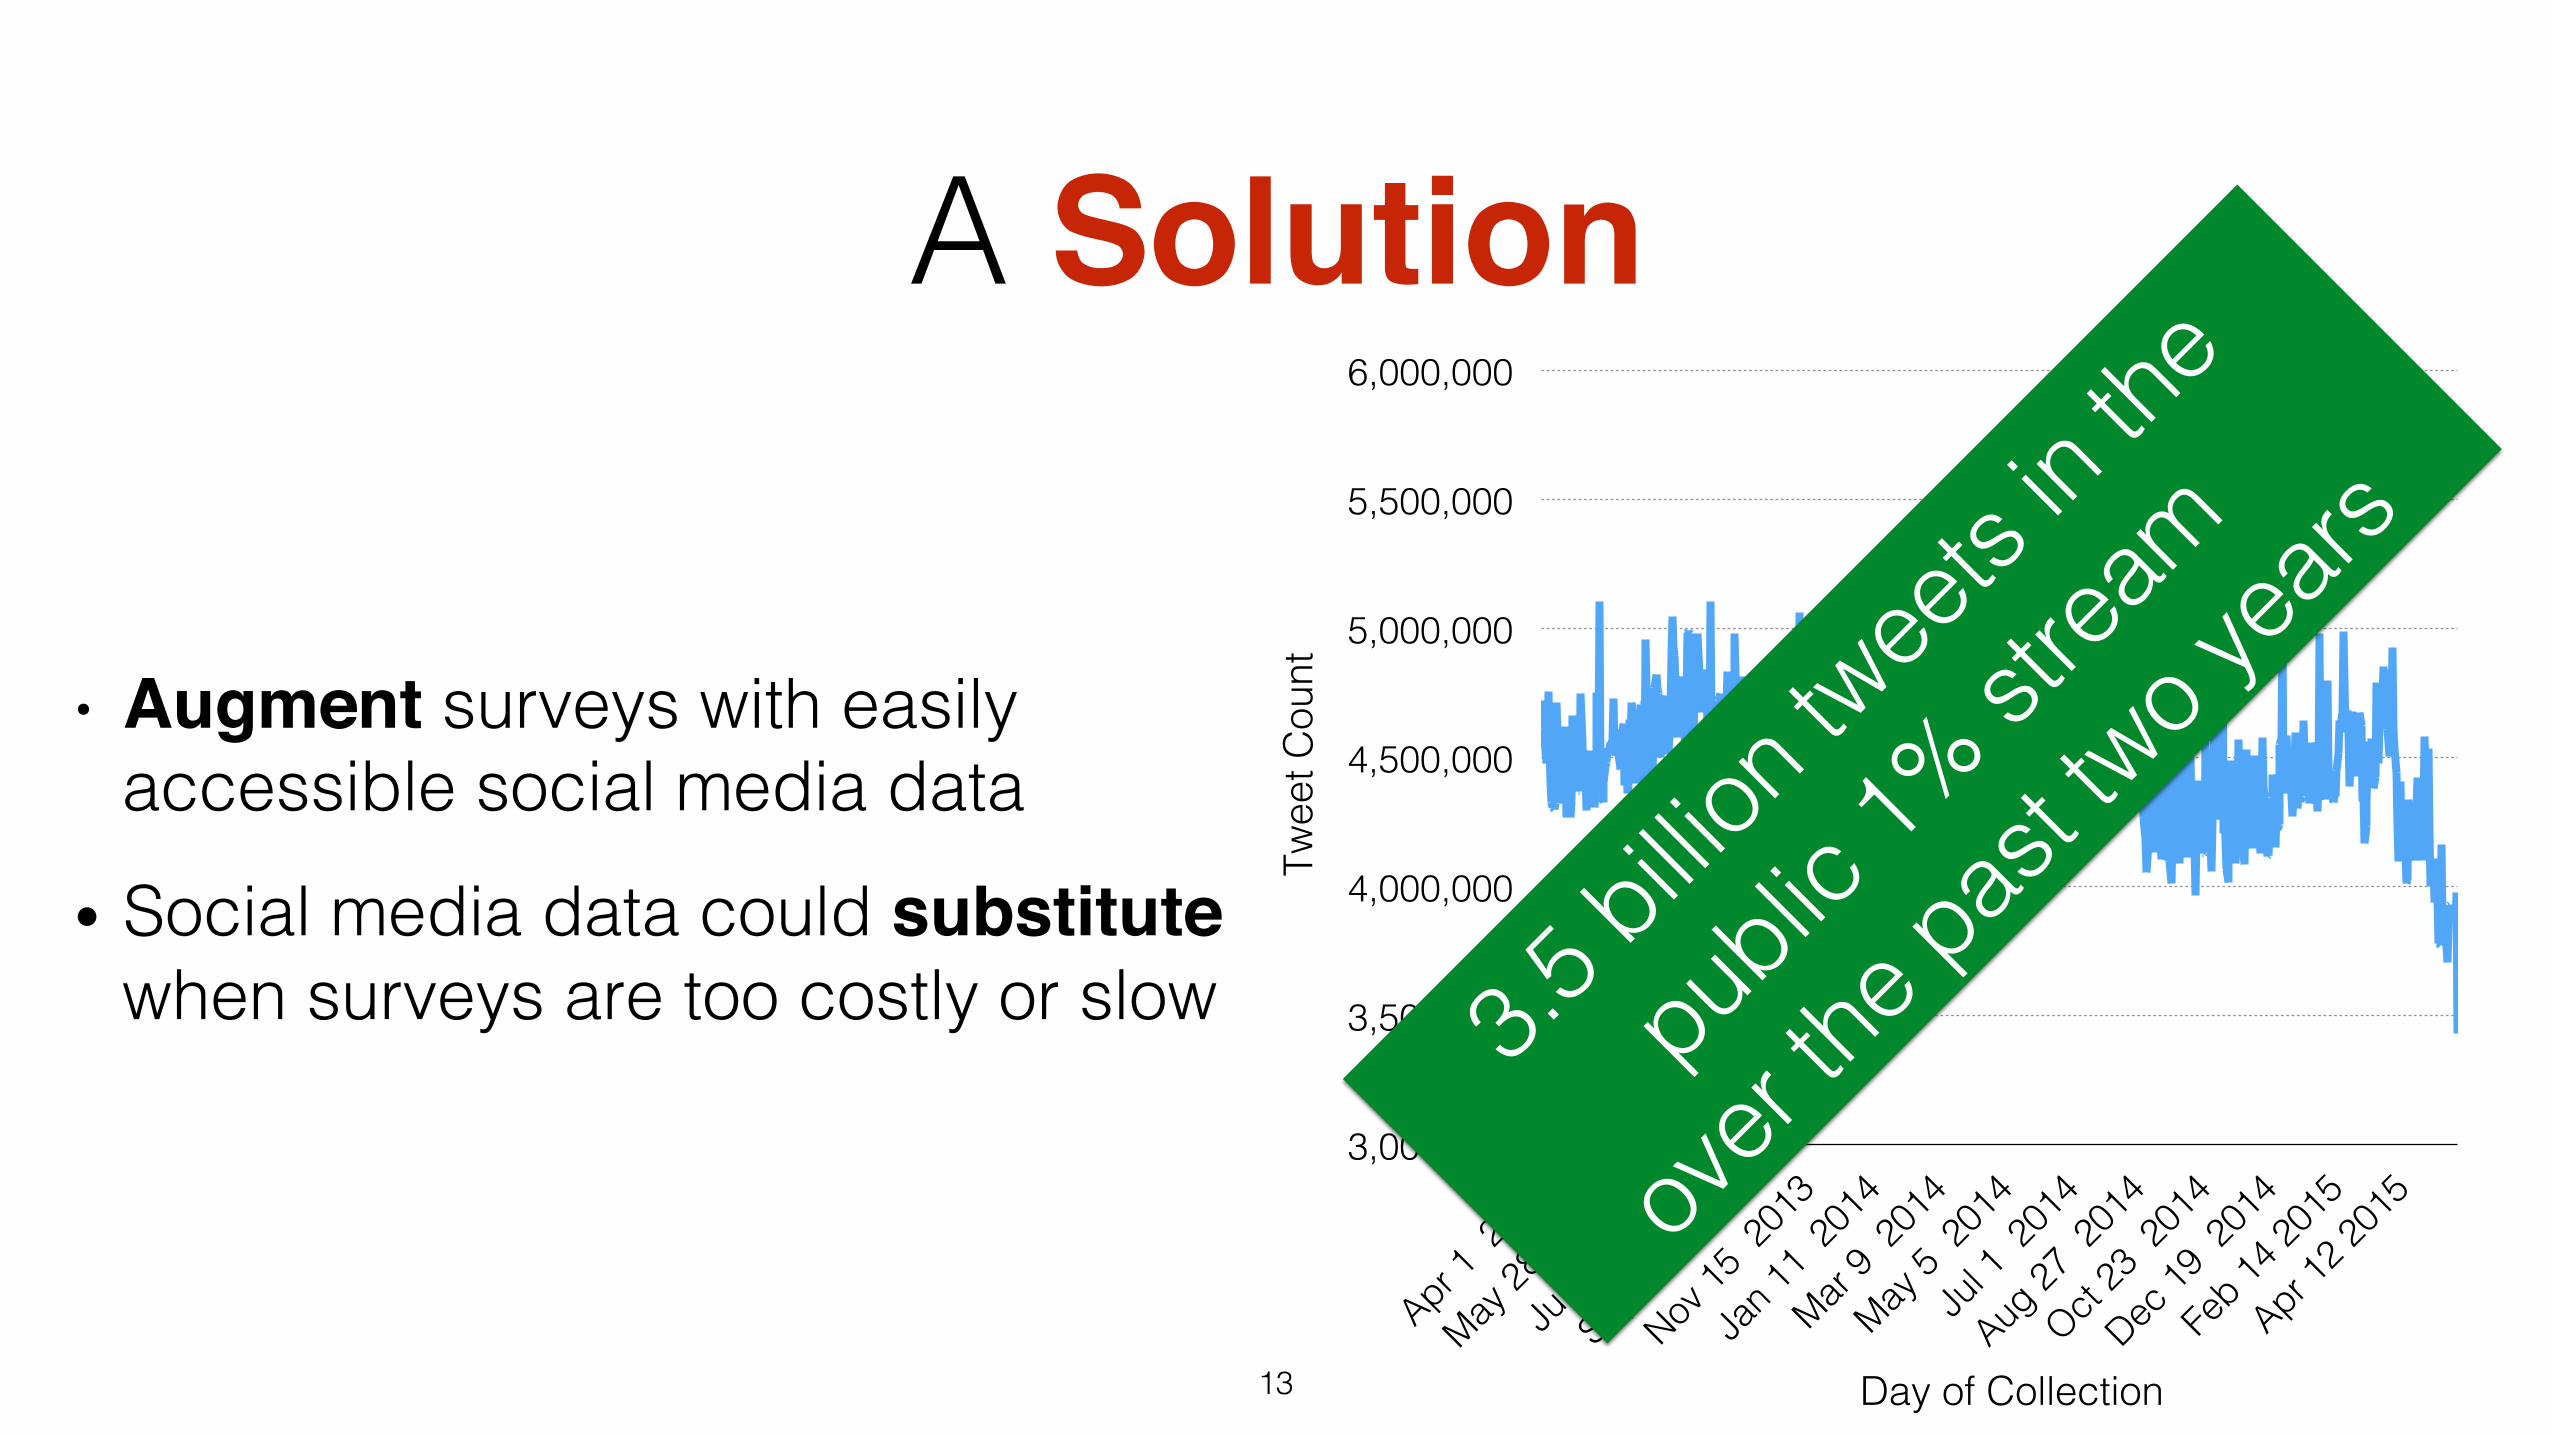
A Solution
• Augment surveys with easily accessible social media data!
• Social media data could substitute when surveys are too costly or slow!
13!
3,000,000!
3,500,000!
4,000,000!
4,500,000!
5,000,000!
5,500,000!
6,000,000!
Day of Collection!
Twee
t Cou
nt!
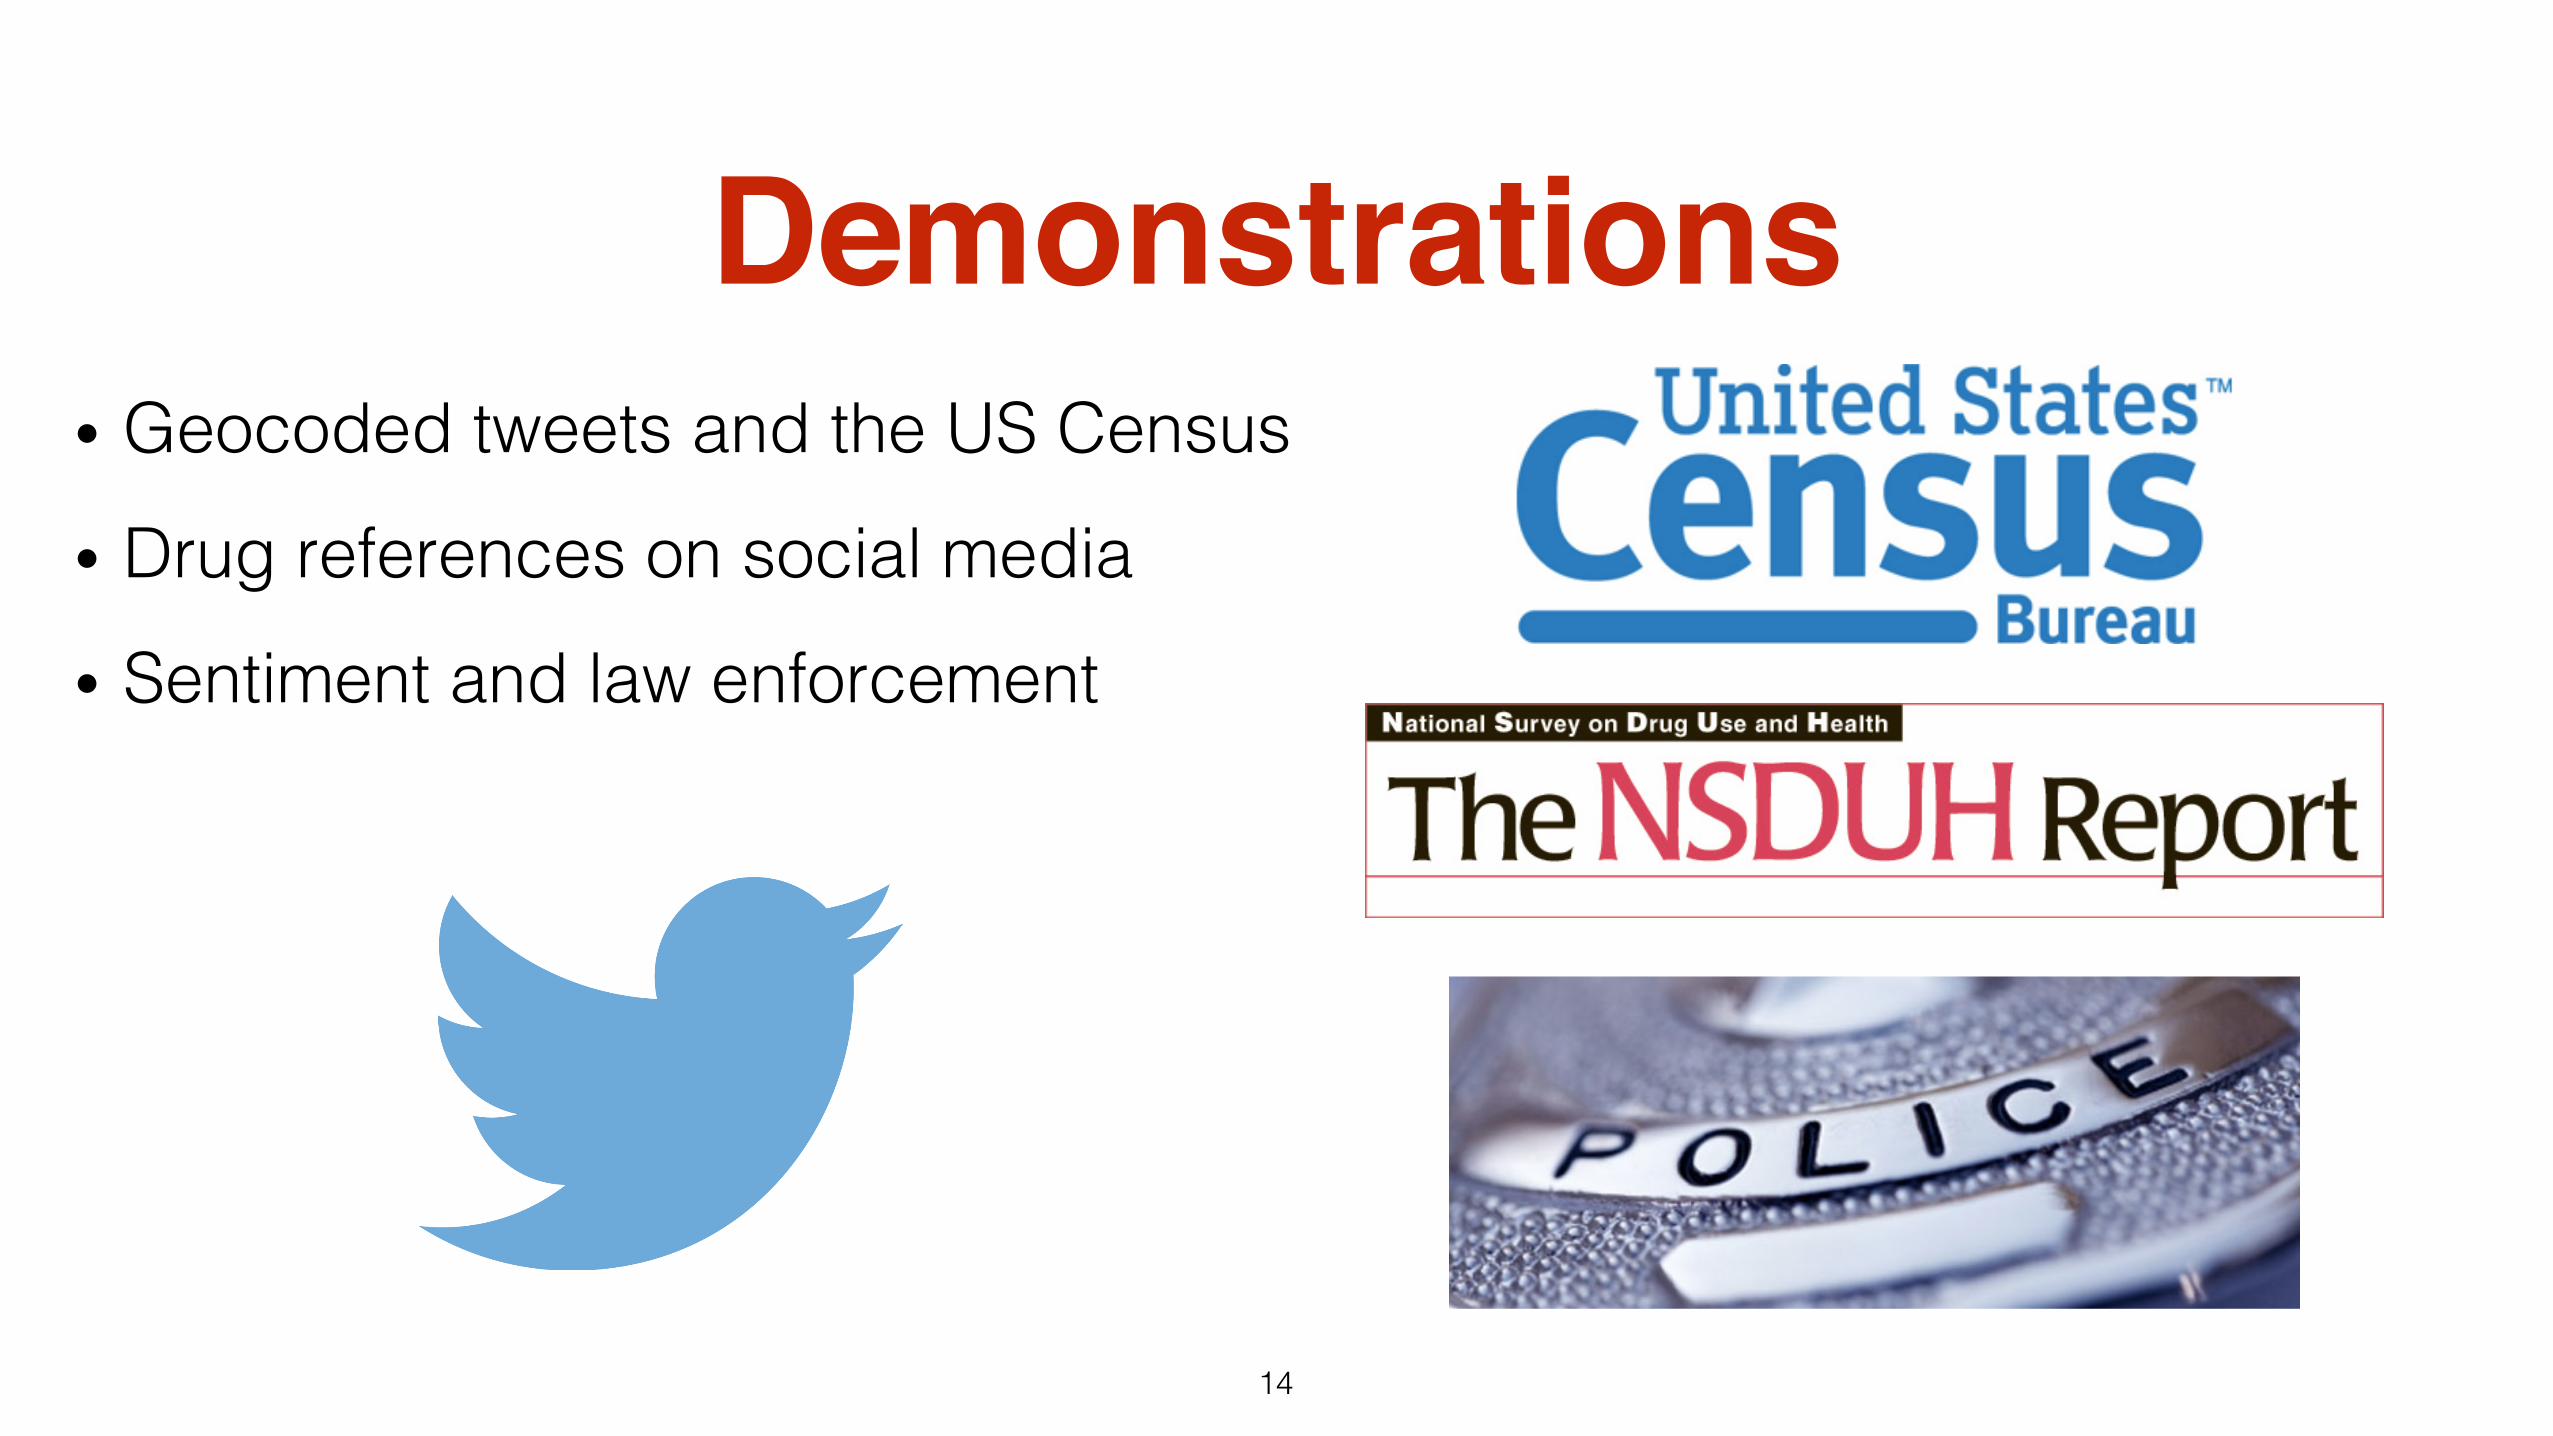
Demonstrations• Geocoded tweets and the US Census!
• Drug references on social media!
• Sentiment and law enforcement!
14!
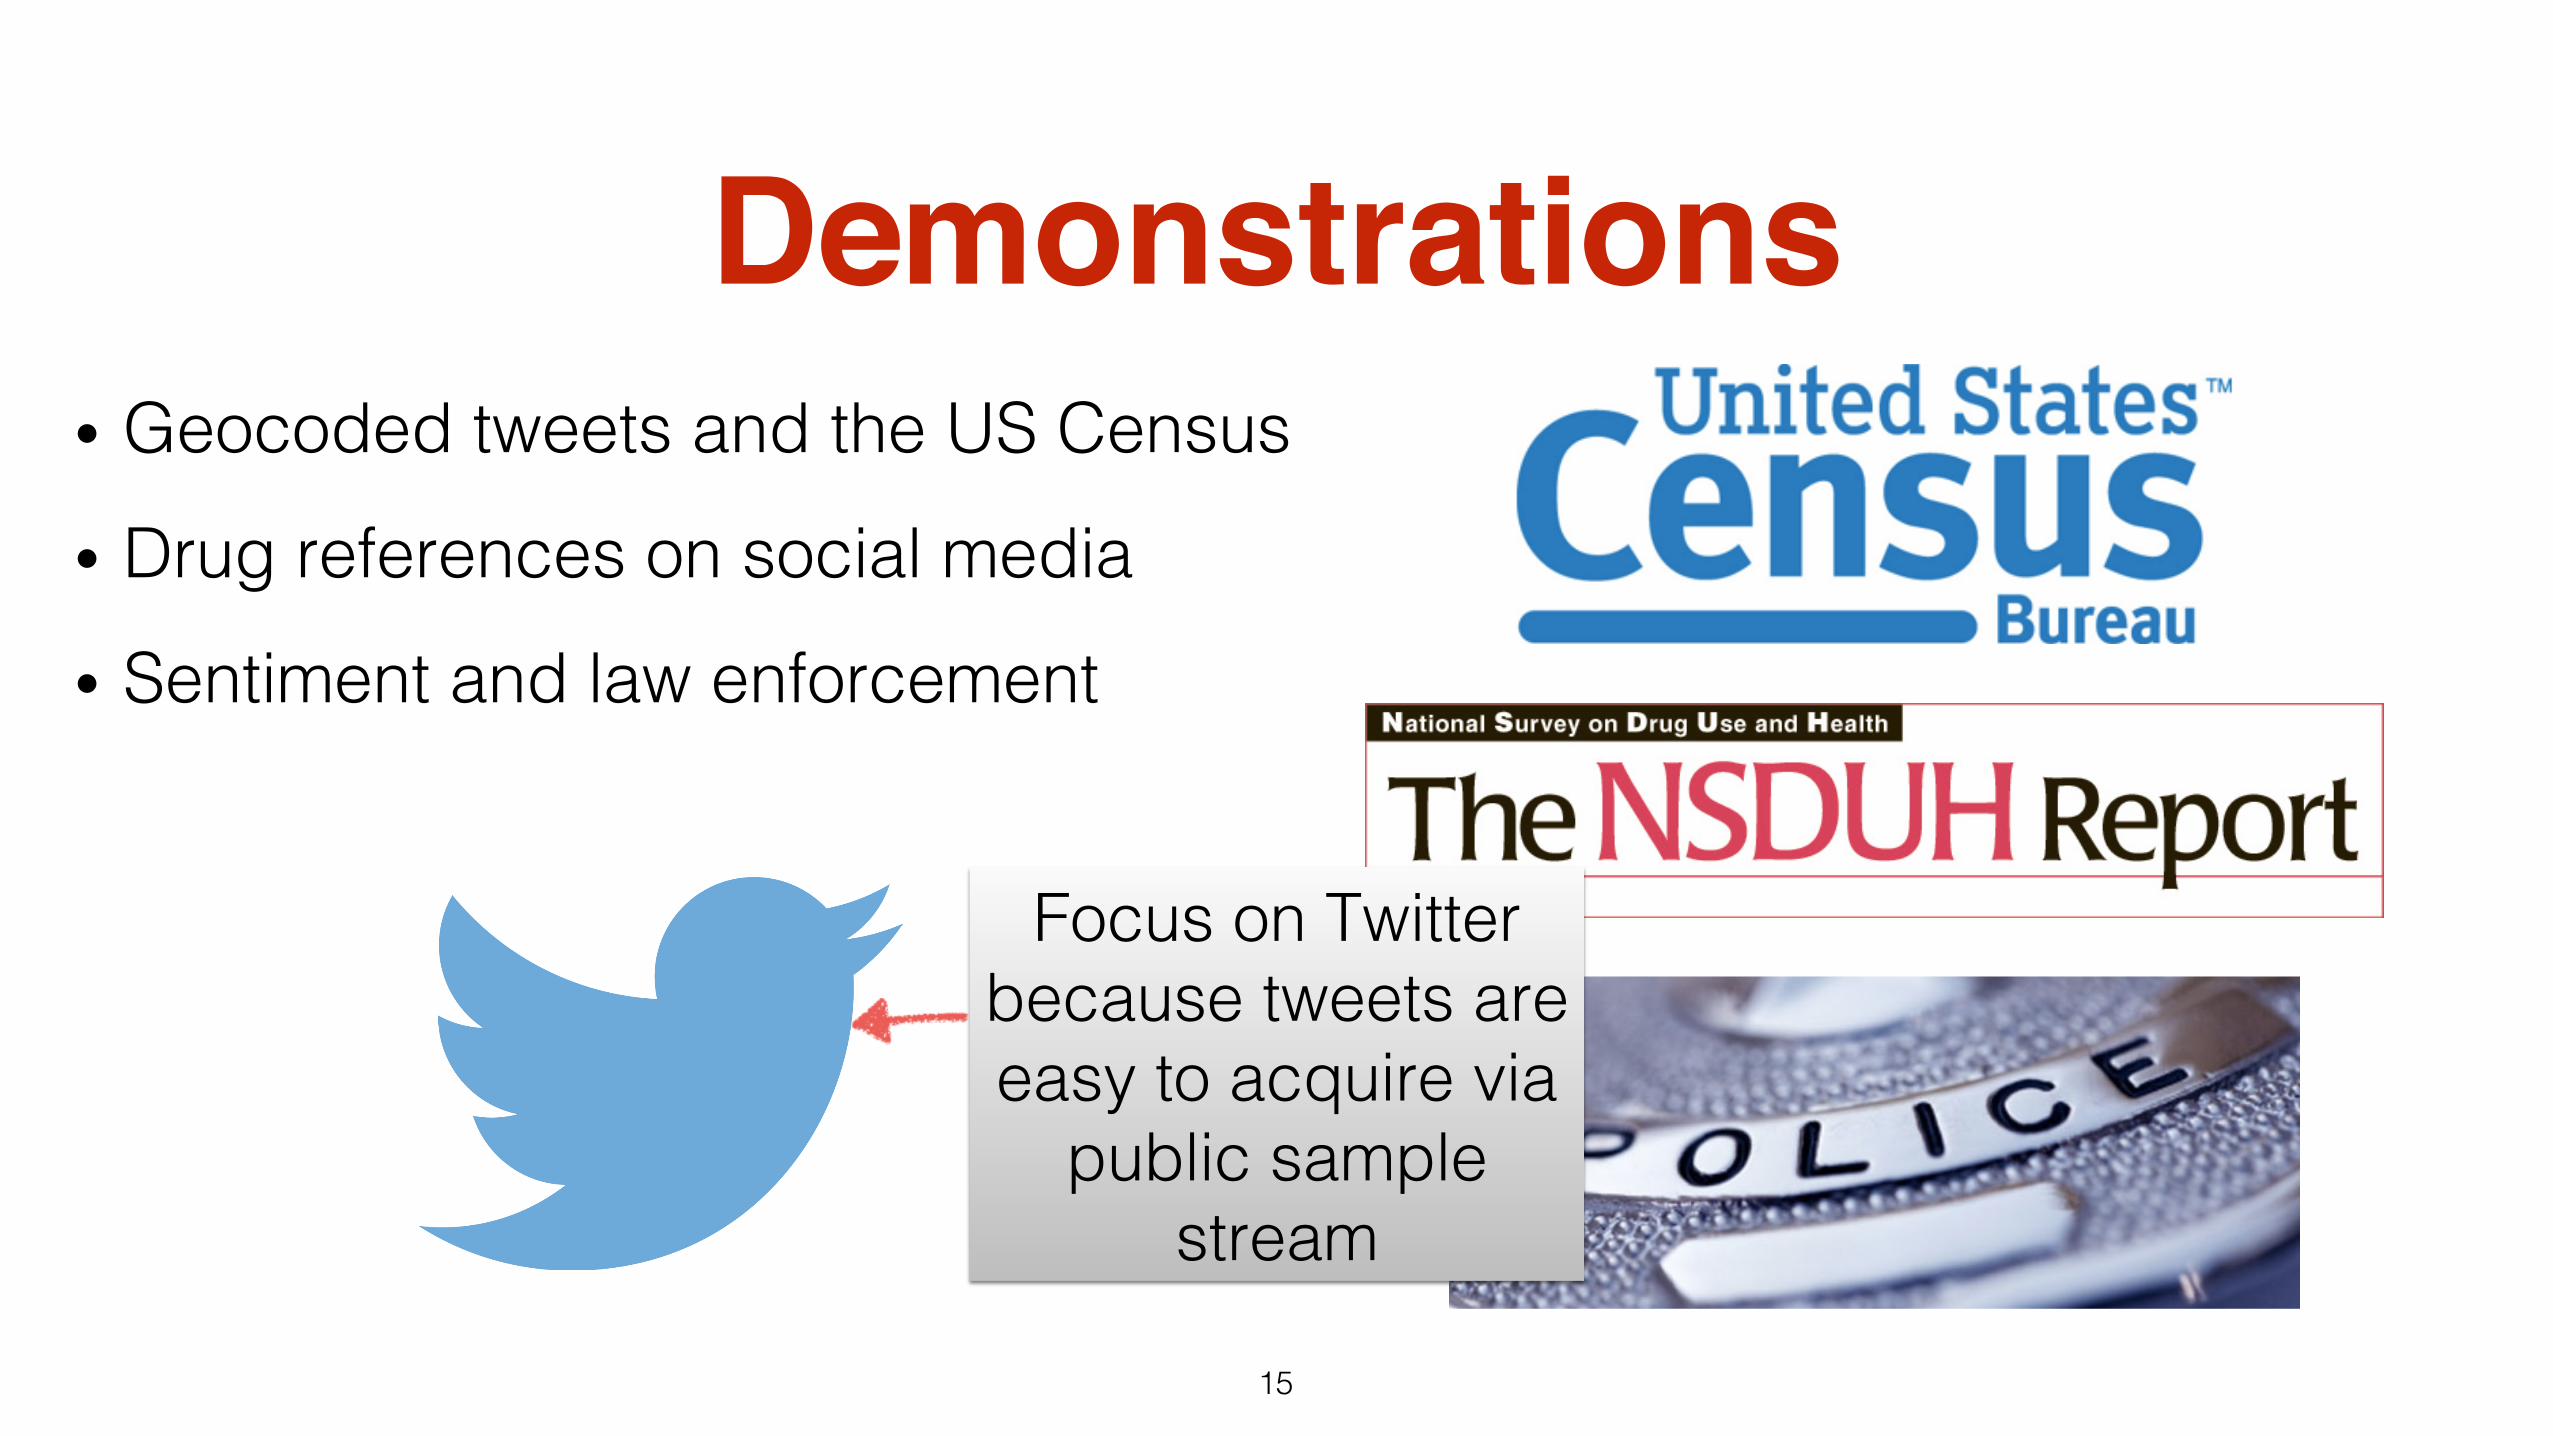
Demonstrations• Geocoded tweets and the US Census!
• Drug references on social media!
• Sentiment and law enforcement!
15!
Focus on Twitter because tweets are easy to acquire via
public sample stream!
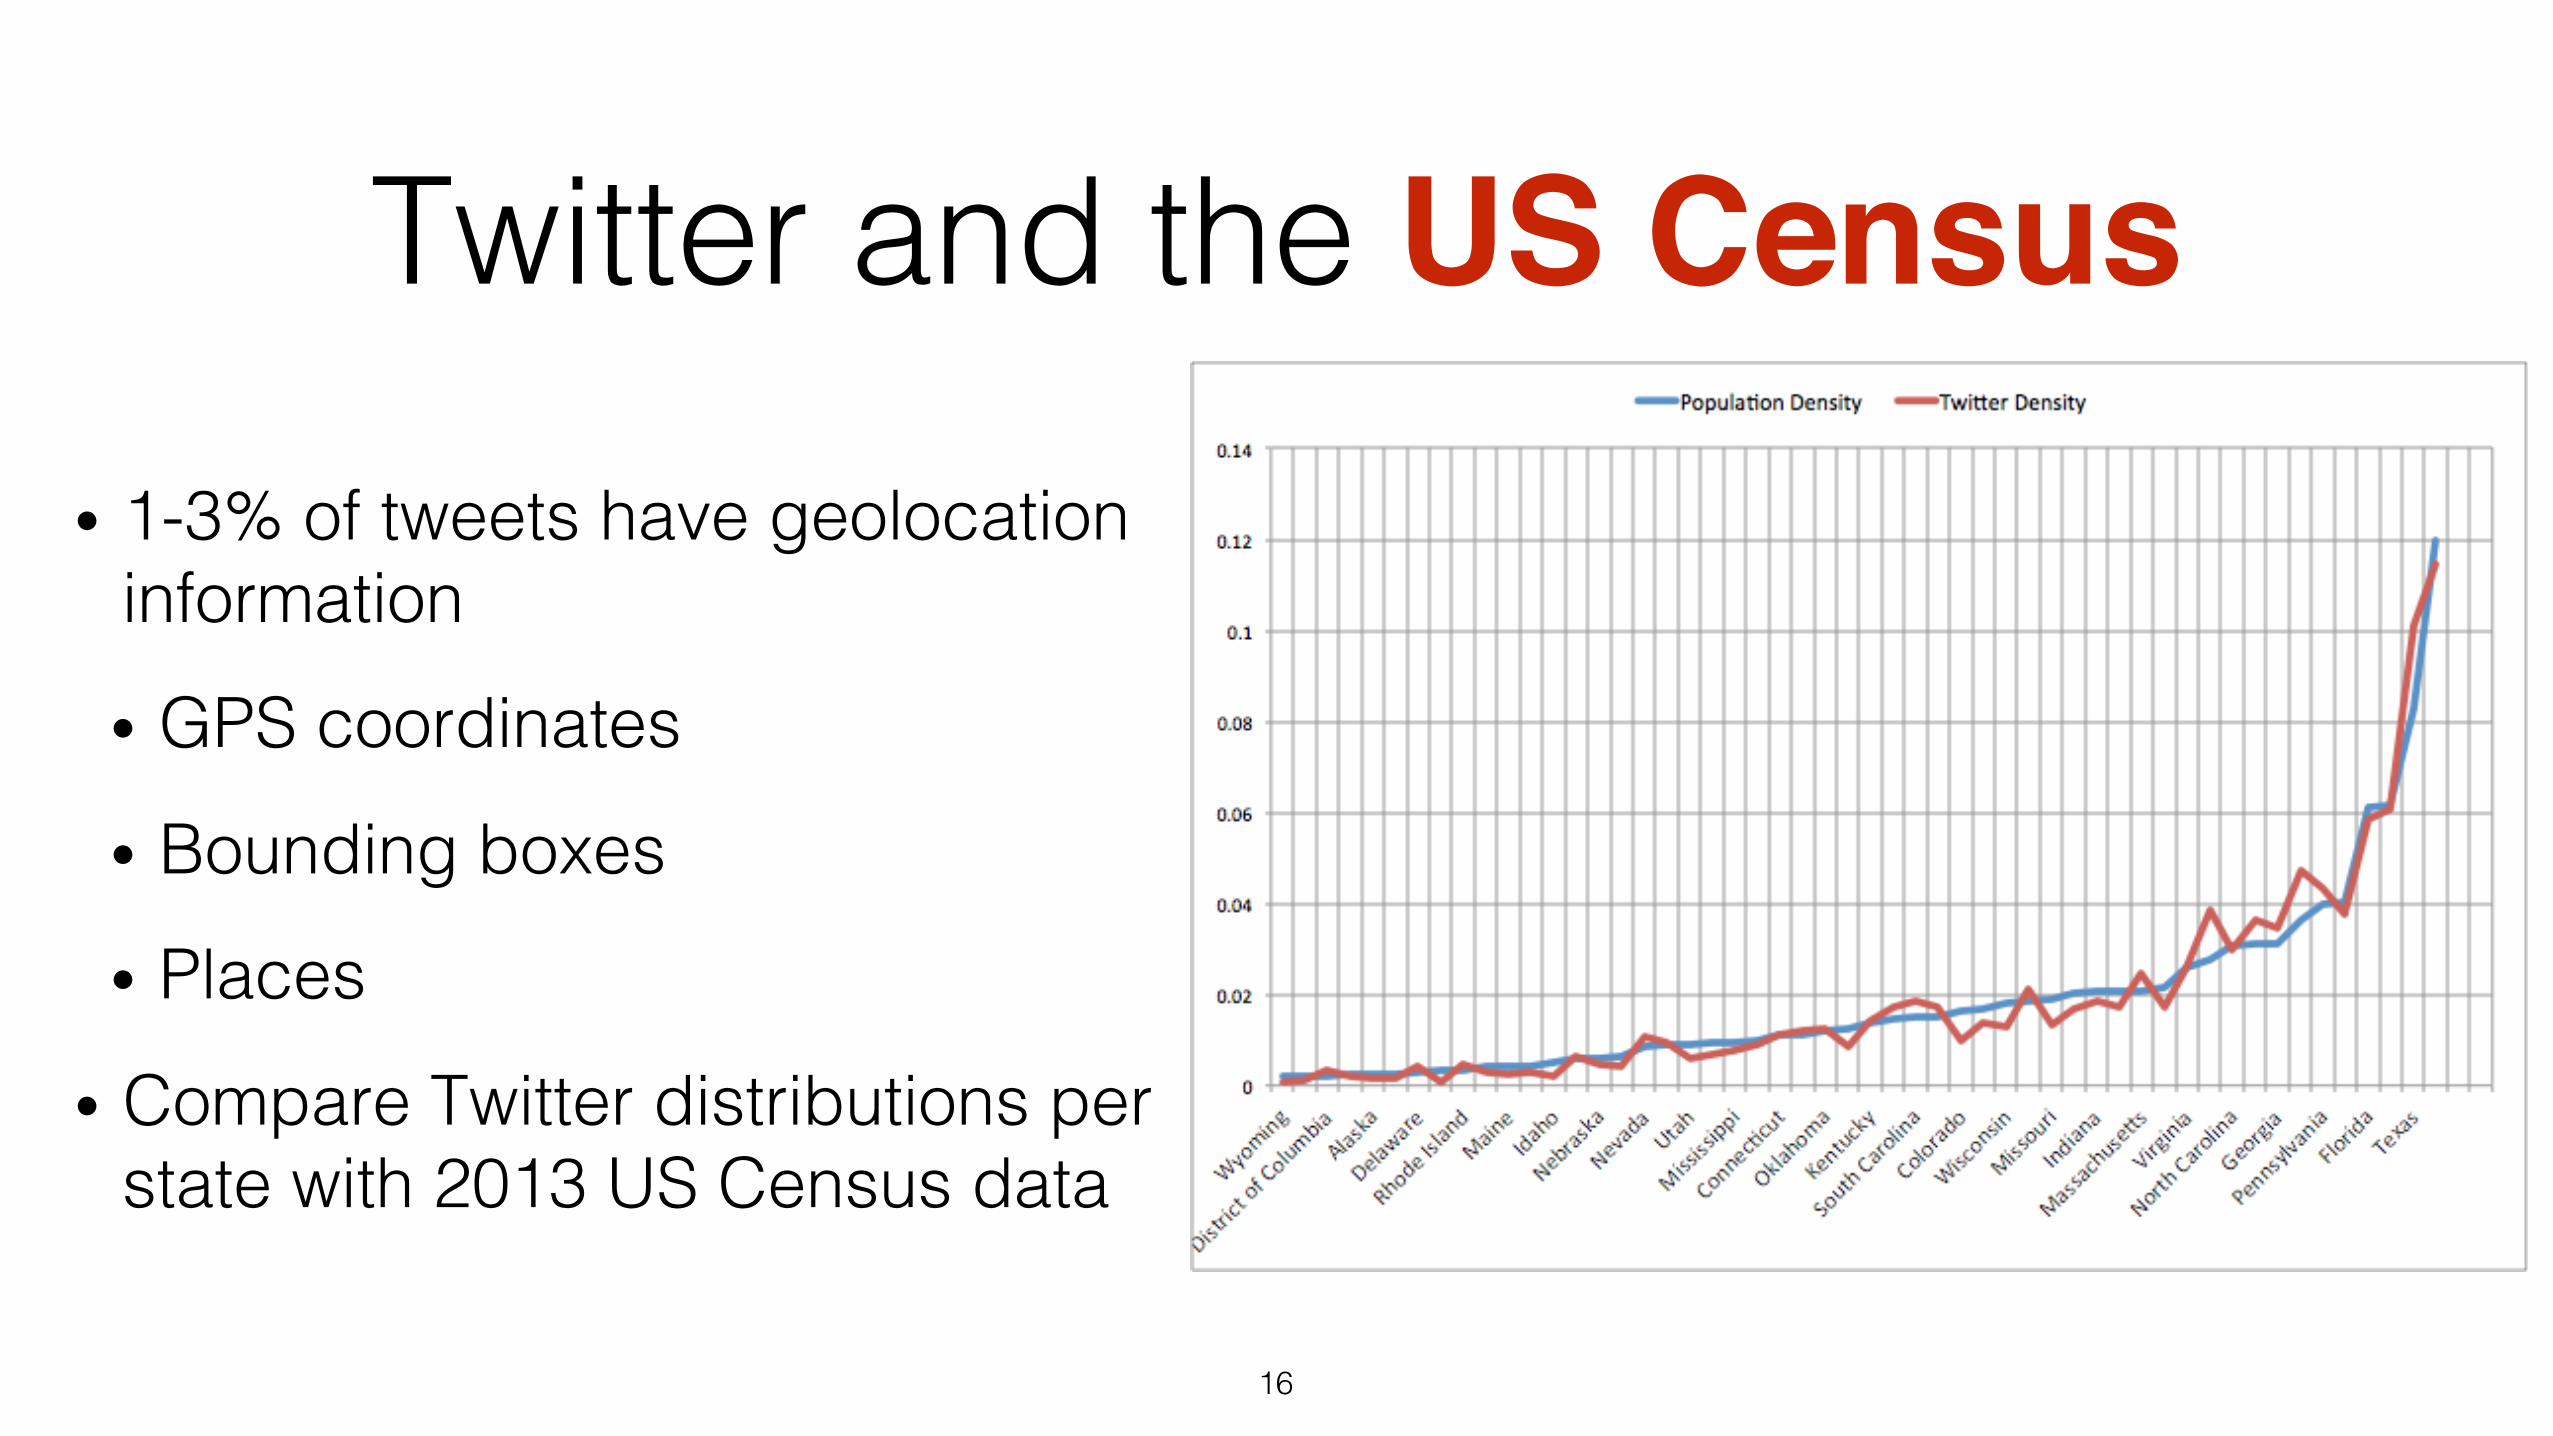
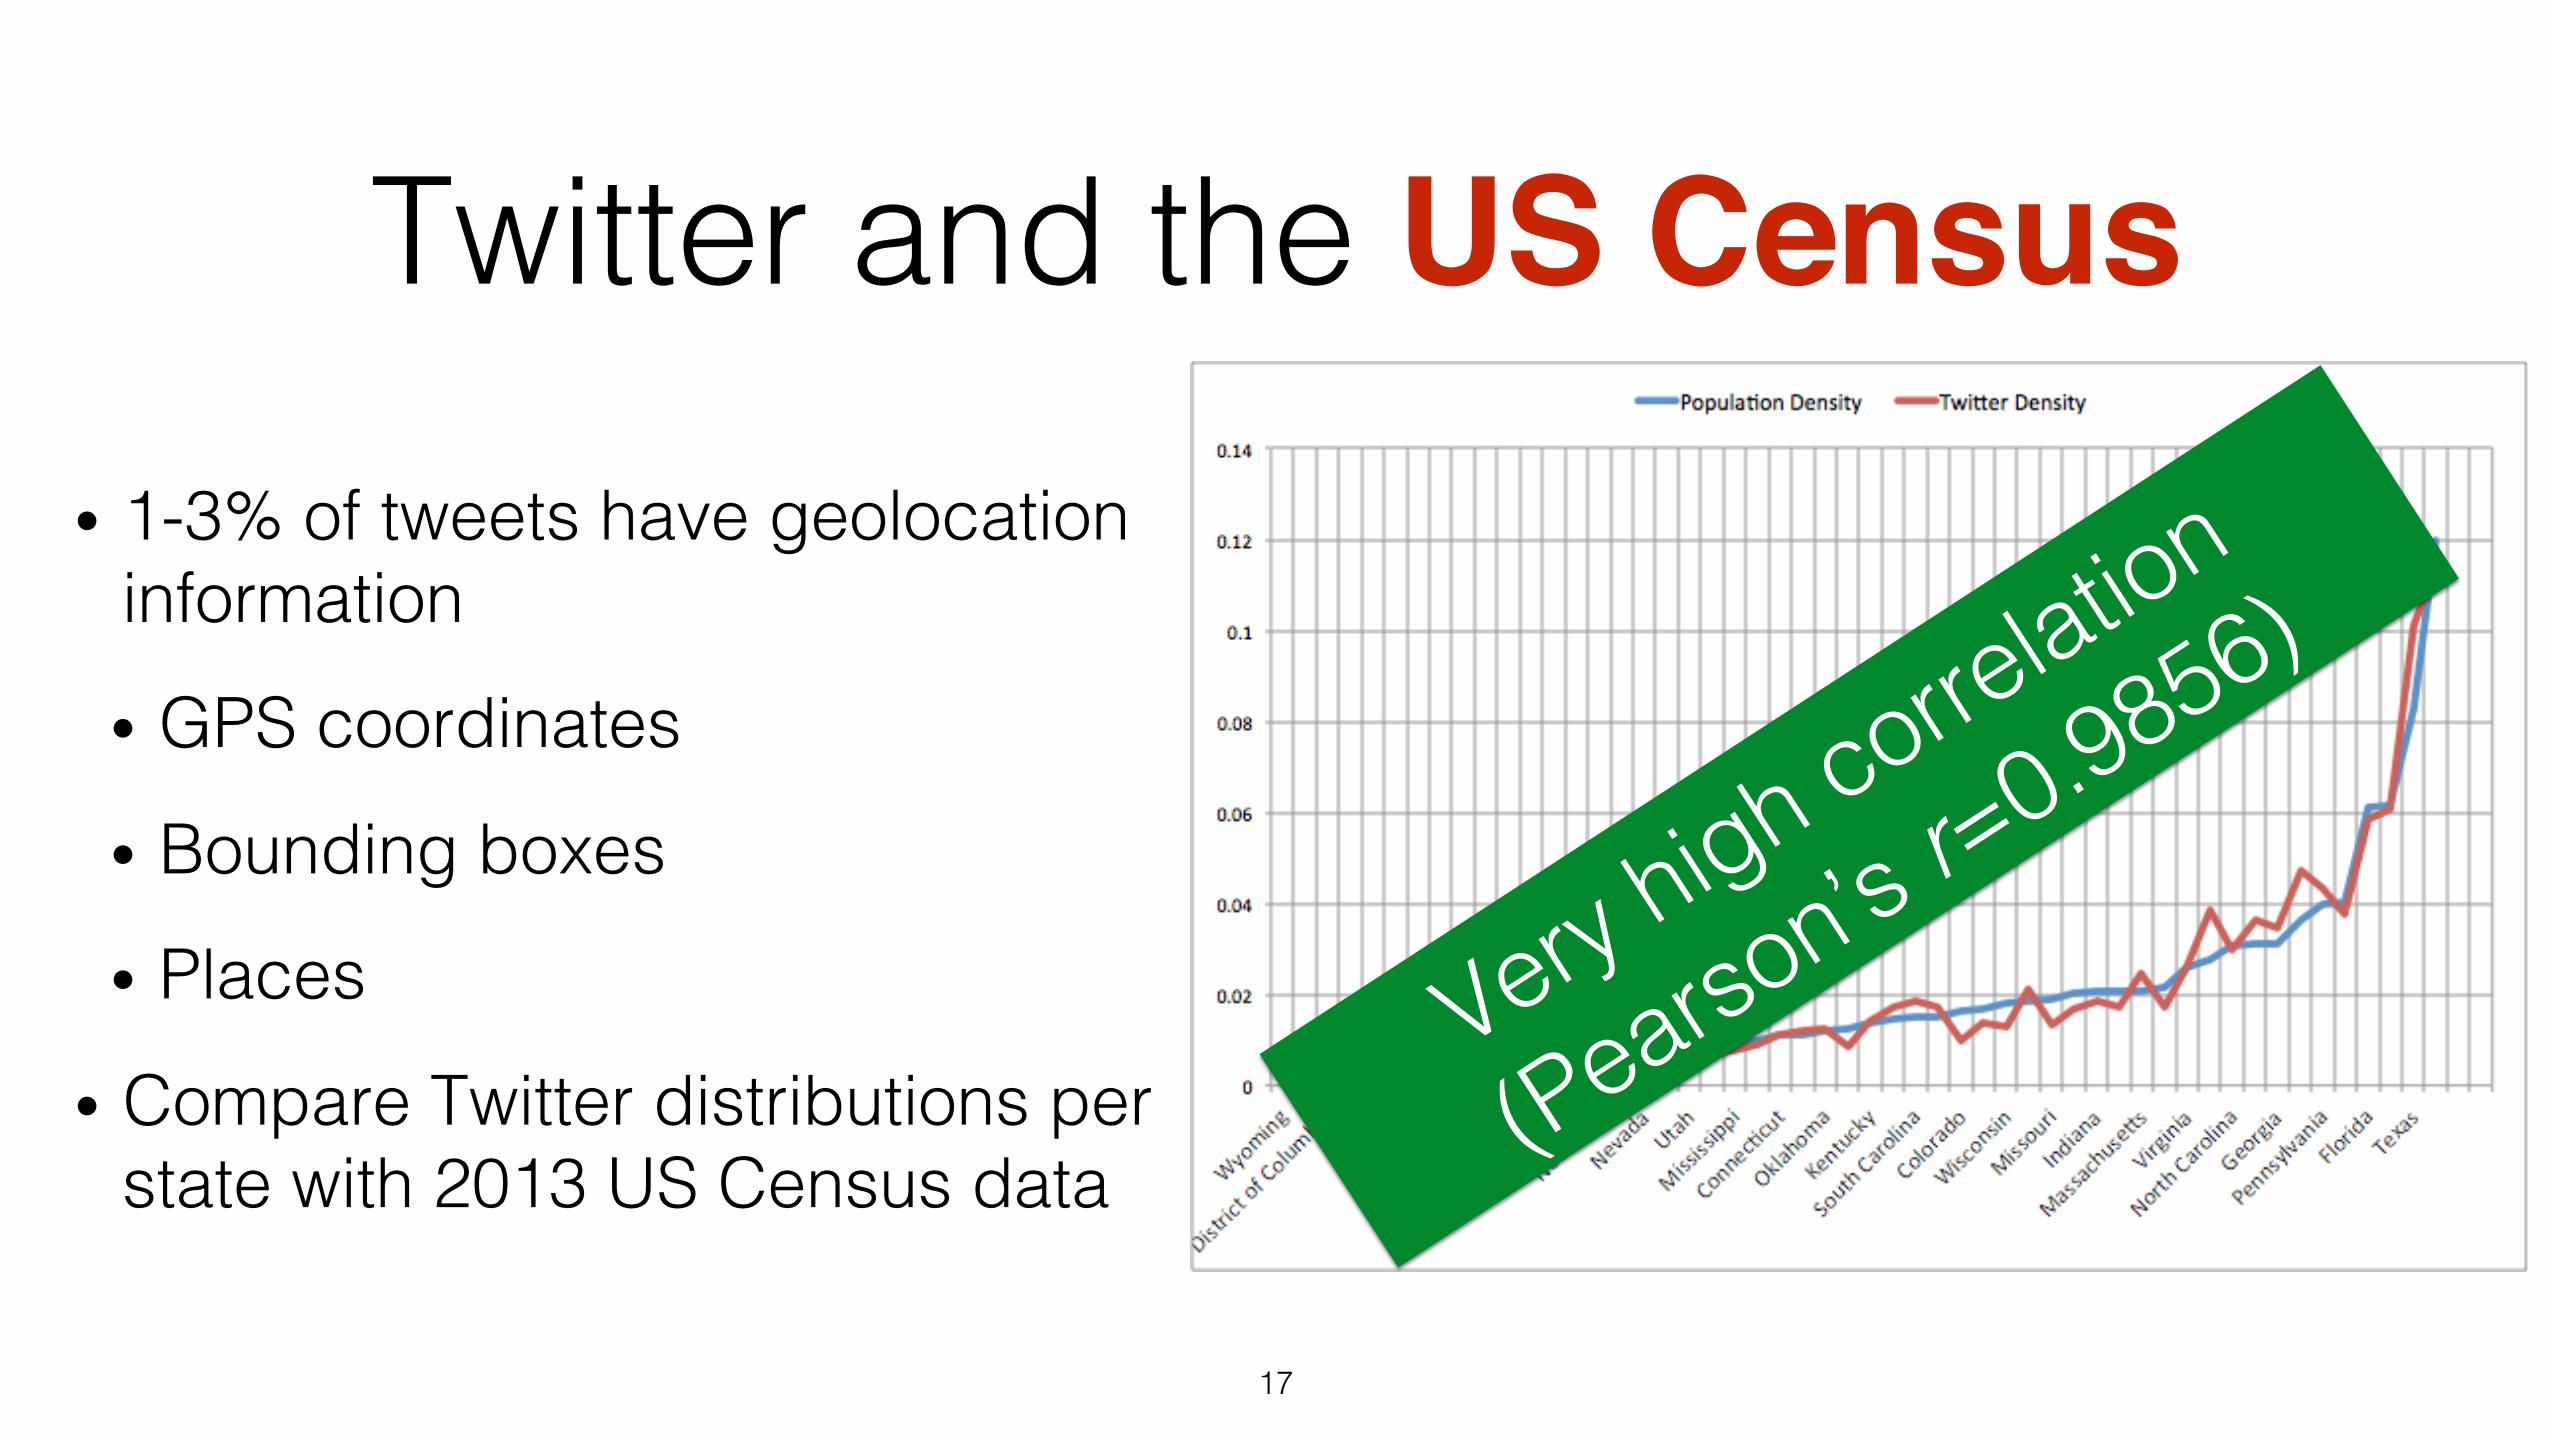
Twitter and the US Census• 1-3% of tweets have geolocation
information!
• GPS coordinates!
• Bounding boxes!
• Places!
• Compare Twitter distributions per state with 2013 US Census data!
16!
• 1-3% of tweets have geolocation information!
• GPS coordinates!
• Bounding boxes!
• Places!
• Compare Twitter distributions per state with 2013 US Census data!
17!
Twitter and the US Census
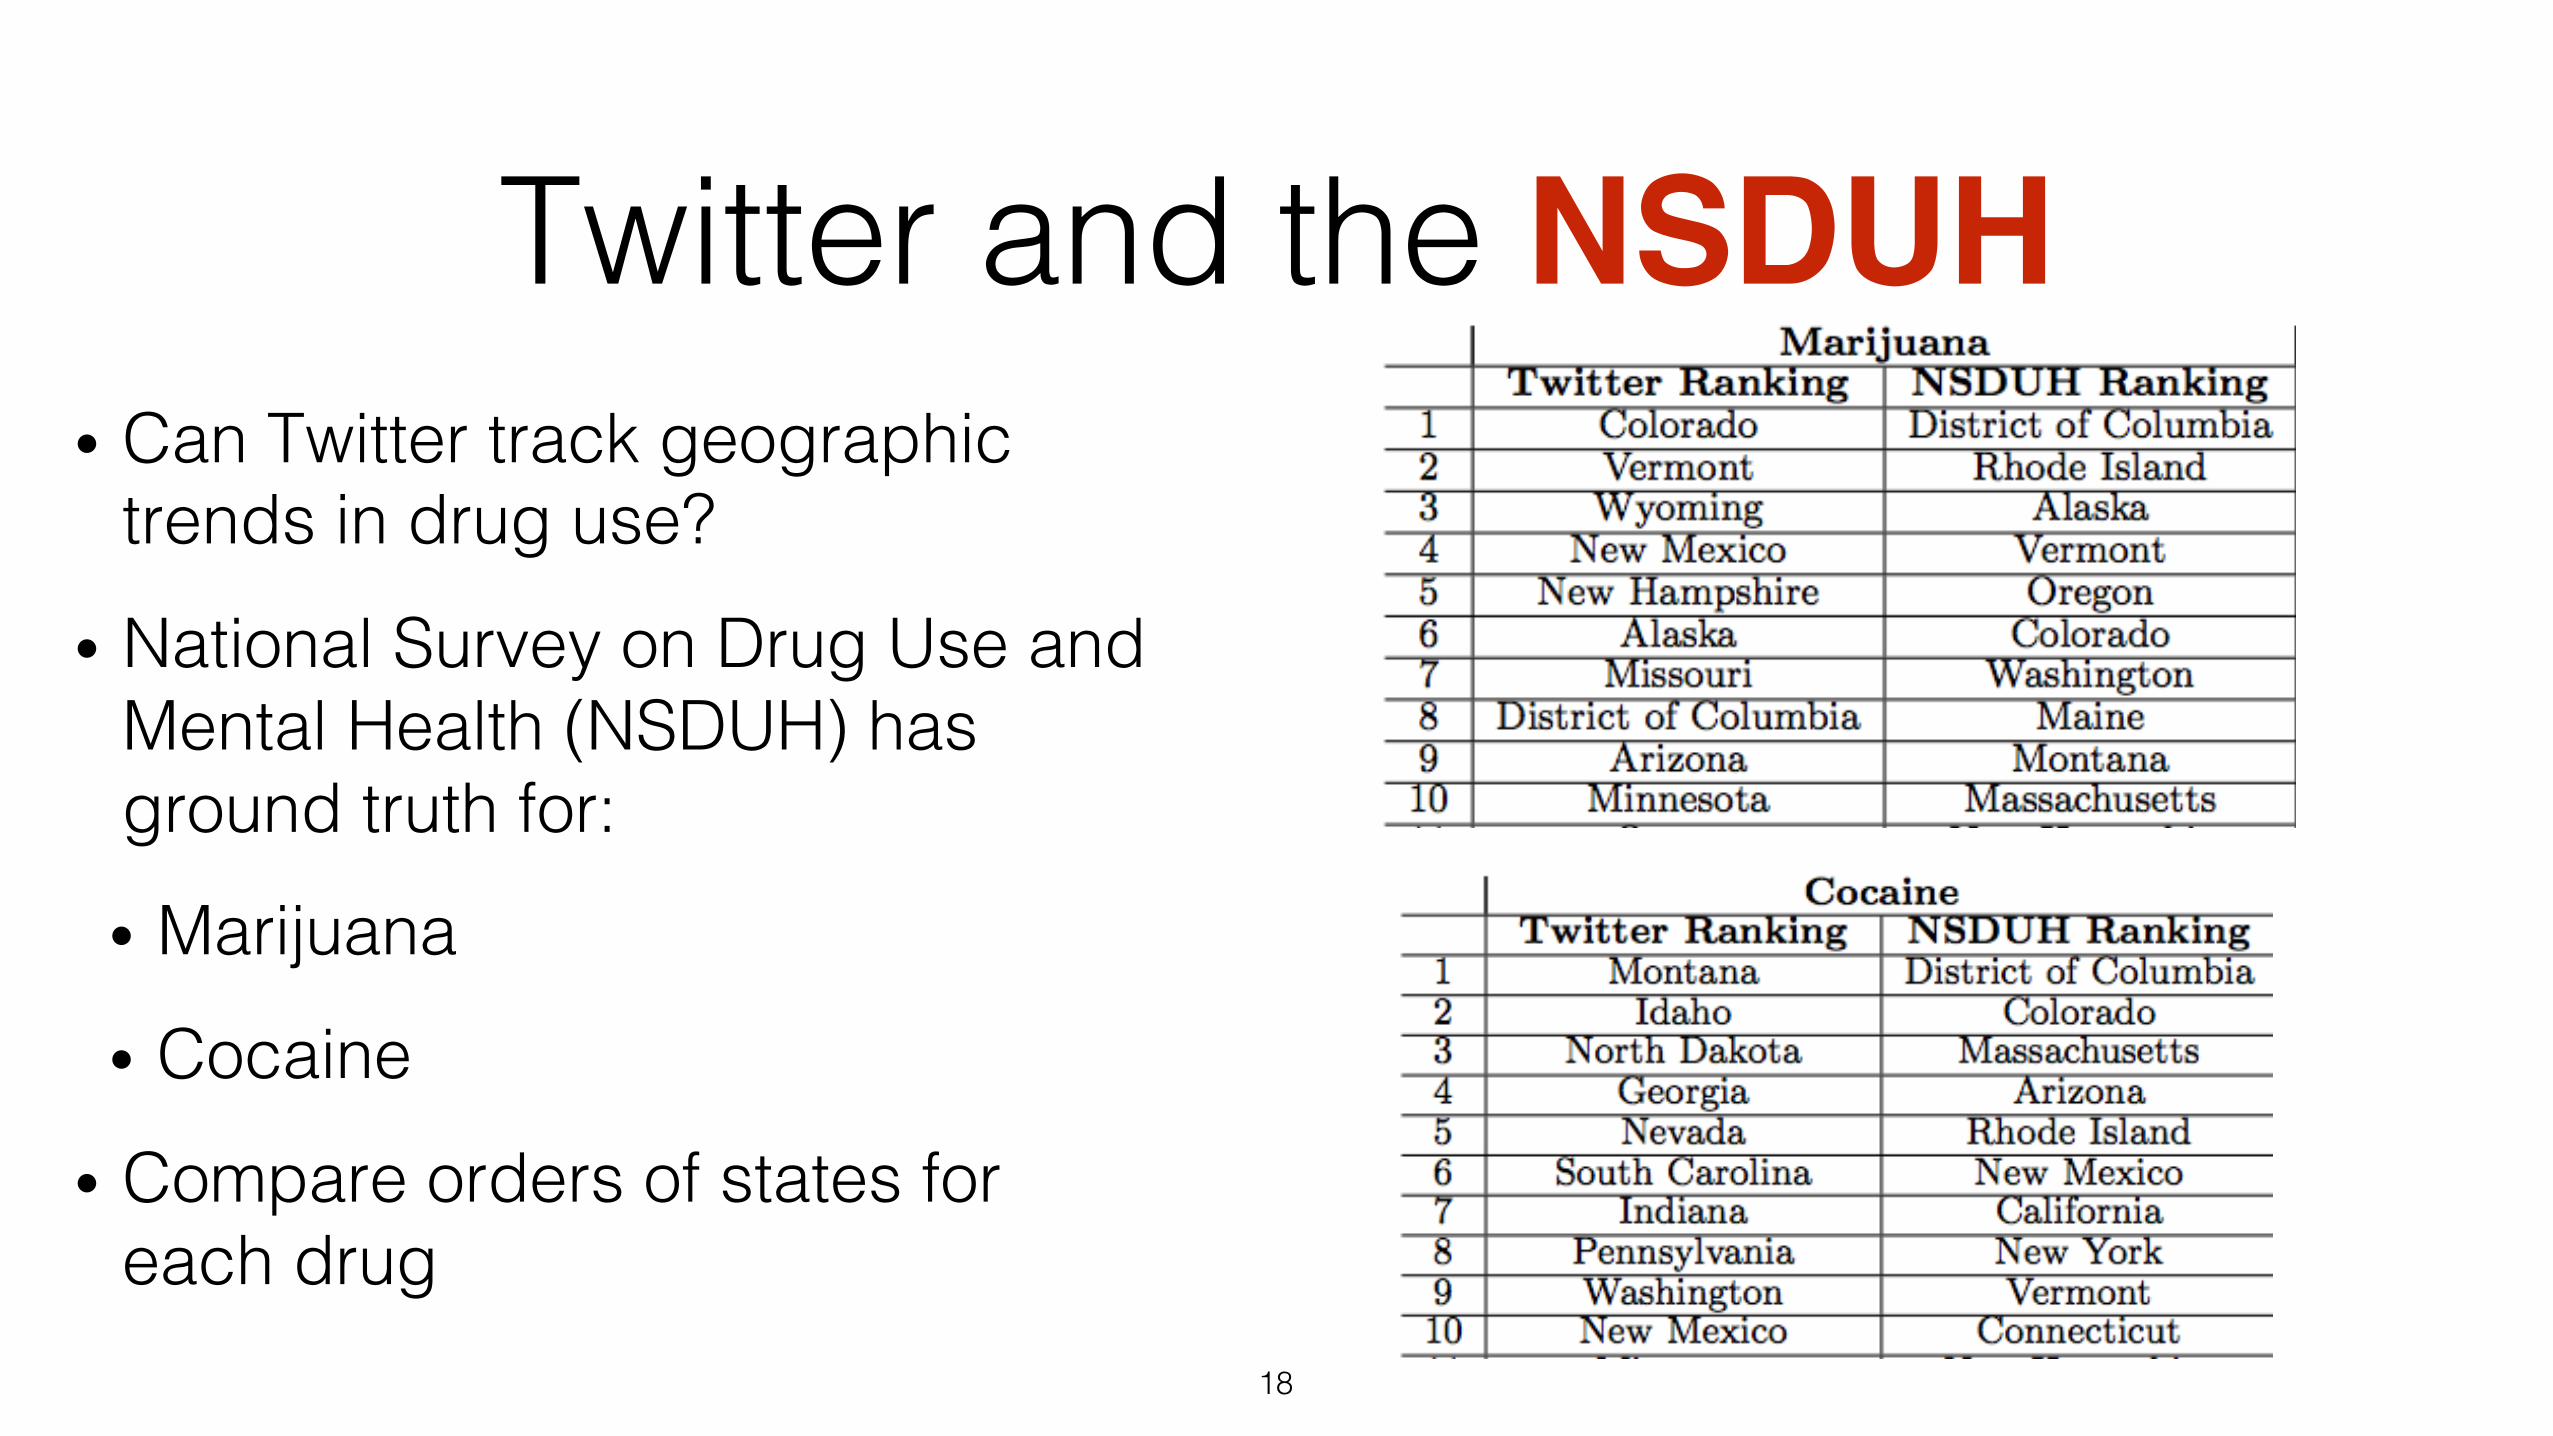
• Can Twitter track geographic trends in drug use?!
• National Survey on Drug Use and Mental Health (NSDUH) has ground truth for:!• Marijuana!
• Cocaine!
• Compare orders of states for each drug!
18!
Twitter and the NSDUH
• Can Twitter track geographic trends in drug use?!
• National Survey on Drug Use and Mental Health (NSDUH) has ground truth for:!• Marijuana!
• Cocaine!
• Compare orders of states for each drug!
19!
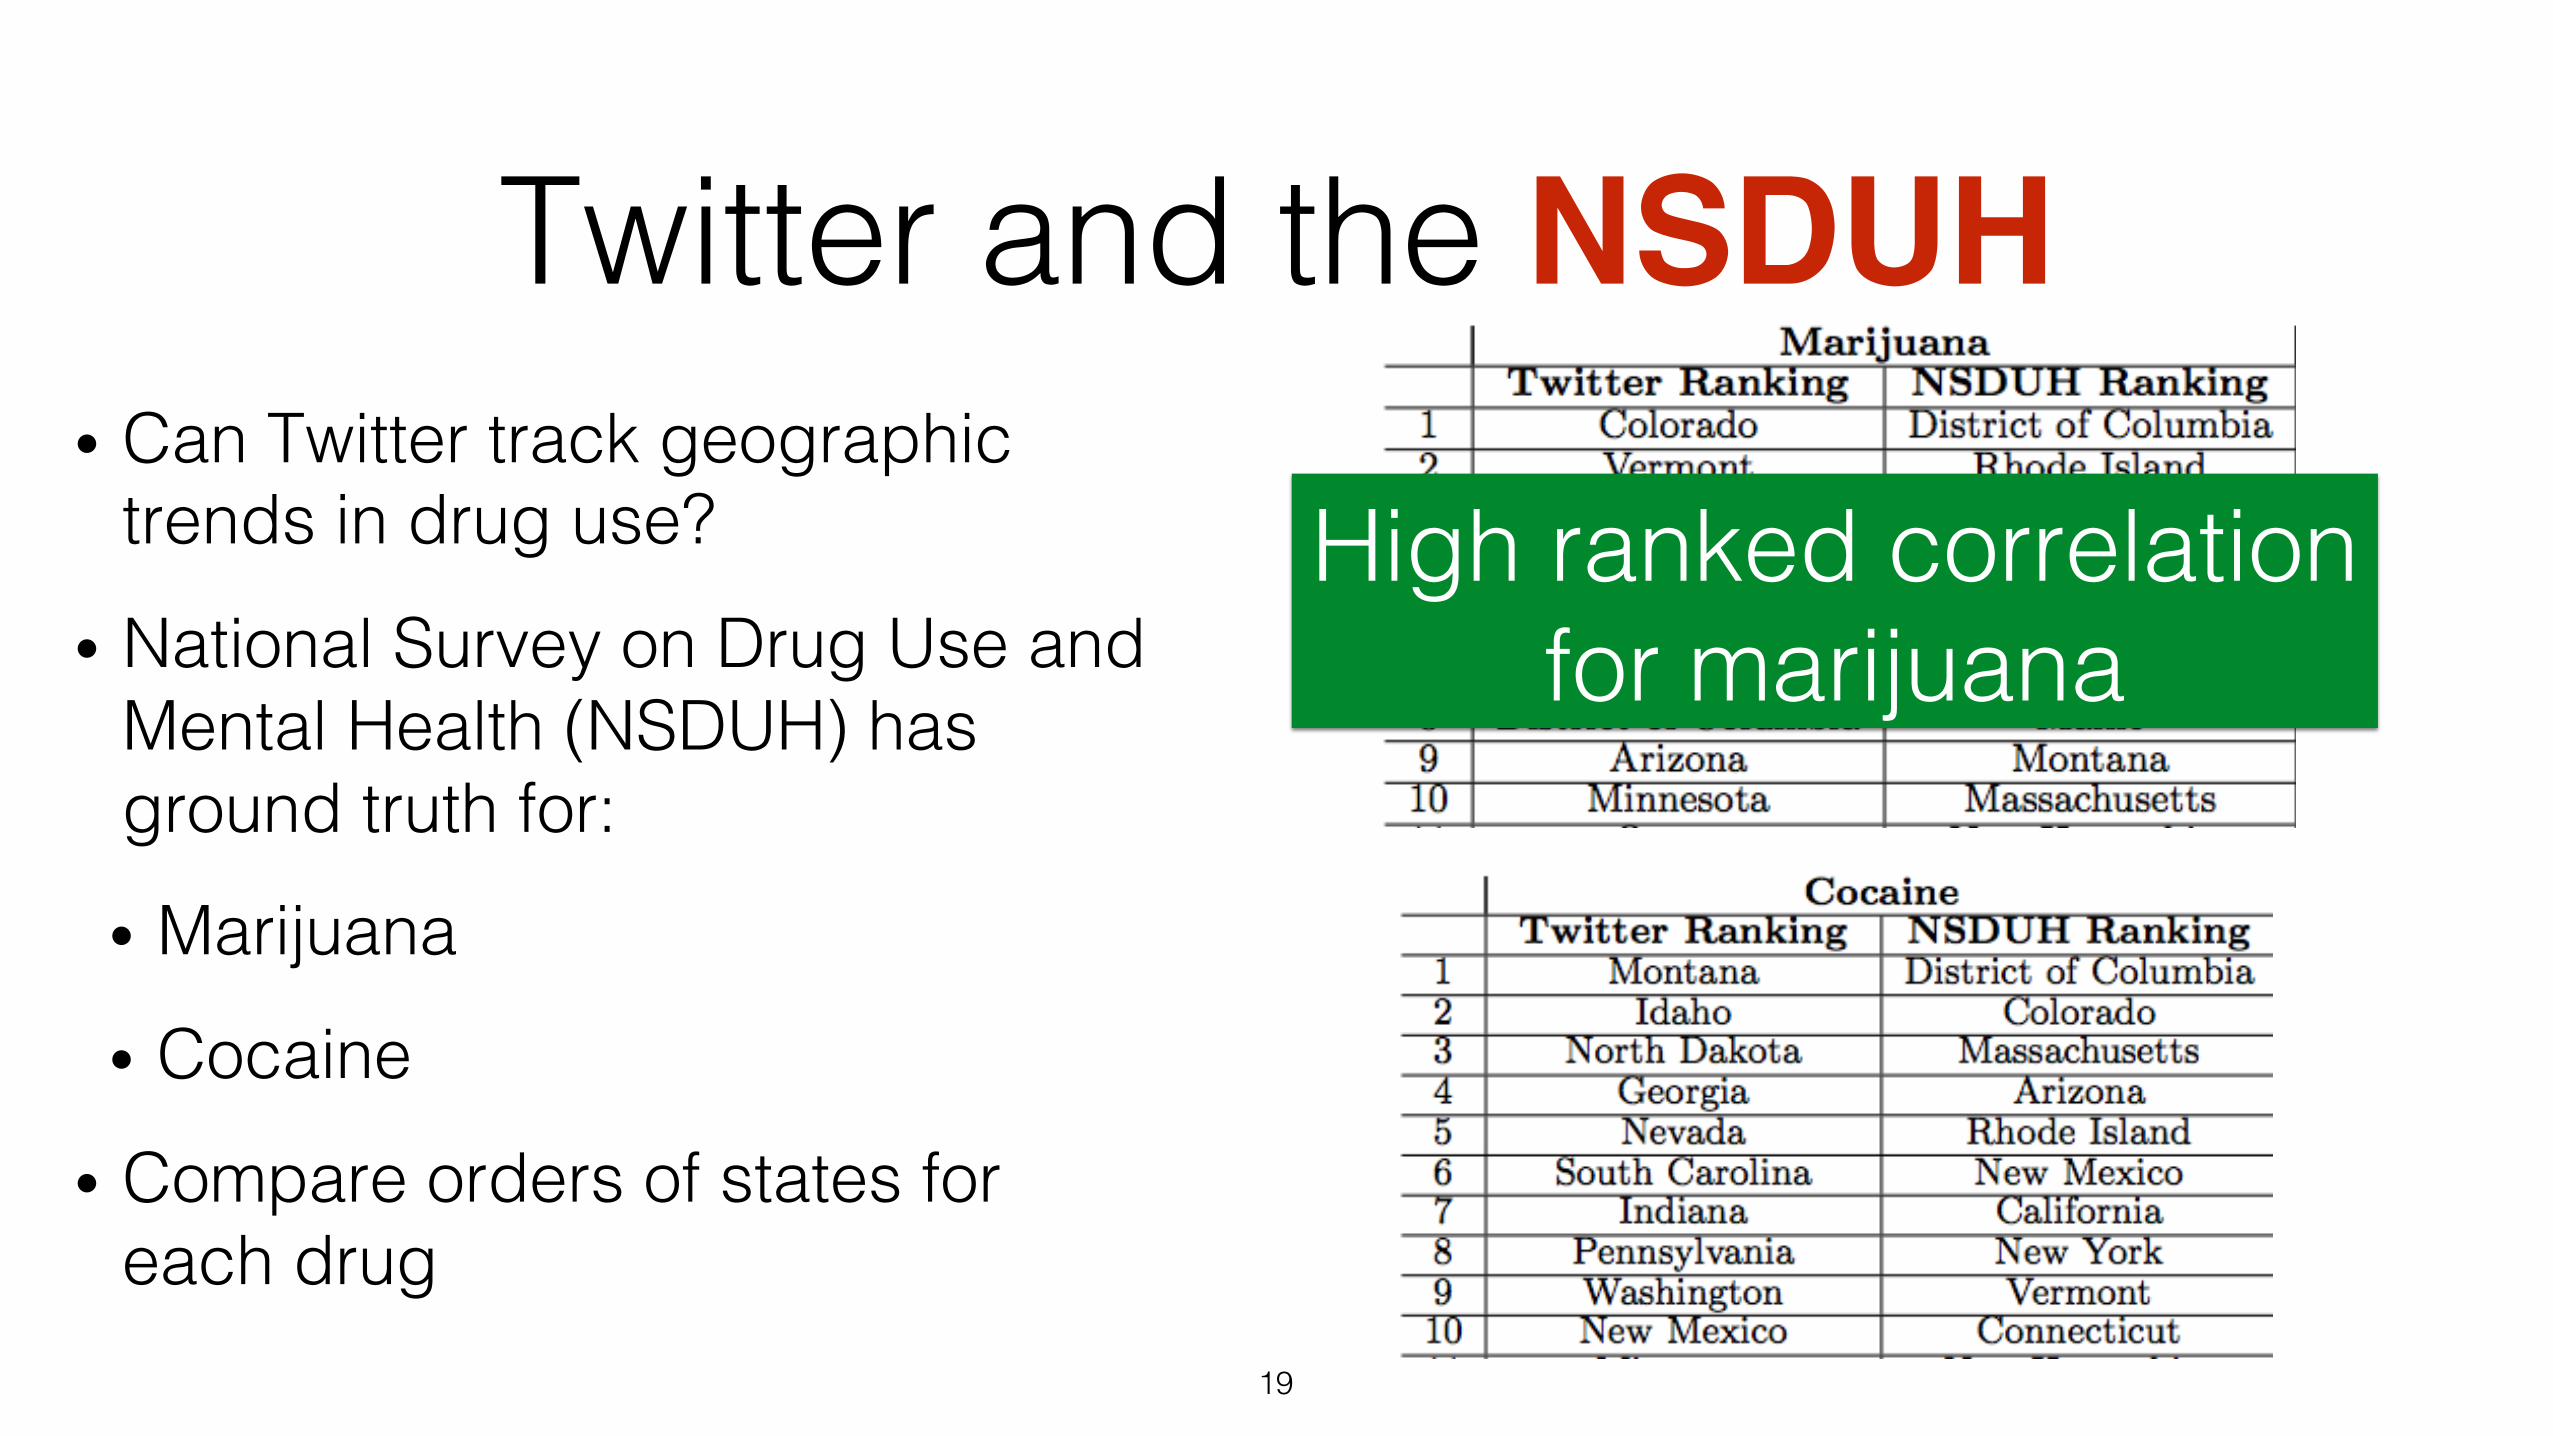
High ranked correlation!for marijuana!
Twitter and the NSDUH
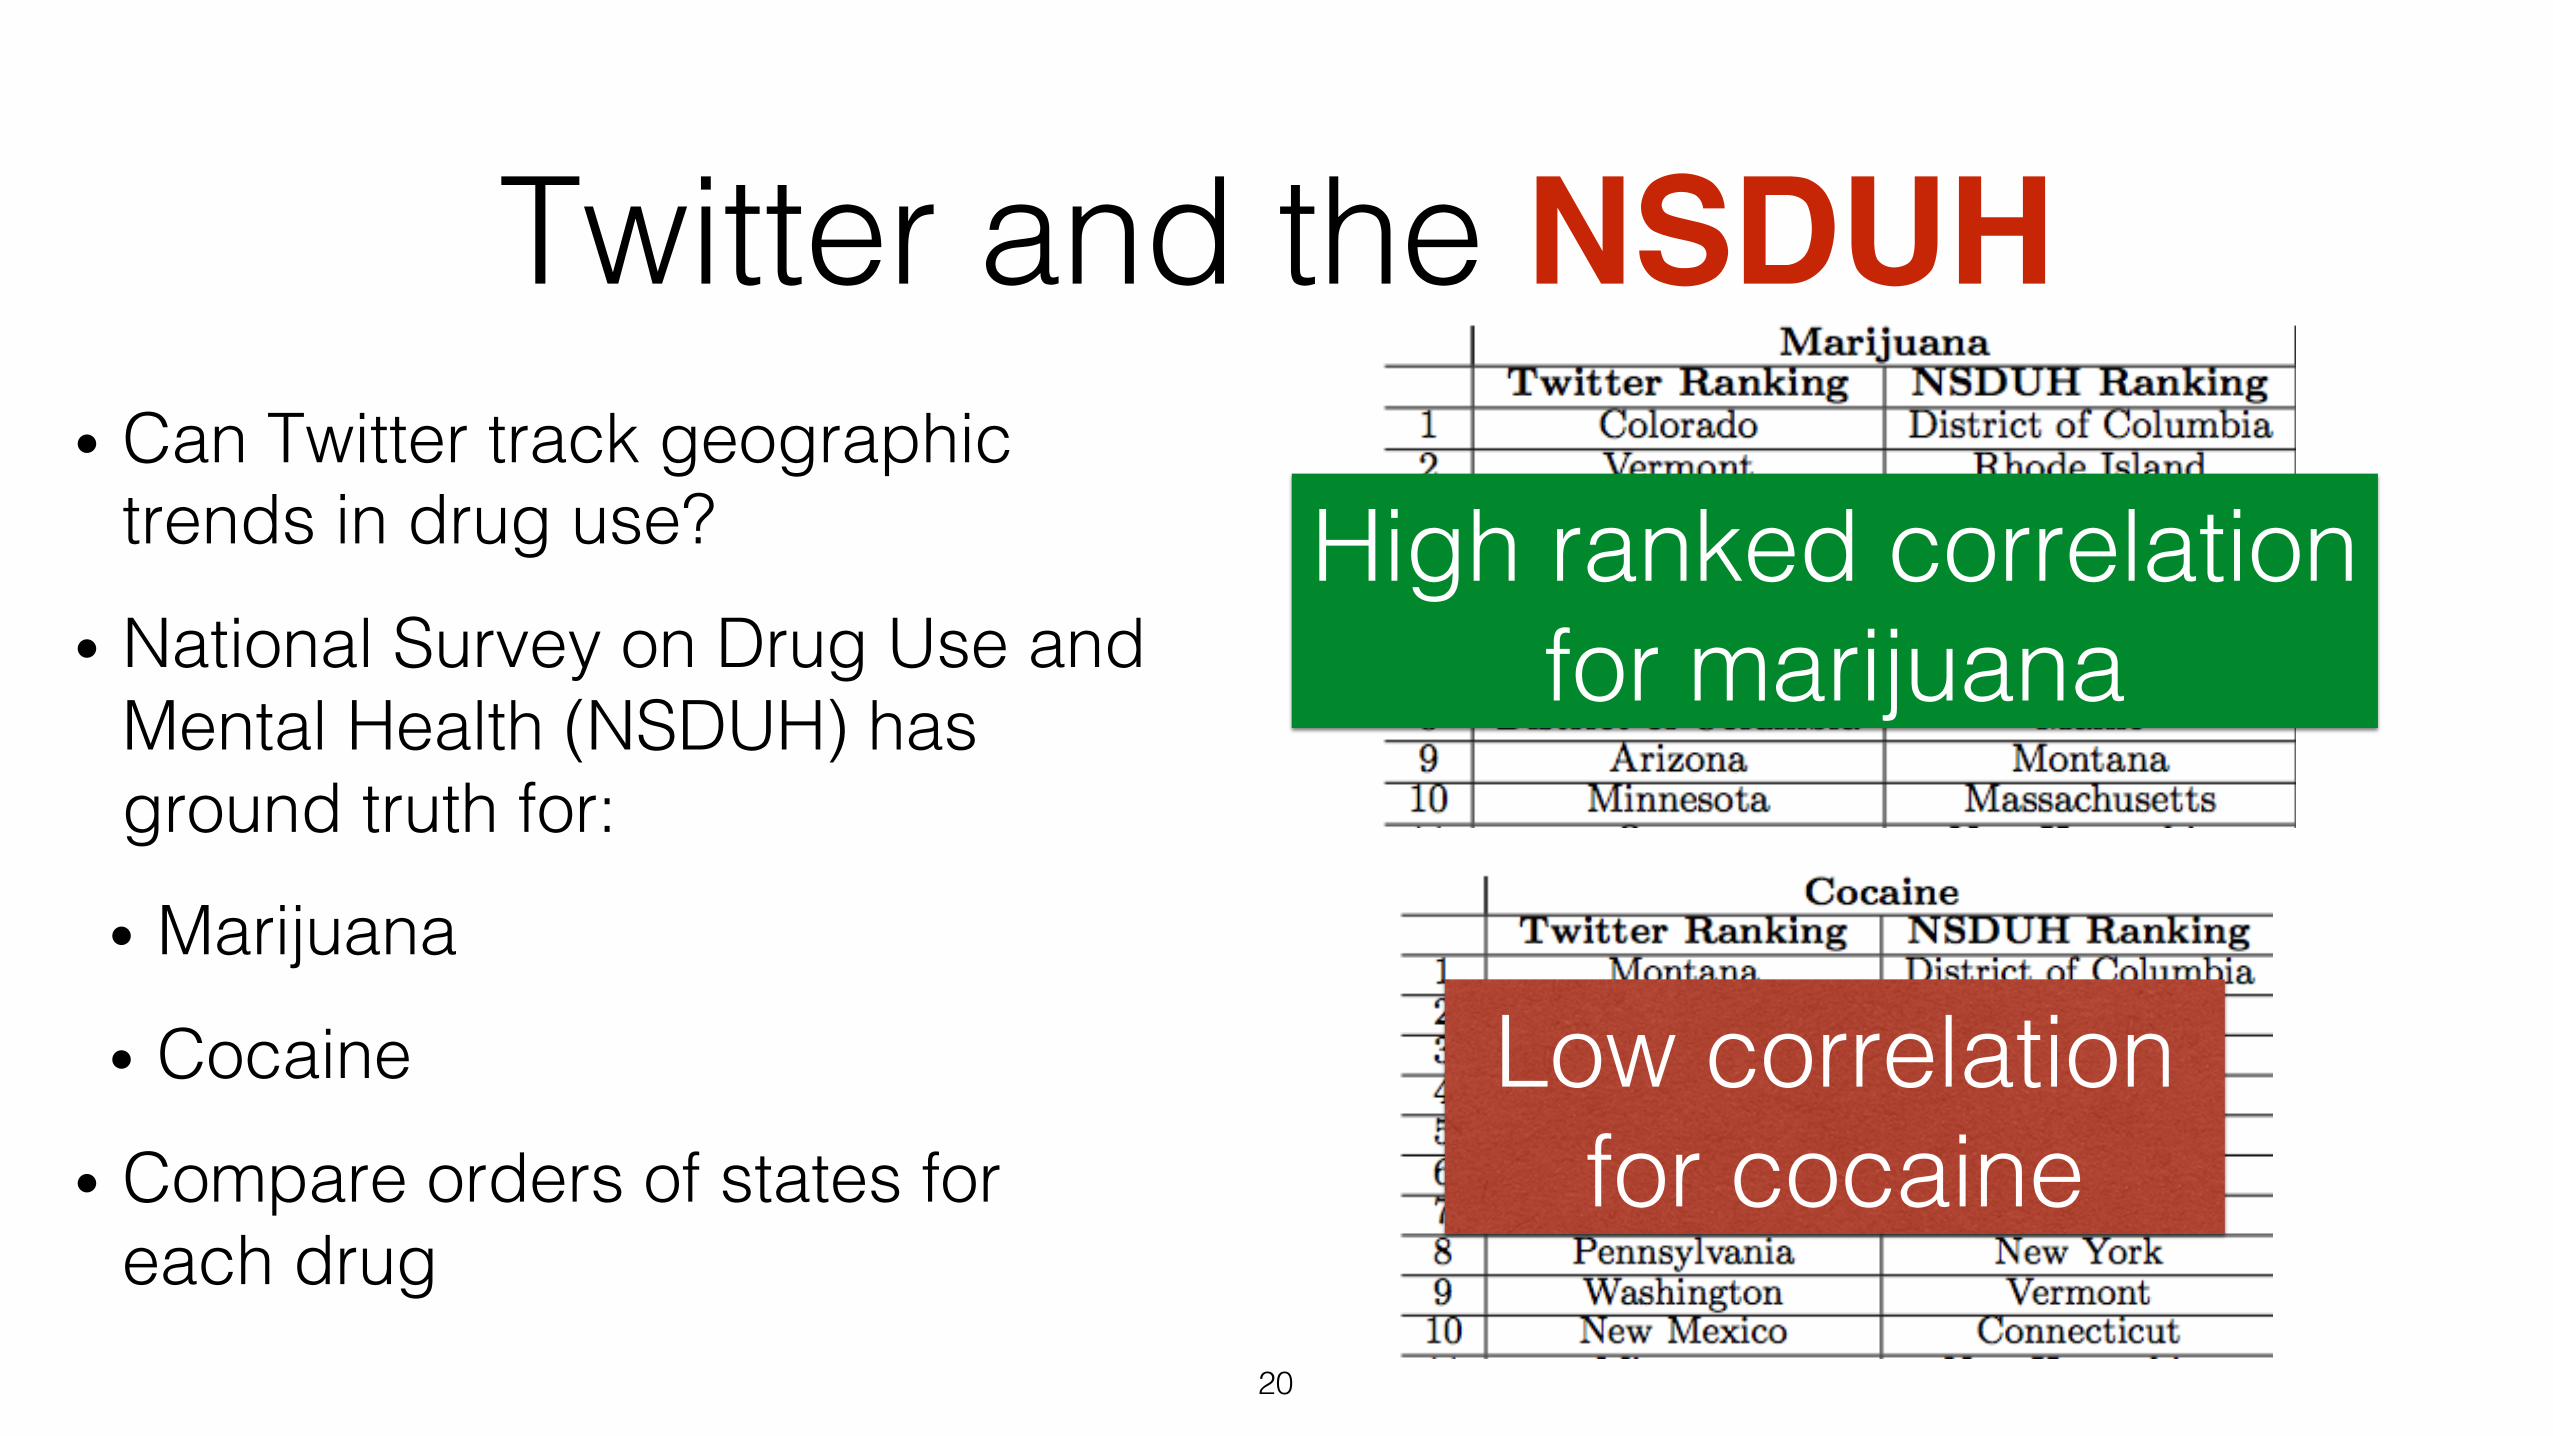
• Can Twitter track geographic trends in drug use?!
• National Survey on Drug Use and Mental Health (NSDUH) has ground truth for:!• Marijuana!
• Cocaine!
• Compare orders of states for each drug!
20!
High ranked correlation!for marijuana!
Low correlation!for cocaine!
Twitter and the NSDUH
• Can we measure public response to law enforcement?!
• Outreach from law enforcement to community is important!
21!
Twitter Sentiment and Police
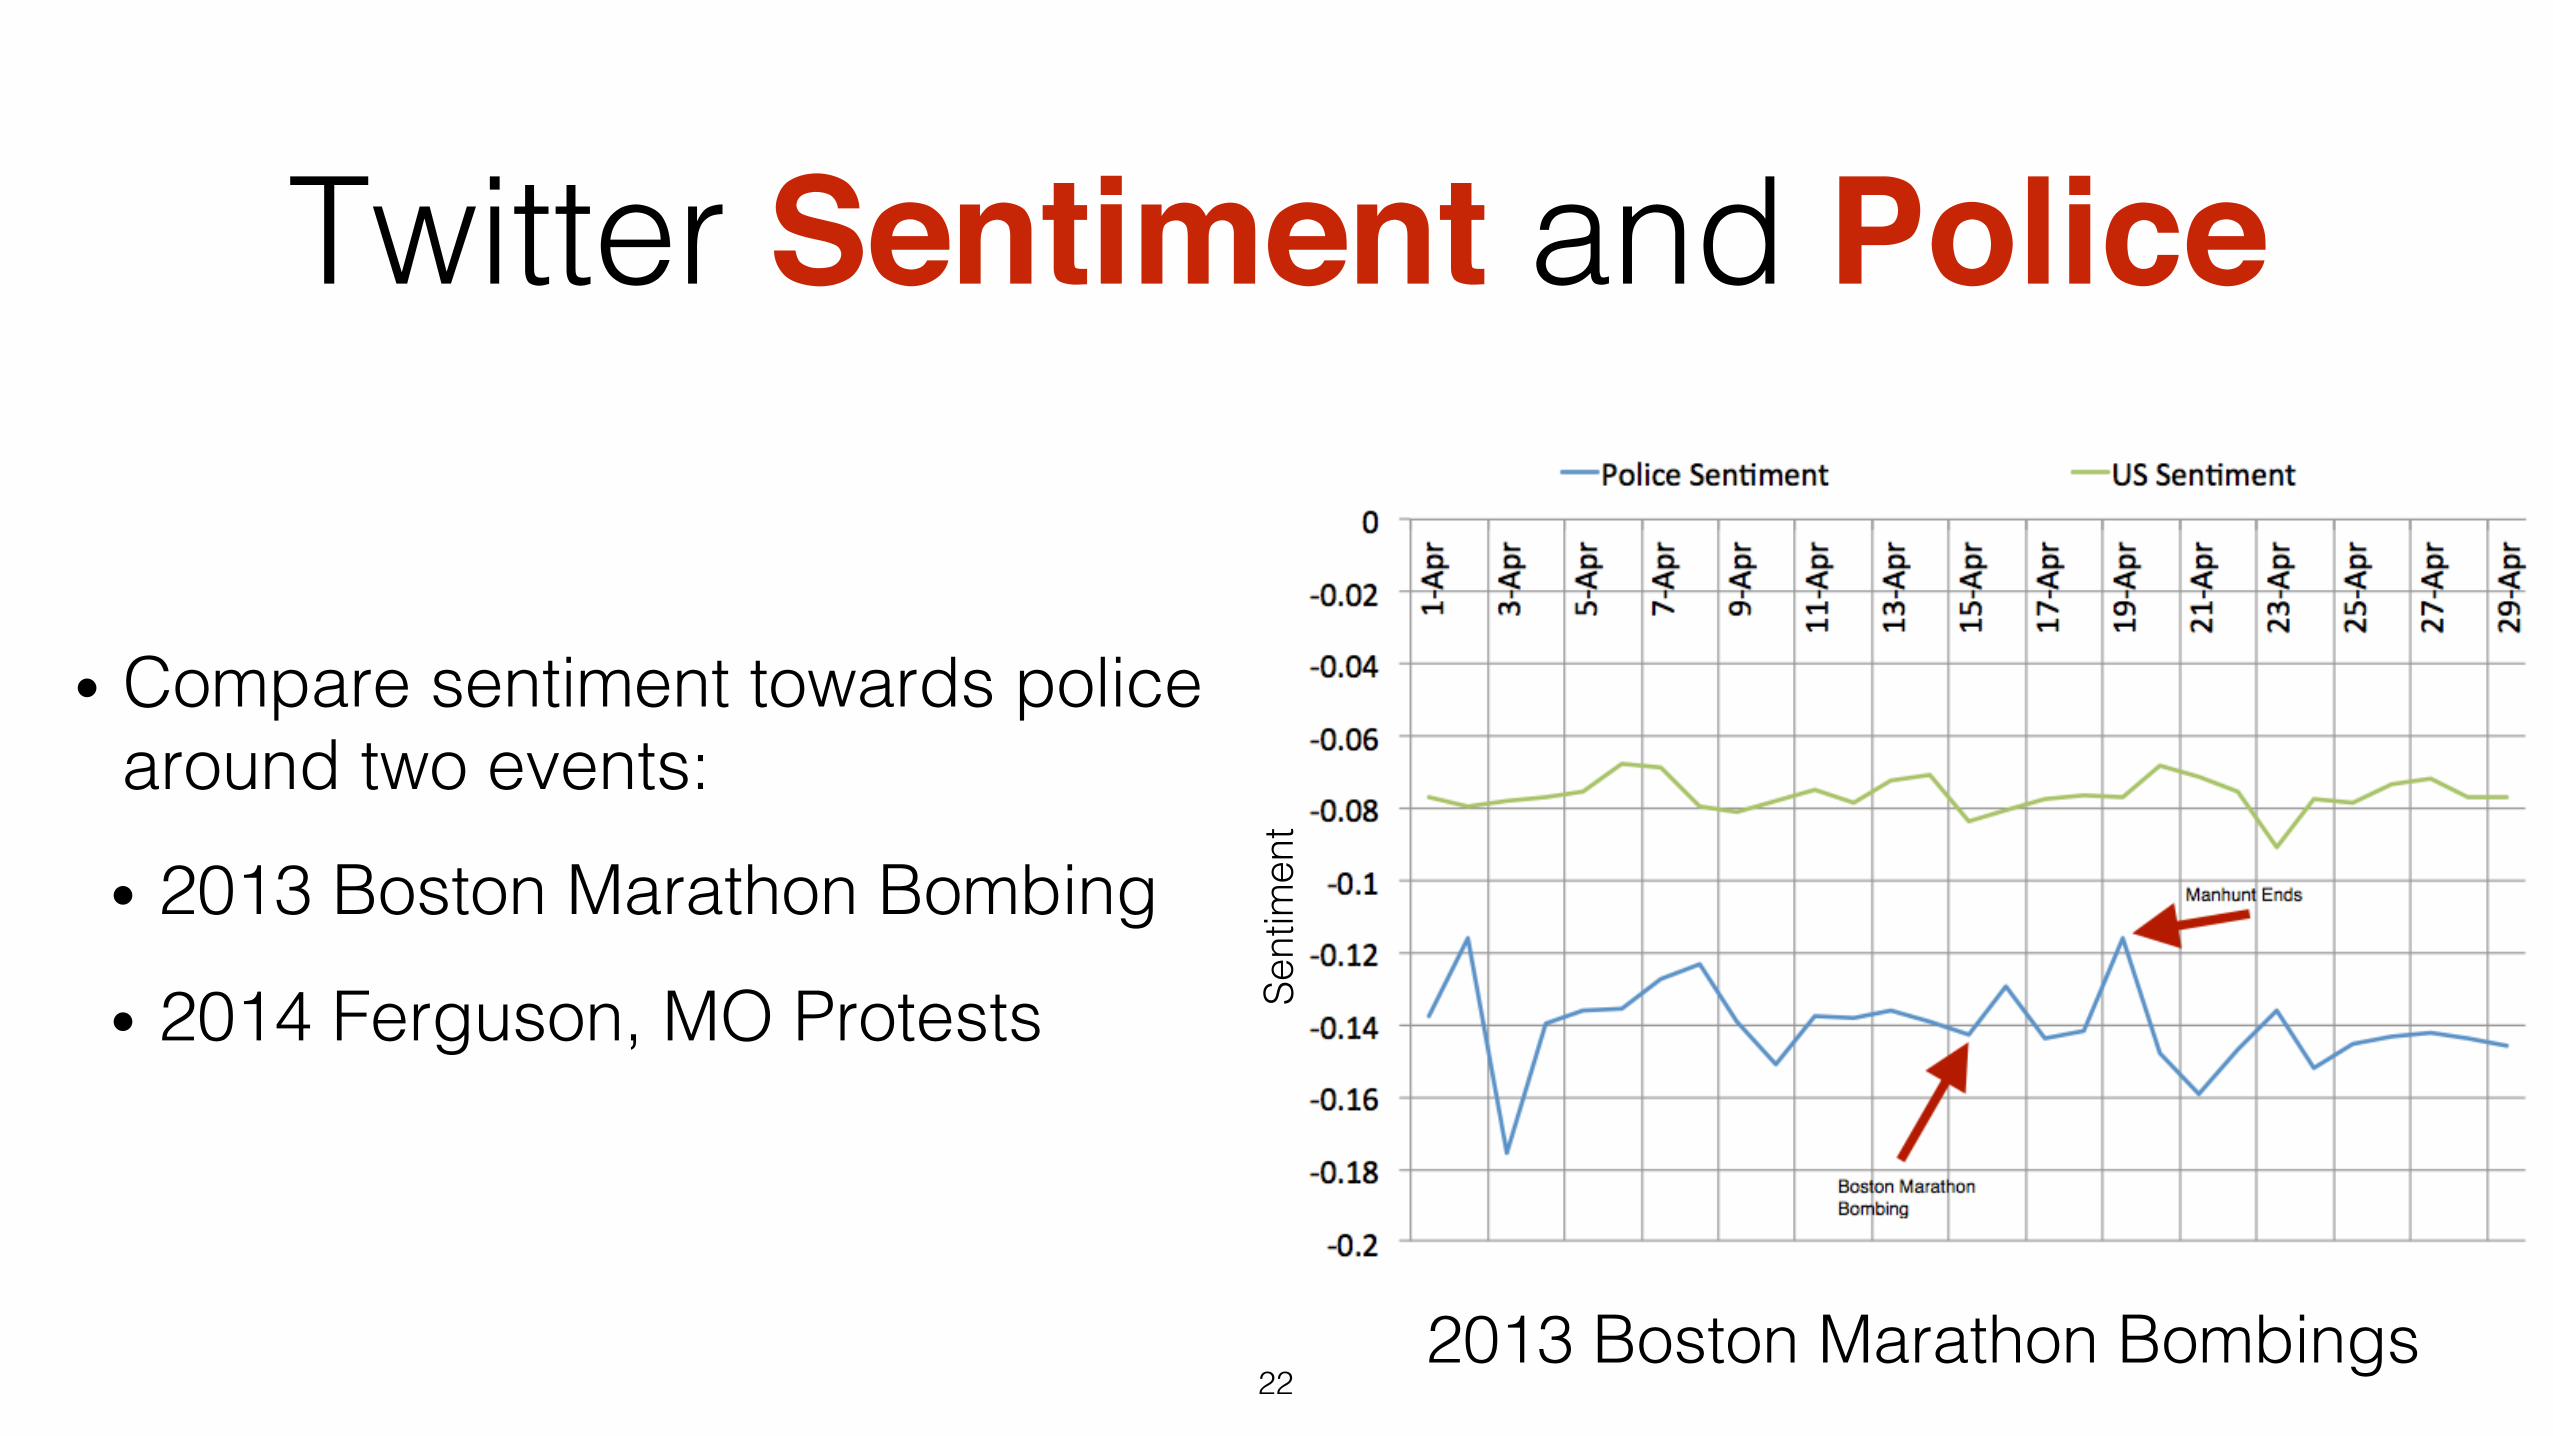
• Compare sentiment towards police around two events:!
• 2013 Boston Marathon Bombing!
• 2014 Ferguson, MO Protests!
22!
Twitter Sentiment and Police
2013 Boston Marathon Bombings!Se
ntim
ent!
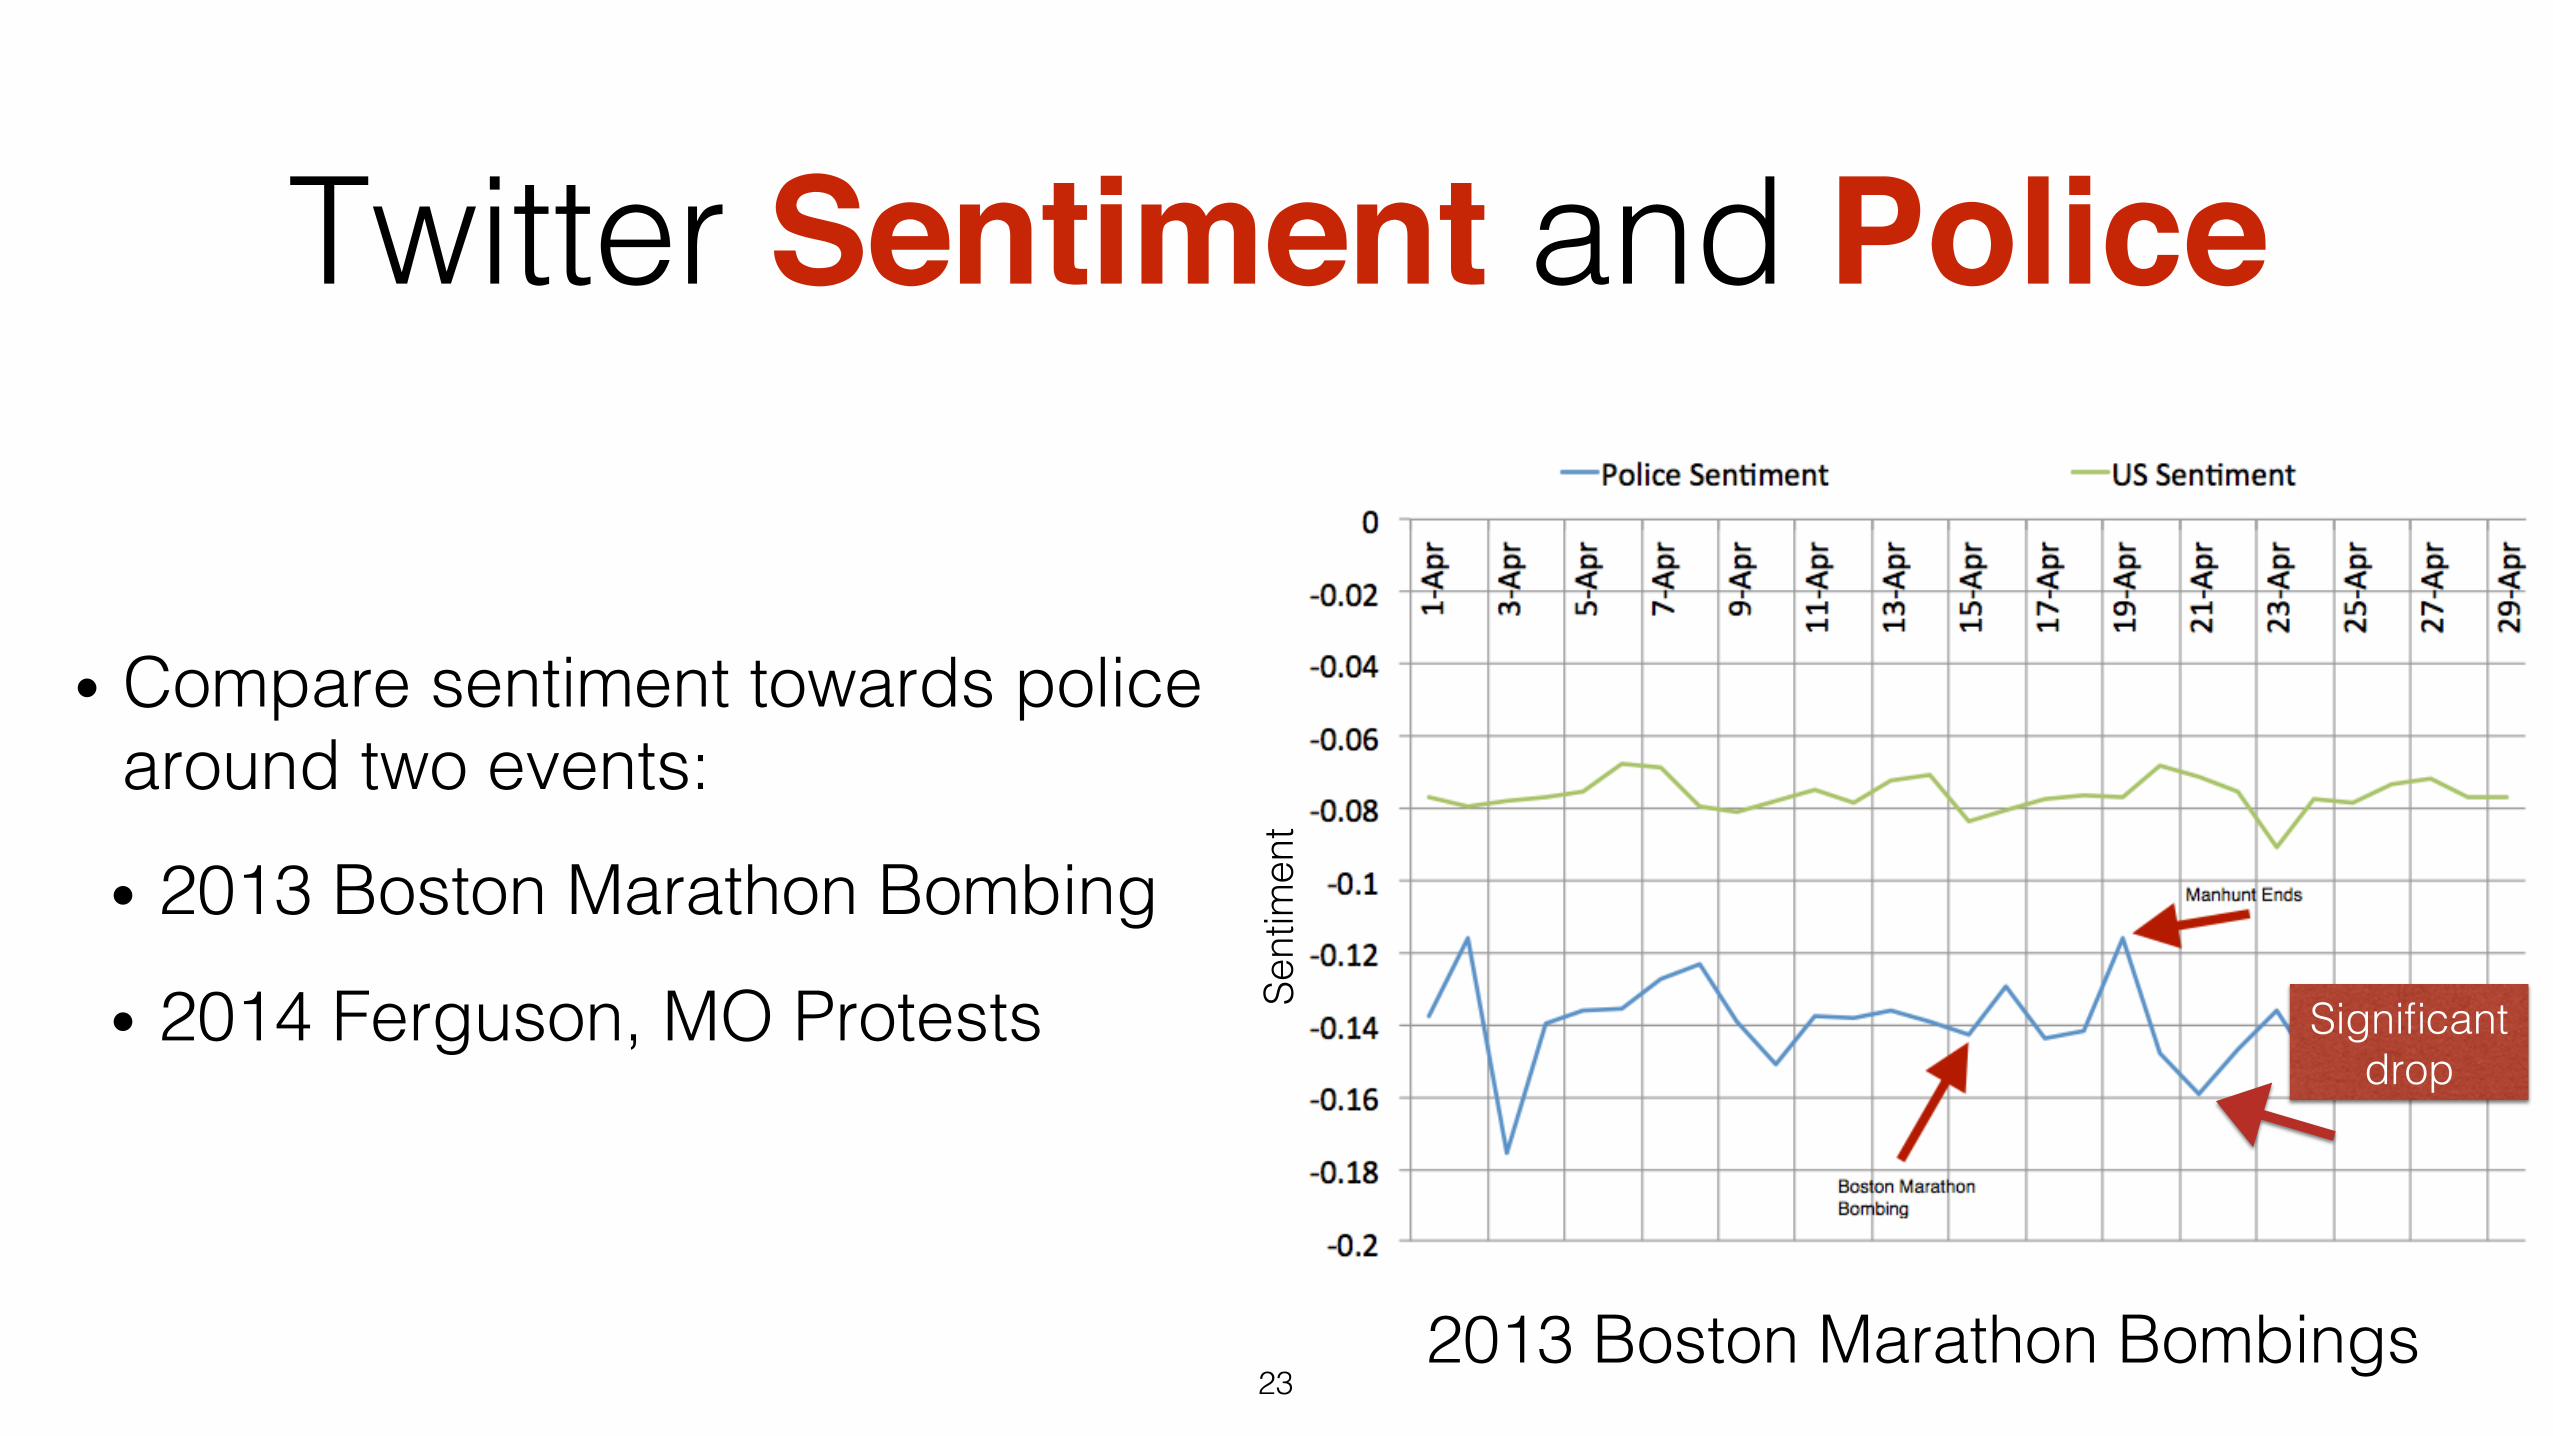
• Compare sentiment towards police around two events:!
• 2013 Boston Marathon Bombing!
• 2014 Ferguson, MO Protests!
23!
Twitter Sentiment and Police
2013 Boston Marathon Bombings!Se
ntim
ent!
Significant !drop!
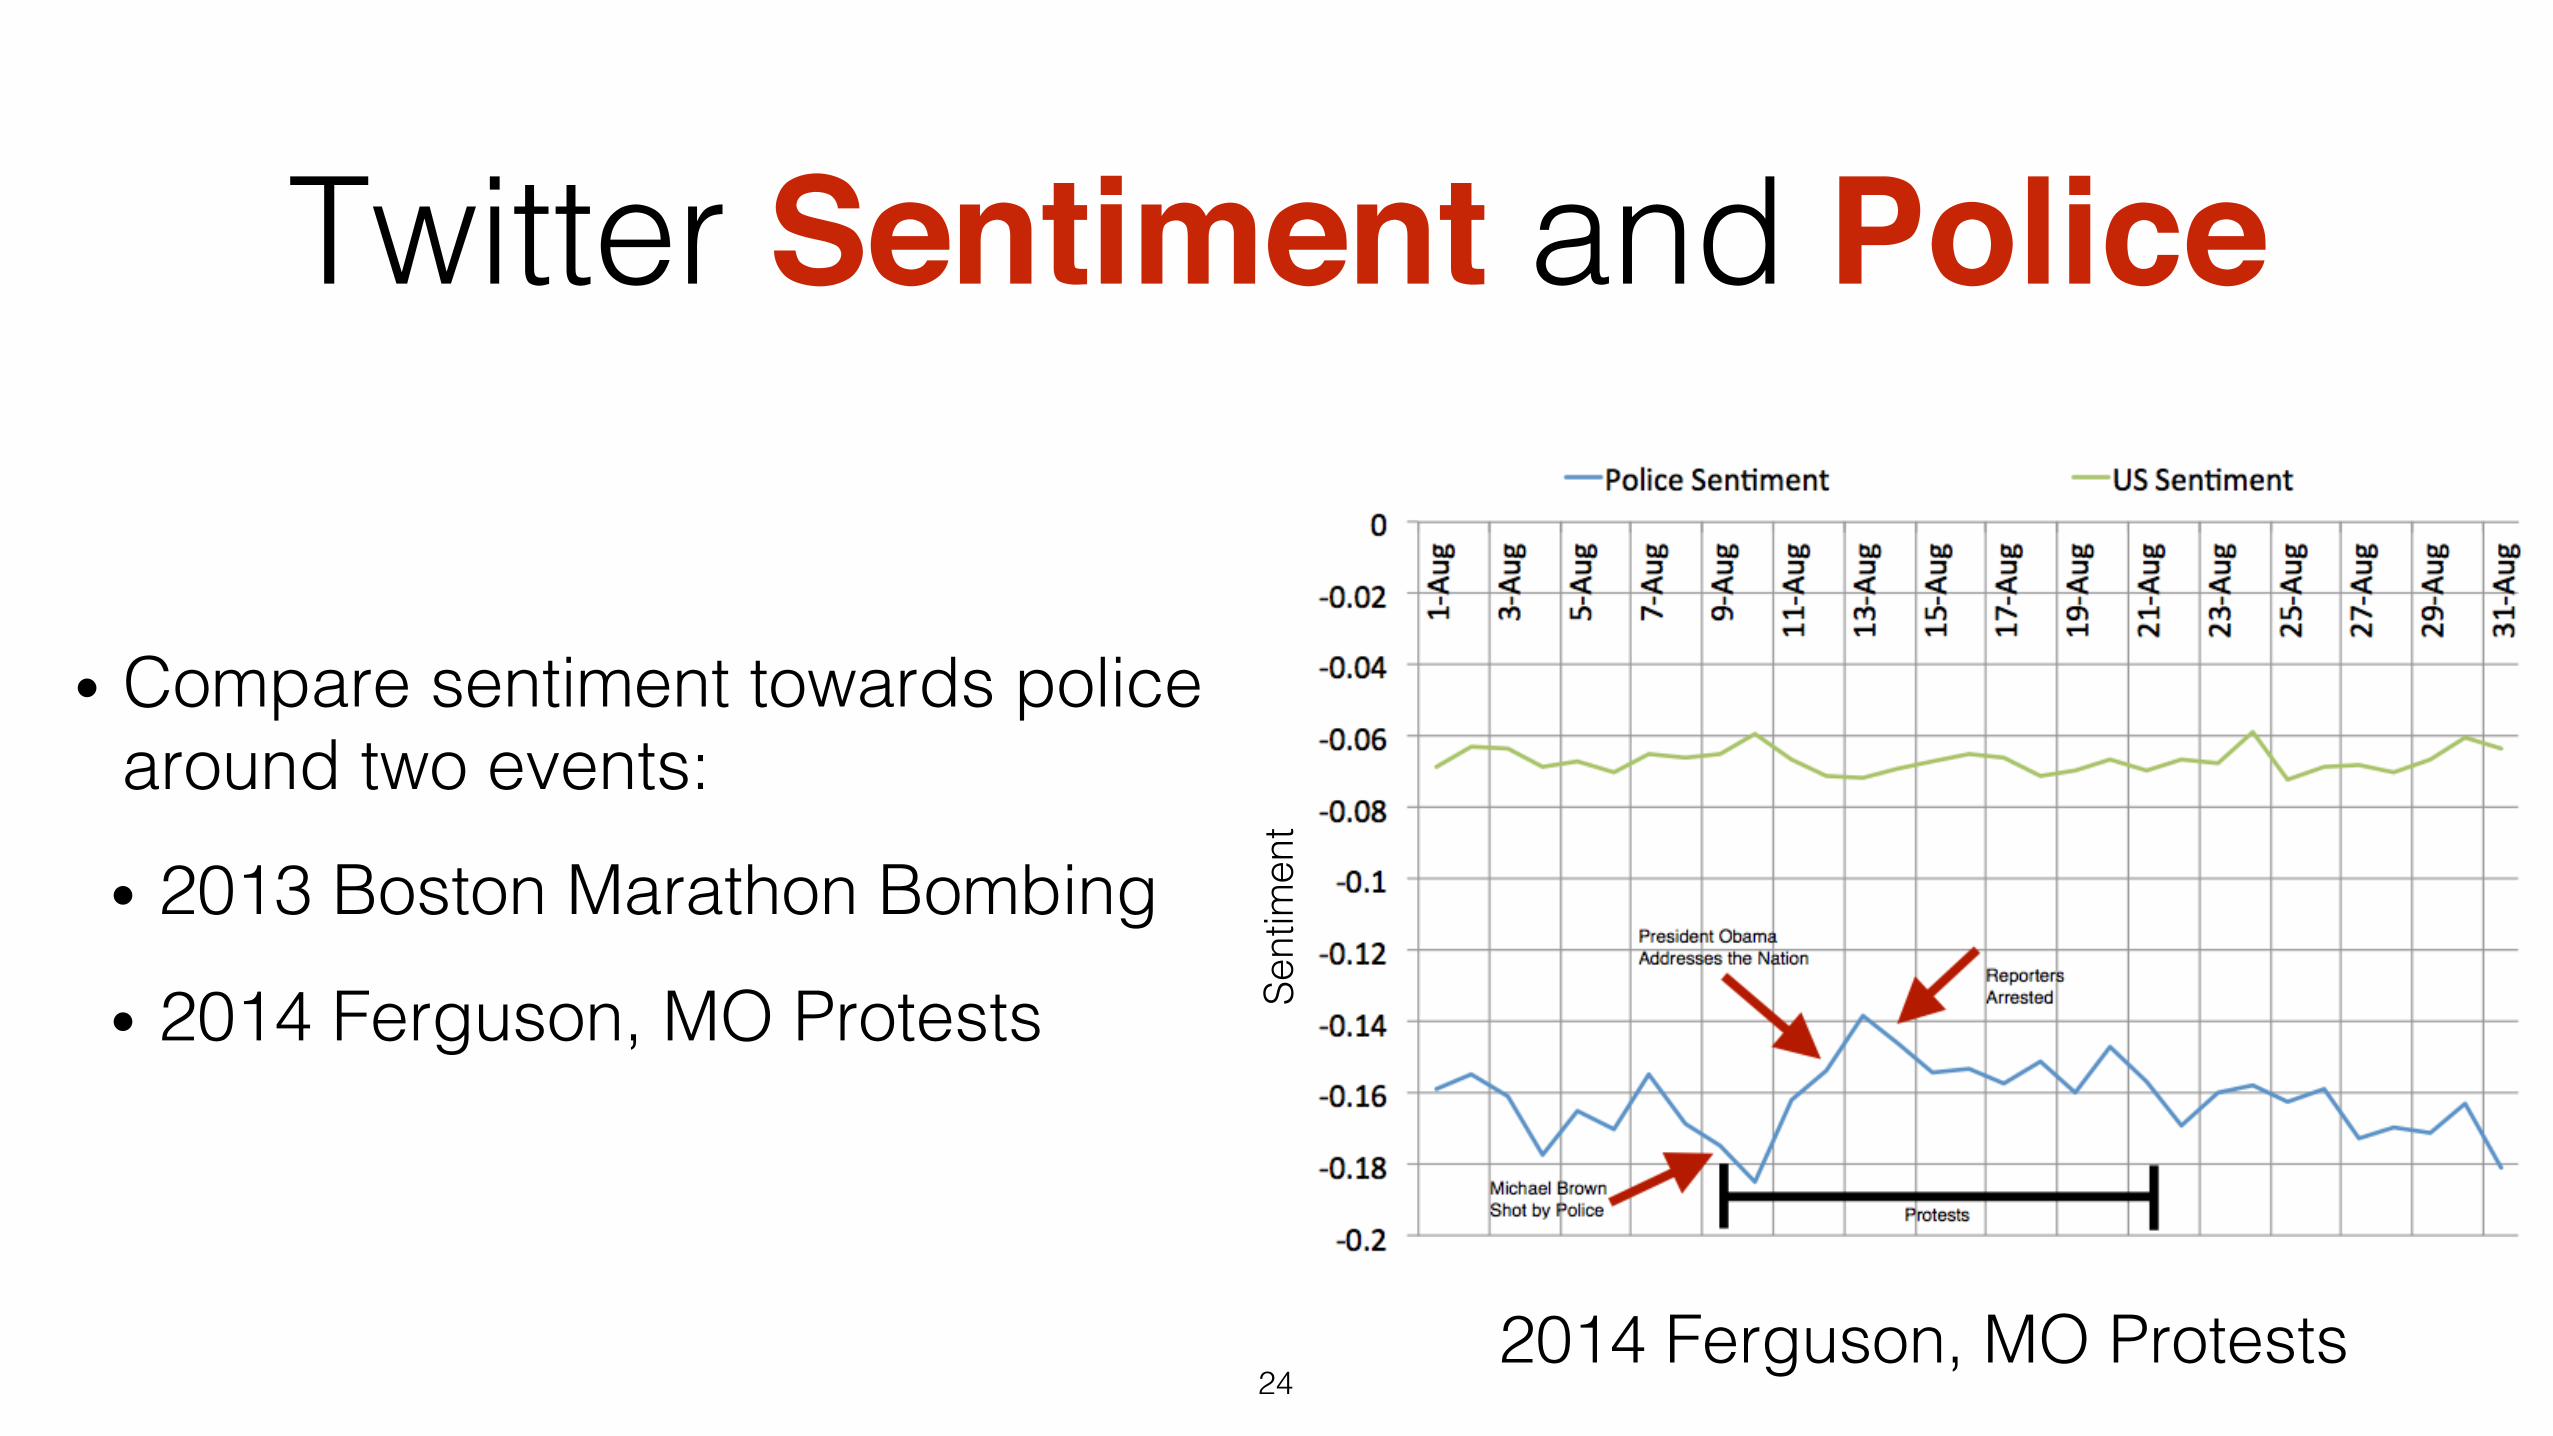
• Compare sentiment towards police around two events:!
• 2013 Boston Marathon Bombing!
• 2014 Ferguson, MO Protests!
24!
Twitter Sentiment and Police
2014 Ferguson, MO Protests!Se
ntim
ent!
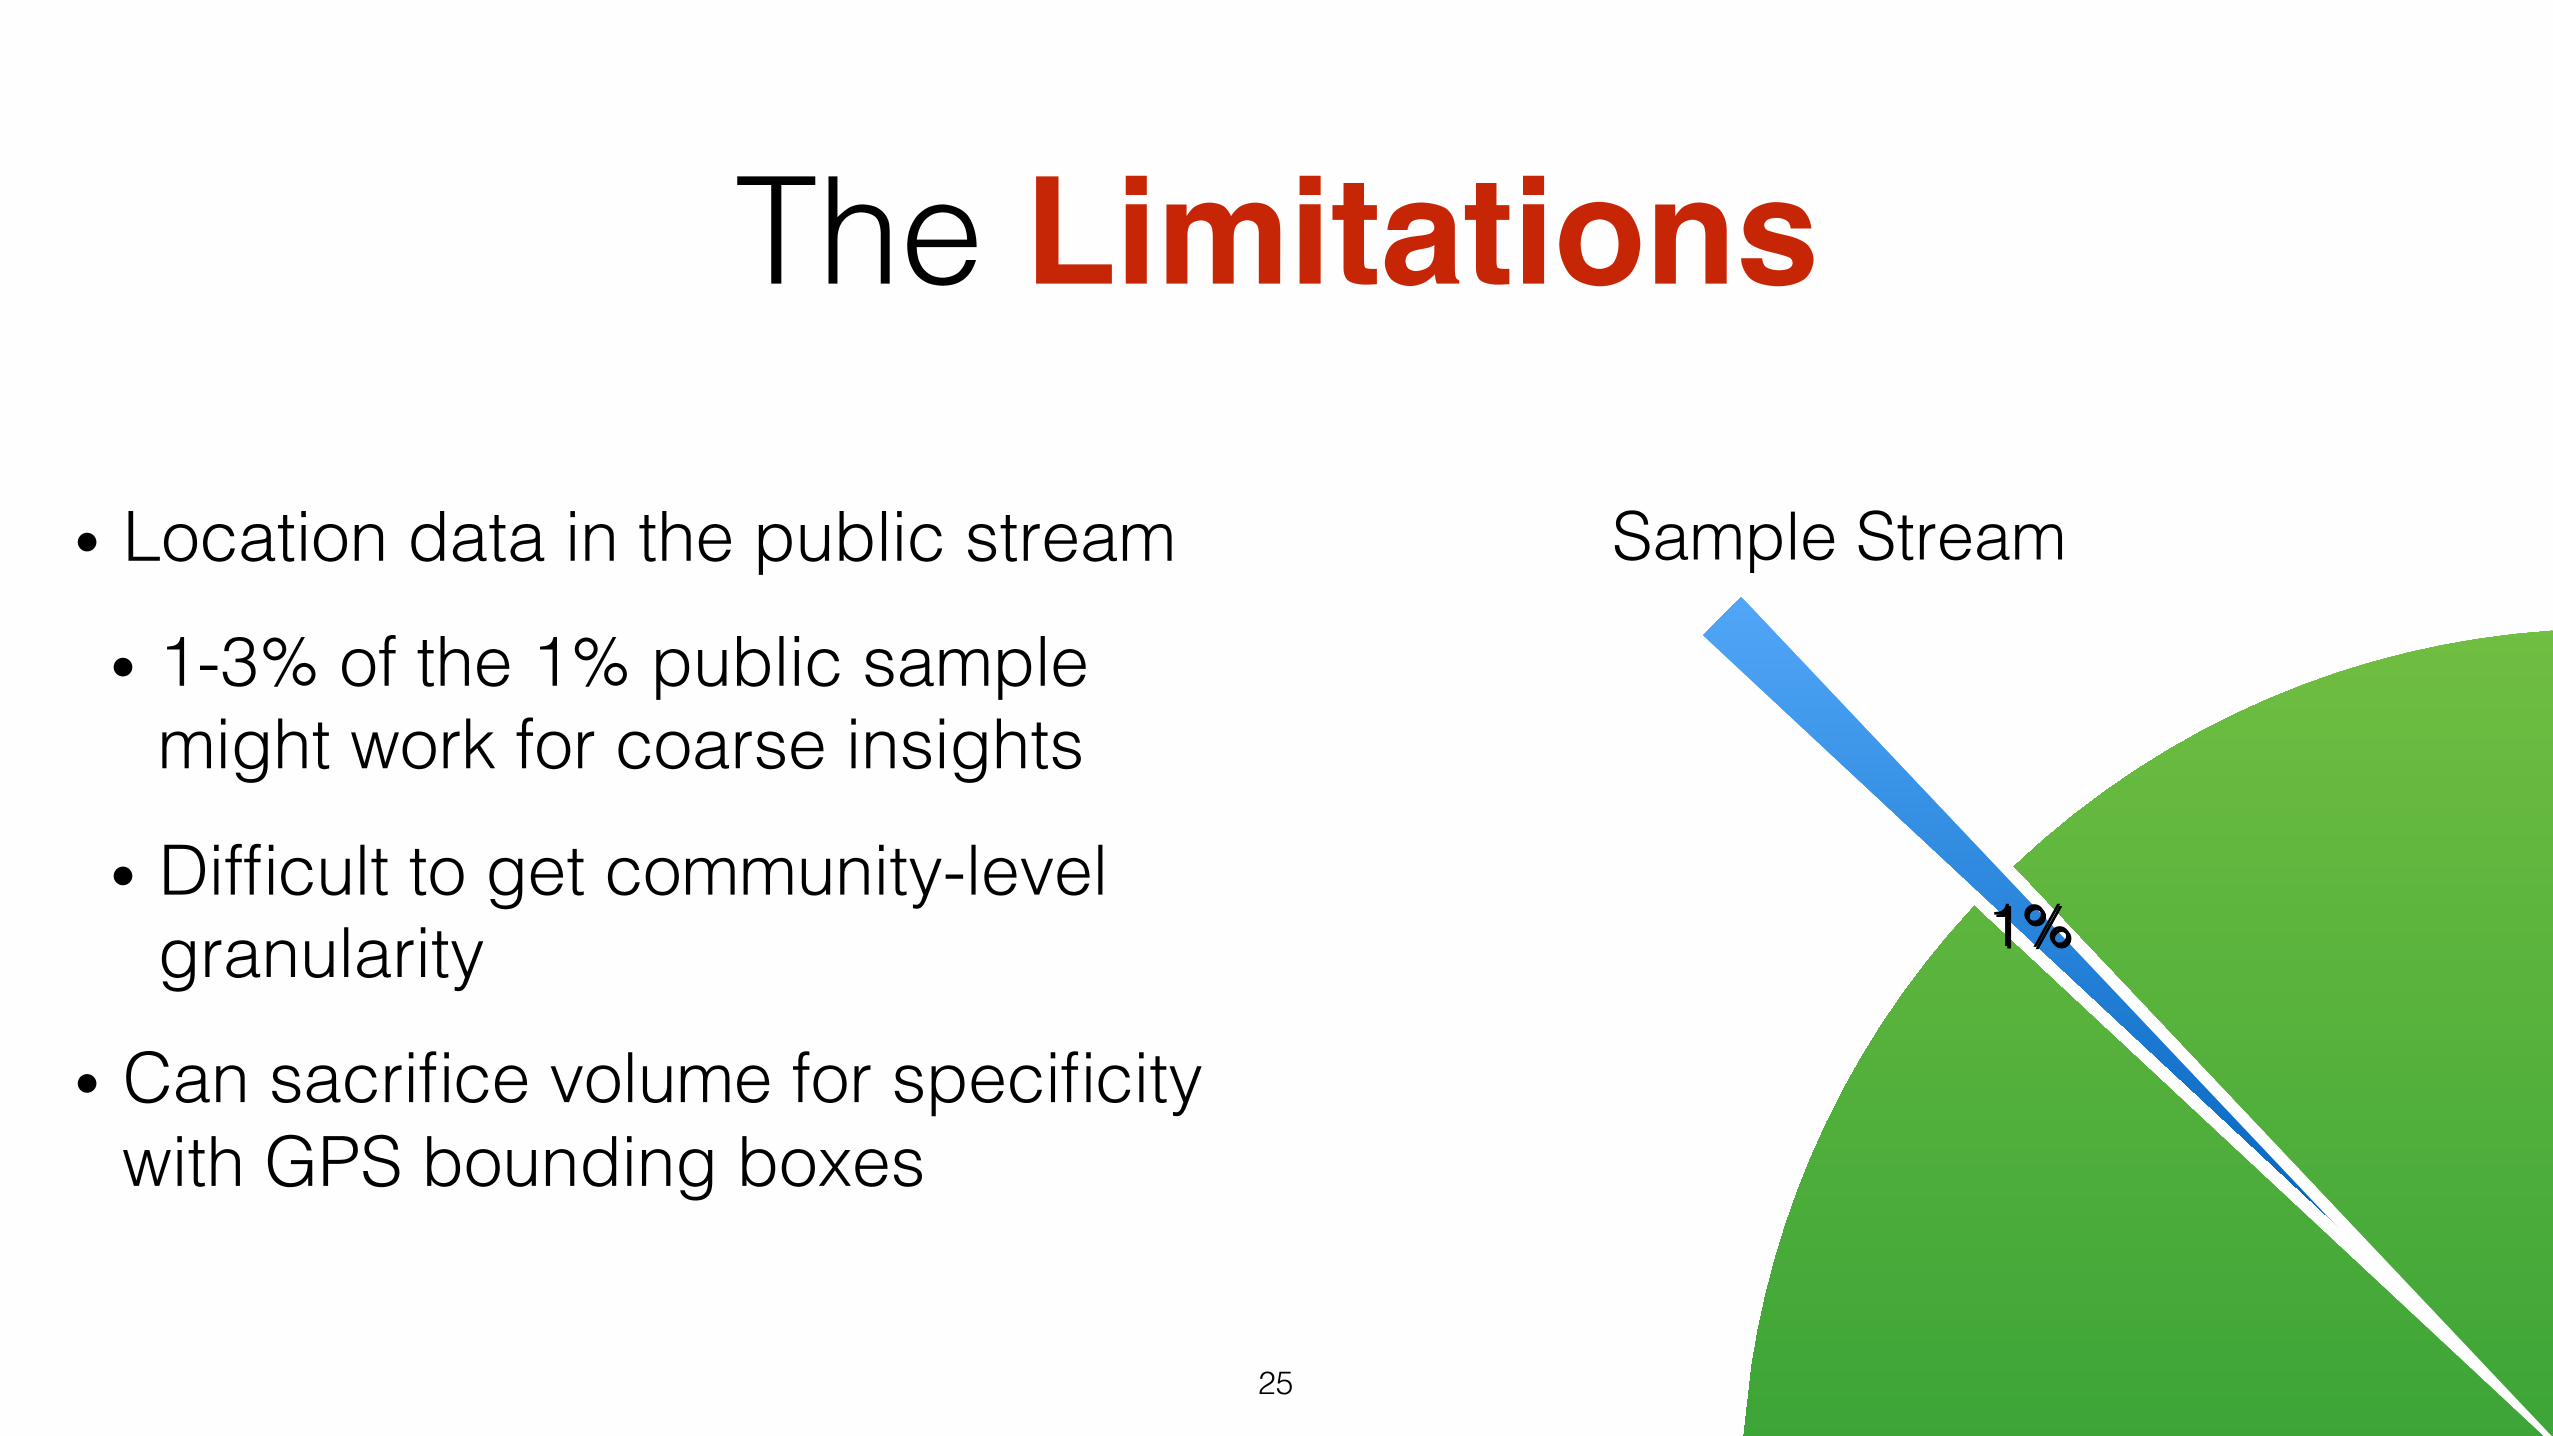
• Location data in the public stream!
• 1-3% of the 1% public sample might work for coarse insights!
• Difficult to get community-level granularity!
• Can sacrifice volume for specificity with GPS bounding boxes!
25!
The Limitations
1%!
99%!
Sample Stream!
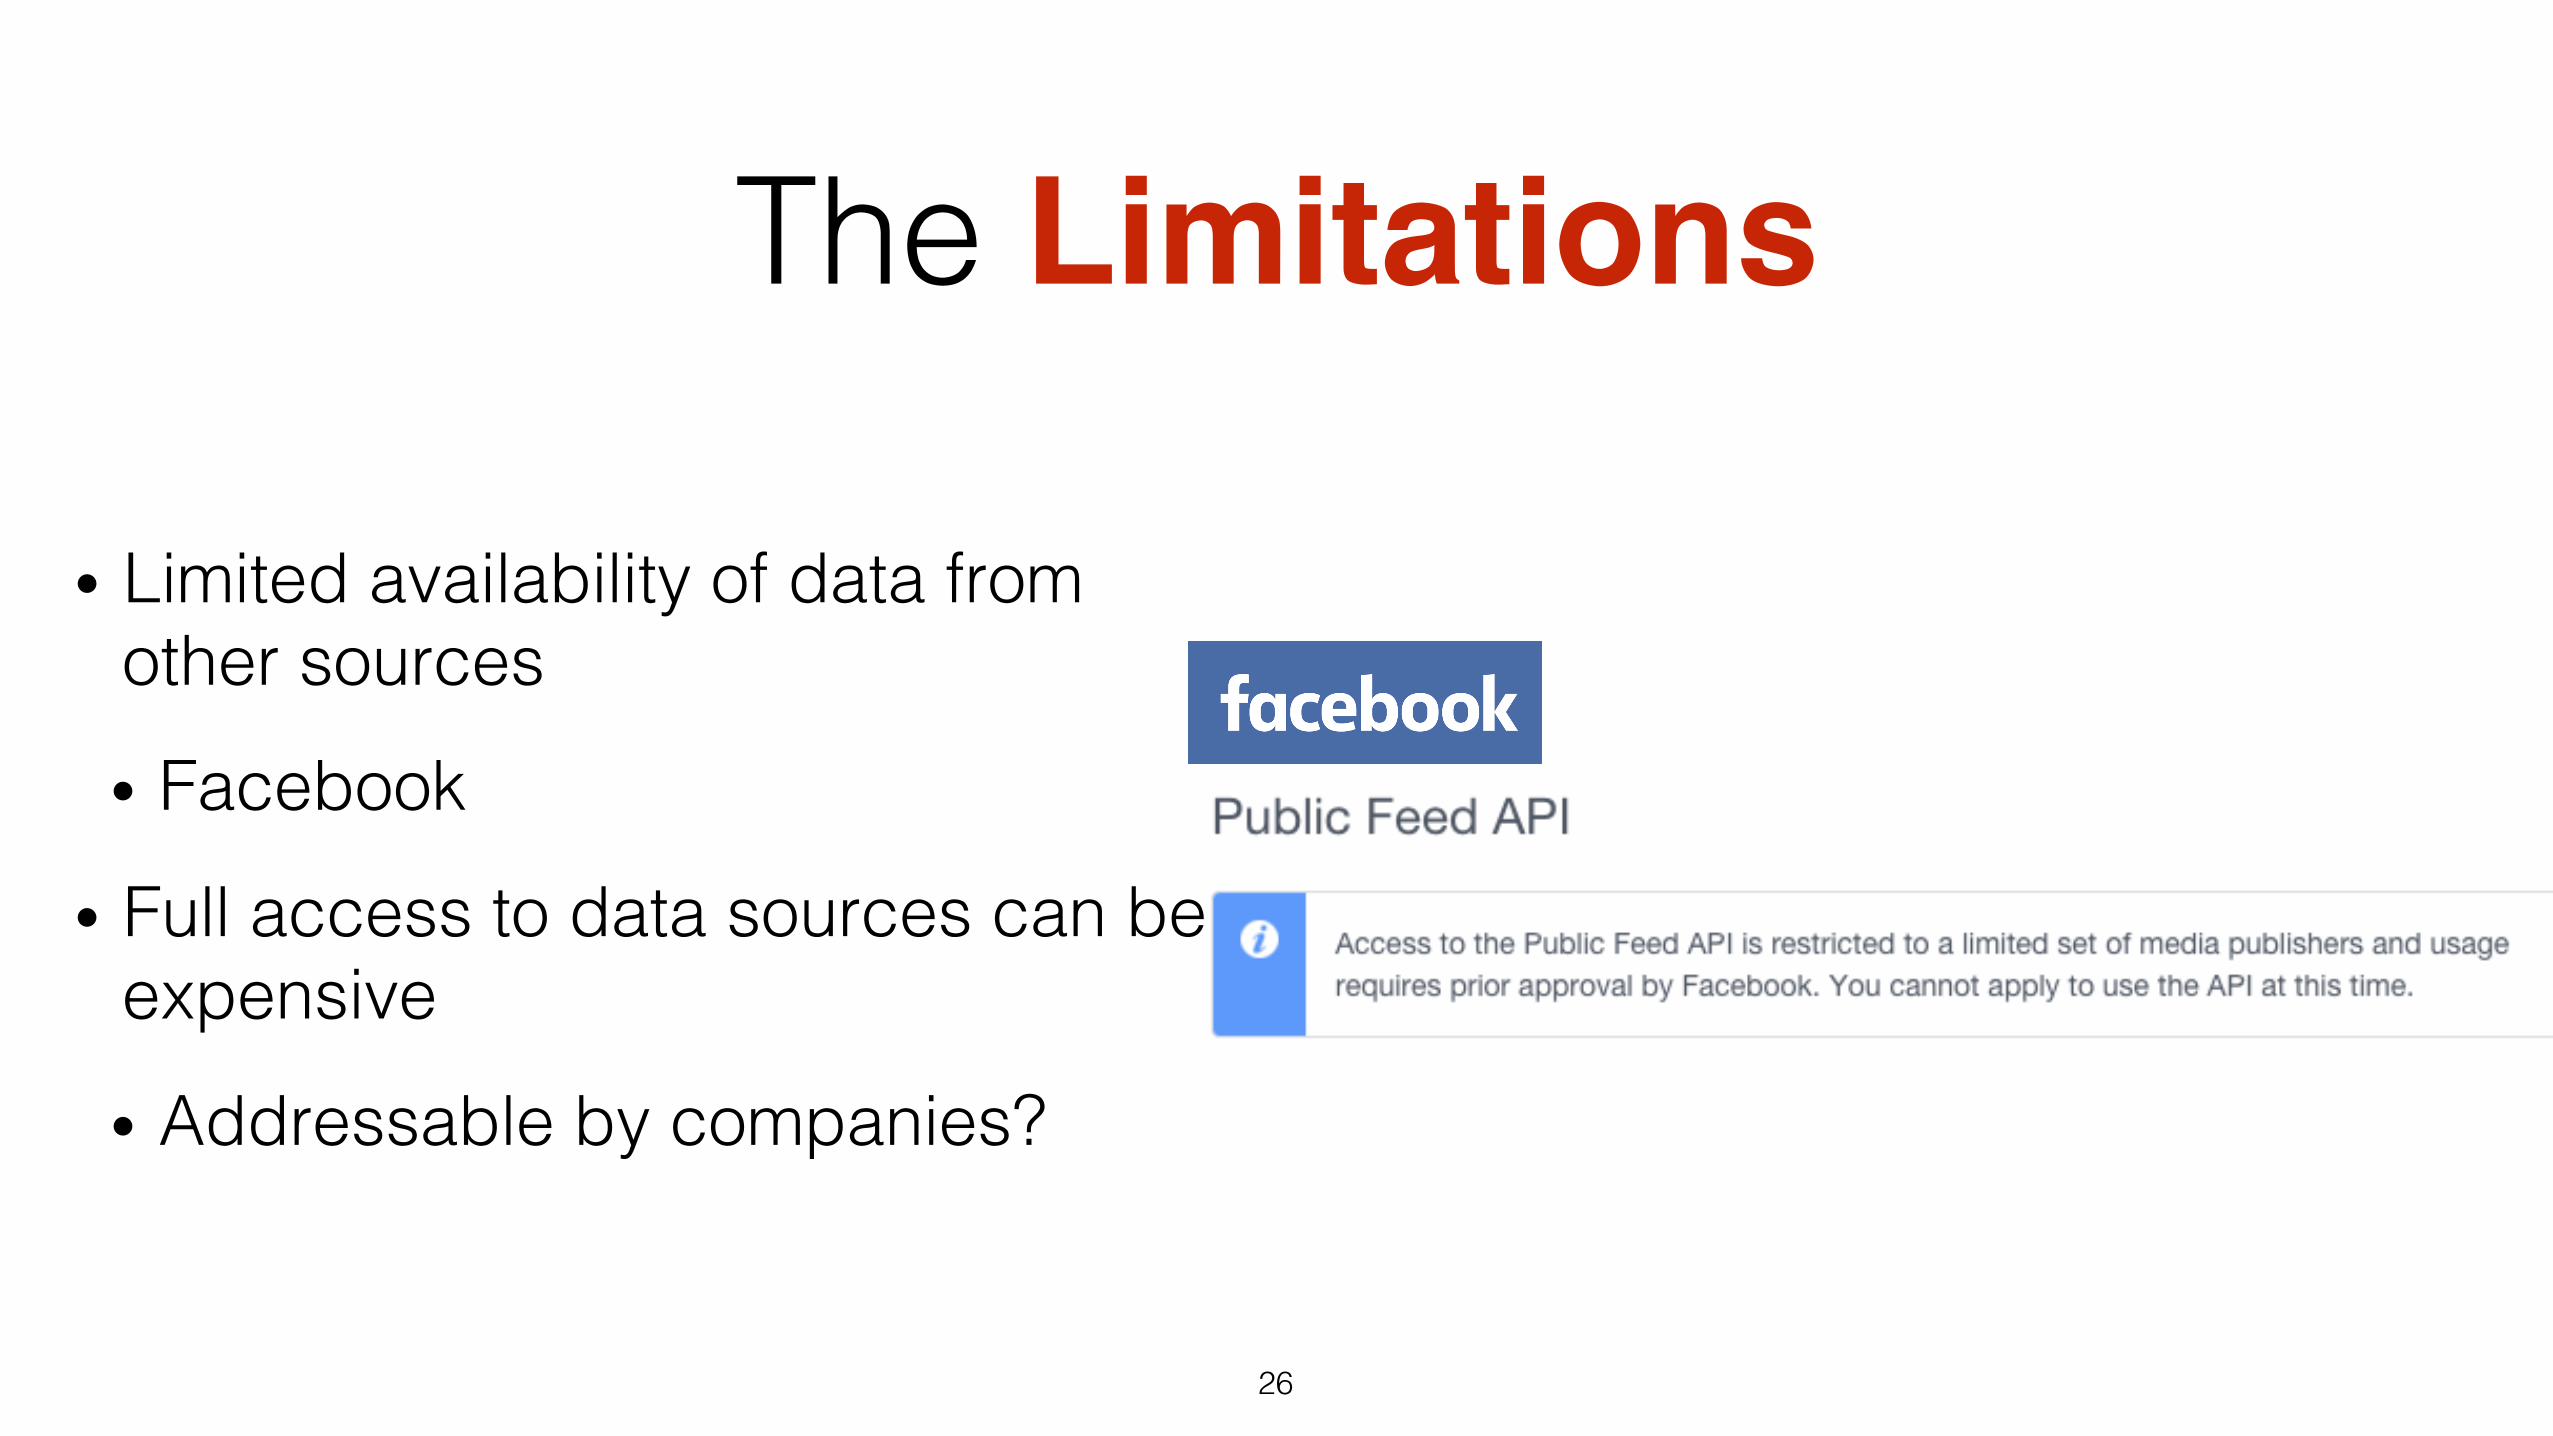
• Limited availability of data from other sources!
• Facebook!
• Full access to data sources can be expensive!
• Addressable by companies?!
26!
The Limitations
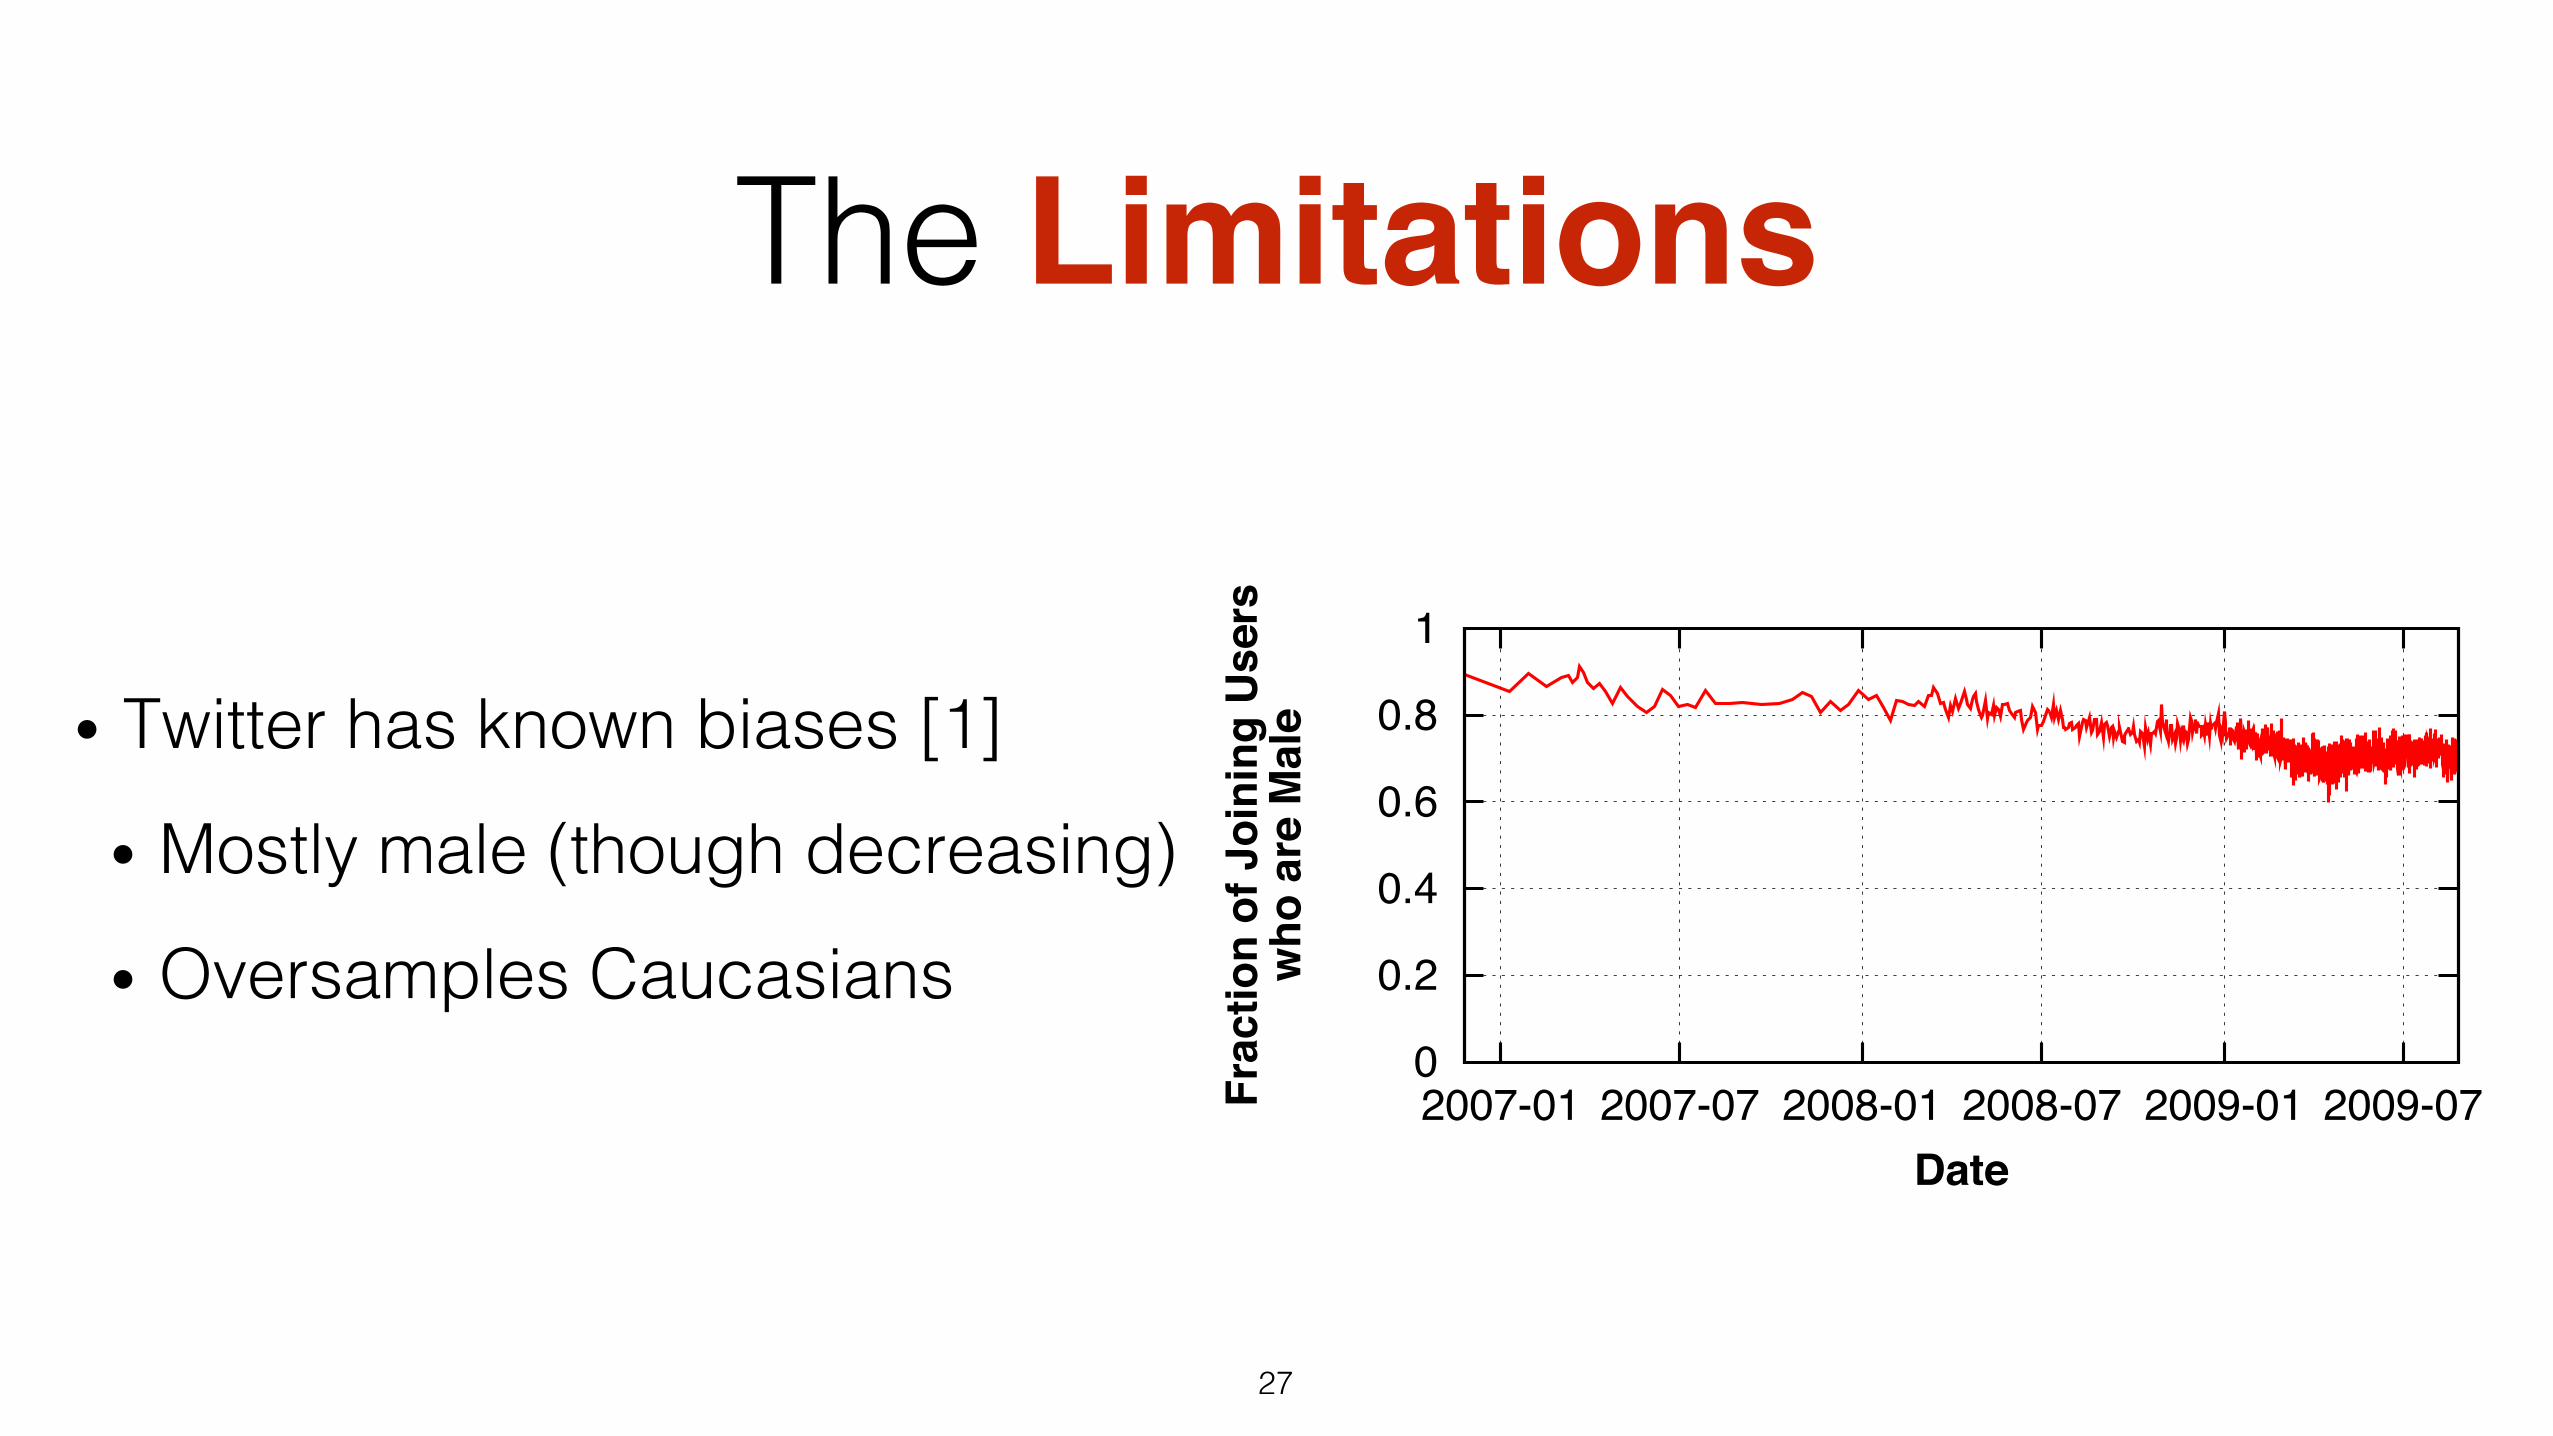
• Twitter has known biases [1]!
• Mostly male (though decreasing)!
• Oversamples Caucasians!
27!
The Limitations
(a) Normal representation (b) Area cartogram representation
Figure 2: Per-county over- and underrepresentation of U.S. population in Twitter, relative to the median per-county represen-tation rate of 0.324%, presented in both (a) a normal layout and (b) an area cartogram based on the 2000 Census population.Blue colors indicate underrepresentation, while red colors represent overrepresentation. The intensity of the color correspondsto the log of the over- or underrepresentation rate. Clear trends are visible, such as the underrepresentation of mid-west andoverrepresentation of populous counties.
less than 95% predictive (e.g., the name Avery was observedto correspond to male babies only 56.8% of the time; it wastherefore removed). The result is a list of 5,836 names thatwe use to infer gender.
Limitations Clearly, this approach to detecting gender issubject to a number of potential limitations. First, users maymisrepresent their name, leading to an incorrect gender in-ference. Second, there may be differences in choosing to re-veal one’s name between genders, leading us to believe thatfewer users of one gender are present. Third, the name listsabove may cover different fractions of the male and femalepopulations.
Gender of Twitter usersWe first determine the number of the 3,279,425 U.S.-basedusers who we could infer a gender for, based on their nameand the list previously described. We do so by comparingthe first word of their self-reported name to the gender list.We observe that there exists a match for 64.2% of the users.Moreover, we find a strong bias towards male users: Fully71.8% of the the users who we find a name match for had amale name.
0
0.2
0.4
0.6
0.8
1
2007-01 2007-07 2008-01 2008-07 2009-01 2009-07Frac
tion
of J
oini
ng U
sers
who
are
Mal
e
Date
Figure 3: Gender of joining users over time, binned intogroups of 10,000 joining users (note that the join rate in-creases substantially). The bias towards male users is ob-served to be decreasing over time.
To further explore this trend, we examine the historic gen-der bias. To do so, we use the join date of each user (avail-able in the user’s profile). Figure 3 plots the average fractionof joining users who are male over time. From this plot, itis clear that while the male gender bias was significantlystronger among the early Twitter adopters, the bias is be-coming reduced over time.
Race/ethnicityDetecting race/ethnicity using last namesAgain, since we have very limited information availableon each Twitter user, we resort to inferring race/ethnicityusing self-reported last name. We examine the last nameof users, and correlate the last name with data from theU.S. 2000 Census (U.S. Census 2000). In more detail, foreach last name with over 100 individuals in the U.S. dur-ing the 2000 Census, the Census releases the distribution ofrace/ethnicity for that last name. For example, the last name“Myers” was observed to correspond to Caucasians 86% ofthe time, African-Americans 9.7%, Asians 0.4%, and His-panics 1.4%.
Race/ethnicity distribution of Twitter usersWe first determined the number of U.S.-based users forwhom we could infer the race/ethnicity by comparing thelast word of their self-reported name to the U.S. Censuslast name list. We observed that we found a match for71.8% of the users. We the determined the distribution ofrace/ethnicity in each county by taking the race/ethnicitydistribution in the Census list, weighted by the frequencyof each name occurring in Twitter users in that county.1Due to the large amount of ambiguity in the last name-to-race/ethnicity list (in particular, the last name list is morethan 95% predictive for only 18.5% of the users), we are un-able to directly compare the Twitter race/ethnicity distribu-
1This is effectively the census.model approach discussed inprior work (Chang et al. 2010).
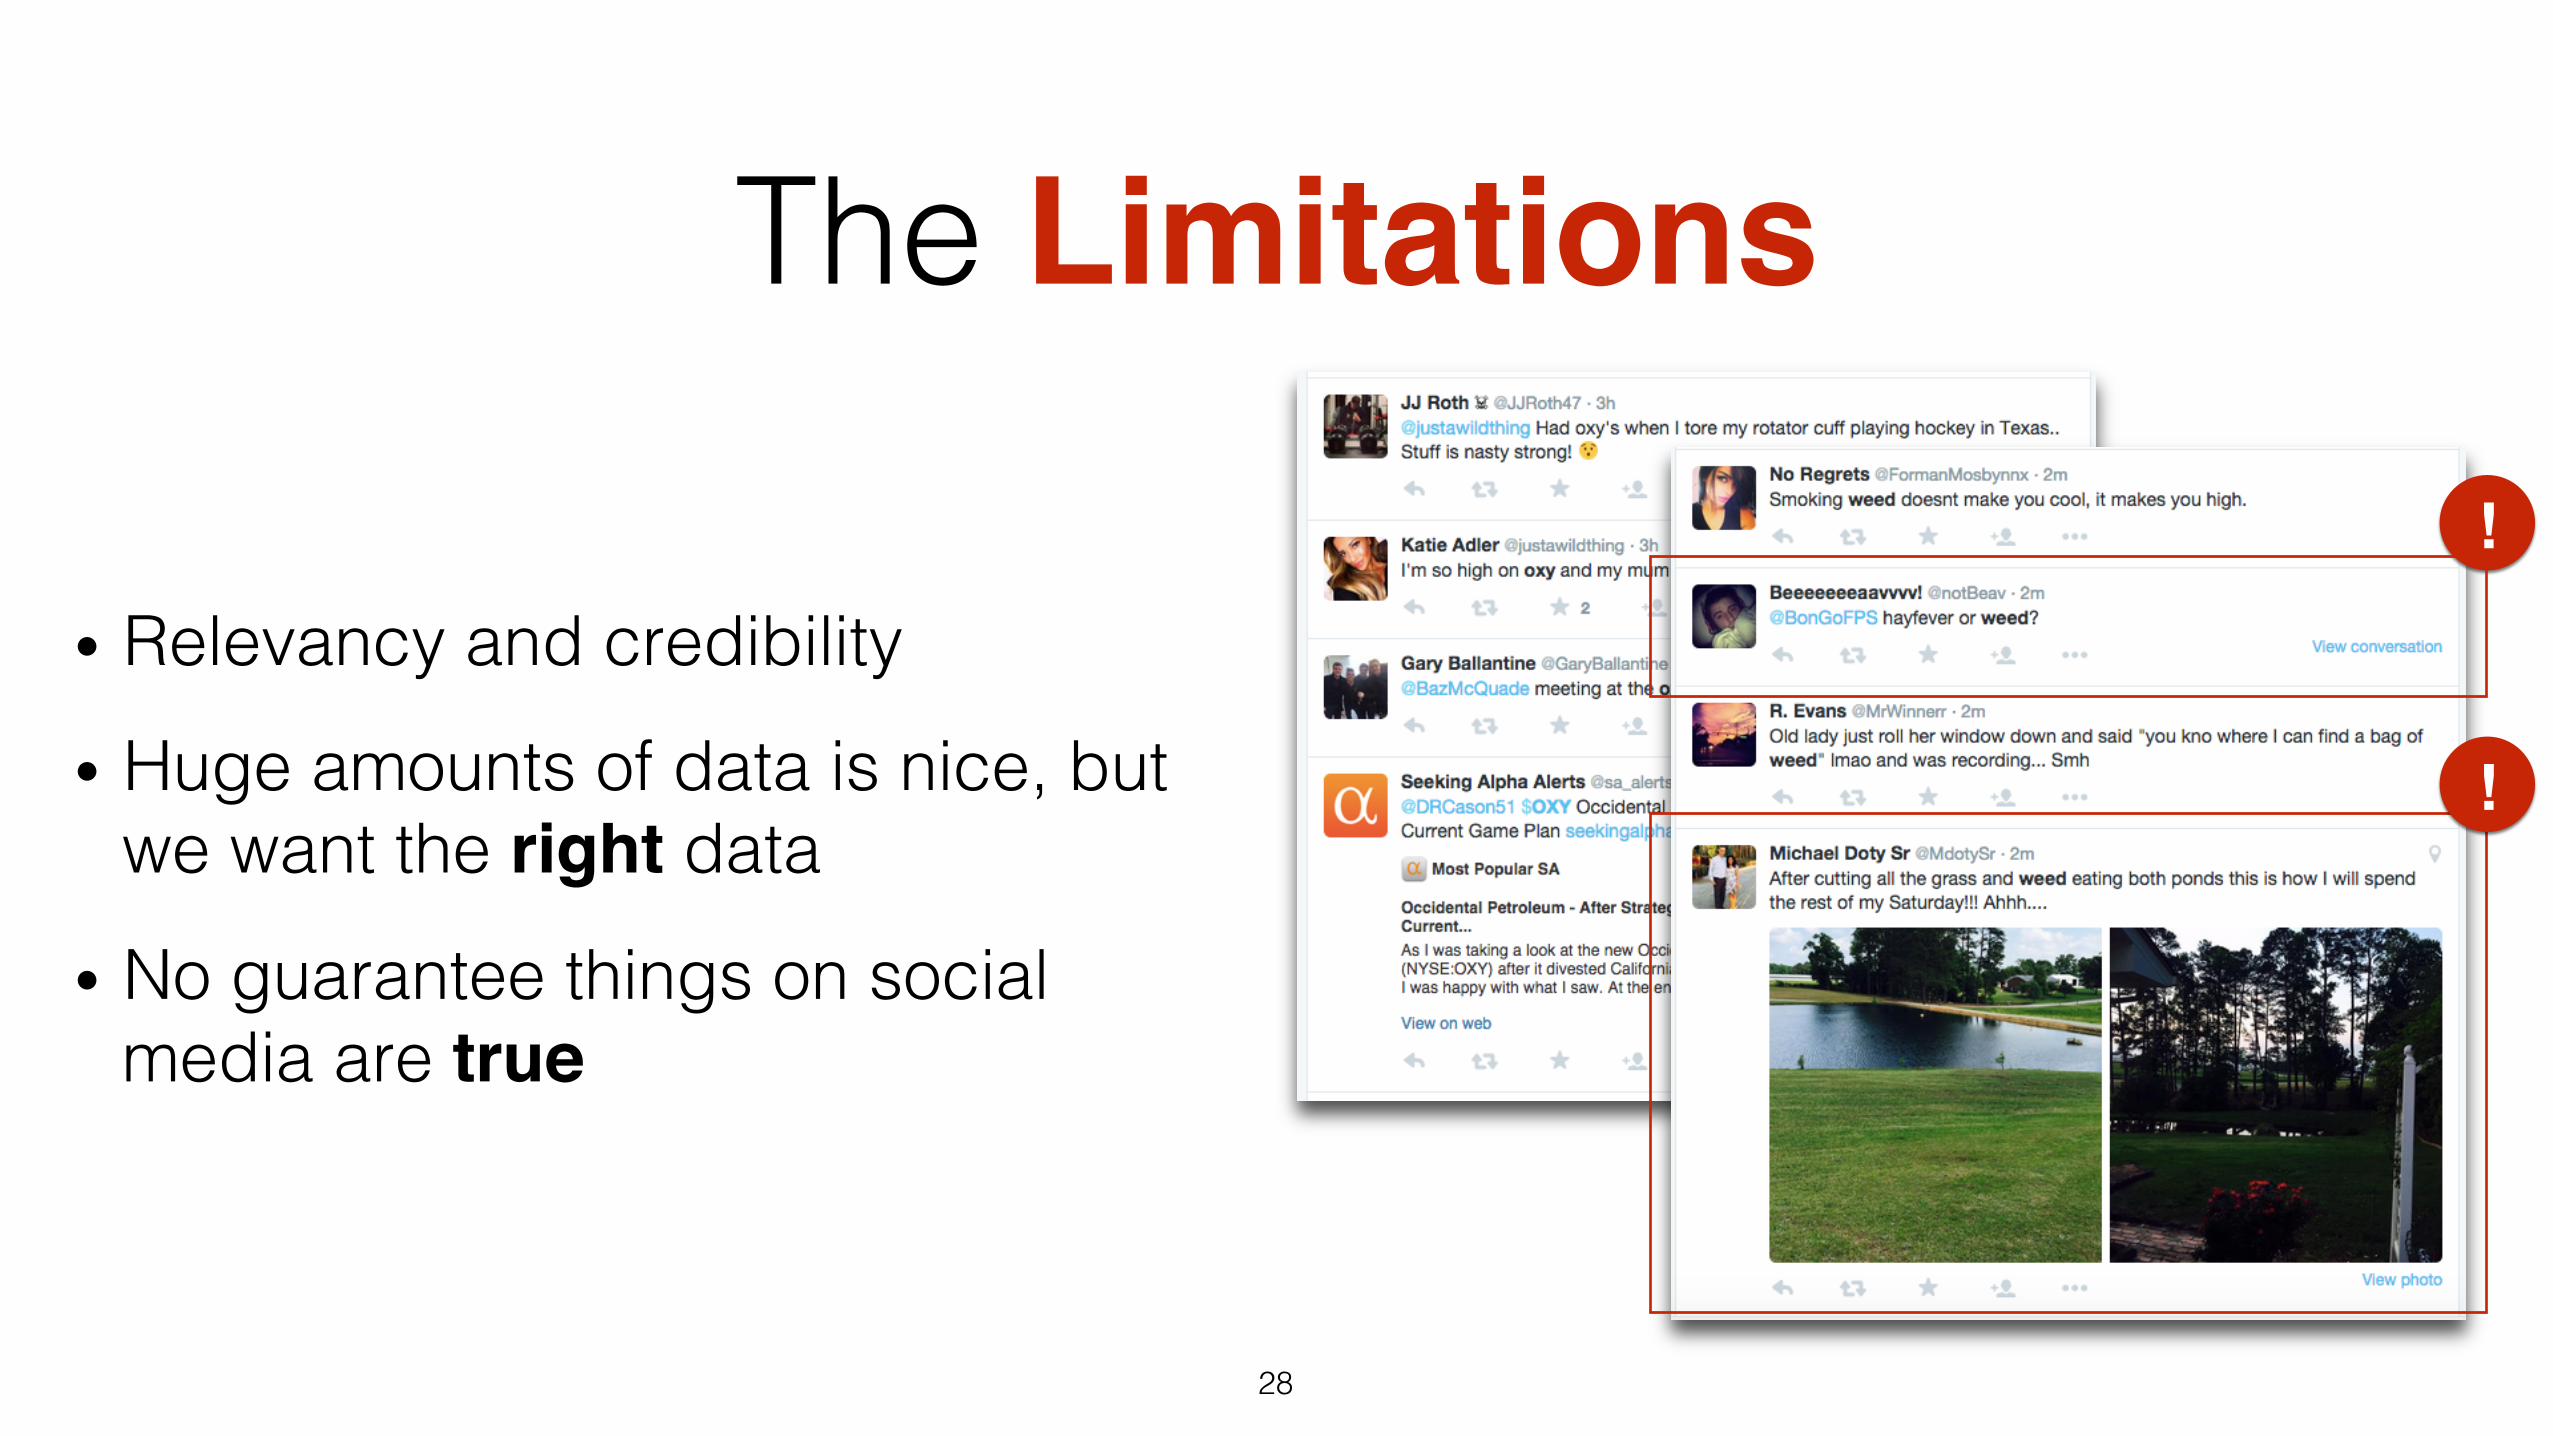
• Relevancy and credibility!
• Huge amounts of data is nice, but we want the right data!
• No guarantee things on social media are true
28!
The Limitations
!
!
!
29!
The ConclusionSocial media data can augment !
public survey-based research efforts!The Point
30!
The ConclusionSocial media data can augment !
public survey-based research efforts!The Point
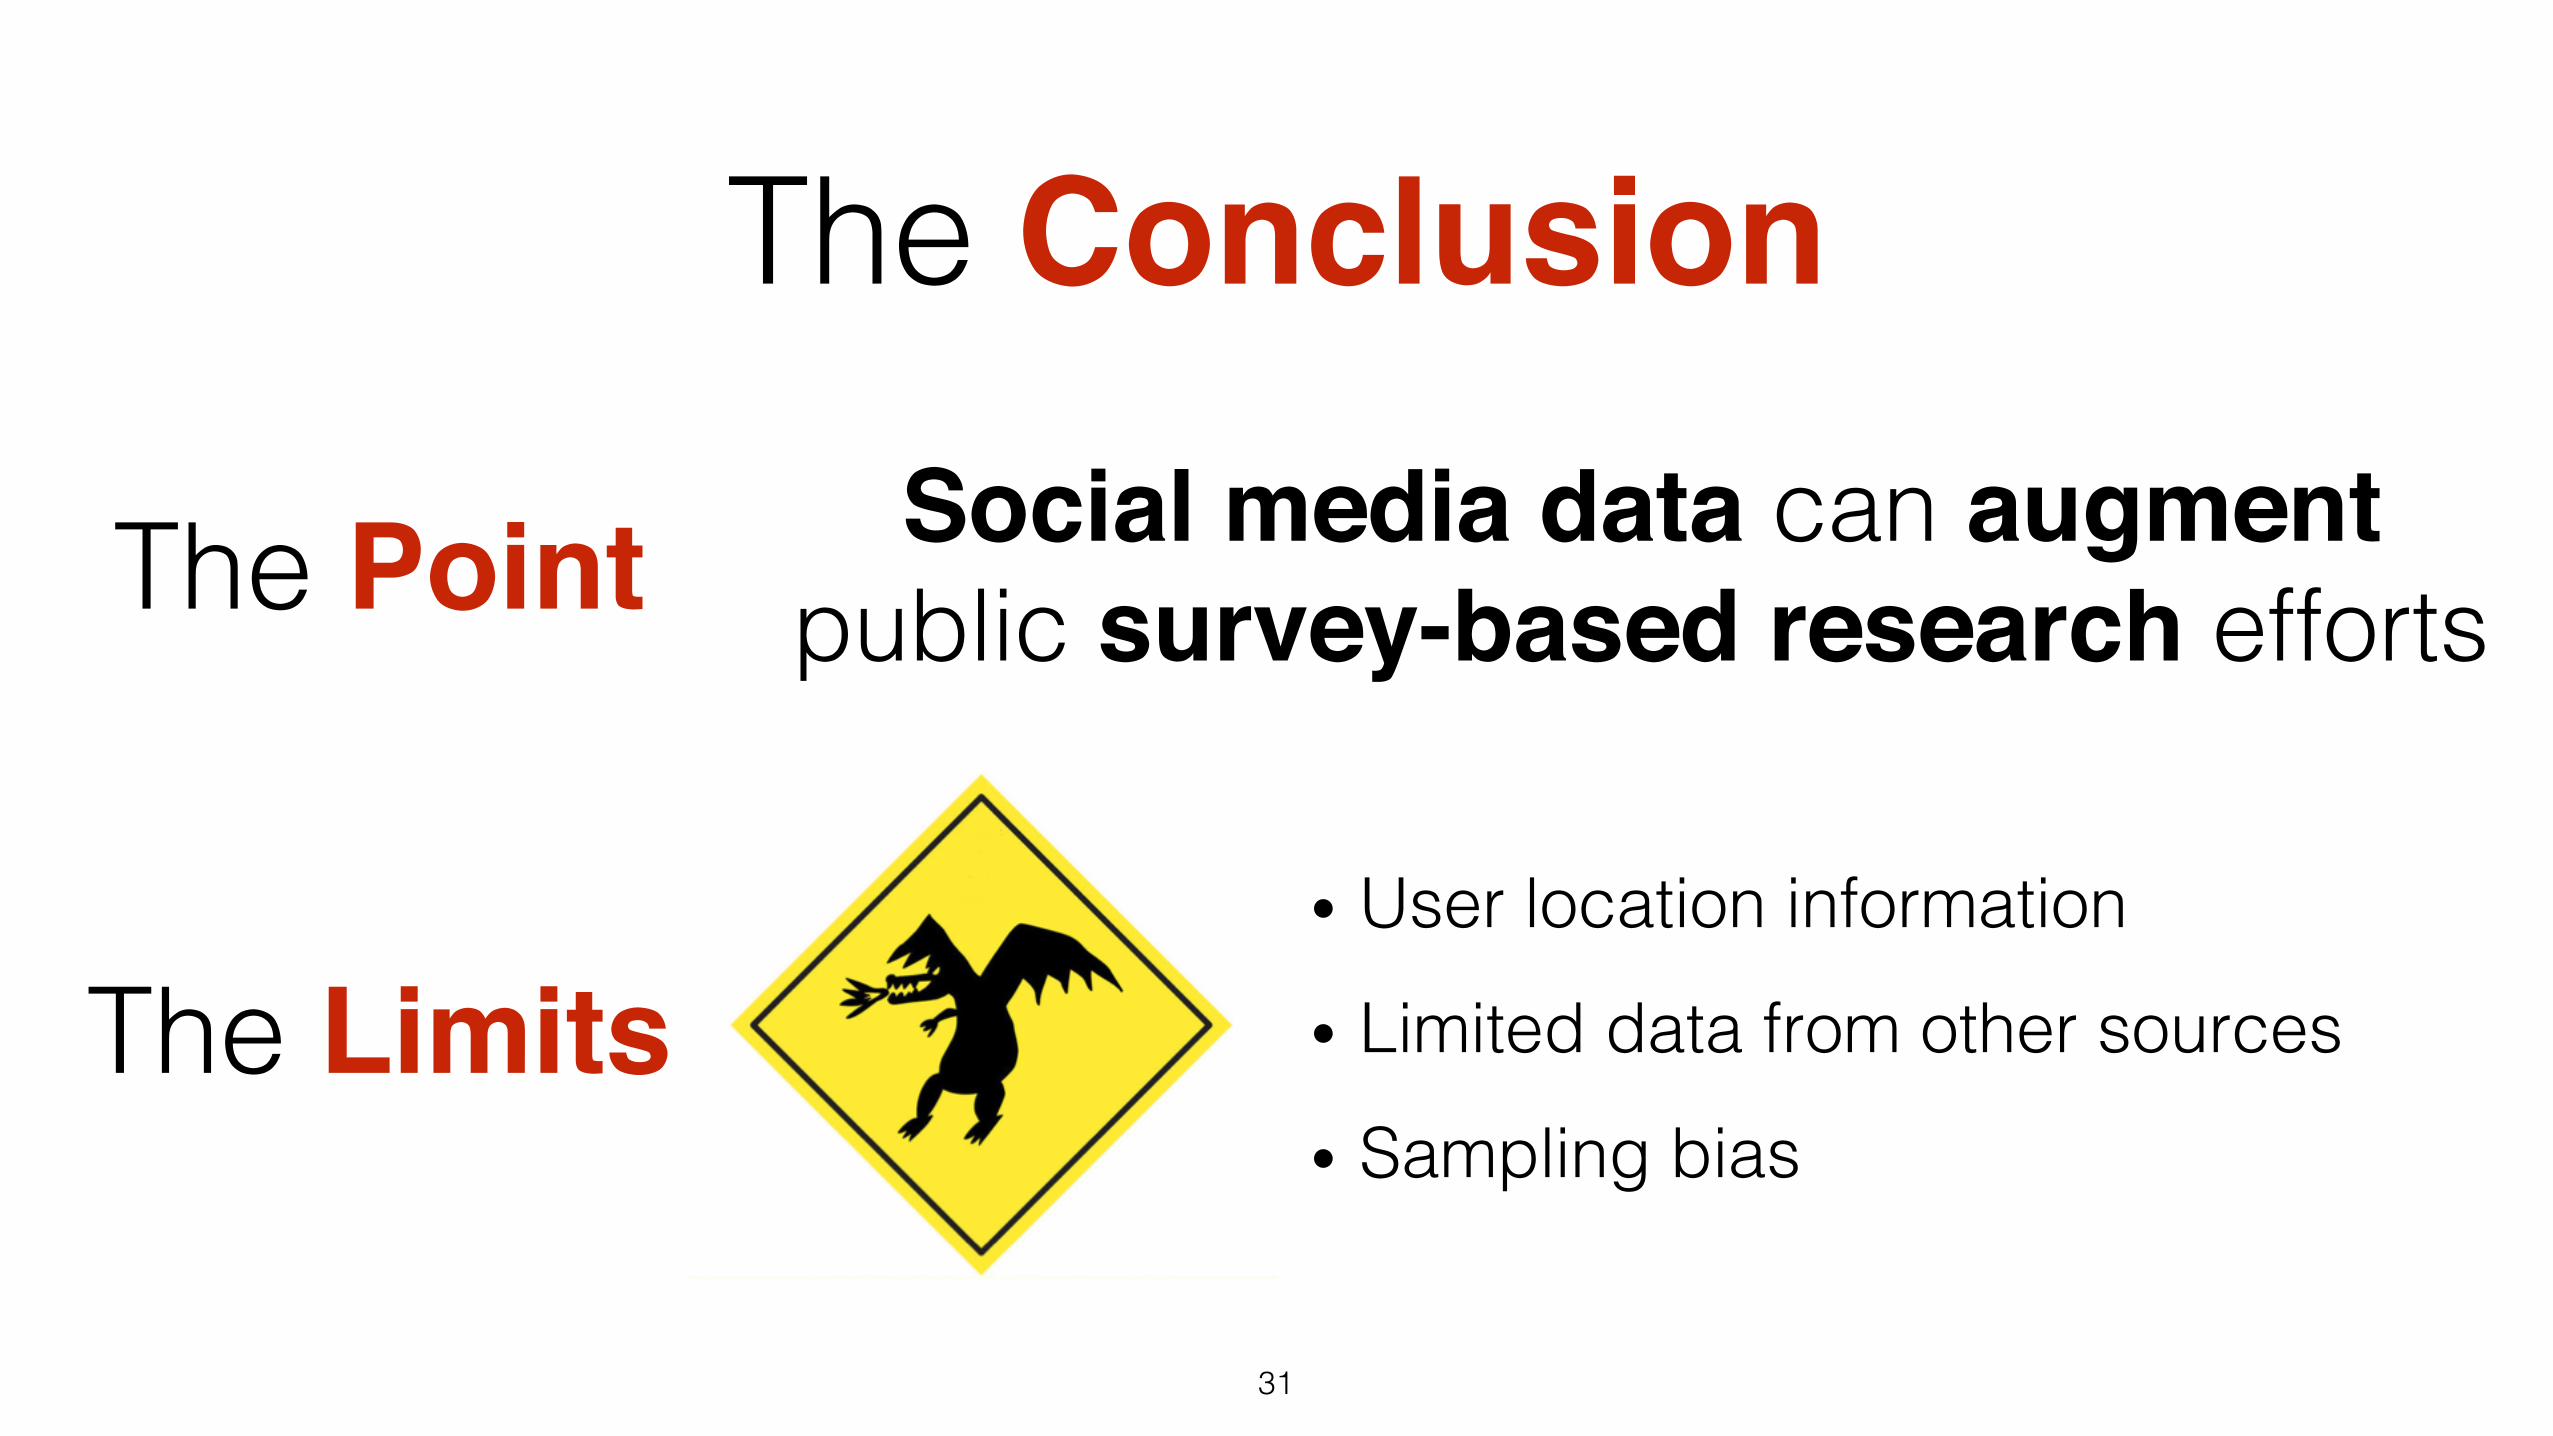
31!
The ConclusionSocial media data can augment !
public survey-based research efforts!The Point
The Limits• User location information!
• Limited data from other sources!
• Sampling bias!

Questions?!
32!