Embed Size (px)
Citation preview
Brandwatch Report/The Twitter Happiness Report: A Study on Positive and Negative Emotions Expressed on Twitter
Repo
rt/
The
Twitt
er H
appi
ness
Rep
ort/
201
5
Contents
The Twitter Happiness Report/ 2015 IntroductionAs the capabilities of online monitoring technologies and the volume of social data expand each year, the opportunities and stature of social media research also continue to grow.
Leaders in listening, analyzing and understanding online conversations, we’re well positioned to use our technology – specifically Brandwatch Analytics – to explore the possibilities of social media research.
In this report, we begin to identify the nuances behind the way people share their moods, specifically examining how we express happiness and sadness online.
Dissecting the data revealed some fascinating insights into the factors that affect how positively people describe their days and lives.
2 Introduction
4 Regional Analysis
9 Gender Analysis
12 Life Category Analysis
15 Conversations Over Time
18 Thank you
Book a demo with us brandwatch.com/demo2
Repo
rt/
The
Twitt
er H
appi
ness
Rep
ort/
201
5
Brandwatch Report
In order to determine moods, we listened to people describing their good days, bad days and general outlook on life. Our aim was to identify the specific trends, patterns or topics that led people to feel positive or negative online.
The results from this research are organized into four key areas:
• Regional Analysis
• Gender Analysis
• Life Categories
• Conversations Over Time
To learn more about how we were able to do this using Brandwatch Analytics, or to dive deeper into the methodology, results and interpretations of the research, you can download the unabridged version of this report at:
brandwatch.com/twitterhappinessresearch
Introduction/
Book a demo with us brandwatch.com/demo3
Repo
rt/
The
Twitt
er H
appi
ness
Rep
ort/
201
5
The Twitter Happiness Report
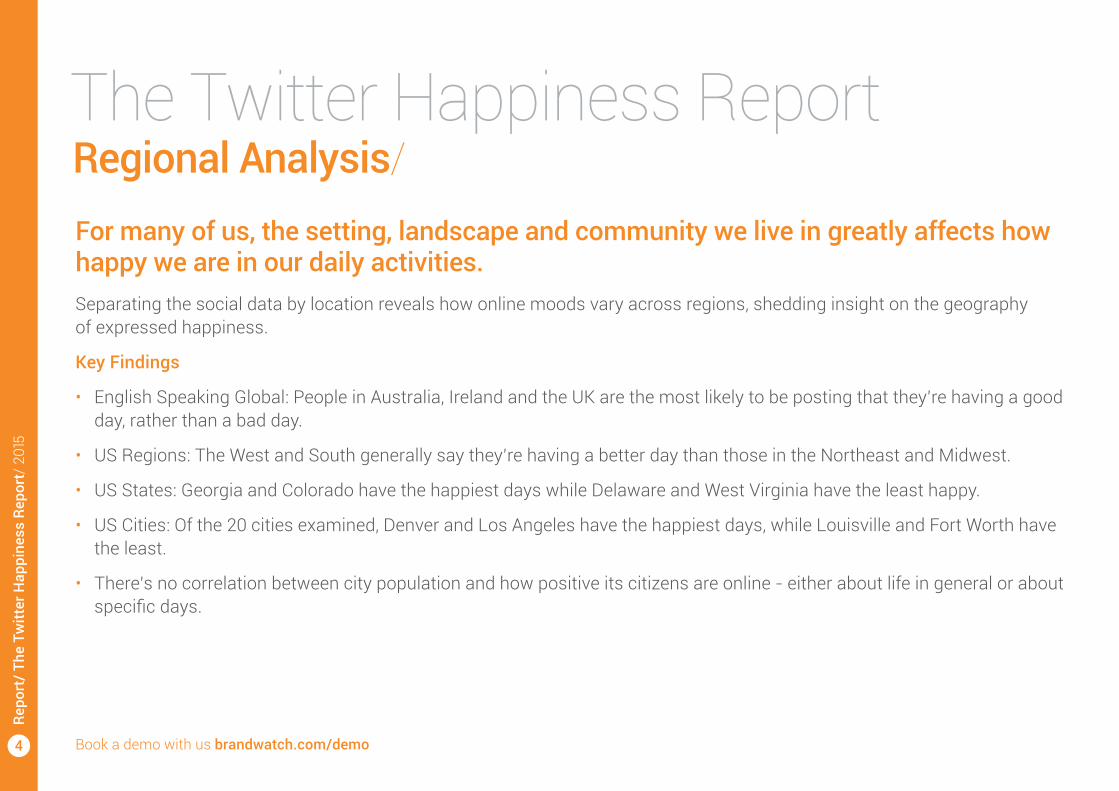
Separating the social data by location reveals how online moods vary across regions, shedding insight on the geography of expressed happiness.
Key Findings
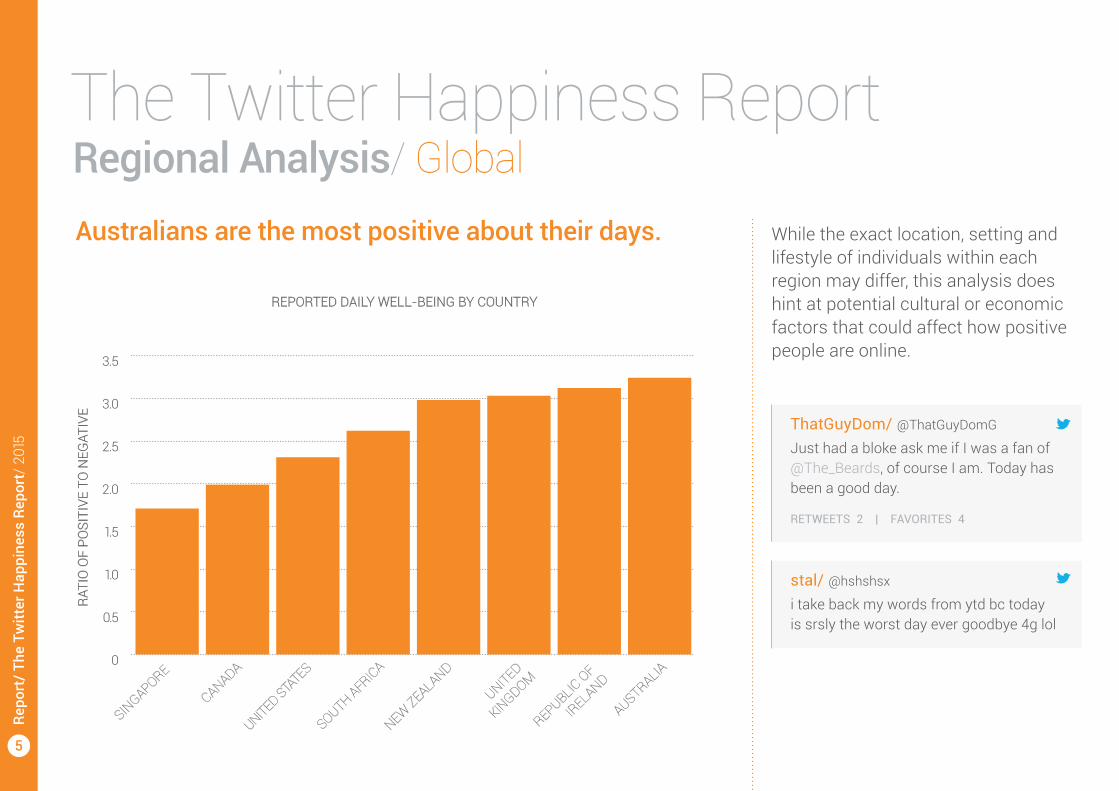
• English Speaking Global: People in Australia, Ireland and the UK are the most likely to be posting that they’re having a good day, rather than a bad day.
• US Regions: The West and South generally say they’re having a better day than those in the Northeast and Midwest.
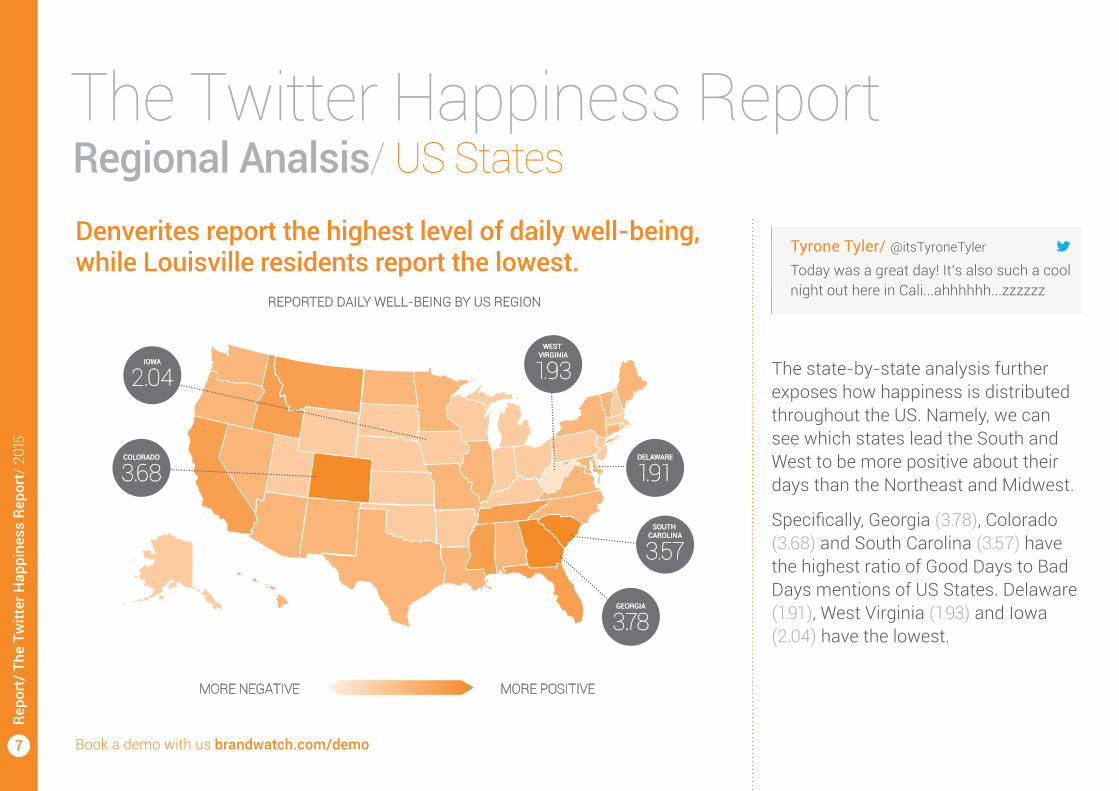
• US States: Georgia and Colorado have the happiest days while Delaware and West Virginia have the least happy.
• US Cities: Of the 20 cities examined, Denver and Los Angeles have the happiest days, while Louisville and Fort Worth have the least.
• There’s no correlation between city population and how positive its citizens are online - either about life in general or about specific days.
For many of us, the setting, landscape and community we live in greatly affects how happy we are in our daily activities.
Regional Analysis/
Book a demo with us brandwatch.com/demo4
Repo
rt/
The
Twitt
er H
appi
ness
Rep
ort/
201
5
The Twitter Happiness Report
0
0.5
1.0
1.5
2.0
2.5
3.0
3.5
AUSTRALIA
REPUBLIC OF
IRELANDUNITED
KINGDOM
NEW ZEALAND
SOUTH AFRICA
UNITED STATES
CANADA
SINGAPORE
REPORTED DAILY WELL-BEING BY COUNTRY
RATI
O O
F PO
SITI
VE T
O N
EGAT
IVE
While the exact location, setting and lifestyle of individuals within each region may differ, this analysis does hint at potential cultural or economic factors that could affect how positive people are online.
Australians are the most positive about their days.
Regional Analysis/ Global
stal/ @hshshsx
i take back my words from ytd bc today is srsly the worst day ever goodbye 4g lol
ThatGuyDom/ @ThatGuyDomG
Just had a bloke ask me if I was a fan of @The_Beards, of course I am. Today has been a good day.
RETWEETS 2 | FAVORITES 4
5
Repo
rt/
The
Twitt
er H
appi
ness
Rep
ort/
201
5
The Twitter Happiness Report
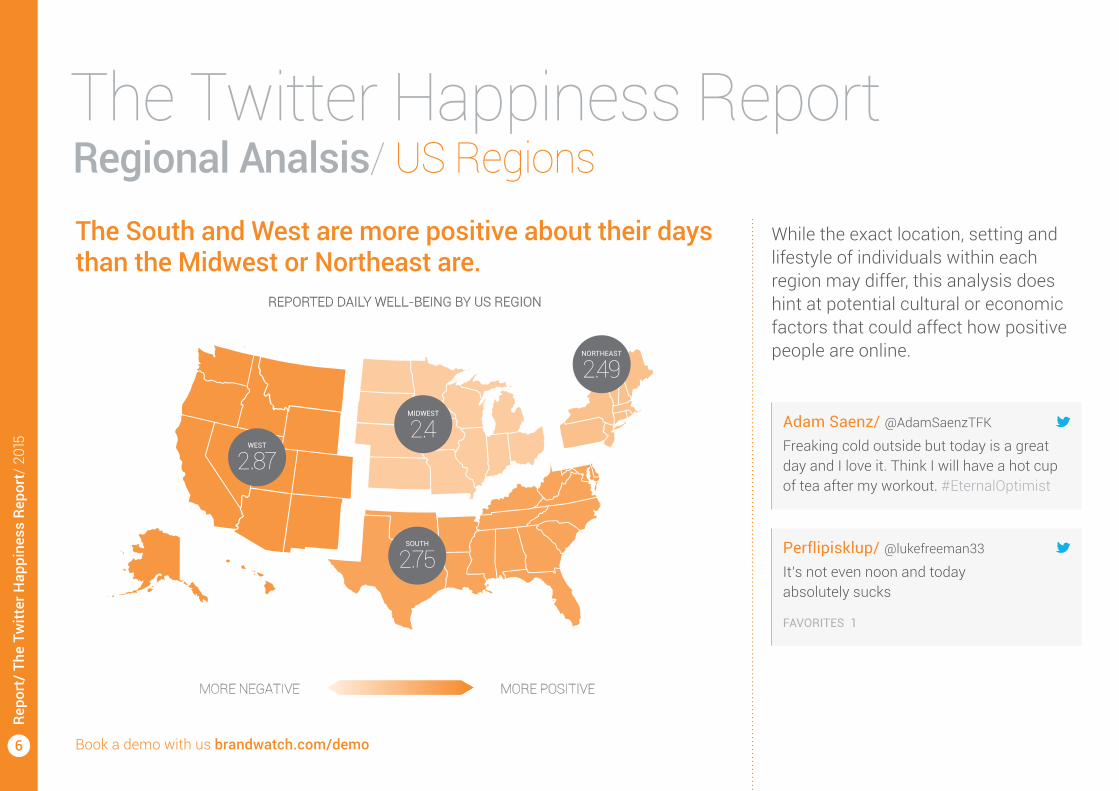
REPORTED DAILY WELL-BEING BY US REGION
SOUTH
2.75
MIDWEST
2.4
NORTHEAST
2.49
WEST
2.87
MORE NEGATIVE MORE POSITIVE
The South and West are more positive about their days than the Midwest or Northeast are.
Regional Analsis/ US Regions
Adam Saenz/ @AdamSaenzTFK
Freaking cold outside but today is a great day and I love it. Think I will have a hot cup of tea after my workout. #EternalOptimist
Perflipisklup/ @lukefreeman33
It’s not even noon and today absolutely sucks
FAVORITES 1
While the exact location, setting and lifestyle of individuals within each region may differ, this analysis does hint at potential cultural or economic factors that could affect how positive people are online.
Book a demo with us brandwatch.com/demo6
Repo
rt/
The
Twitt
er H
appi
ness
Rep
ort/
201
5
The Twitter Happiness Report
REPORTED DAILY WELL-BEING BY US REGION
MORE NEGATIVE MORE POSITIVE
IOWA
2.04
DELAWARE
1.91
WEST VIRGINIA
1.93
SOUTH CAROLINA
3.57
GEORGIA
3.78
COLORADO
3.68
MORE NEGATIVE MORE POSITIVE
IOWA
2.04
DELAWARE
1.91
WEST VIRGINIA
1.93
SOUTH CAROLINA
3.57
GEORGIA
3.78
COLORADO
3.68
Regional Analsis/ US StatesDenverites report the highest level of daily well-being, while Louisville residents report the lowest.
Tyrone Tyler/ @itsTyroneTyler
Today was a great day! It’s also such a cool night out here in Cali...ahhhhhh...zzzzzz
The state-by-state analysis further exposes how happiness is distributed throughout the US. Namely, we can see which states lead the South and West to be more positive about their days than the Northeast and Midwest.
Specifically, Georgia (3.78), Colorado (3.68) and South Carolina (3.57) have the highest ratio of Good Days to Bad Days mentions of US States. Delaware (1.91), West Virginia (1.93) and Iowa (2.04) have the lowest.
Book a demo with us brandwatch.com/demo7
Repo
rt/
The
Twitt
er H
appi
ness
Rep
ort/
201
5
The Twitter Happiness Report
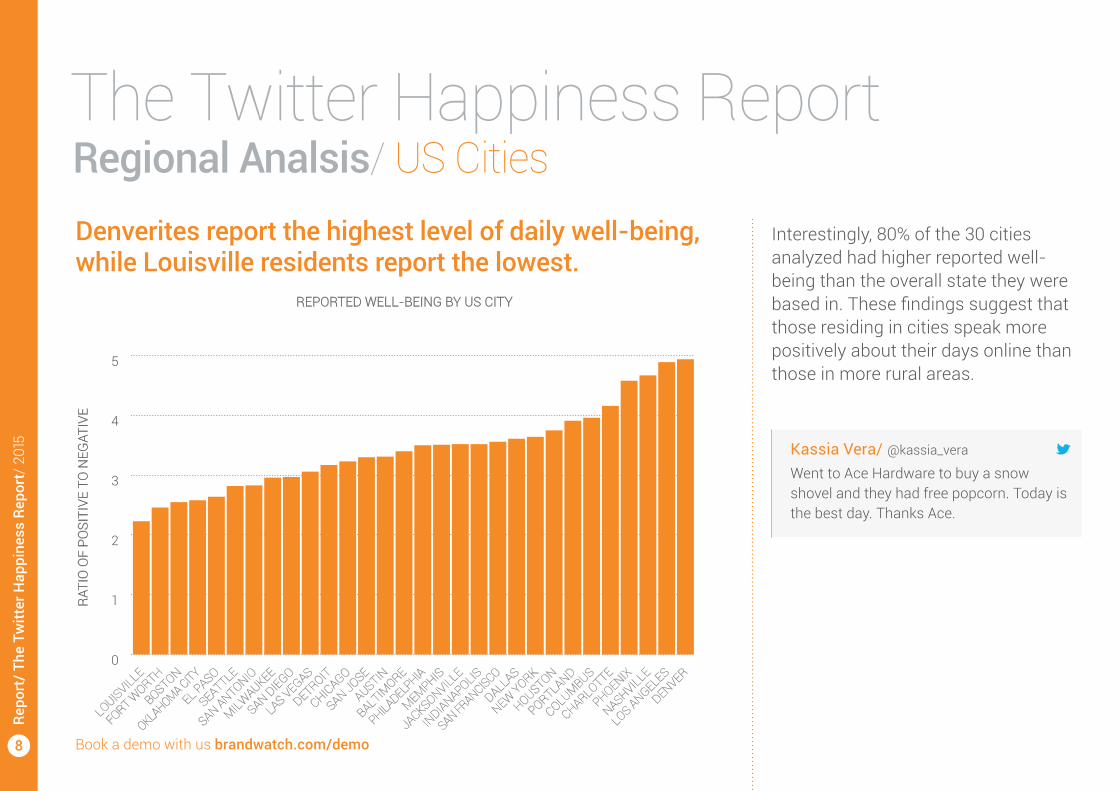
REPORTED WELL-BEING BY US CITY
0
1
2
3
4
5
DENVER
LOS ANGELES
NASHVILLE
PHOENIX
CHARLOTTE
COLUMBUS
PORTLAND
HOUSTON
NEW YORK
DALLAS
SAN FRANCISCO
INDIANAPOLIS
JACKSONVILLE
MEMPHIS
PHILADELPHIA
BALTIMORE
AUSTIN
SAN JOSE
CHICAGO
DETROIT
LAS VEGAS
SAN DIEGO
MILWAUKEE
SAN ANTONIO
SEATTLE
EL PASO
OKLAHOMA CITY
BOSTON
FORT WORTH
LOUISVILLE
RATI
O O
F PO
SITI
VE T
O N
EGAT
IVE
Regional Analsis/ US CitiesDenverites report the highest level of daily well-being, while Louisville residents report the lowest.
Kassia Vera/ @kassia_vera
Went to Ace Hardware to buy a snow shovel and they had free popcorn. Today is the best day. Thanks Ace.
Interestingly, 80% of the 30 cities analyzed had higher reported well-being than the overall state they were based in. These findings suggest that those residing in cities speak more positively about their days online than those in more rural areas.
Book a demo with us brandwatch.com/demo8
Repo
rt/
The
Twitt
er H
appi
ness
Rep
ort/
201
5
The Twitter Happiness Report
Gender Analysis/
Future social media research could explore the specific conversation topics that are driving these discrepancies.
Key Findings
• When reporting about how well their day is going, males are generally more positive than females.
• When talking about life in general, males and females are nearly equal in their sentiment.
• Females are more likely than males to talk about their lives in general, rather than how well their day is going.
Isolating the online conversations by gender exposes some differences in the ways males and females discuss their days and lives online.
Book a demo with us brandwatch.com/demo9
Repo
rt/
The
Twitt
er H
appi
ness
Rep
ort/
201
5
The Twitter Happiness Report
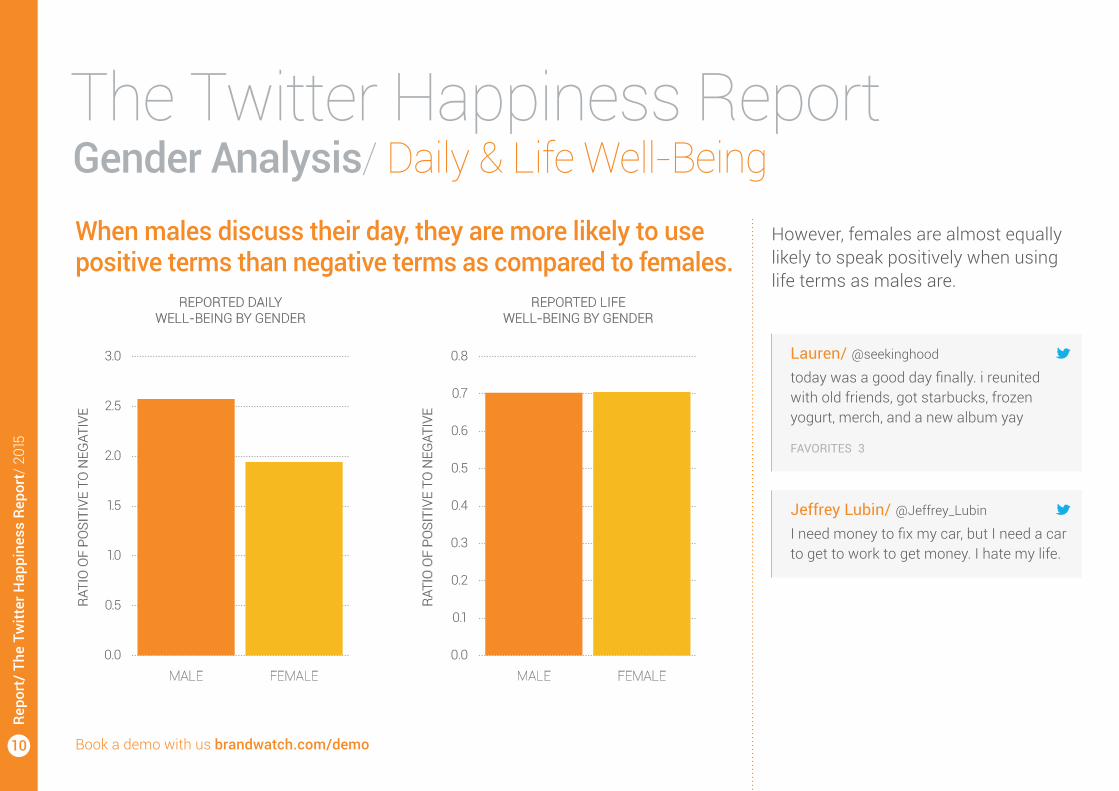
REPORTED DAILY WELL-BEING BY GENDER
REPORTED LIFE WELL-BEING BY GENDER
0.0
0.5
1.0
1.5
2.0
2.5
3.0
0.0
0.1
0.2
0.3
0.4
0.5
0.6
0.7
0.8
FEMALEMALE FEMALEMALE
RATI
O O
F PO
SITI
VE T
O N
EGAT
IVE
RATI
O O
F PO
SITI
VE T
O N
EGAT
IVE
When males discuss their day, they are more likely to use positive terms than negative terms as compared to females.
However, females are almost equally likely to speak positively when using life terms as males are.
Gender Analysis/ Daily & Life Well-Being
Lauren/ @seekinghood
today was a good day finally. i reunited with old friends, got starbucks, frozen yogurt, merch, and a new album yay
FAVORITES 3
Jeffrey Lubin/ @Jeffrey_Lubin
I need money to fix my car, but I need a car to get to work to get money. I hate my life.
Book a demo with us brandwatch.com/demo10
Repo
rt/
The
Twitt
er H
appi
ness
Rep
ort/
201
5
The Twitter Happiness Report
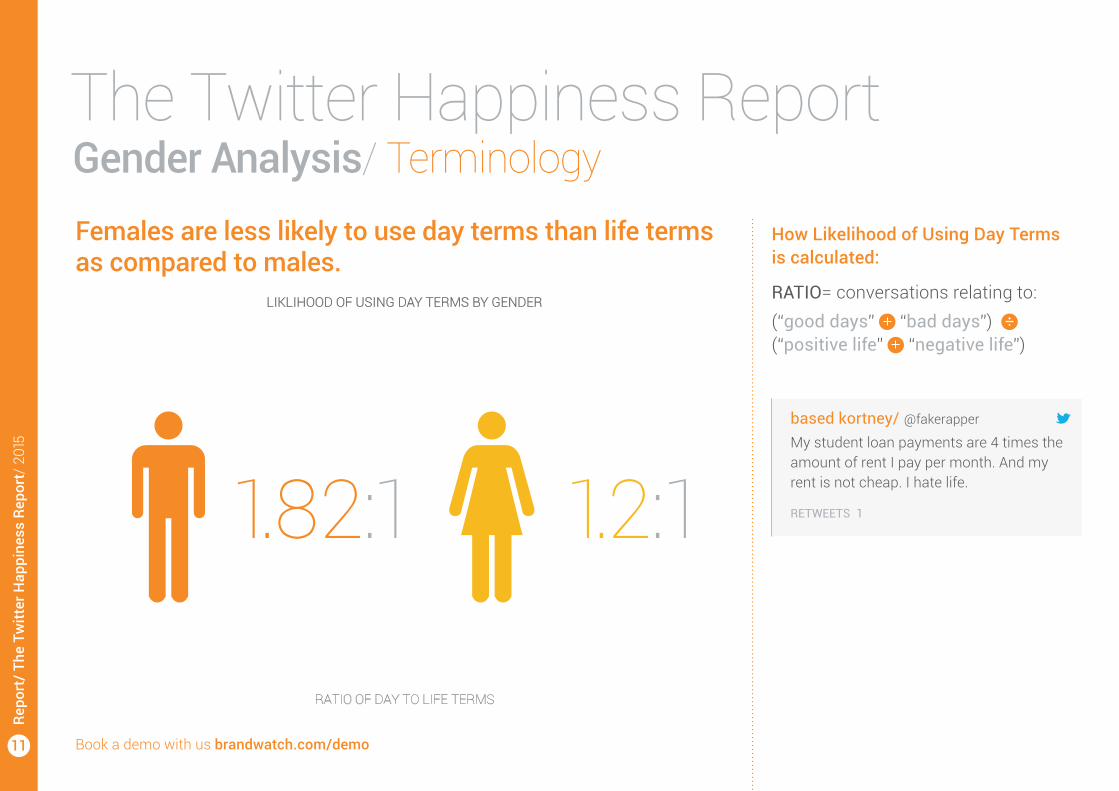
LIKLIHOOD OF USING DAY TERMS BY GENDER
1.82:1 1.2:1
RATIO OF DAY TO LIFE TERMS
How Likelihood of Using Day Terms is calculated:
RATIO= conversations relating to:(“good days” “bad days”) (“positive life” “negative life”)
Gender Analysis/ TerminologyFemales are less likely to use day terms than life terms as compared to males.
based kortney/ @fakerapper
My student loan payments are 4 times the amount of rent I pay per month. And my rent is not cheap. I hate life.
RETWEETS 1
Book a demo with us brandwatch.com/demo11
Repo
rt/
The
Twitt
er H
appi
ness
Rep
ort/
201
5
The Twitter Happiness Report
Key Findings
• Perhaps unsurprisingly, people are less positive about Work than they are about Friends & Family or Money.
• Conversations around Work were more likely to be discussed in relation to general happiness than having individually good or bad days relating to Work. The opposite was true of conversations about Friends & Family or Money, which were more commonly discussed in relation to a having a specifically good or bad day.
Life Category Analysis/While Regional and Gender analyses help us understand how different groups discuss their days, they do little to outline the specific factors that affect our well-being.
The following category analysis examines how mood varies across specific topics: Friends & Family, Money, and Work.
Book a demo with us brandwatch.com/demo12
Repo
rt/
The
Twitt
er H
appi
ness
Rep
ort/
201
5
The Twitter Happiness Report
• DAILY WELL-BEING • LIFE WELL-BEING
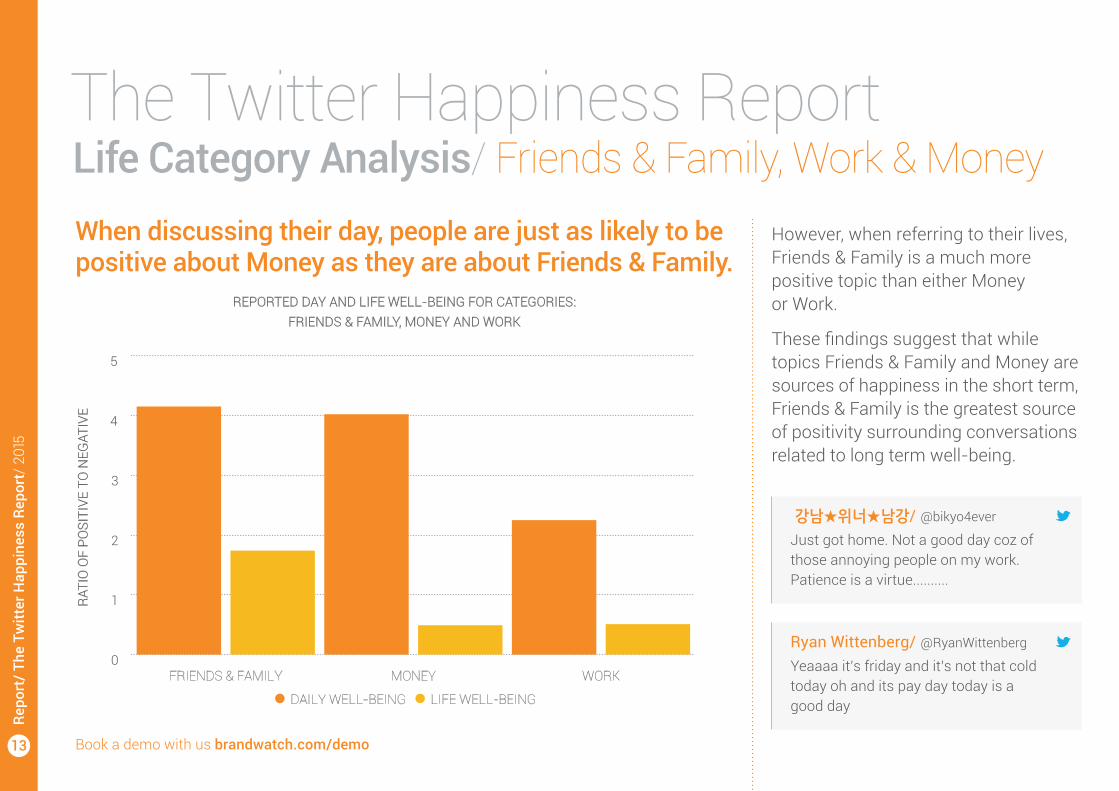
REPORTED DAY AND LIFE WELL-BEING FOR CATEGORIES: FRIENDS & FAMILY, MONEY AND WORK
0
1
2
3
4
5
WORKMONEYFRIENDS & FAMILY
RATI
O O
F PO
SITI
VE T
O N
EGAT
IVE
However, when referring to their lives, Friends & Family is a much more positive topic than either Money or Work.
These findings suggest that while topics Friends & Family and Money are sources of happiness in the short term, Friends & Family is the greatest source of positivity surrounding conversations related to long term well-being.
When discussing their day, people are just as likely to be positive about Money as they are about Friends & Family.
Life Category Analysis/ Friends & Family, Work & Money
강남★위너★남강/ @bikyo4ever
Just got home. Not a good day coz of those annoying people on my work. Patience is a virtue..........
Ryan Wittenberg/ @RyanWittenberg
Yeaaaa it’s friday and it’s not that cold today oh and its pay day today is a good day
Book a demo with us brandwatch.com/demo13
Repo
rt/
The
Twitt
er H
appi
ness
Rep
ort/
201
5
The Twitter Happiness Report
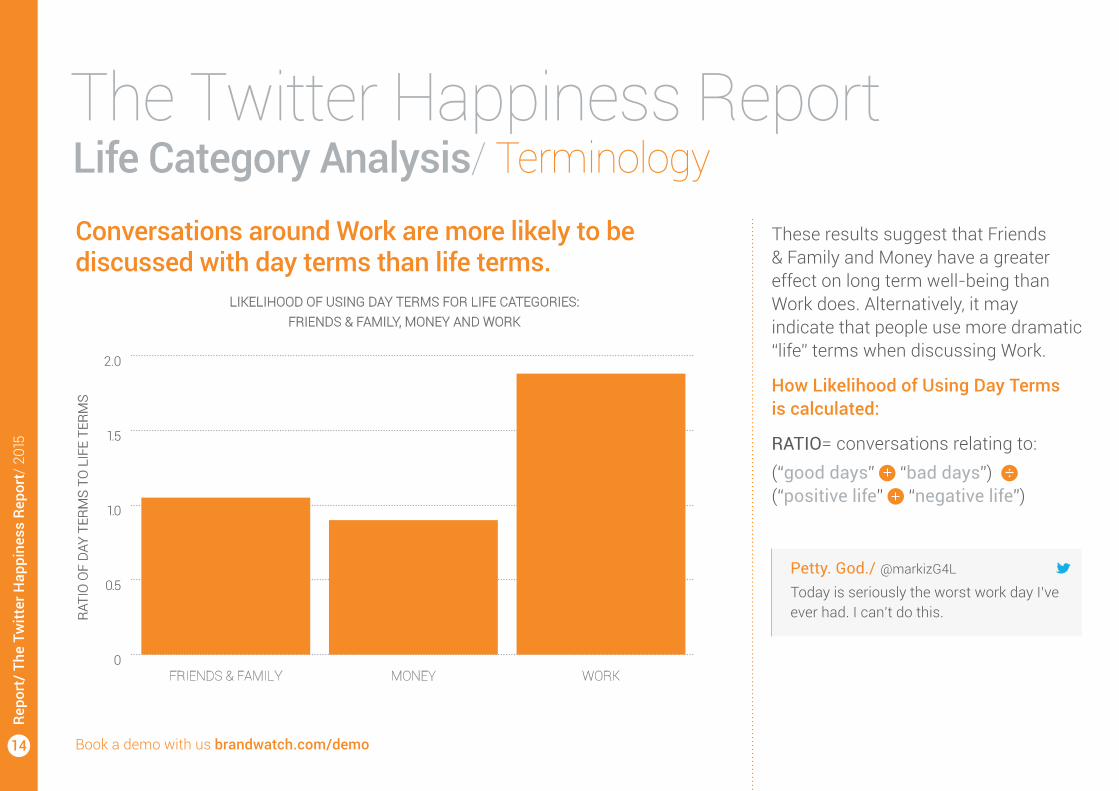
LIKELIHOOD OF USING DAY TERMS FOR LIFE CATEGORIES:FRIENDS & FAMILY, MONEY AND WORK
0
0.5
1.0
1.5
2.0
WORKMONEYFRIENDS & FAMILY
RATI
O O
F D
AY T
ERM
S TO
LIF
E TE
RMS
These results suggest that Friends & Family and Money have a greater effect on long term well-being than Work does. Alternatively, it may indicate that people use more dramatic “life” terms when discussing Work.
How Likelihood of Using Day Terms is calculated:
RATIO= conversations relating to:(“good days” “bad days”) (“positive life” “negative life”)
Conversations around Work are more likely to be discussed with day terms than life terms.
Life Category Analysis/ Terminology
Petty. God./ @markizG4L
Today is seriously the worst work day I’ve ever had. I can’t do this.
Book a demo with us brandwatch.com/demo14
Repo
rt/
The
Twitt
er H
appi
ness
Rep
ort/
201
5
The Twitter Happiness Report
Analyzing social conversations over time reveals how the weekly patterns affecting people’s moods plays out online.
Key Findings:
• Positivity is lowest throughout the traditional working week, experiencing a slight uptick on Friday and a plateaued peak on Saturday and Sunday.
• The likelihood that users discuss the quality of their lives is highest on Saturday and Sunday
Conversation Over Time/Many will recognize a specific time or day that they are happiest. Whether it’s leaving the office on Friday or relaxing on a Wednesday evening, people’s moods change throughout the week.
Book a demo with us brandwatch.com/demo15
Repo
rt/
The
Twitt
er H
appi
ness
Rep
ort/
201
5
The Twitter Happiness Report
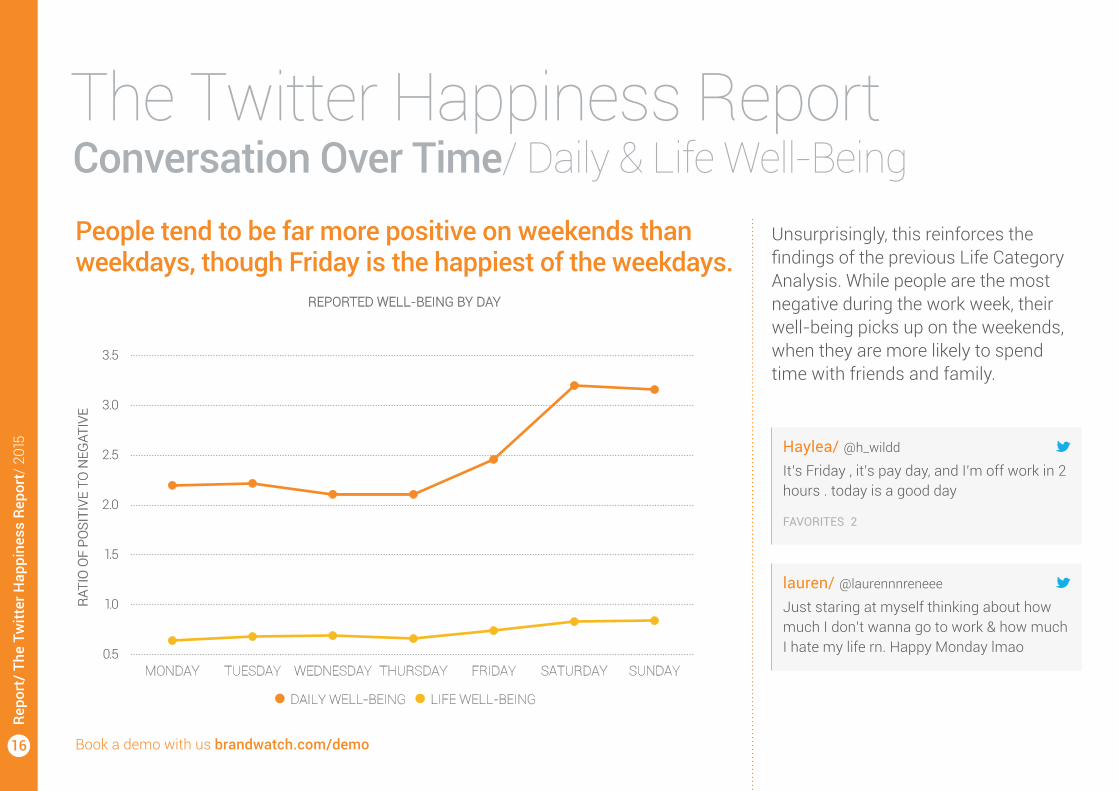
People tend to be far more positive on weekends than weekdays, though Friday is the happiest of the weekdays.
Conversation Over Time/ Daily & Life Well-Being
Haylea/ @h_wildd
It’s Friday , it’s pay day, and I’m off work in 2 hours . today is a good day
FAVORITES 2
lauren/ @laurennnreneee
Just staring at myself thinking about how much I don’t wanna go to work & how much I hate my life rn. Happy Monday lmao
Unsurprisingly, this reinforces the findings of the previous Life Category Analysis. While people are the most negative during the work week, their well-being picks up on the weekends, when they are more likely to spend time with friends and family.
Book a demo with us brandwatch.com/demo16
Repo
rt/
The
Twitt
er H
appi
ness
Rep
ort/
201
5
The Twitter Happiness Report
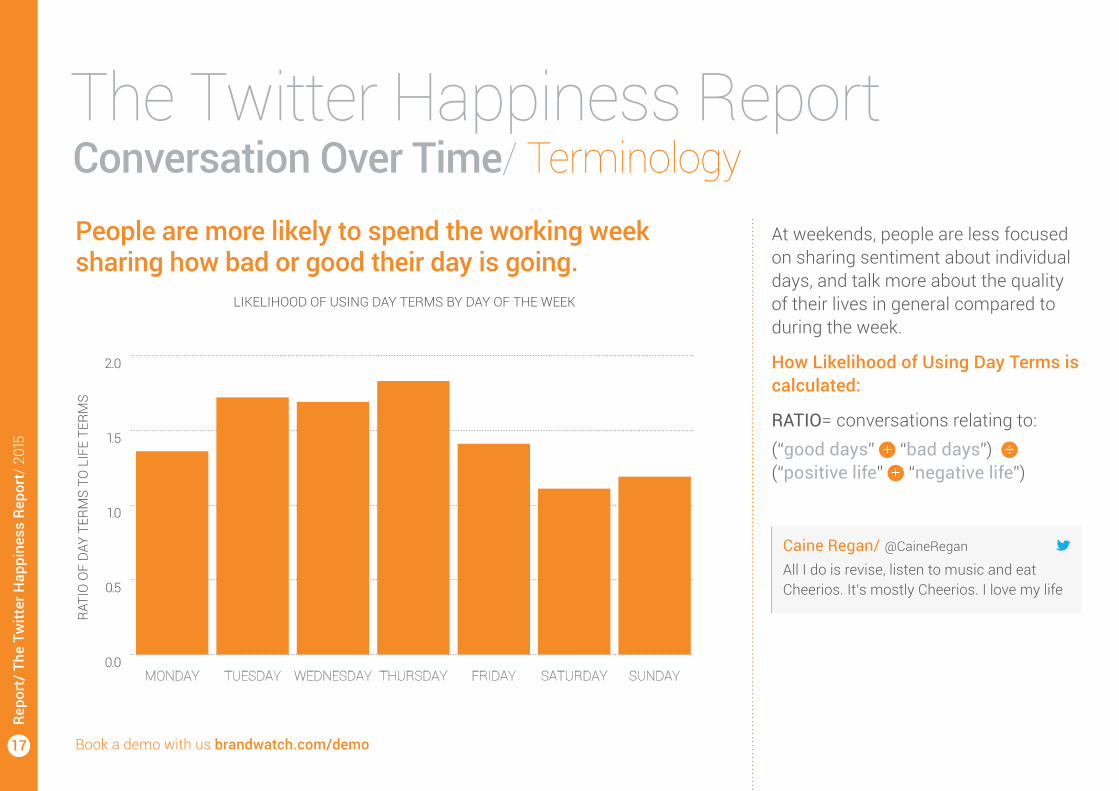
LIKELIHOOD OF USING DAY TERMS BY DAY OF THE WEEK
0.0
0.5
1.0
1.5
2.0
RATI
O O
F D
AY T
ERM
S TO
LIF
E TE
RMS
SUNDAYSATURDAYFRIDAYTHURSDAYWEDNESDAYTUESDAYMONDAY
At weekends, people are less focused on sharing sentiment about individual days, and talk more about the quality of their lives in general compared to during the week.
How Likelihood of Using Day Terms is calculated:
RATIO= conversations relating to:(“good days” “bad days”) (“positive life” “negative life”)
People are more likely to spend the working week sharing how bad or good their day is going.
Conversation Over Time/ Terminology
Caine Regan/ @CaineRegan
All I do is revise, listen to music and eat Cheerios. It’s mostly Cheerios. I love my life
Book a demo with us brandwatch.com/demo17
Repo
rt/
The
Twitt
er H
appi
ness
Rep
ort/
201
5
The Twitter Happiness Report
Document Limitation
The information given in this document has been checked for accuracy and completeness however Brandwatch shall not be liable for any errors or omissions.
Brandwatch is a trading name of Runtime Collective Limited. Registered in England & Wales: 38980534th Floor, International House, Queens Road, Brighton, BN1 3XE, United Kingdom
Thank youFor anyone working with social media, it’s important to remember that data is always more than just numbers.
Brands and organizations that can adapt, adjust and customize their activities in line with these quirks in consumer behavior will be best positioned to succeed in the digital age.
Understanding the conversations and nuances behind your organization’s audience ensures you’ll be able to communicate effectively and make informed business decisions.
We’d love to show you more about how you can understand, nurture and connect with the people that matter to your business. For a free consultation about how you can benefit from social listening, go to
Brandwatch.com/demoBrandwatch is one of the world’s leading social media listening and analytics technology platforms. Gathering millions of online conversations every day and providing users with the tools to analyze them, Brandwatch empowers brands and agencies to make smarter, data-driven business decisions, and is used by over 1000 brands and agencies, including Whole Foods, Verizon, Whirlpool, Pepsico, British Airways, Papa John’s, and Dell.
Brandwatch. Now You Know.
The Twitter Happiness Report/ 2015
Contact Us [email protected] twitter.com/brandwatch facebook.com/brandwatch linkedin.com/company/brandwatch
US +1 212 229 2240 UK +44 (0)1273 234 290 Germany +49 (0)30 5683 7004-0
18
Repo
rt/
The
Twitt
er H
appi
ness
Rep
ort/
201
5
Brandwatch Report