Embed Size (px)
Citation preview

.lusoftware verification & validationVVS
Automated Change Impact Analysis between SysML Models of Requirements and Design
Shiva Nejati, Mehrdad Sabetzadeh, Chetan Arora, Lionel Briand, Felix Mandoux
November 15, 2016

Change Impact Analysis (CIA)
``Identifying the potential consequences of a change or estimating what needs to be modified to accomplish a change’’
Bohner and Arnold, 1996
``The evaluation of the many risks associated with the change, including estimates of the effects on resources, effort, and schedule’’
Pfleeger and Atlee, 2006
2

Scope • Automotive
• Standards, e.g., ISO 26262
• Compliance required by customers
• Rigorous change management
• Change Impact Analysis (CIA)
3
Design Requirements

System-Level CIA • INCOSE System engineering
roles include requirements owner and customer interface
• System engineers are responsible for assessing and handling customer requirements change requests
• Change impact analysis solutions have to be defined at system-level
4
System Engineer
SW Engineer
HW Engineer
Customer

Supporting CIA
• Step 1: Devise a methodology to capture requirements and design, and traceability from requirements to design
• Step 2: Develop automated support for CIA using the models and traceability links built in Step 1.
5

CIA Automation Goal
• Given a change in a requirement, our goal is to compute a set of (potentially) impacted design elements that includes
• all the actually impacted elements (high recall)
• very few non-impacted elements (high precision)
6

Modeling • Systems Modeling Language (SysML)
• A subset of UML extended with systems engineering diagrams
• A standard for systems engineering
• Preliminary support for requirement analysis and built-in traceability mechanism
7

Traceability • Requirements to design traceability
• It captures the rationale of design decisions
• What is rationale?
• Level of granularity?
• Traceability is expensive
• Its precision affects the precision of impact analysis
• Trade-off
8

Is SysML Enough?
• Do we have proper guidelines for establishing traceability links?
• SysML is only a notation and needs a methodology
• Are the built-in SysML traceability links capable of addressing our needs?
• New traceability links
• Specialized semantics of existing ones: Refine, decompose, derive …
• Explicit and implicit traceability
9

Artifacts
• Textual information: requirements text, change rationale statements
• Design:
• SysML structure: Internal Block Diagrams (HW, SW)
• SysML behavior: Activity Diagrams for SW blocks
10

Requirements Diagram
11

:Over-Temperature Monitor
:Diagnostics Manager
:Diagnostics and Status Signal
Generation
:Digital to Analog Converter
:DC Motor Controller :Temperature
Processor
<<requirement>>"Over-Temperature
Detection"(R11)
<<requirement>>"Operational
Temperature Range"(R12)
B1
B2
B3
B4
B5
B6
<<satisfy>>
<<satisfy>>
Internal Block Diagrams (IBD)

Diagnostics Manager
<<Decision>>"Is position valid?
<<Decision>>"Over-Temperature
detected?
<<Assignment>>"Error = 1
B3
<<Assignment>>"MotorDriveMode = OFF
<<Assignment>>"MotorDriveMode = RUN
[yes] [no]
[yes]
[no]
Activity Diagrams (AD)

Traceability Information Model
14
RequirementsStructure
Requirement
Block
Software block
Port
Activity diagram
satisfy
*
* origin
target
*
Out
Hardware block
behaviour
Transition
Node
1..* Action
Object
Control Object CallAssignment
Parameter
Local
In
source
1..*
Decision
target
*
1 1
connector
Behaviour
Software requirement
Hardware requirement
inout
correspond
DataControl
1..**
*
1
1
*
Explicit traceability links
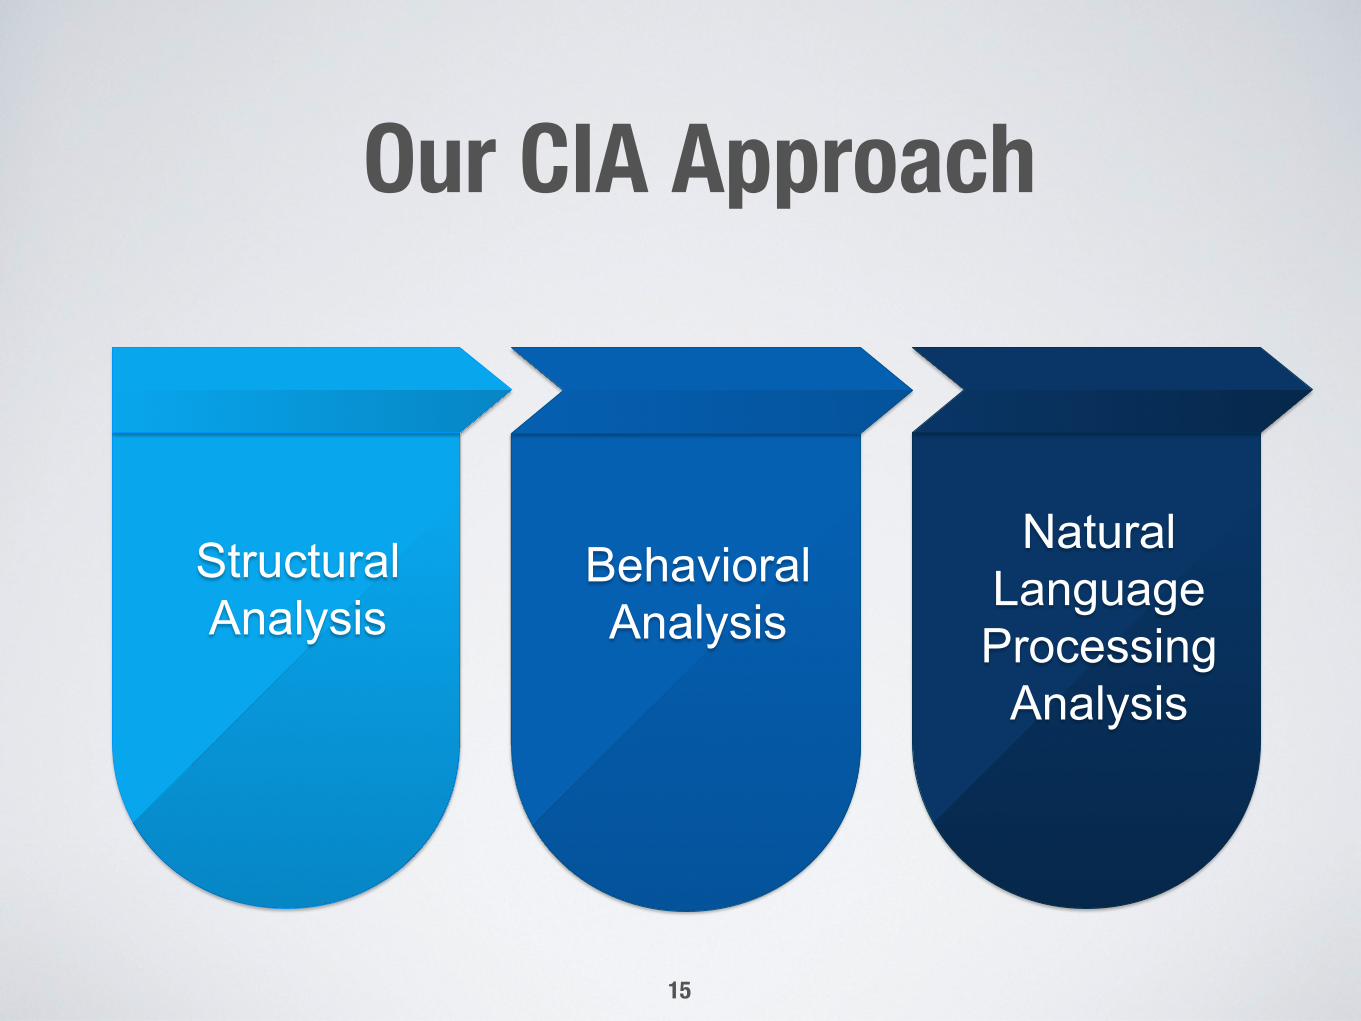
Our CIA Approach
15
Structural Analysis
Behavioral Analysis
Natural Language Processing
Analysis

Approach
16
Build SysML Models
System "Requirements
Traceability "Information Model
Requirements and "Design Models
Estimated "Impact Set
Compute Impacted Elements
Change "Statements
Phrases Similarity"
Matrix
Process Change Statements
Sort"Elements
Sorted"Elements

Case Study
17
Electronic Variable Cam Phaser (CP)
• Includes mechanical, electronic and software components
• Adjusts the timing of cam lobes with respect to that of the crank shaft in an engine, while the engine is running.
• CP is safety-critical and subject to the ISO 26262 standard.

Motivating Scenario"
18
Example Change Requests:
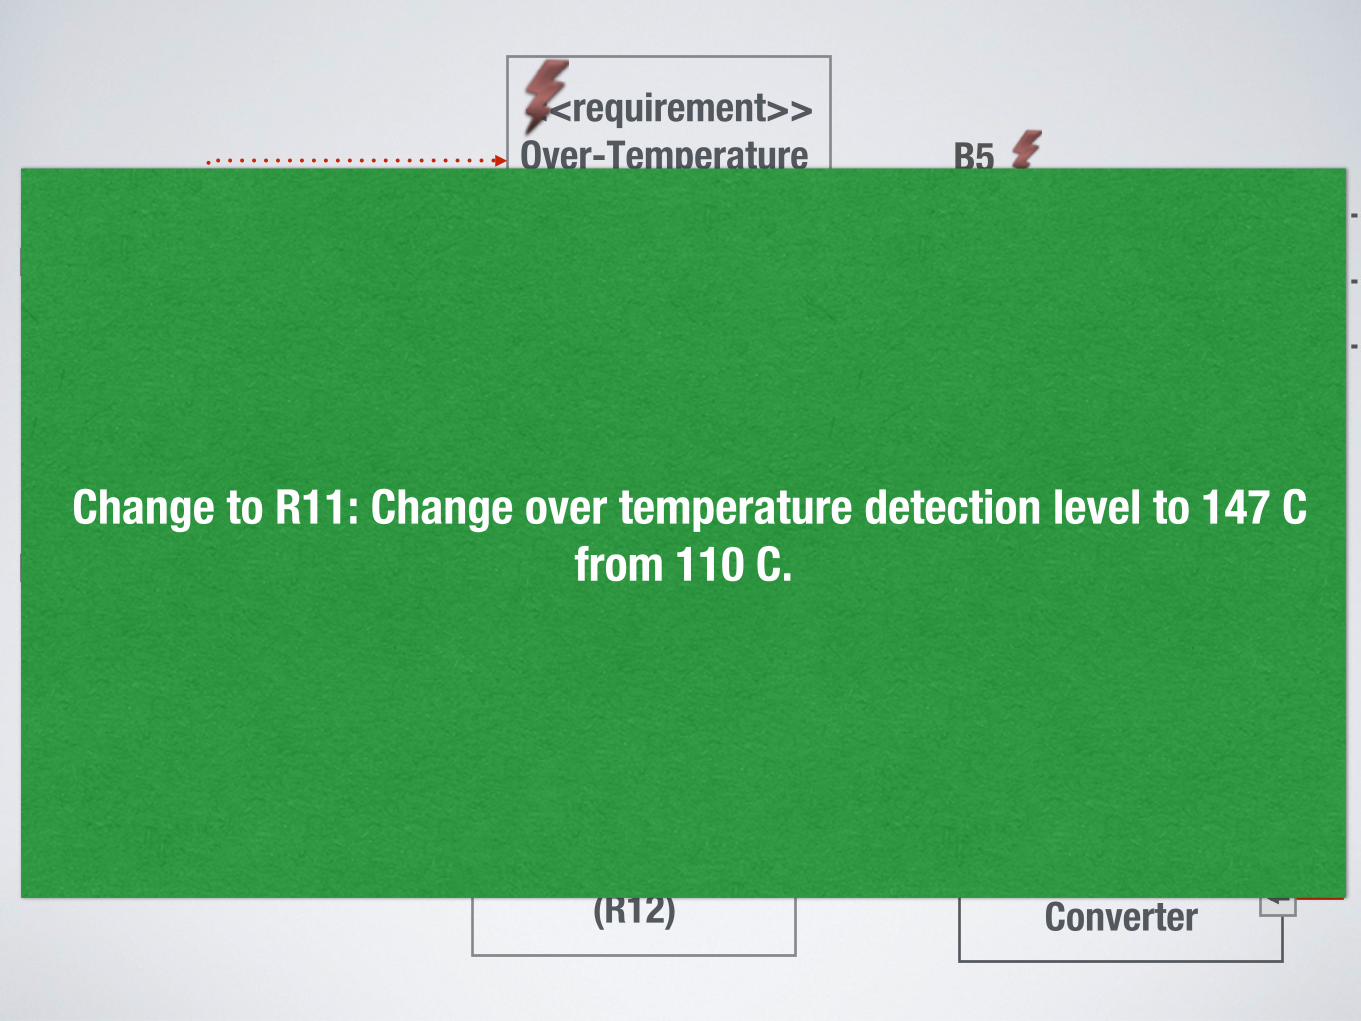
• Change to R11: Change over temperature detection level to 147 C from 110 C
• Change to R12: Temperature range should be extended to -40/150 C from -20/120 C
:Over-Temperature Monitor
:Diagnostics Manager
:Diagnostics and Status Signal
Generation
:Digital to Analog Converter
:DC Motor Controller :Temperature
Processor
<<requirement>>"Over-Temperature
Detection"(R11)
<<requirement>>"Operational
Temperature Range"(R12)
B1
B2
B3 B4
B5
B6
Change to R11: Change over temperature detection level to 147 C from 110 C.

:Over-Temperature Monitor
:Diagnostics Manager
:Diagnostics and Status Signal
Generation
:Digital to Analog Converter
:DC Motor Controller :Temperature
Processor
<<requirement>>"Over-Temperature
Detection"(R11)
<<requirement>>"Operational
Temperature Range"(R12)
B1
B2
B3 B4
B5
B6

Diagnostics Manager
<<Decision>>"Is position valid?
<<Decision>>"Over-Temperature
detected?
<<Assignment>>"Error = 1
B3
<<Assignment>>"MotorDriveMode = OFF
<<Assignment>>"MotorDriveMode = RUN
[yes] [no]
[yes]
[no]

Diagnostics Manager
<<Decision>>"Is position valid?
<<Decision>>"Over-Temperature
detected?
<<Assignment>>"Error = 1
B3
<<Assignment>>"MotorDriveMode = OFF
<<Assignment>>"MotorDriveMode = RUN
[yes] [no]
[yes]
[no]
input"from B2
output"to B5
output"to B4

:Over-Temperature Monitor
:Diagnostics Manager
:Diagnostics and Status Signal
Generation
:Digital to Analog Converter
:DC Motor Controller :Temperature
Processor
<<requirement>>"Over-Temperature
Detection"(R11)
<<requirement>>"Operational
Temperature Range"(R12)
B1
B2
B3 B4
B5
B6

Rank Elements
24
Natural Language Processing Analysis
Change to R11: Change over temperature detection level to 147 C from 110 C.
B2, B3, B4, B6
B2"B6"B3"B4
Ranked according to likelihood of
impact

Change Statements
• Informal inputs from systems engineers regarding impact of changes
• Example: “Temperature lookup tables and voltage converters need to be adjusted”
25

Natural Language Processing
• Computing similarity scores for model elements by applying NLP techniques to measure similarity between model elements labels and change statements.
• Sorting the design elements obtained after structural and behavioral analysis based on the similarity scores
• Engineers inspect the sorted lists to identify impacted elements
26

Approach
27
Build SysML Models
System "Requirements
Traceability "Information Model
Requirements and "Design Models
Estimated "Impact Set
Compute Impacted Elements
Change "Statements
Phrases Similarity"
Matrix
Process Change Statements
Sort"Elements
Sorted"Elements

Challenges
• Which similarity measures to use?
• Experiment
• Mix syntactic and semantic measures: 19 combinations
• SofTDIDF (SIMPACK) and JCN (SEMILAR)
• What heuristic to use to stop inspecting potentially impacted elements?
28

Identifying a Subset to Inspect
• Pick the last significant peak in delta similarity between two successive elements
Del
ta
r = 49%
% of elements inspected in the sorted list
0 25 50 75 100
0.0
0.1
0.2
0.0
0.8
0.6
0.4
0.2
Sim
ilari
ty s
core
�
h = 0.26max
h = 0.026max/10h last
Figure 13: Ranked similarity scores and delta chartfor an example change scenario from CP. The deltachart is used for computing the cuto↵ (r).
and i�1. For easier understanding, in Figure 13, we furthershow the ranked similarity scores on the top of the deltachart. These similarity scores were computed using Soft-TFIDF (syntactic measure) and JCN (semantic measure).As described in Section 2.3, the label of each EIS elemente is compared against all keyphrases in the change state-ment using both SoftTFIDF and JCN. The maximum valueobtained from all these comparisons is assigned to e as itssimilarity score. The chart on the top of Figure 13 plots theEIS elements in descending order of the similarity scores.
For the cuto↵, we pick the point on the X-axis after whichthere are no significant peaks in the delta chart. Intuitively,the cuto↵ is the point beyond which the similarity scores canno longer adequately tell apart the elements in terms of be-ing impacted. What is a significant peak is relative. Basedon our experiments, a peak is significant if it is larger thanone-tenth of the highest peak in the delta chart, denotedhmax
in Figure 13. The only exception is the peak causedby zeroing out similarity scores smaller than 0.05 (see Sec-tion 2.3). This peak, if it exists, is always the last one andhence denoted h
last
. Since hlast
is artificial in the sense thatit is caused by zeroing out negligible similarity values, weignore h
last
when deciding about the cuto↵.More precisely, we define the cuto↵ r to be at the end of
the right slope of the last significant peak (excluding hlast
).In the example of Figure 13, h
max
= 0.26. Hence, r is atthe end of the last peak with a height > h
max
/10 = 0.026.We recommend that engineers should inspect the EIS ele-ments up to the cuto↵ and no further. In the example ofFigure 13, the cuto↵ is at 49% of the ranked list. We notethat the cuto↵ can be computed automatically and with-out user involvement. Therefore, the delta charts and theirinterpretation are transparent to the users of our approach.In summary, for each change scenario, we automatically
recommend, through the analysis of the corresponding deltachart as explained above, the fraction of the ranked EISthat the engineers should manually inspect for identifyingactually-impacted elements.RQ4. (E↵ectiveness) To answer RQ4, we report the re-sults of applying the best similarity measure alternativesfrom RQ2 for ranking the EISs computed by the algorithm ofFigure 8 (i.e., combined structural and behavioral analysis),and then considering only the ranked EIS fractions recom-mended by the guidelines of RQ3. Note that in this RQ, byEIS we mean the fraction obtained after applying the guide-lines of RQ3. In Figure 14, we show for our 16 changes thesize and precision distributions of the recommended EISs.These distributions are provided separately for the best simi-larity alternatives from RQ2, i.e., SoftTFIDF combined with
●
●
●
RES.SoftTFIDF JCN.SoftTFIDF
0.0
0.1
0.2
0.3
0.4
0.5
0.6
0.7
After NLP
Similarity Measure Combincations
Prec
isio
n(%
)
●
●
●
●
RES.SoftTFIDF JCN.SoftTFIDF
010
2030
4050
60
After NLP
Similarity Measure Combincations
EIS
Size
(#)
(b) Precision
Prec
isio
n (%
)0
1020
3040
50
(a) Size
EIS
Size
(#)
010
2030
4050
Soft.RES
607060
Soft.JCN Soft.RES Soft.JCN
Figure 14: Size and precision of EISs that resultfrom the application of the guidelines of RQ3 to theEISs computed by the algorithm of Figure 8.
RES (denoted Soft.RES) and SoftTFIDF combined withJCN (denoted Soft.JCN).The average EIS size is 30.2 for Soft.RES and 18.5 for
Soft.JCN. The average precision for Soft.RES and Soft.JCNare 19.5% and 29.4% respectively. As for recall, Soft.RESyields a recall of 100% for all 16 changes, while Soft.JCNmisses one element for one change. That is, using Soft.JCN,we have a recall of 100% for 15 changes, and a recall of 85%for one change (i.e., an average recall of 99%). The resultsclearly show that Soft.JCN yields better overall accuracy.In summary, after applying our best NLP-based similarity
measure, Soft.JCN, the average precision of our analysis in-creases to 29.4% compared to 16% obtained by the combinedbehavioral and structural analysis (discussed in RQ1). Theaverage recall reduces to 99% compared to 100% obtainedby the combined analysis. Finally, using NLP, the averagenumber of elements to be inspected by the engineers reducesto 18.5 (just 4.8% of the entire design model) compared to38 (9.7% of the design model) before applying NLP.RQ5. (Execution Time) The execution time for bothsteps of our approach, i.e., computing the EISs and rankingthe EISs, was in the order of seconds for the 16 changes.Given the small execution times, we expect our approach toscale to larger systems. Execution times were measured ona laptop with a 2.3 GHz CPU and 8GB of memory.
Validity considerations and threats. Internal and ex-ternal validity are the most relevant dimensions of validityfor our case study. With regard to internal validity, an im-portant consideration is that the change statements mustrepresent the understanding of the engineers about a changebefore the engineers have determined the impact of thatchange; otherwise, the engineers may learn from the anal-ysis they have performed and provide more precise changestatements than when they have not examined the designyet. If this occurs, the accuracy results would not faithfullyrepresent what one can achieve in a non-evaluation setting.In our case study, the change statements were pre-existingand written at the time that the change requests had beenfiled, i.e., before the impact of the changes had been exam-ined. The engineers in our case study were therefore requiredonly to inspect the design and provide the actual impact sets(gold standard). Consequently, learning is not a significantthreat to internal validity. A potential threat to internal va-lidity is that one of the engineers involved in our case studyis a co-author. To minimize potential bias, the engineersinvolved neither used our tool nor saw the results generatedby the tool until they had specified the actual impact sets.With regard to external validity, while our case study is in-

Evaluation
30
370 elements 16 change scenarios

Research Question 1 • How much our behavioral and structural analysis can help in
identifying actually impacted elements?
• The number of elements engineers needed to inspect decreased
• Before applying our approach: 370 elements
• After applying structural analysis: 80/370 (21.6 %)
• After applying behavioral analysis: 36/370 (9.7%)
• We cannot miss any impacted element!
31

Effectiveness of our Approach Fu
tile I
nspe
ction
Effo
rt (%
)
Structural 0
5
10
15
20
25
Distribution over 16 changes

Effectiveness of our Approach
Structural Behavioral
Futil
e Ins
pect
ion Ef
fort
(%)
0
5
10
15
20
25

Research Question 2 • How much improvement does the NLP technique bring about
compared to Structural/Behavioral analysis?
• The number of elements inspected decreases
• Before applying our approach: 370 elements
• After applying structural analysis: 80/370 (21.6 %)
• After applying behavioral analysis: 36/370 (9.7%)
• After applying NLP: 18/370 (4.8%) 34

0
5
10
15
20
25
Effectiveness of our Approach
Structural Behavioral NLP
Futil
e Ins
pect
ion Ef
fort
(%)

0
5
10
15
20
25
Effectiveness of our Approach
Structural Behavioral NLP
1 impacted element missed out of a total of 81 impacted elements.
Futil
e Ins
pect
ion Ef
fort
(%)

Summary • We provided an approach to automatically identify the impact of
requirements changes on system design
• Our approach includes:
• A SysML modeling methodology with acceptable traceability cost
• An algorithm for impact computation that combines models’ structure, behavior and textual information
• Industrial case study: Our hybrid approach reduces the number of elements inspected from 370 to 18
• Scalable approach: A few seconds to compute and rank estimated impacted elements
37

.lusoftware verification & validationVVS
Automated Change Impact Analysis between SysML Models of Requirements and Design
Tool: https://bitbucket.org/carora03/cia_addin
We are hiring!