Embed Size (px)
Citation preview

by RevelOps
How to Correlate Log Data with Business Metrics Like a Jedi
Oct 22nd, 2014

by RevelOpsHousekeeping
• Webinar is being recorded, the archive will be emailed to you
• You can ask questions via the chat pane
• Follow us @Logentries and @HostedGraphite

by RevelOpsMeet the Hosts
Dave ConcannonHosted Graphite CEO & Co-founder
Trevor ParsonsLogentries Co-founder and Chief Scientist

by RevelOpsOutline
• Introduction: Logentries & Hosted Graphite
• Logs and Metrics: Correlation is King!
• What vs. Why
• Collecting data from every layer in your software stack
• Turning Logs into Metrics
• Sending Metrics to Graphite
• Real Time Metrics with Graphite
• Use Case: Application Performance Monitoring w/ Logentries & Hosted Graphite
• Rolling your own Logging and Graphite Solutions: Pros and Cons
• Q & A

by RevelOps
A Heritage in Advanced Research • Founders hold PhDs in Distributed Systems
• Former Scientists at the IBM Center for Advanced Studies
• Built Log Management Solution for IBM (RTCE)
Global SaaS Log Management Service• More than 1,000 customers in over 100 countries, processing over
10B events daily
• Locations in Boston, Dublin, Prague
• Raised more than $11M in venture funding
Trevor Parsons Formerly a scientist at IBM's Center for advanced studies
with a PhD in Computer Science.
Andrew BurtonProven software executive, with over 16 years of experience in start-ups & enterprise companies.
Brendan DillonExperienced software engineering & security
executive, formerly CTO at Adaptive Mobile.
Viliam HolubOver a decade developing enterprise software, with a PhD
in Computer Science.
Leadership Team
Leigh MerriganSaaS marketing, communications and branding
executive, formerly with AppNeta.
President & CEO
Co-founder, Chief Scientist
VP, Engineering
Co-founder, CTO
VP, Marketing
About Logentries

by RevelOpsAbout Hosted Graphite
Charlie Von MetzradtHacker and tinkerer with experience in running very large
metric collection systems
Rob McAdooPhD. Computer science
Dan Fox Ops
Engineer Ex-Amazon ops engineer
Team
Cian SynnottEx-google data wrangler
Co-founder
Years of measuring things in a variety of companies
Co-founder
Engineer
Data Scientist
Dave Concannon
Emmanuel StoneExperienced startup engineer
Engineer
Years of dealing with metric data •Founders worked with high-volume data that measured games, like “Call of Duty”
•Broad experience across many industries and company sizes
SaaS Metrics Service•Hundreds of customers, hundreds of countries, billions of data points daily
•Locations in Dublin and Indiana
•Bootstrapped with blood, sweat, and tears :)
Hugh Nowlan Security Engineer
by RevelOpsLogs & Metrics: Correlation is King

by RevelOpsLogs & Metrics: Correlation is King
Question• What Happened?
Answer• Things got slow!

by RevelOpsLogs & Metrics: Correlation is King
Question• Why?
Answer• Correlation is King!

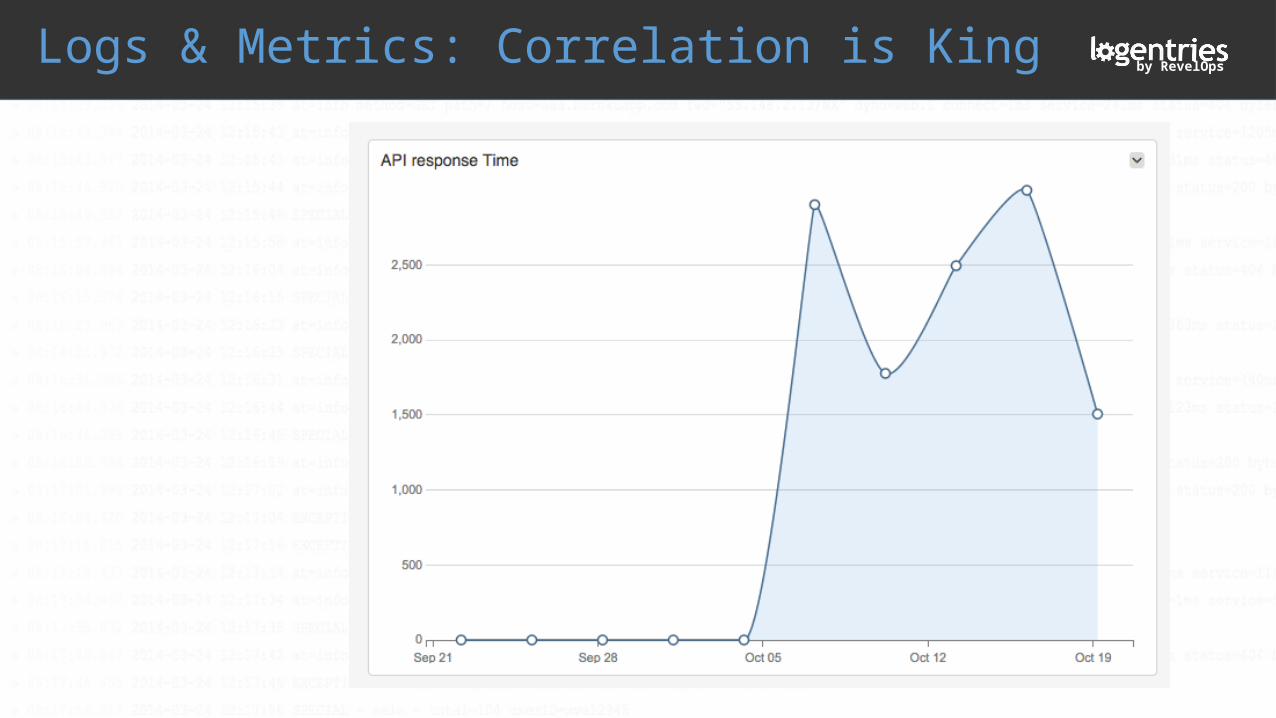
by RevelOpsLogs & Metrics: Correlation is King
• Response Time Increasing AND CPU Load Increasing
by RevelOpsLogs & Metrics: Correlation is King
Data point 1• Number of Users
CPU andResponse Time
Solution • Need more
servers

by RevelOpsLogs & Metrics: Correlation is King
Data point 2• Java Exceptions
CPU andResponse Time
Solution • Fix the Code

Data point 3• Slow Queries
CPU andResponse Time
Solution • Tune the DB
Logs maintain the evidence
by RevelOpsLogs & Metrics: Correlation is King

by RevelOpsData Sources
What you can typically get from logs
• OS Level • Syslog
• Windows Event Logs
• Server Resource Usage
• Middleware:• Web Servers
• App Servers
• Databases
• Message Queues
• Application Logs
• Routers, Firewalls
• APIs:• E.g. Cloudwatch, CloudTrail
• Client Side:• Web Browser• Mobile Apps

by RevelOpsData Sources
What you will typically send to Graphite:
• Server Level:• CPU Load
• Network IO
• Disk IO
• Memory usage
• Application data:• Timing / Measurement of specific functions or
functional areas
• Overall request time and frequency
• How often the out-of-memory killer kills a process
• Security information:• Number of SSH login attempts - failed and
succeeded
• Sensor Data:• Temperature / Pressure / Flow rates• Transmission rates
• APIs:• E.g. Cloudwatch
• Client Side:• Web Browser
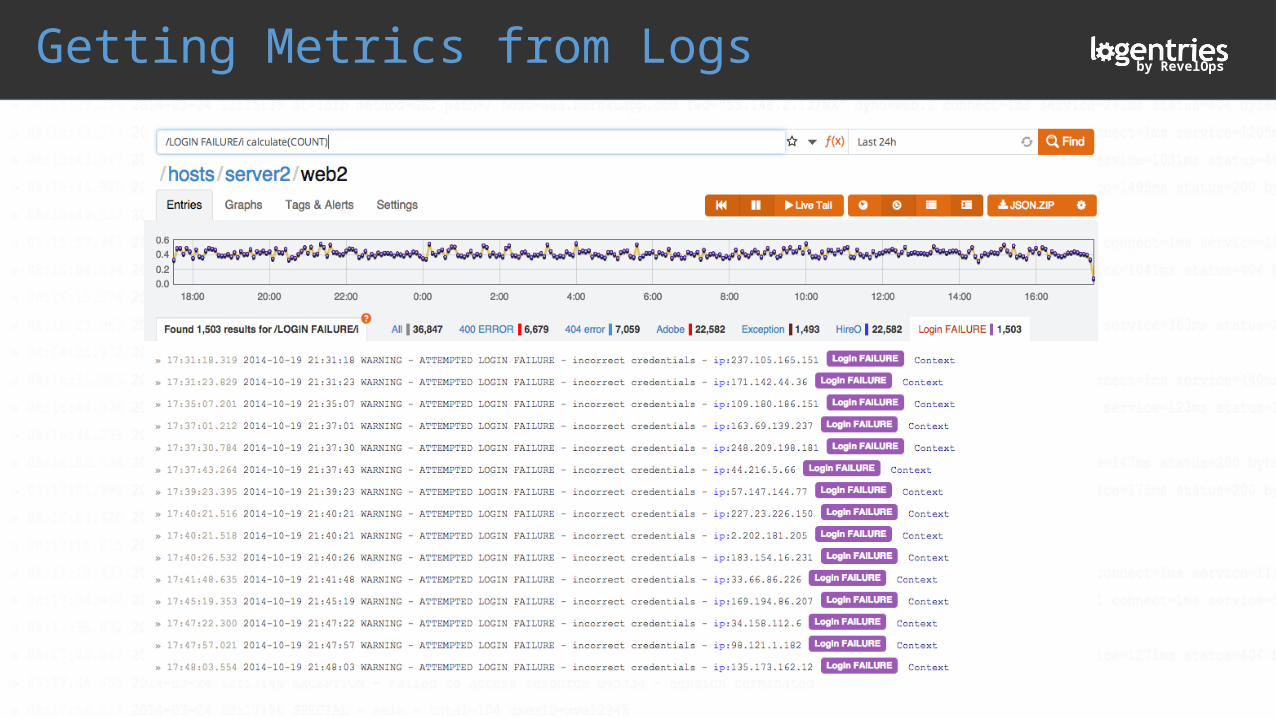
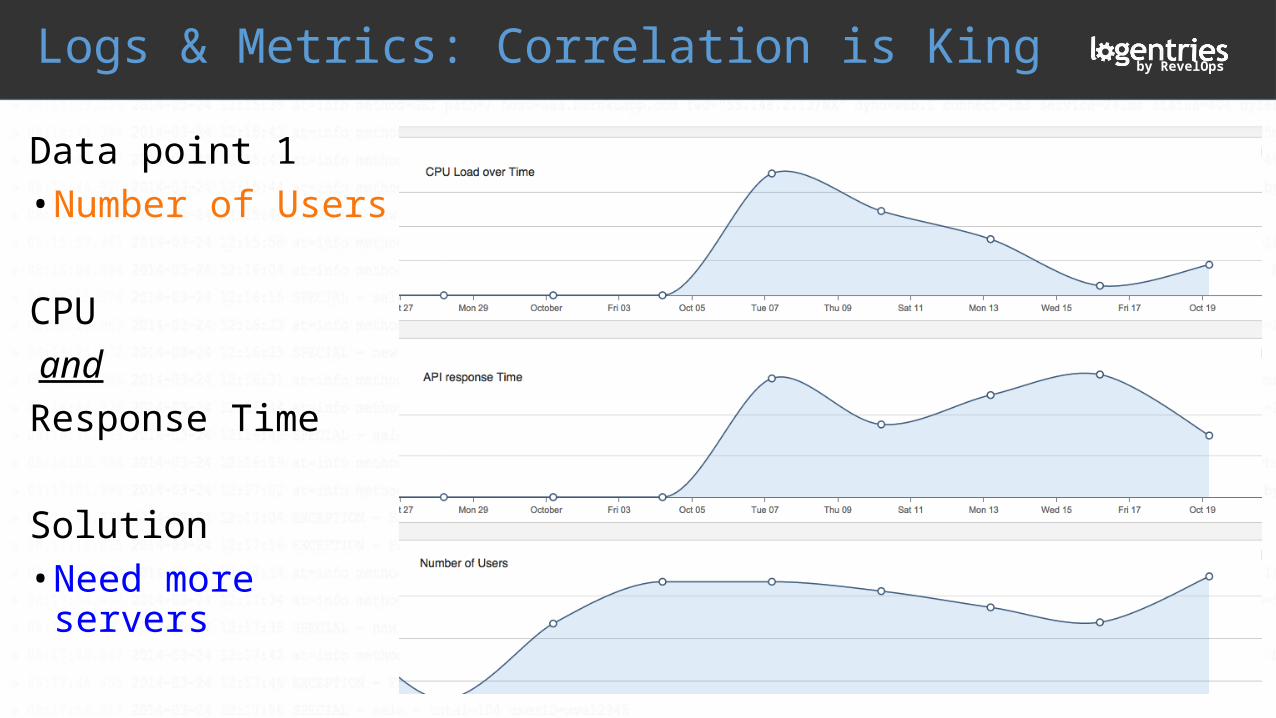
by RevelOpsGetting Metrics from Logs

by RevelOpsGetting Metrics from Logs

by RevelOpsGetting Metrics from Logs

by RevelOpsGetting Metrics from Logs to Hosted Graphite

by RevelOps
How to work with Metrics in Hosted Graphite?
StatsD - Pre-aggregator for metric data• We also provide Hosted StatsD!• Support for counts / gauges / percentile data
Diamond• A useful server agent to collect system data (CPU/Memory/etc)
Aggregating hundreds or thousands of sources into a single metric• Power in percentile data
• 90th percentile as an indicator of general health - Averages lie!• Dig in to specific problems after seeing a quick overview• Avoids “twitchy” monitoring
Data views• Sums / rates / observations, no need to define views beforehand

by RevelOpsTypical Use Case: DevOps Dashboard
Logs Metrics Graphite
OS logs & Server Metrics:• SSH Acccess, • CPU, Mem…
Web Server Logs: • Response time
App Server Logs:• App Exceptions
Client Side Logs:• Response time (client side)• Url & Usage tracking

by RevelOps
Metrics Graphite
Application Metrics:• Code Latency• Query Time to DB• Throughput
Diamond:• Collectors… Hadoop, Mongo, Kafka, MySQL,
NetApp, RabbitMQ, Redis, AWS S3…• Check out:
https://github.com/BrightcoveOS/Diamond/wiki/Collectors
Typical Use Case: DevOps Dashboard

by RevelOpsTypical Use Case: DevOps Dashboard
Some questions you can answer:
Application Performance Monitoring:• Is User experience ok?
• Client side response time• HTTP 404s/500s? • Query time
Server Capacity:• CPU vs user load
Security: • Failed Logins vs. unusual system behavior

by RevelOpsRolling your own Logging/Metrics
Great open source tools e.g. Logstash & Graphite
•They are free…• No license/monthly billing etc.
•They are not free…• 250 GB per day, 8 servers on AWS, ~$4k per month • Maintenance, few hours per week, especially when you have a clustered server environment• Downtime can occur as volumes grow, if no autoscaling in place• Log volumes ALWAYS grow…
•Some more reading:• https://blog.logentries.com/2014/09/the-pros-and-cons-of-open-source-logging/

by RevelOpsGive it a Try for Free
• Get started in minutes with the free Logentries service!• https://logentries.com/quick-start
• Free 14 Day trial of Hosted Graphite• https://www.hostedgraphite.com/accounts/register/
• Logentries & Hosted Graphite: https://blog.logentries.com/2014/10/connecting-logs-and-metrics-logentries-and-hosted-graphite/
• Contact us directly! • [email protected]• [email protected]• [email protected], [email protected]
• Let’s take a few questions!

by RevelOps
Oct 2014