Embed Size (px)
Citation preview
Chapter 5
Case Study: Big Data System
Outline
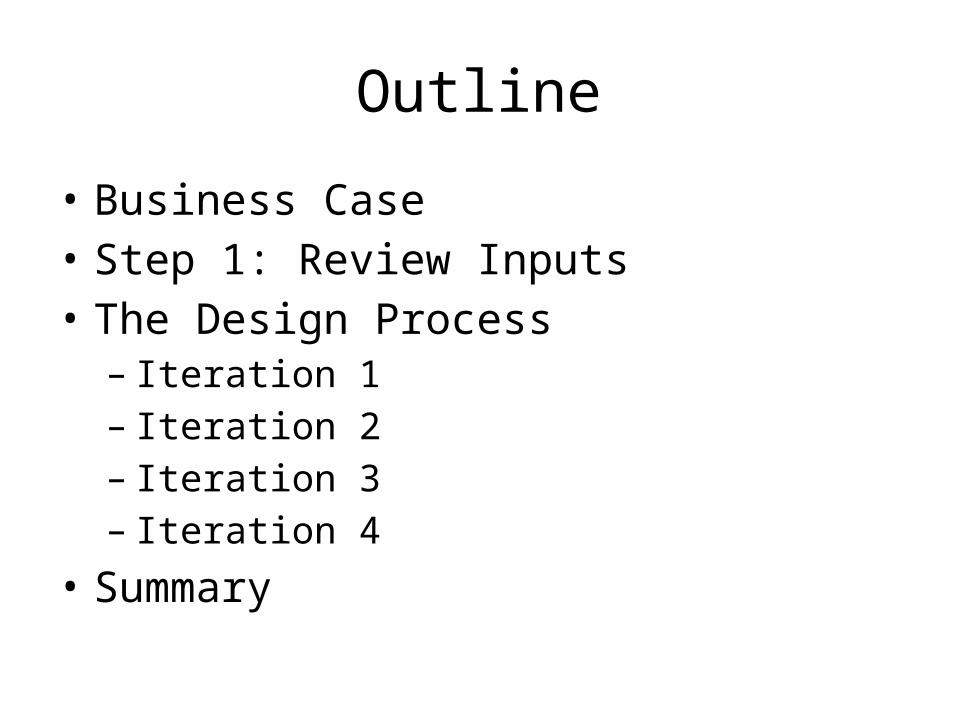
• Business Case• Step 1: Review Inputs• The Design Process– Iteration 1– Iteration 2– Iteration 3– Iteration 4
• Summary
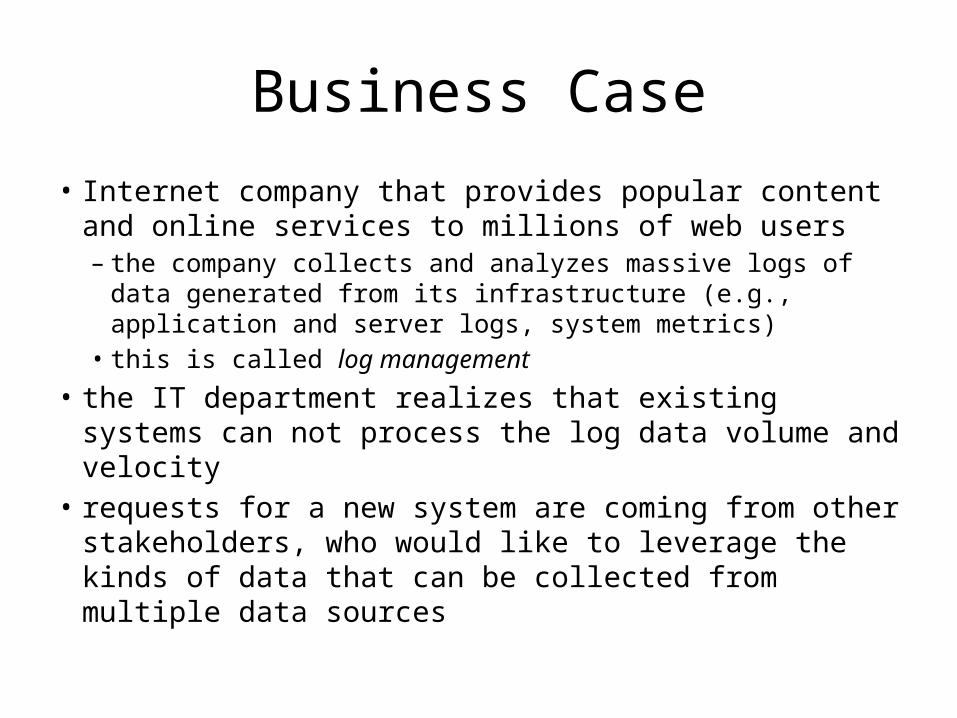
Business Case• Internet company that provides popular content and
online services to millions of web users – the company collects and analyzes massive logs of data
generated from its infrastructure (e.g., application and server logs, system metrics)
• this is called log management• the IT department realizes that existing systems can not
process the log data volume and velocity • requests for a new system are coming from other
stakeholders, who would like to leverage the kinds of data that can be collected from multiple data sources
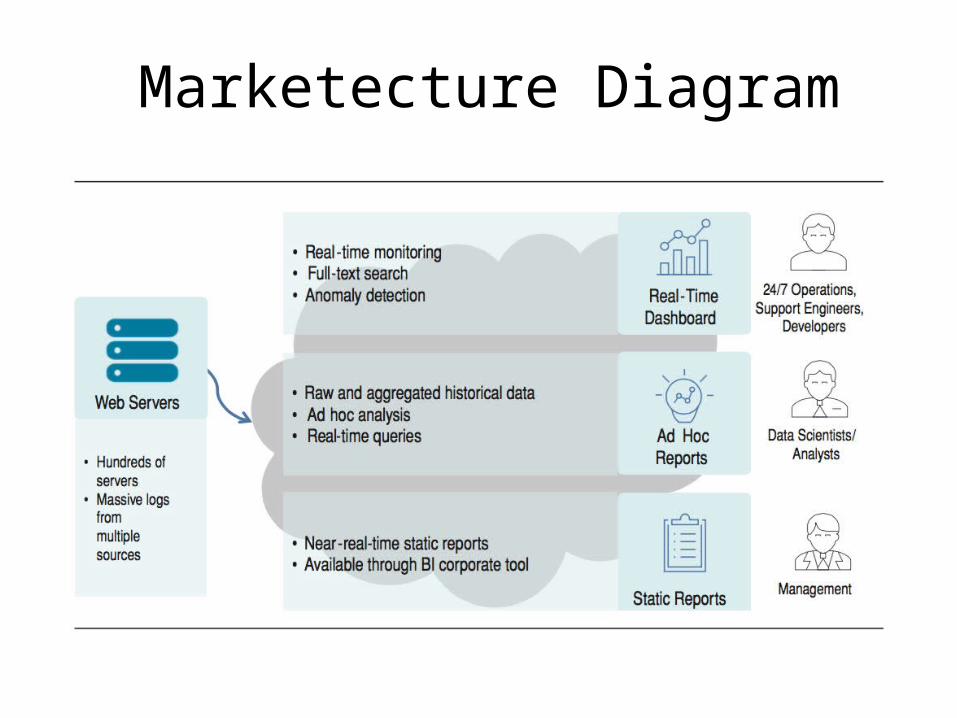
Marketecture Diagram
Step 1: Review Inputs
• Design Purpose– This is a greenfield system from a mature domain.
The purpose is to produce a sufficiently detailed design to support the construction of the system.
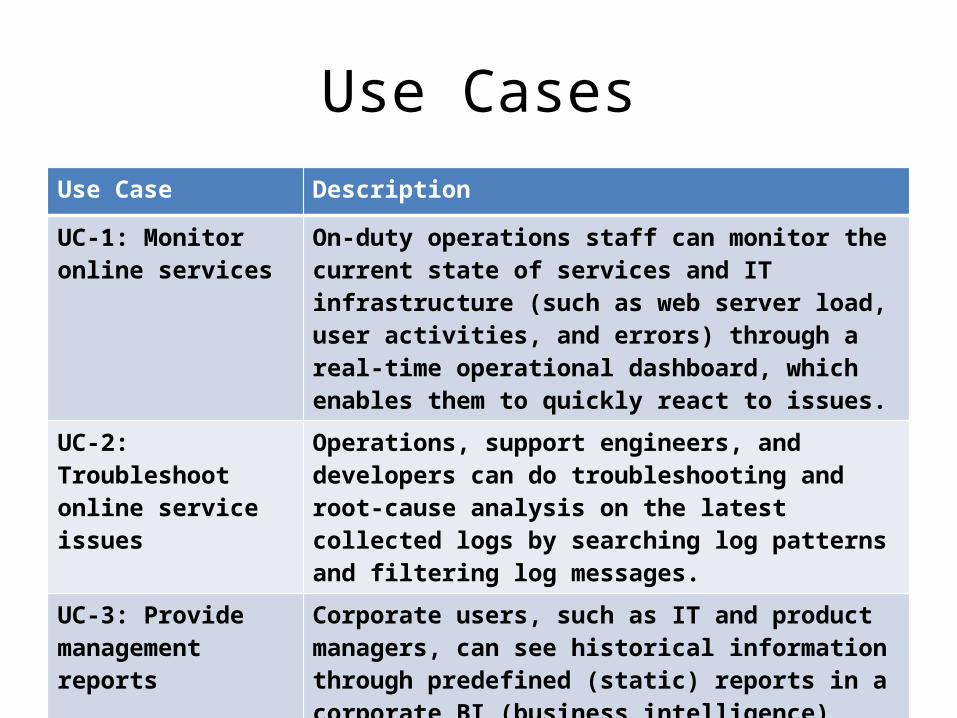
Use CasesUse Case Description
UC-1: Monitor online services
On-duty operations staff can monitor the current state of services and IT infrastructure (such as web server load, user activities, and errors) through a real-time operational dashboard, which enables them to quickly react to issues.
UC-2: Troubleshoot online service issues
Operations, support engineers, and developers can do troubleshooting and root-cause analysis on the latest collected logs by searching log patterns and filtering log messages.
UC-3: Provide management reports
Corporate users, such as IT and product managers, can see historical information through predefined (static) reports in a corporate BI (business intelligence) tool, such as those showing system load over time, product usage, service level agreement (SLA) violations, and quality of releases.
Use CasesUse Case Description
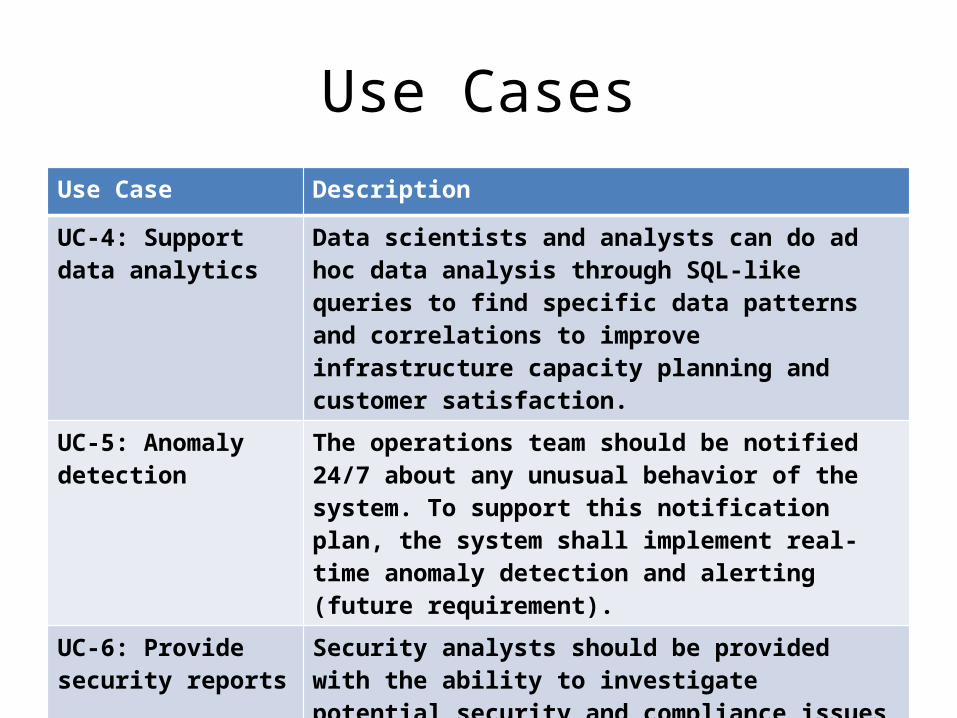
UC-4: Support data analytics
Data scientists and analysts can do ad hoc data analysis through SQL-like queries to find specific data patterns and correlations to improve infrastructure capacity planning and customer satisfaction.
UC-5: Anomaly detection
The operations team should be notified 24/7 about any unusual behavior of the system. To support this notification plan, the system shall implement real-time anomaly detection and alerting (future requirement).
UC-6: Provide security reports
Security analysts should be provided with the ability to investigate potential security and compliance issues by exploring audit log entries that include destination and source addresses, a time stamp, and user login information (future requirement).
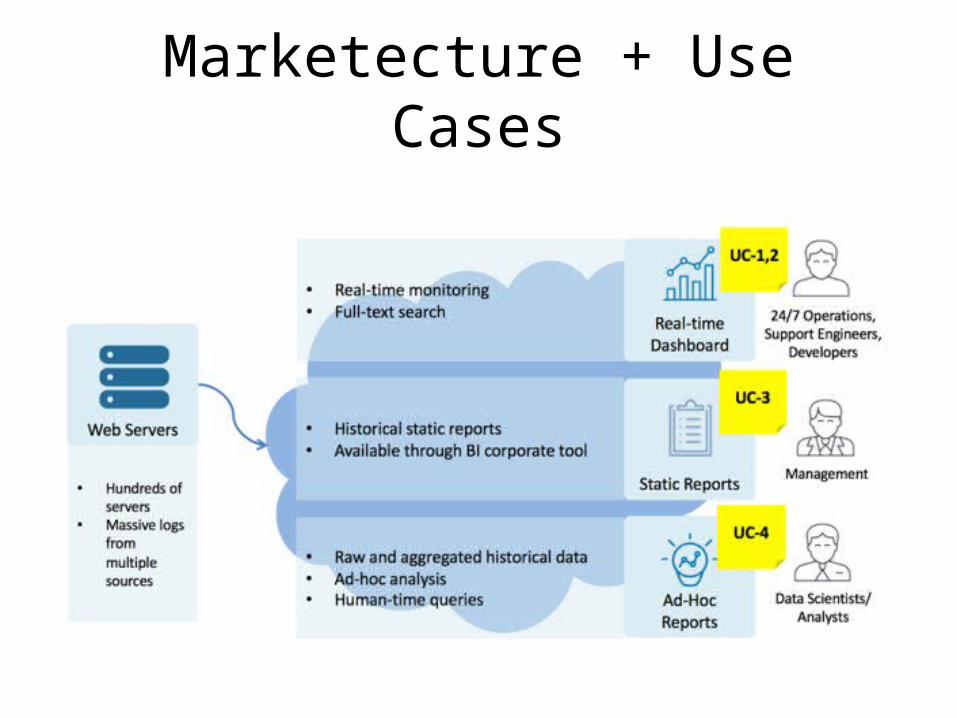
Marketecture + Use Cases
Quality Attribute ScenariosID Quality
AttributeScenario Associated
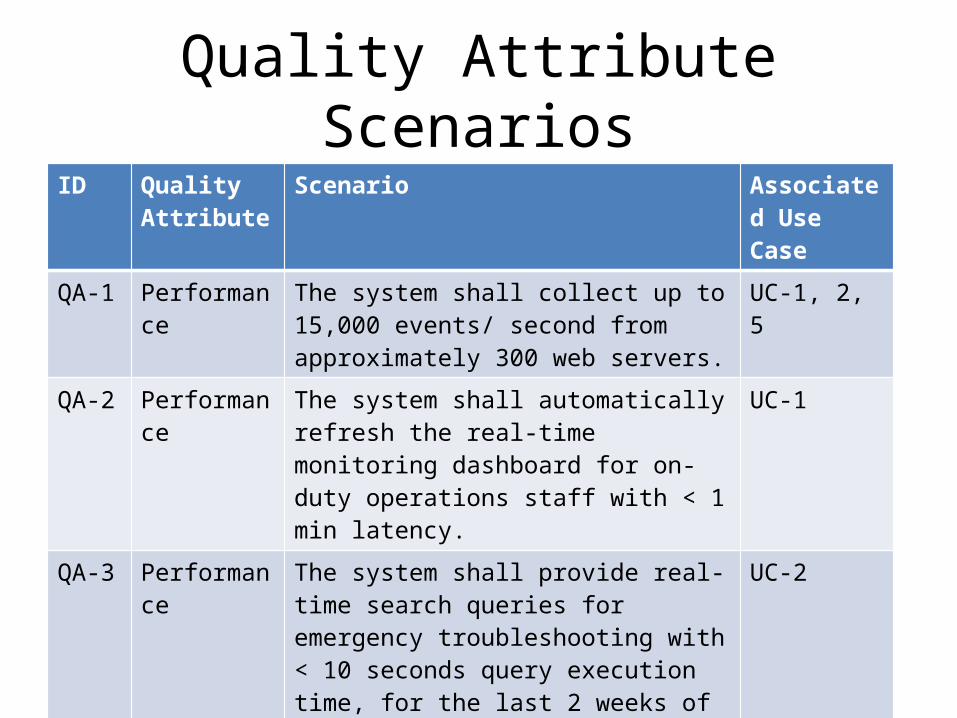
Use CaseQA-1 Performance The system shall collect up to 15,000 events/
second from approximately 300 web servers. UC-1, 2, 5
QA-2 Performance The system shall automatically refresh the real-time monitoring dashboard for on-duty operations staff with < 1 min latency.
UC-1
QA-3 Performance The system shall provide real-time search queries for emergency troubleshooting with < 10 seconds query execution time, for the last 2 weeks of data.
UC-2
QA-4 Performance The system shall provide near-real-time static reports with per-minute aggregation for business users with < 15 min latency, < 5 seconds report load.
UC-3, 6
Quality Attribute ScenariosID Quality
AttributeScenario Associated
Use Case
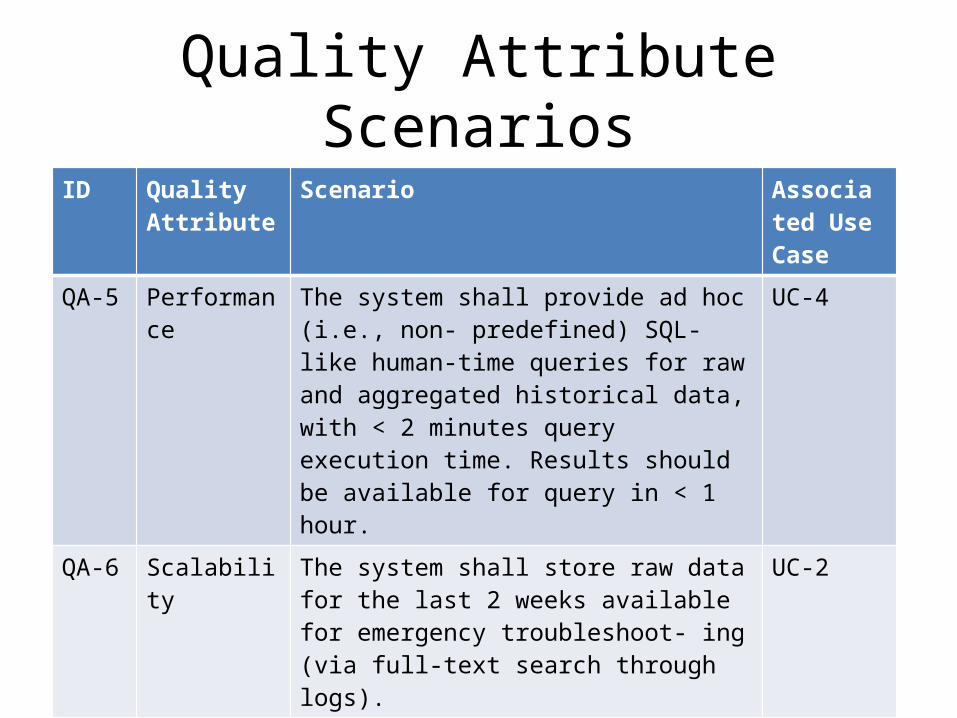
QA-5 Performance The system shall provide ad hoc (i.e., non- predefined) SQL-like human-time queries for raw and aggregated historical data, with < 2 minutes query execution time. Results should be available for query in < 1 hour.
UC-4
QA-6 Scalability The system shall store raw data for the last 2 weeks available for emergency troubleshoot- ing (via full-text search through logs).
UC-2
QA-7 Scalability The system shall store raw data for the last 60 days (approximately 1 TB of raw data per day, approximately 60 TB in total).
UC-4
Quality Attribute ScenariosID Quality
AttributeScenario Associated
Use Case
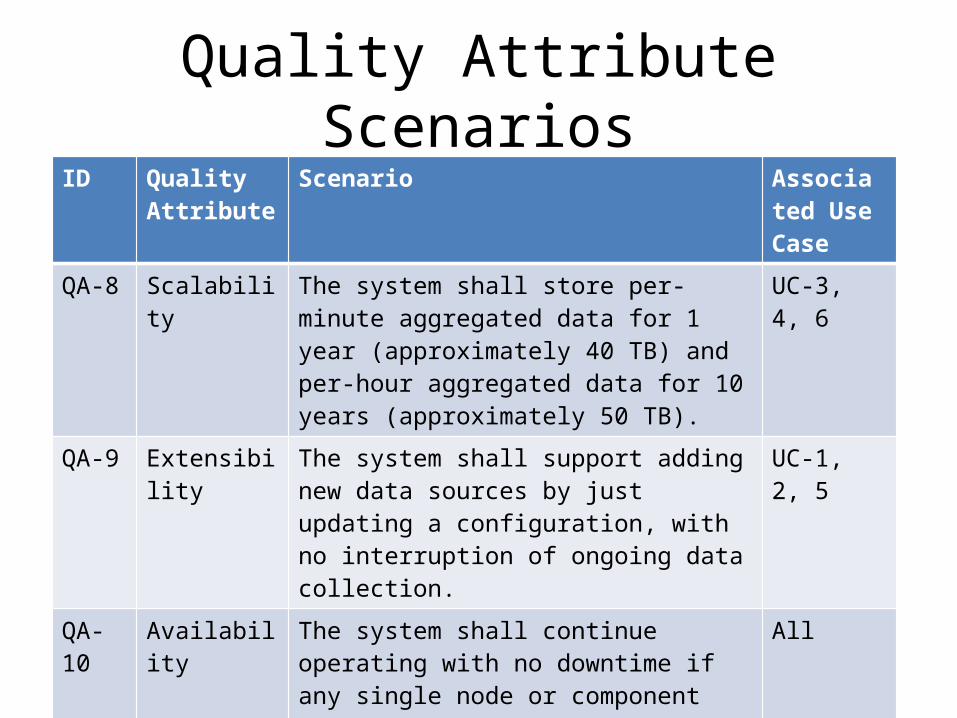
QA-8 Scalability The system shall store per-minute aggregated data for 1 year (approximately 40 TB) and per-hour aggregated data for 10 years (approximately 50 TB).
UC-3, 4, 6
QA-9 Extensibility The system shall support adding new data sources by just updating a configuration, with no interruption of ongoing data collection.
UC-1, 2, 5
QA-10 Availability The system shall continue operating with no downtime if any single node or component fails.
All
QA-11 Deployability The system deployment procedure shall be fully automated and support a number of environments: development, test, and production
All
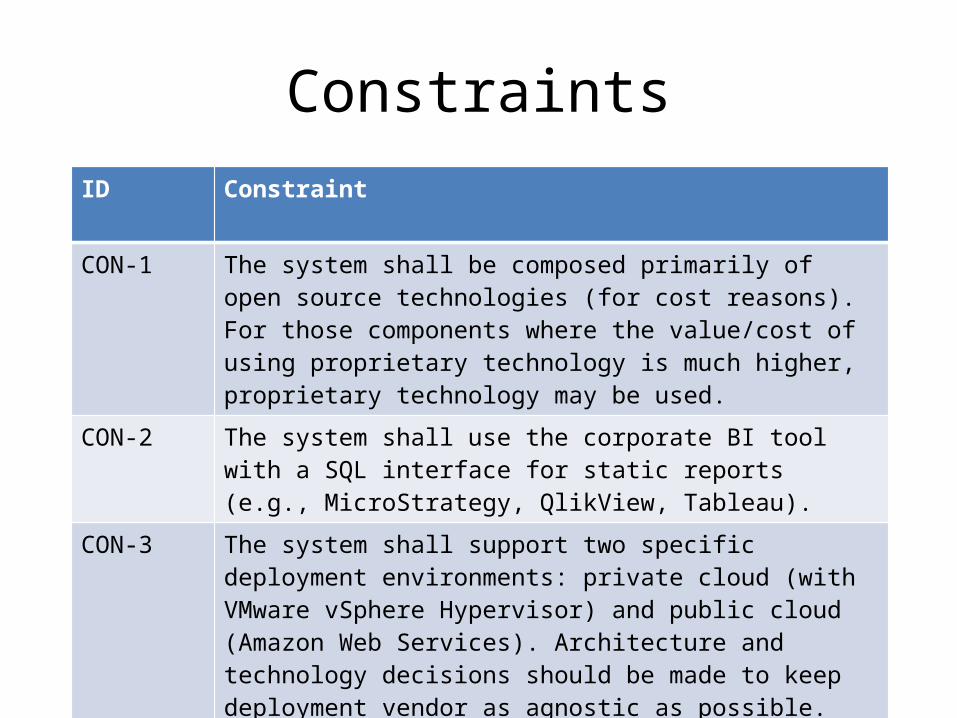
ConstraintsID Constraint
CON-1 The system shall be composed primarily of open source technologies (for cost reasons). For those components where the value/cost of using proprietary technology is much higher, proprietary technology may be used.
CON-2 The system shall use the corporate BI tool with a SQL interface for static reports (e.g., MicroStrategy, QlikView, Tableau).
CON-3 The system shall support two specific deployment environments: private cloud (with VMware vSphere Hypervisor) and public cloud (Amazon Web Services). Architecture and technology decisions should be made to keep deployment vendor as agnostic as possible.
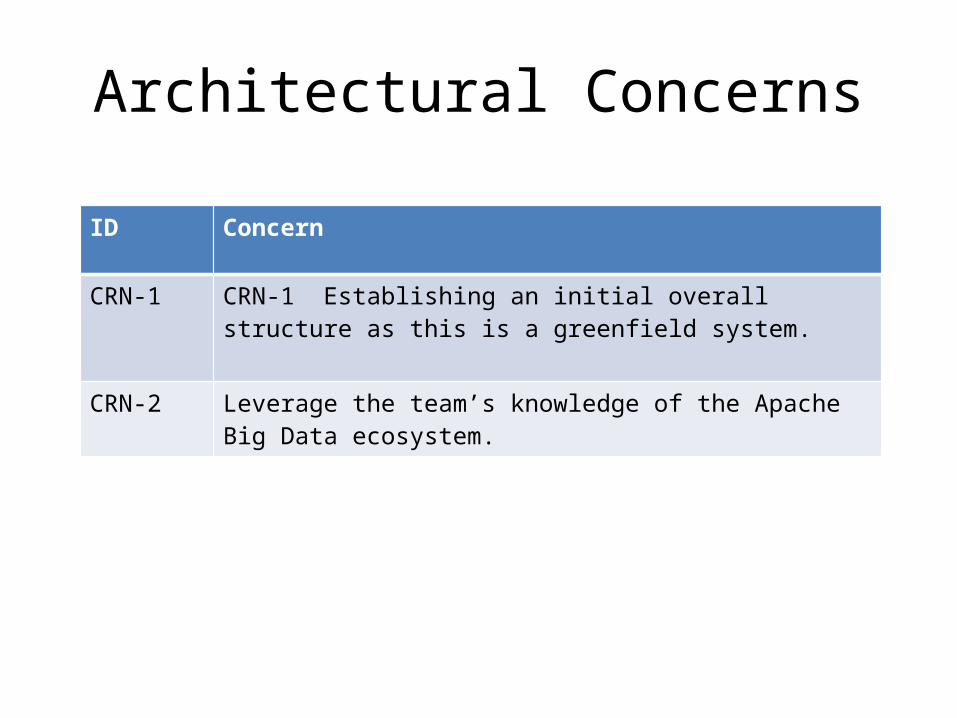
Architectural Concerns
ID Concern
CRN-1 CRN-1 Establishing an initial overall structure as this is a greenfield system.
CRN-2 Leverage the team’s knowledge of the Apache Big Data ecosystem.
Iteration 1
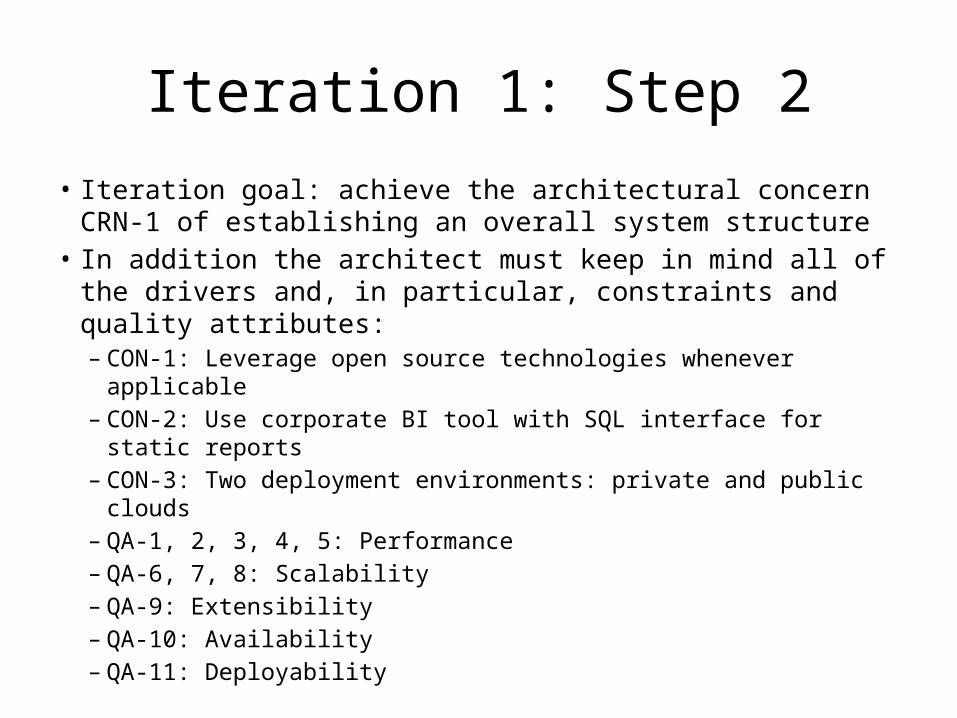
Iteration 1: Step 2• Iteration goal: achieve the architectural concern CRN-1 of
establishing an overall system structure• In addition the architect must keep in mind all of the drivers
and, in particular, constraints and quality attributes: – CON-1: Leverage open source technologies whenever applicable– CON-2: Use corporate BI tool with SQL interface for static reports – CON-3: Two deployment environments: private and public clouds– QA-1, 2, 3, 4, 5: Performance– QA-6, 7, 8: Scalability– QA-9: Extensibility– QA-10: Availability– QA-11: Deployability
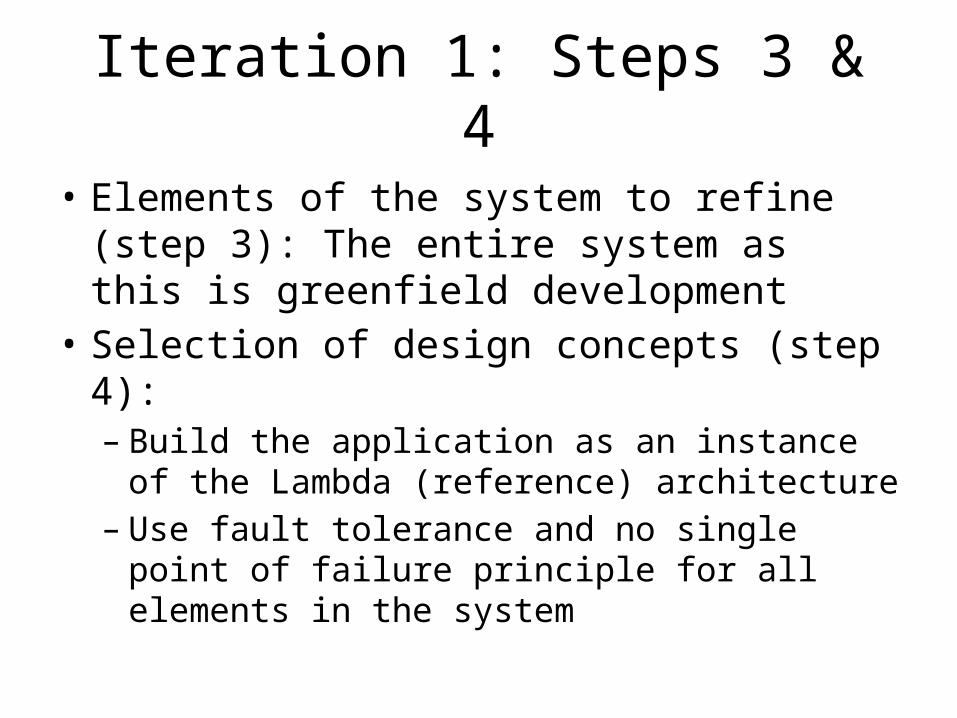
Iteration 1: Steps 3 & 4
• Elements of the system to refine (step 3): The entire system as this is greenfield development
• Selection of design concepts (step 4):– Build the application as an instance of the Lambda
(reference) architecture – Use fault tolerance and no single point of failure
principle for all elements in the system
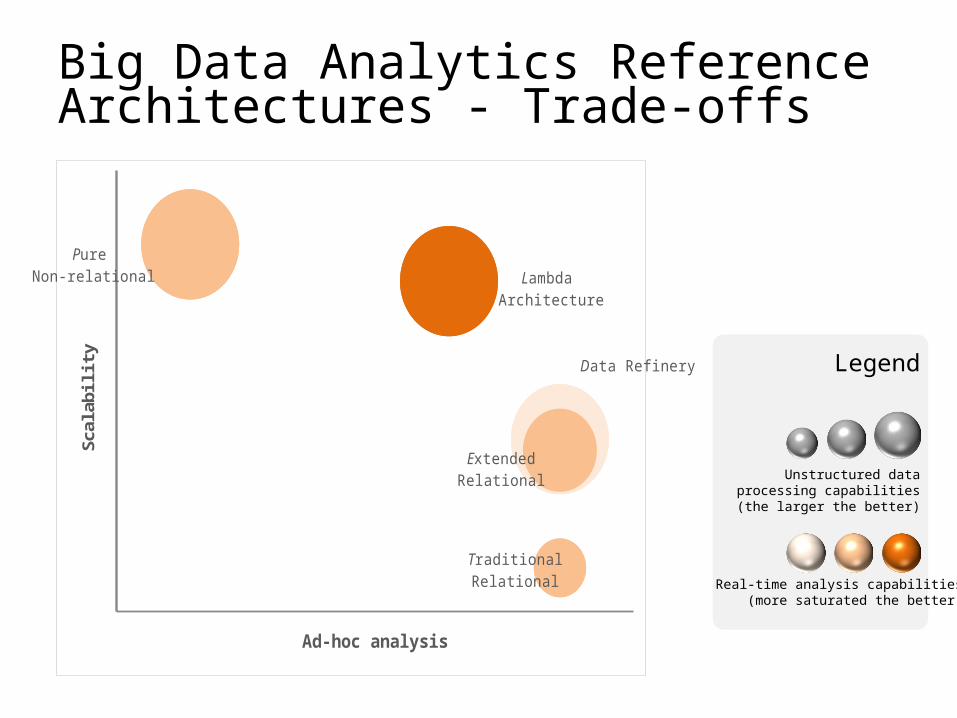
Big Data Analytics Reference Architectures - Trade-offs
Data Refinery
ExtendedRelational
Pure Non-relational
TraditionalRelational
Lambda Architecture
Ad-hoc analysis
Scal
abili
ty Legend
Unstructured data processing capabilities (the larger the better)
Real-time analysis capabilities(more saturated the better)
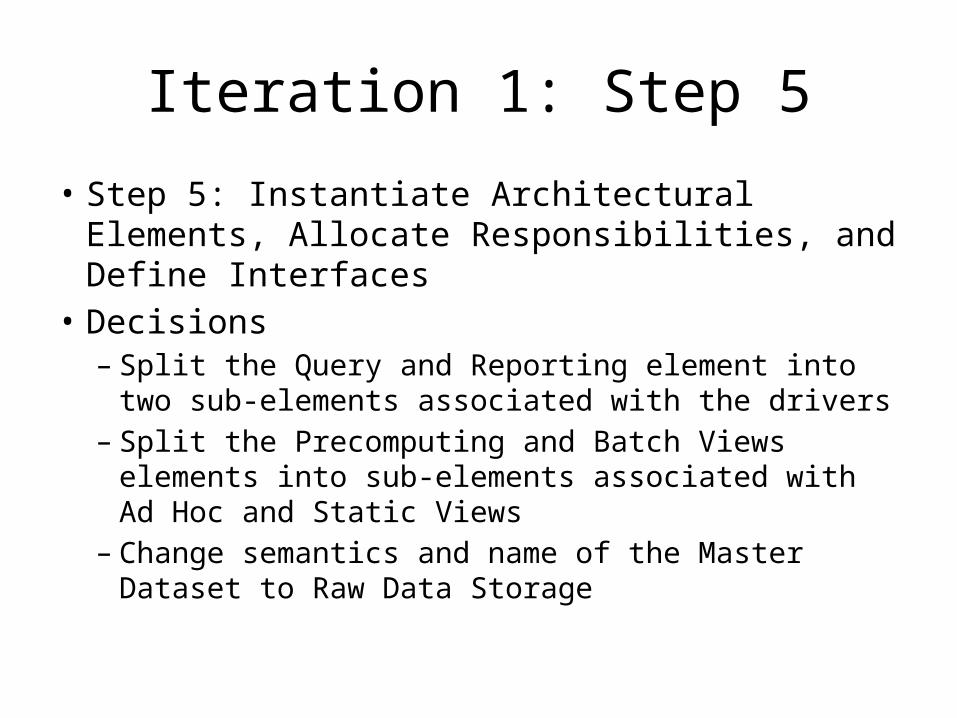
Iteration 1: Step 5
• Step 5: Instantiate Architectural Elements, Allocate Responsibilities, and Define Interfaces
• Decisions– Split the Query and Reporting element into two sub-
elements associated with the drivers – Split the Precomputing and Batch Views elements into
sub-elements associated with Ad Hoc and Static Views – Change semantics and name of the Master Dataset to
Raw Data Storage
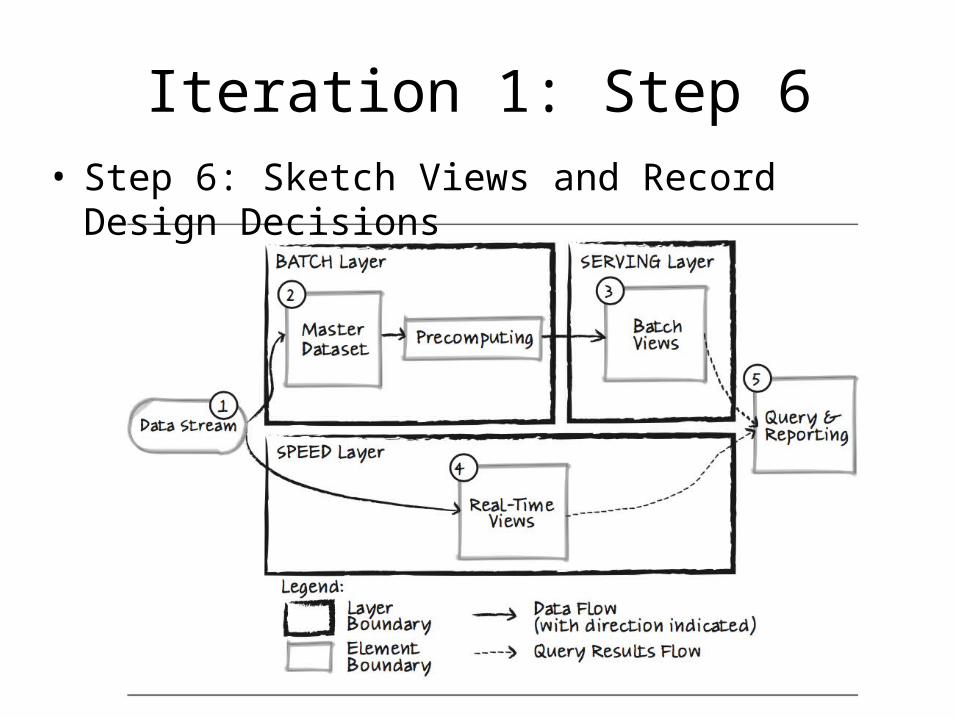
Iteration 1: Step 6• Step 6: Sketch Views and Record Design Decisions
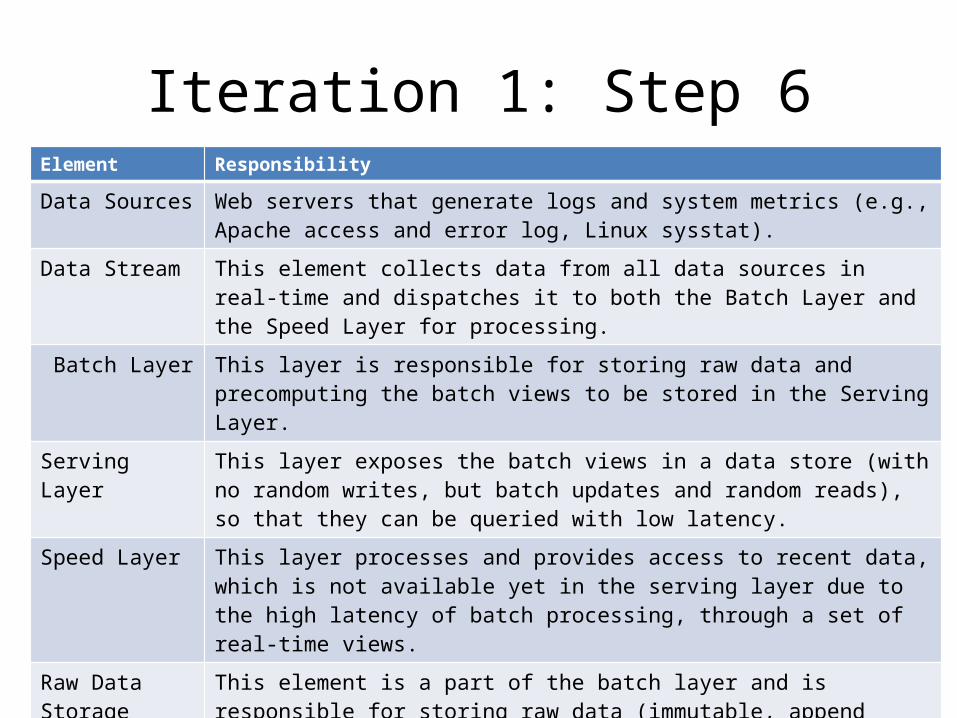
Iteration 1: Step 6Element Responsibility
Data Sources Web servers that generate logs and system metrics (e.g., Apache access and error log, Linux sysstat).
Data Stream This element collects data from all data sources in real-time and dispatches it to both the Batch Layer and the Speed Layer for processing.
Batch Layer This layer is responsible for storing raw data and precomputing the batch views to be stored in the Serving Layer.
Serving Layer This layer exposes the batch views in a data store (with no random writes, but batch updates and random reads), so that they can be queried with low latency.
Speed Layer This layer processes and provides access to recent data, which is not available yet in the serving layer due to the high latency of batch processing, through a set of real-time views.
Raw Data Storage This element is a part of the batch layer and is responsible for storing raw data (immutable, append only) for a specified period of time (QA-7).
Ad Hoc Views Precomputing
This element is a part of the Batch Layer and is responsible for precomputing the Ad Hoc Batch Views. The precomputing represents batch operations over raw data that transform it to a state suitable for fast human-time querying.
Iteration 1: Step 6Element Responsibility
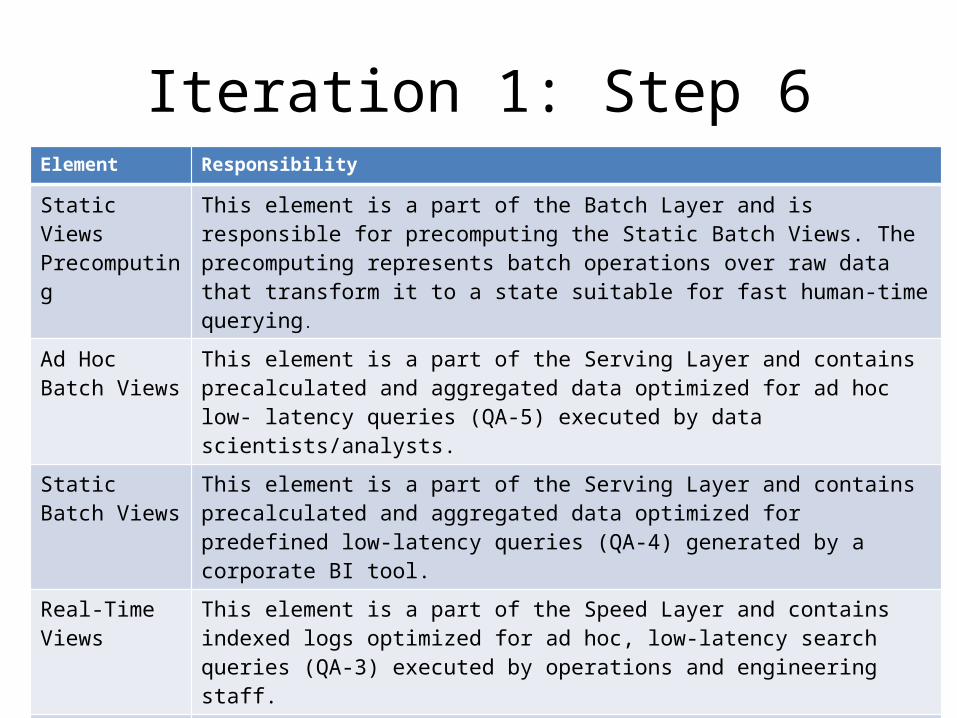
Static Views Precomputing
This element is a part of the Batch Layer and is responsible for precomputing the Static Batch Views. The precomputing represents batch operations over raw data that transform it to a state suitable for fast human-time querying.
Ad Hoc Batch Views
This element is a part of the Serving Layer and contains precalculated and aggregated data optimized for ad hoc low- latency queries (QA-5) executed by data scientists/analysts.
Static Batch Views
This element is a part of the Serving Layer and contains precalculated and aggregated data optimized for predefined low-latency queries (QA-4) generated by a corporate BI tool.
Real-Time Views
This element is a part of the Speed Layer and contains indexed logs optimized for ad hoc, low-latency search queries (QA-3) executed by operations and engineering staff.
Corporate BI Tool
This business intelligence tool is licensed to be used across different departments. The tool supports a SQL interface (such as ODBC or JDBC) and can be connected to multiple data sources, including this system (UC-3, UC-4, CON-2).
Dashboard/Visualization Tool
The operations team uses this real-time operational dashboard to monitor online services, search for important messages in logs, and quickly react to potential issues (UC-1, UC-2).
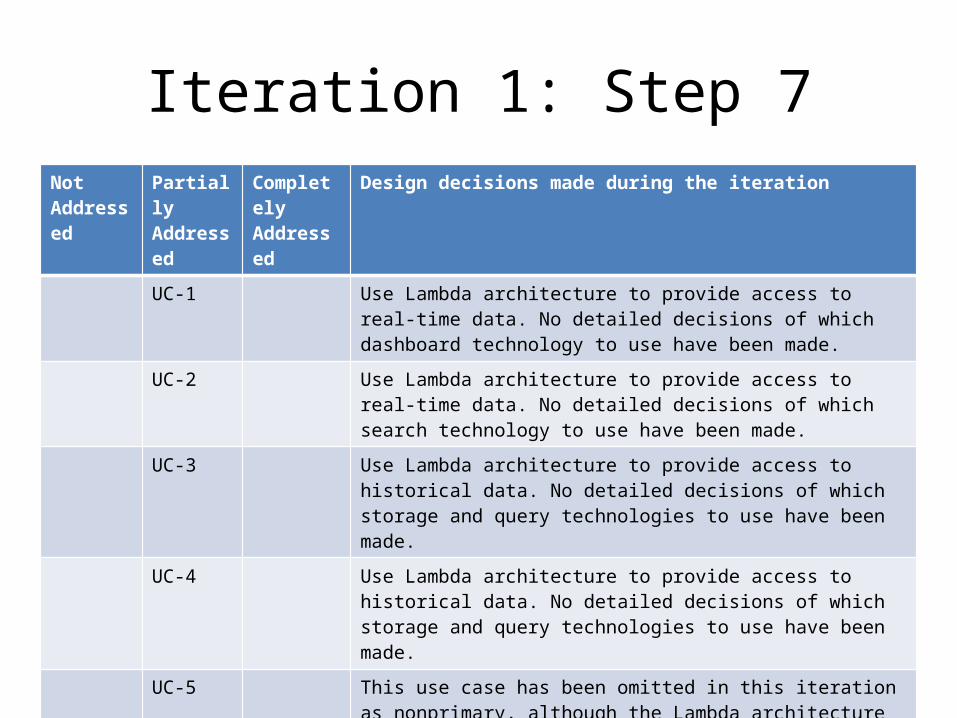
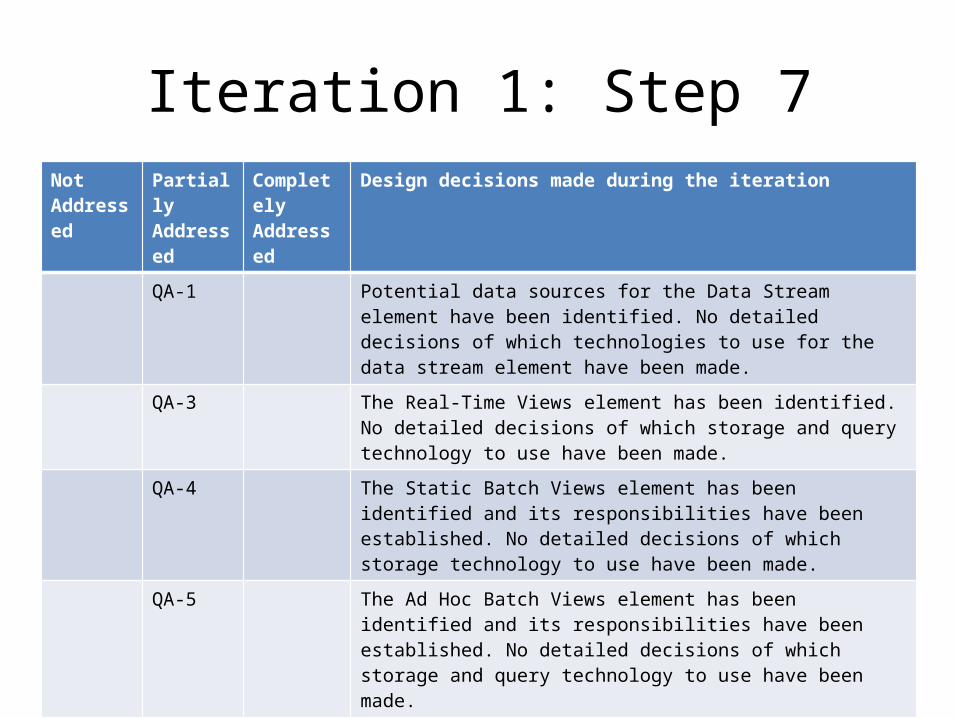
Iteration 1: Step 7Not Addressed
Partially Addressed
Completely Addressed
Design decisions made during the iteration
UC-1 Use Lambda architecture to provide access to real-time data. No detailed decisions of which dashboard technology to use have been made.
UC-2 Use Lambda architecture to provide access to real-time data. No detailed decisions of which search technology to use have been made.
UC-3 Use Lambda architecture to provide access to historical data. No detailed decisions of which storage and query technologies to use have been made.
UC-4 Use Lambda architecture to provide access to historical data. No detailed decisions of which storage and query technologies to use have been made.
UC-5 This use case has been omitted in this iteration as nonprimary, although the Lambda architecture supports it and we will address it in subsequent iterations.
UC-6 This use case has been omitted in this iteration as nonprimary, although from an architectural standpoint it is similar to UC-3.
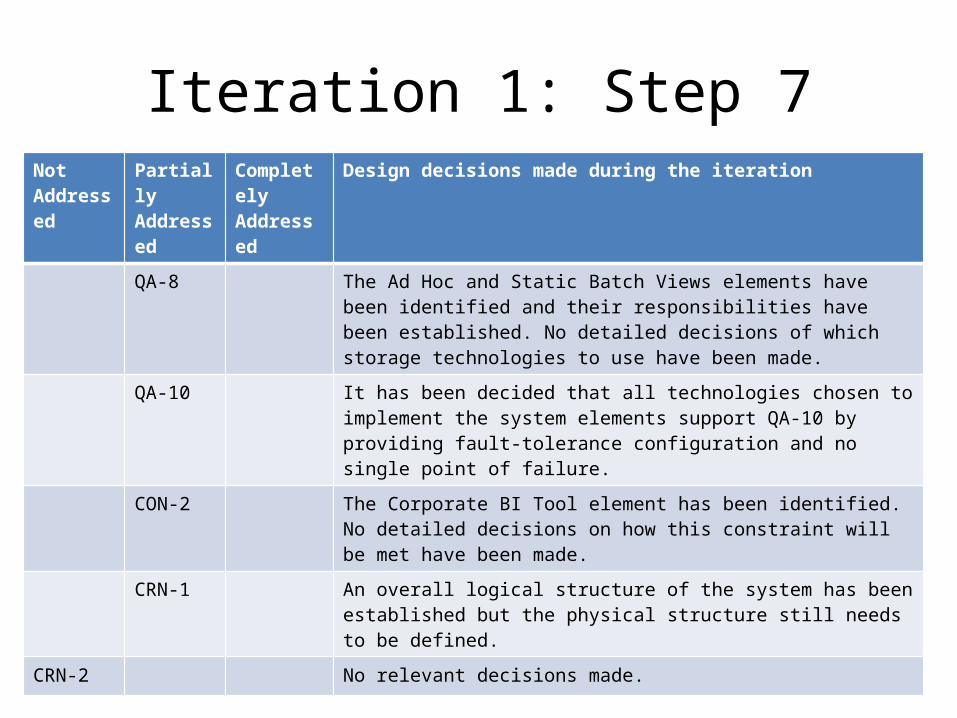
Iteration 1: Step 7Not Addressed
Partially Addressed
Completely Addressed
Design decisions made during the iteration
QA-1 Potential data sources for the Data Stream element have been identified. No detailed decisions of which technologies to use for the data stream element have been made.
QA-3 The Real-Time Views element has been identified. No detailed decisions of which storage and query technology to use have been made.
QA-4 The Static Batch Views element has been identified and its responsibilities have been established. No detailed decisions of which storage technology to use have been made.
QA-5 The Ad Hoc Batch Views element has been identified and its responsibilities have been established. No detailed decisions of which storage and query technology to use have been made.
QA-6 The Real-Time Views element’s responsibilities have been established. No detailed decisions of which storage and query technology to use have been made.
QA-7 The Raw Data Storage element has been identified and its responsibilities have been established. No detailed decisions of which storage technology to use have been made.
Iteration 1: Step 7Not Addressed
Partially Addressed
Completely Addressed
Design decisions made during the iteration
QA-8 The Ad Hoc and Static Batch Views elements have been identified and their responsibilities have been established. No detailed decisions of which storage technologies to use have been made.
QA-10 It has been decided that all technologies chosen to implement the system elements support QA-10 by providing fault-tolerance configuration and no single point of failure.
CON-2 The Corporate BI Tool element has been identified. No detailed decisions on how this constraint will be met have been made.
CRN-1 An overall logical structure of the system has been established but the physical structure still needs to be defined.
CRN-2 No relevant decisions made.
Iteration 2
Iteration 2: Step 2
• Iteration goal:– The goal of this iteration is to address CRN-2
(leverage the team’s knowledge of the Apache Big Data ecosystem) by selecting technologies.
– Need to particularly keep in mind CON-1 (favor open source technologies).
Iteration 2: Steps 3 & 4
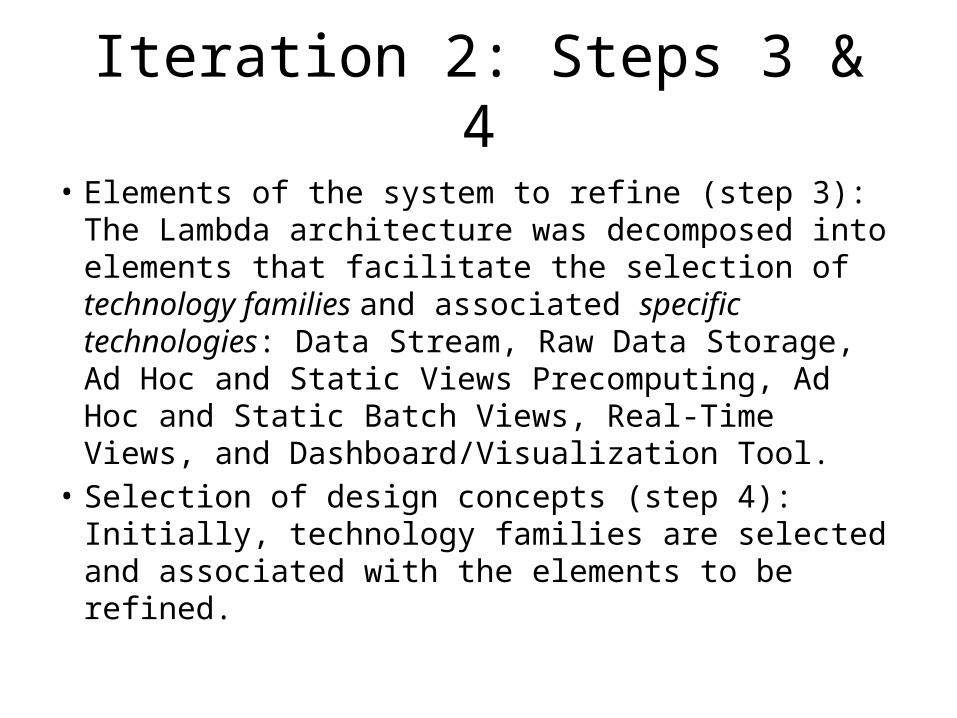
• Elements of the system to refine (step 3): The Lambda architecture was decomposed into elements that facilitate the selection of technology families and associated specific technologies: Data Stream, Raw Data Storage, Ad Hoc and Static Views Precomputing, Ad Hoc and Static Batch Views, Real-Time Views, and Dashboard/Visualization Tool.
• Selection of design concepts (step 4): Initially, technology families are selected and associated with the elements to be refined.
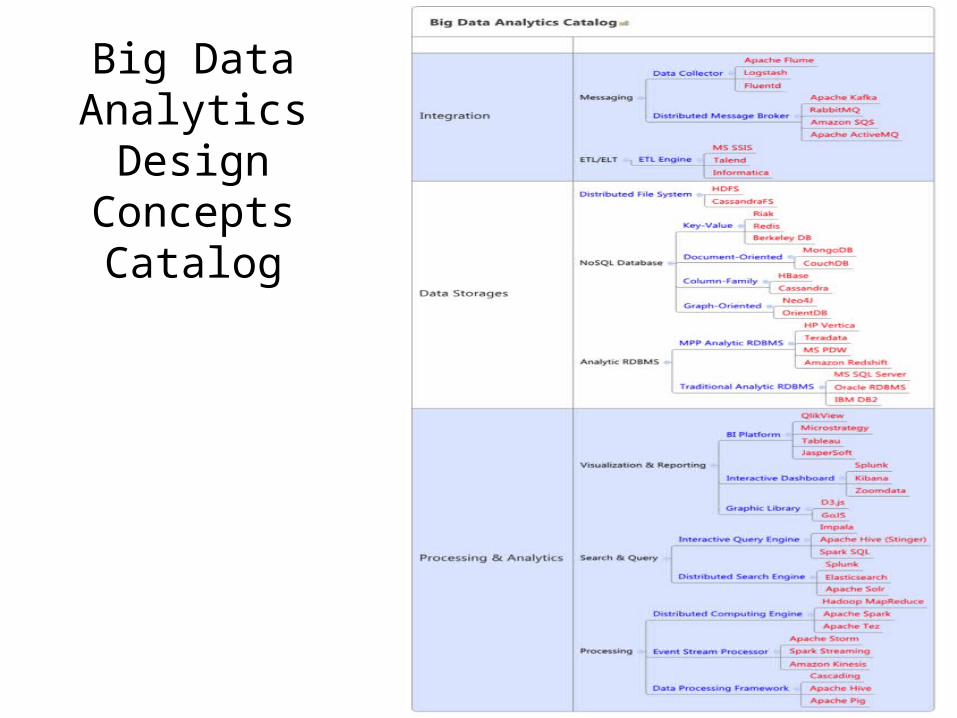
Big Data Analytics Design Concepts
Catalog
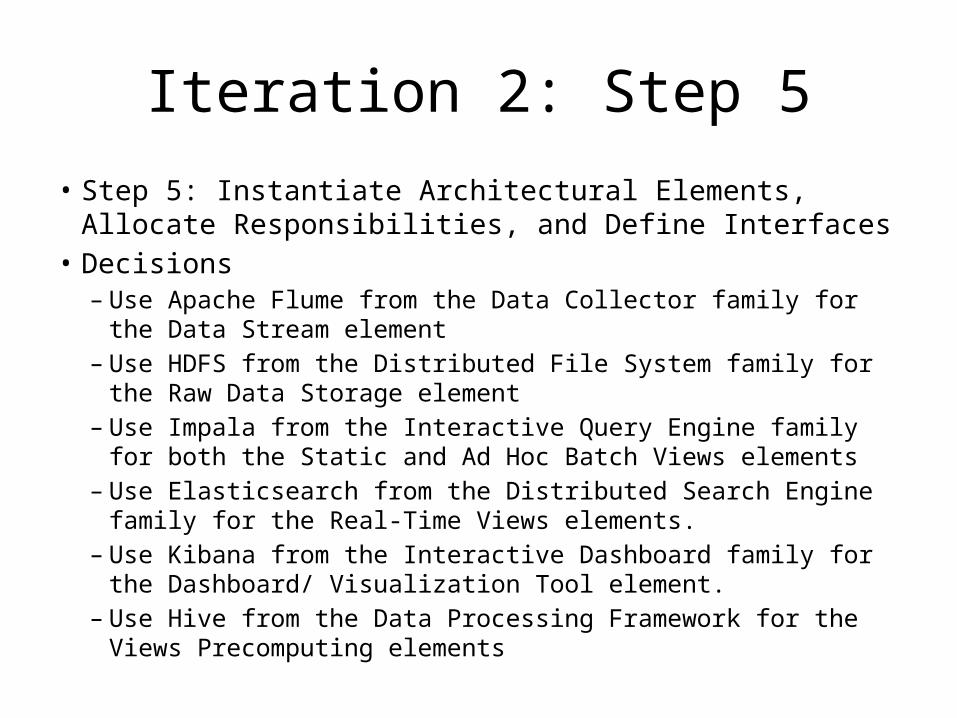
Iteration 2: Step 5• Step 5: Instantiate Architectural Elements, Allocate Responsibilities,
and Define Interfaces• Decisions
– Use Apache Flume from the Data Collector family for the Data Stream element
– Use HDFS from the Distributed File System family for the Raw Data Storage element
– Use Impala from the Interactive Query Engine family for both the Static and Ad Hoc Batch Views elements
– Use Elasticsearch from the Distributed Search Engine family for the Real-Time Views elements.
– Use Kibana from the Interactive Dashboard family for the Dashboard/ Visualization Tool element.
– Use Hive from the Data Processing Framework for the Views Precomputing elements
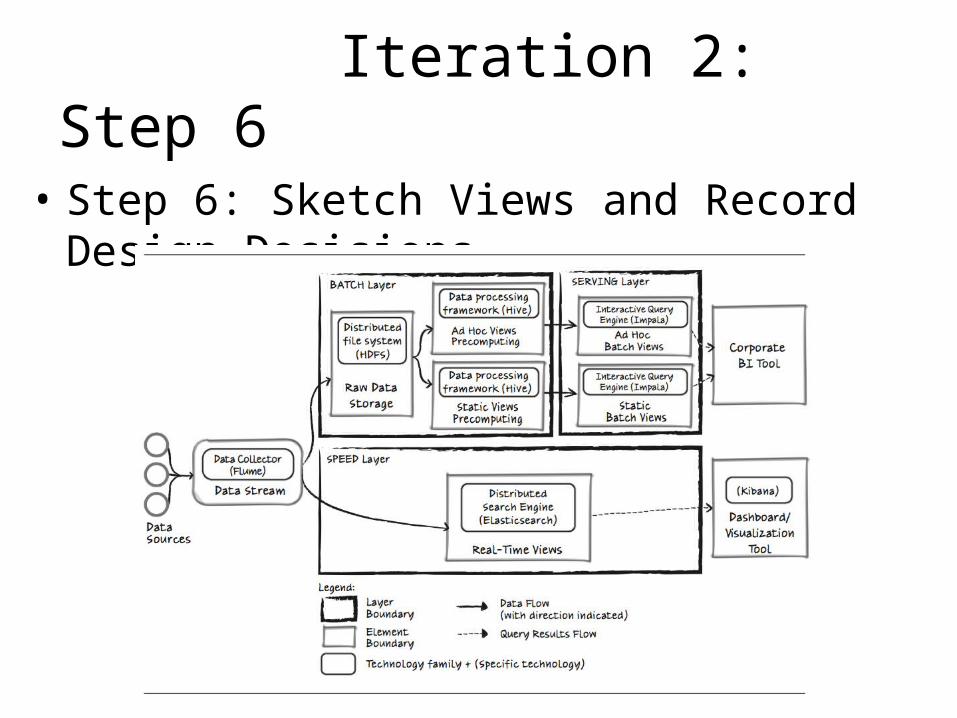
Iteration 2: Step 6
• Step 6: Sketch Views and Record Design Decisions
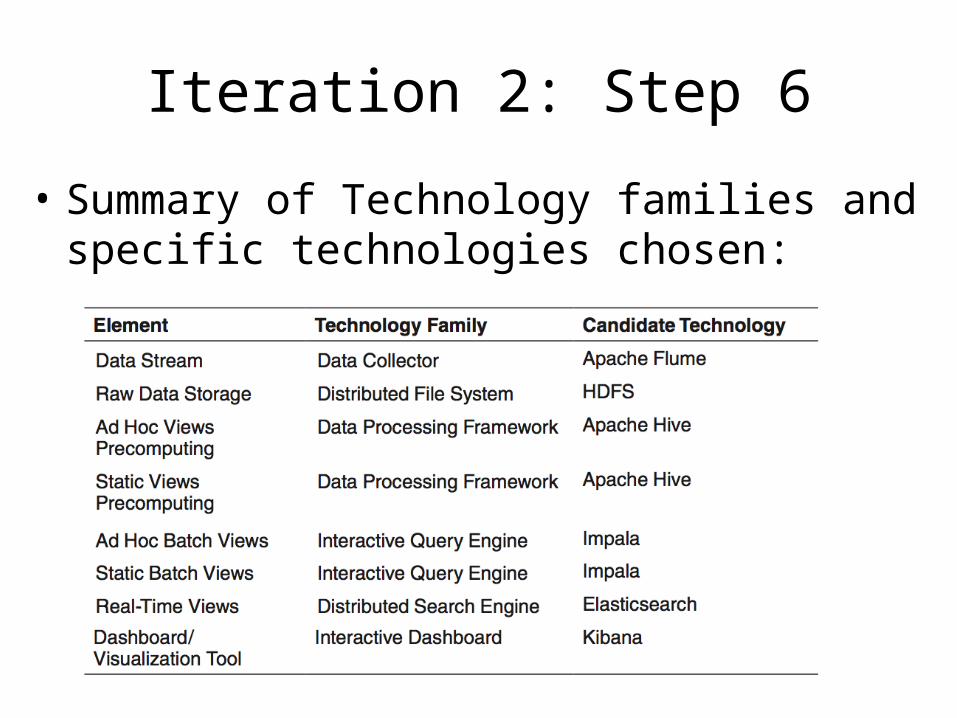
Iteration 2: Step 6
• Summary of Technology families and specific technologies chosen:
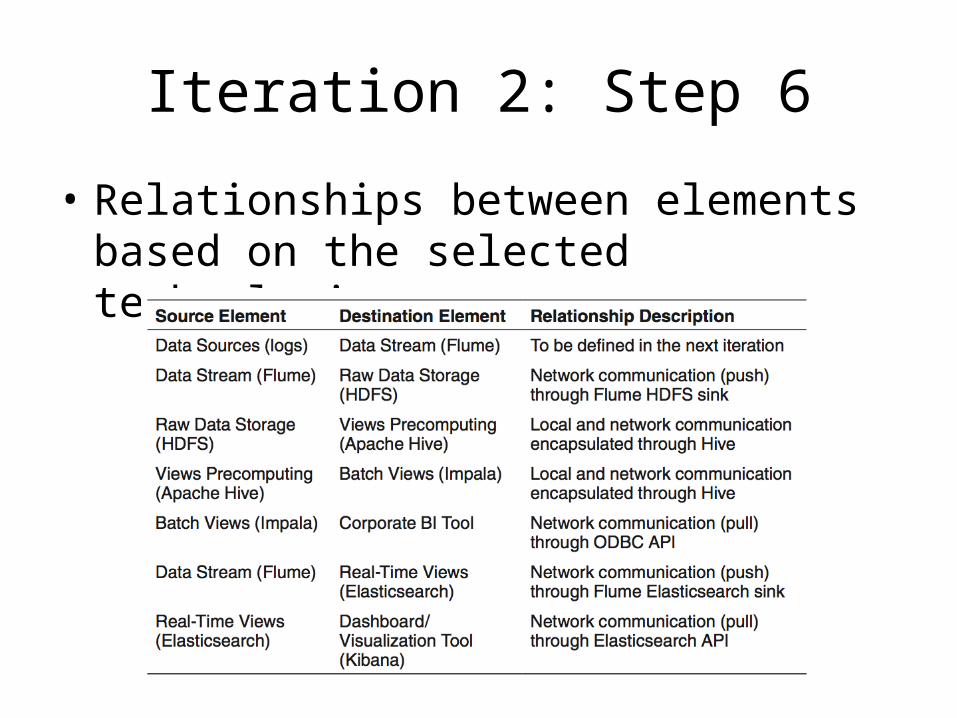
Iteration 2: Step 6
• Relationships between elements based on the selected technologies:
Iteration 1: Step 7Not Addressed
Partially Addressed
Completely Addressed
Design decisions made during the iteration
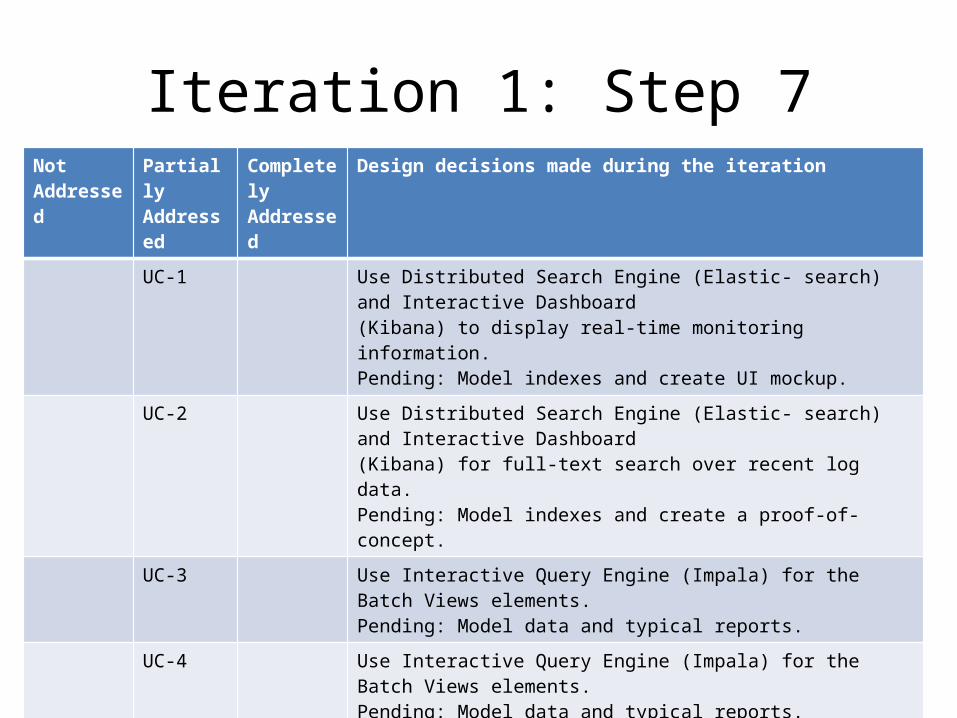
UC-1 Use Distributed Search Engine (Elastic- search) and Interactive Dashboard(Kibana) to display real-time monitoring information.Pending: Model indexes and create UI mockup.
UC-2 Use Distributed Search Engine (Elastic- search) and Interactive Dashboard(Kibana) for full-text search over recent log data.Pending: Model indexes and create a proof-of-concept.
UC-3 Use Interactive Query Engine (Impala) for the Batch Views elements.Pending: Model data and typical reports.
UC-4 Use Interactive Query Engine (Impala) for the Batch Views elements.Pending: Model data and typical reports.
UC-6 This use case has been omitted in this iteration as nonprimary, although it is similar to UC-3 from an architectural standpoint.
QA-1 Use Data Collector (Apache Flume) for the Data Stream element.Pending: Configuration, proof-of-concept, and performance tests.
QA-2 Use Distributed Search Engine (Elasticsearch) and Interactive Dashboard (Kibana).Pending: Proof-of-concept and performance tests.
Iteration 1: Step 7Not Addressed
Partially Addressed
Completely Addressed
Design decisions made during the iteration
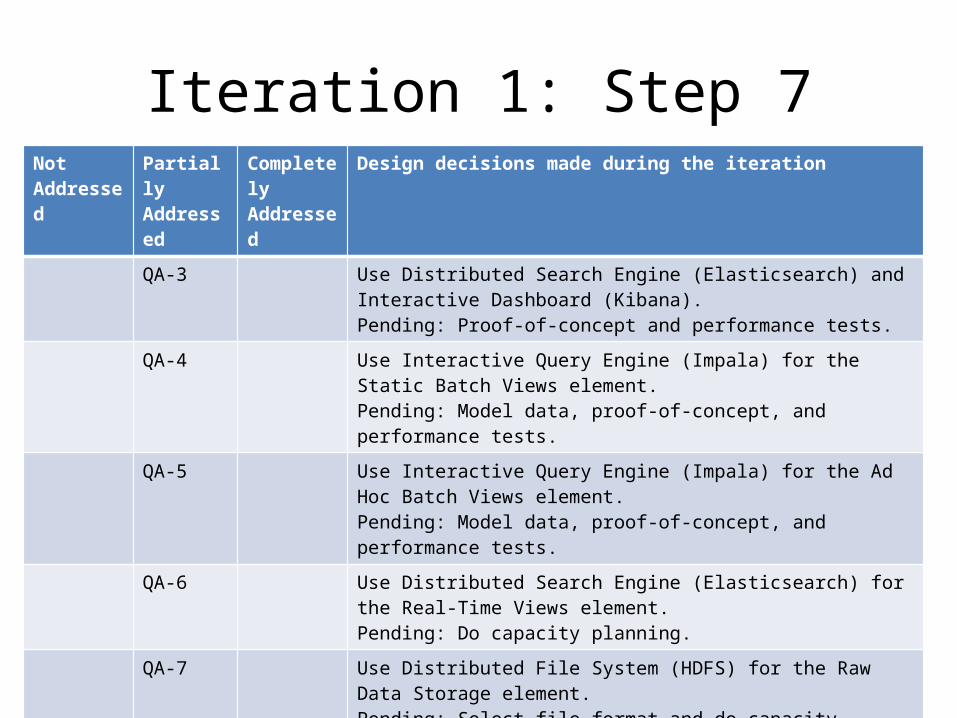
QA-3 Use Distributed Search Engine (Elasticsearch) and Interactive Dashboard (Kibana).Pending: Proof-of-concept and performance tests.
QA-4 Use Interactive Query Engine (Impala) for the Static Batch Views element.Pending: Model data, proof-of-concept, and performance tests.
QA-5 Use Interactive Query Engine (Impala) for the Ad Hoc Batch Views element. Pending: Model data, proof-of-concept, and performance tests.
QA-6 Use Distributed Search Engine (Elasticsearch) for the Real-Time Views element.Pending: Do capacity planning.
QA-7 Use Distributed File System (HDFS) for the Raw Data Storage element. Pending: Select file format and do capacity planning.
QA-8 Use Distributed File System (HDFS) as storage for Batch Views.Pending: Select file format and do capacity planning.
QA-9 Use Data Collector (Apache Flume) for the Data Stream element.Pending: Configuration and proof-of- concept.
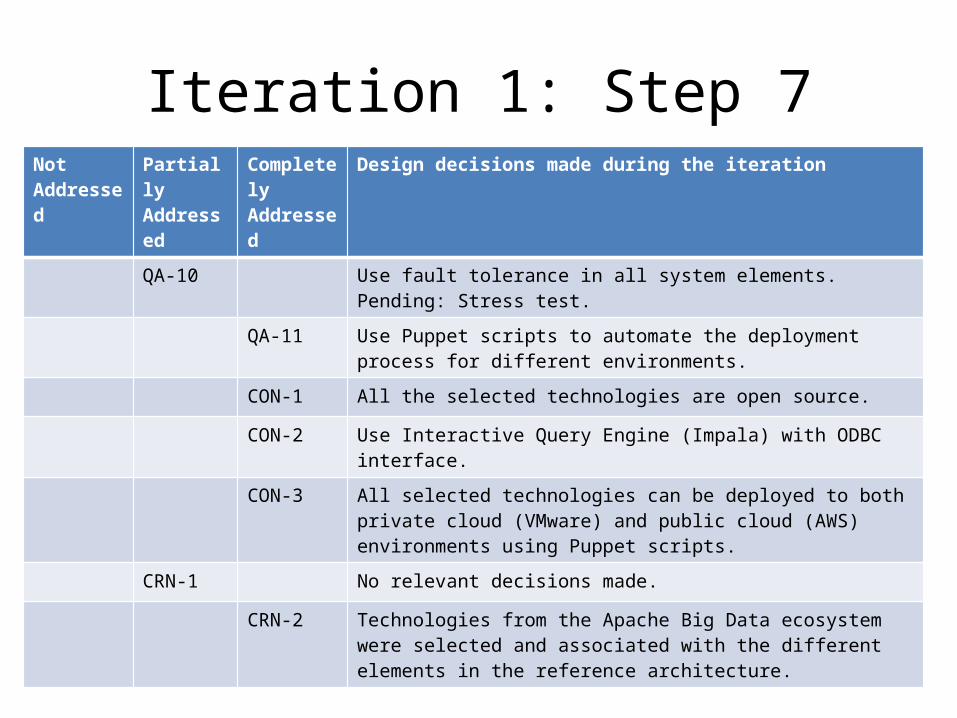
Iteration 1: Step 7Not Addressed
Partially Addressed
Completely Addressed
Design decisions made during the iteration
QA-10 Use fault tolerance in all system elements. Pending: Stress test.
QA-11 Use Puppet scripts to automate the deployment process for different environments.
CON-1 All the selected technologies are open source.
CON-2 Use Interactive Query Engine (Impala) with ODBC interface.
CON-3 All selected technologies can be deployed to both private cloud (VMware) and public cloud (AWS) environments using Puppet scripts.
CRN-1 No relevant decisions made.
CRN-2 Technologies from the Apache Big Data ecosystem were selected and associated with the different elements in the reference architecture.

Iteration 3
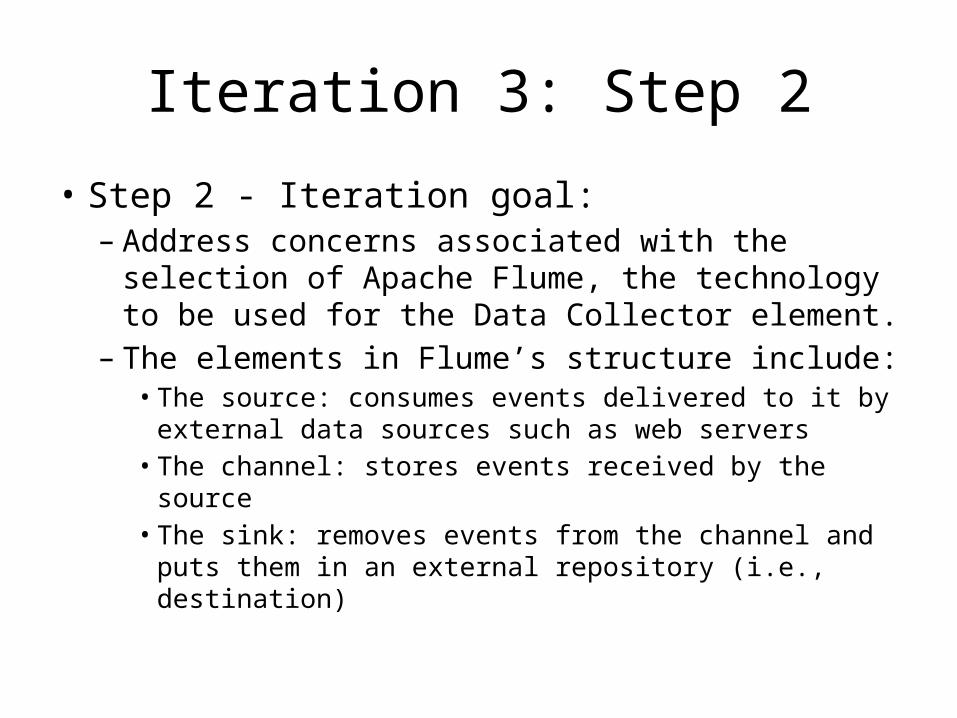
Iteration 3: Step 2
• Step 2 - Iteration goal:– Address concerns associated with the selection of
Apache Flume, the technology to be used for the Data Collector element.
– The elements in Flume’s structure include:• The source: consumes events delivered to it by external
data sources such as web servers• The channel: stores events received by the source• The sink: removes events from the channel and puts
them in an external repository (i.e., destination)
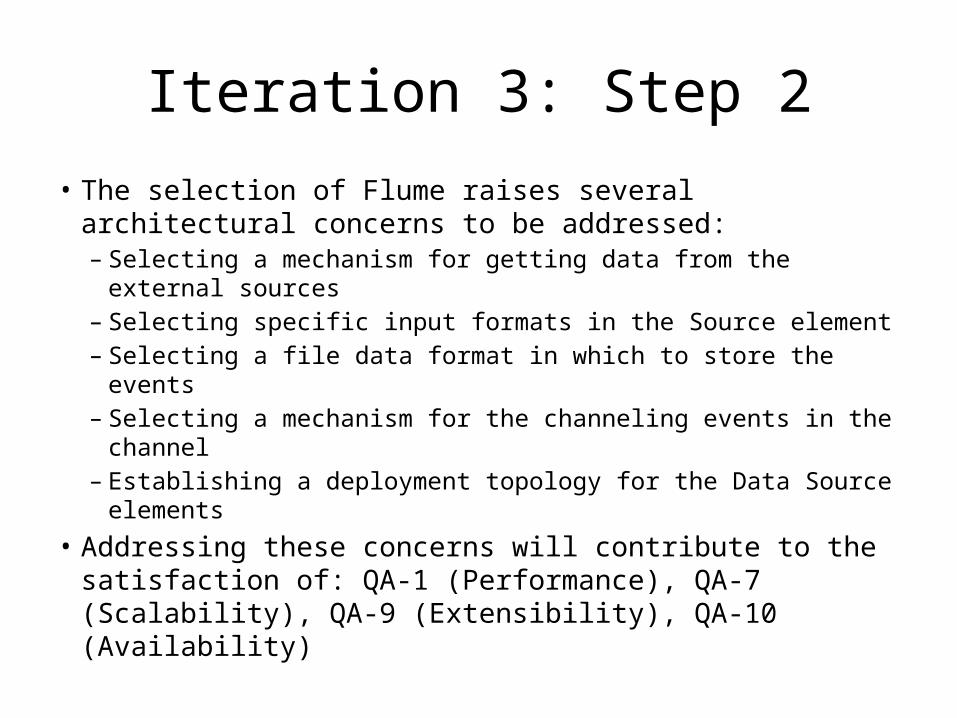
Iteration 3: Step 2• The selection of Flume raises several architectural
concerns to be addressed: – Selecting a mechanism for getting data from the external
sources– Selecting specific input formats in the Source element– Selecting a file data format in which to store the events– Selecting a mechanism for the channeling events in the channel– Establishing a deployment topology for the Data Source
elements• Addressing these concerns will contribute to the
satisfaction of: QA-1 (Performance), QA-7 (Scalability), QA-9 (Extensibility), QA-10 (Availability)
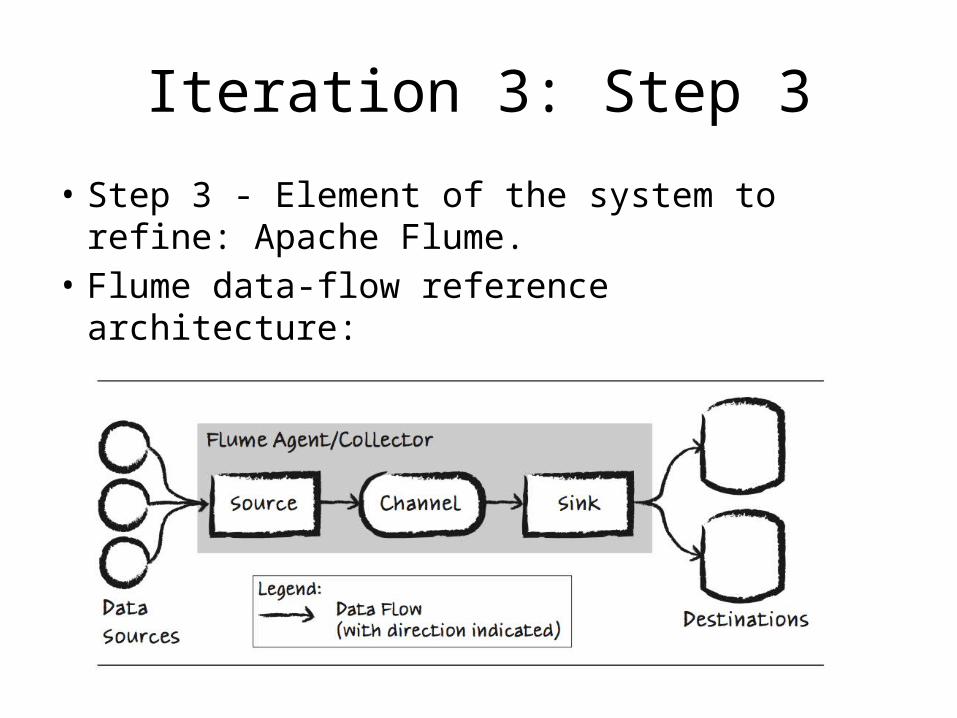
Iteration 3: Step 3
• Step 3 - Element of the system to refine: Apache Flume.
• Flume data-flow reference architecture:
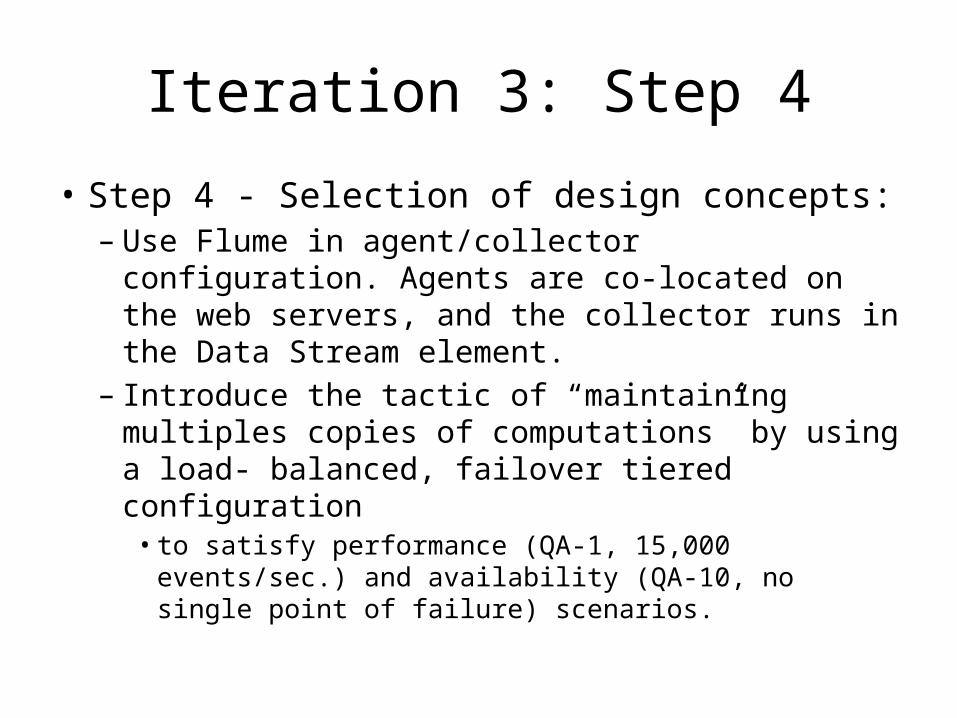
Iteration 3: Step 4
• Step 4 - Selection of design concepts:– Use Flume in agent/collector configuration. Agents
are co-located on the web servers, and the collector runs in the Data Stream element.
– Introduce the tactic of “maintaining multiples copies of computations” by using a load- balanced, failover tiered configuration • to satisfy performance (QA-1, 15,000 events/sec.) and
availability (QA-10, no single point of failure) scenarios.
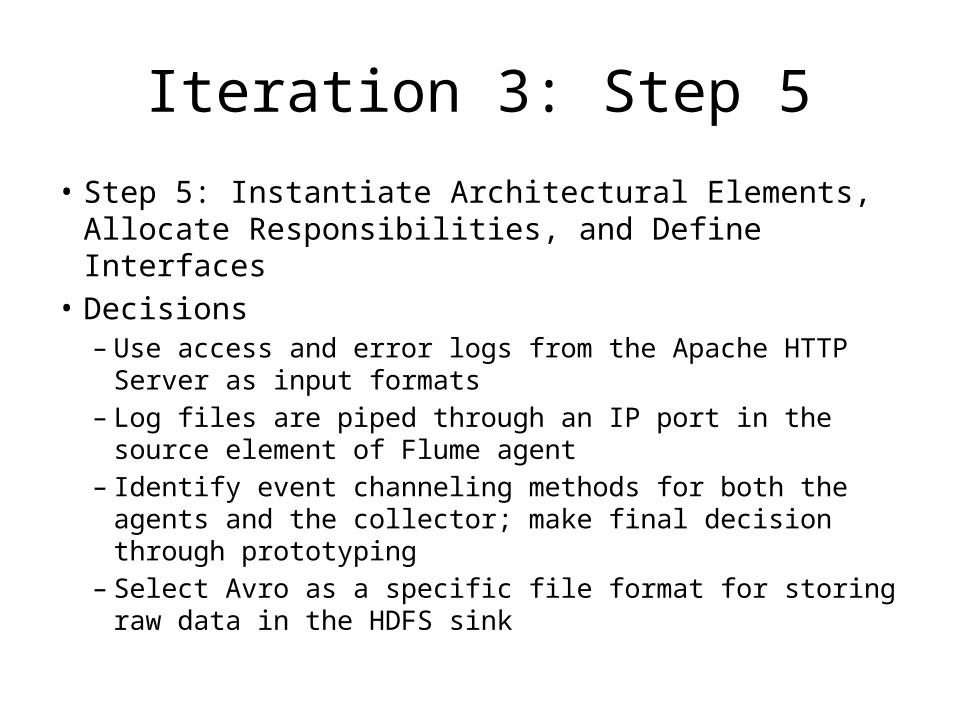
Iteration 3: Step 5
• Step 5: Instantiate Architectural Elements, Allocate Responsibilities, and Define Interfaces
• Decisions– Use access and error logs from the Apache HTTP Server as
input formats – Log files are piped through an IP port in the source element
of Flume agent – Identify event channeling methods for both the agents and
the collector; make final decision through prototyping – Select Avro as a specific file format for storing raw data in
the HDFS sink
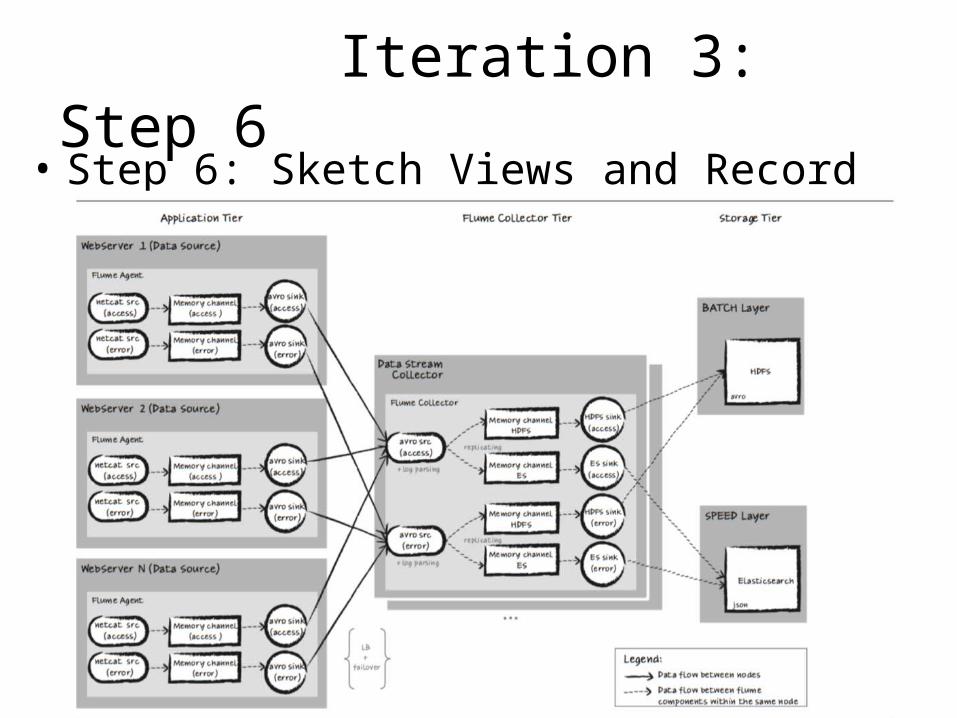
Iteration 3: Step 6• Step 6: Sketch Views and Record Design Decisions
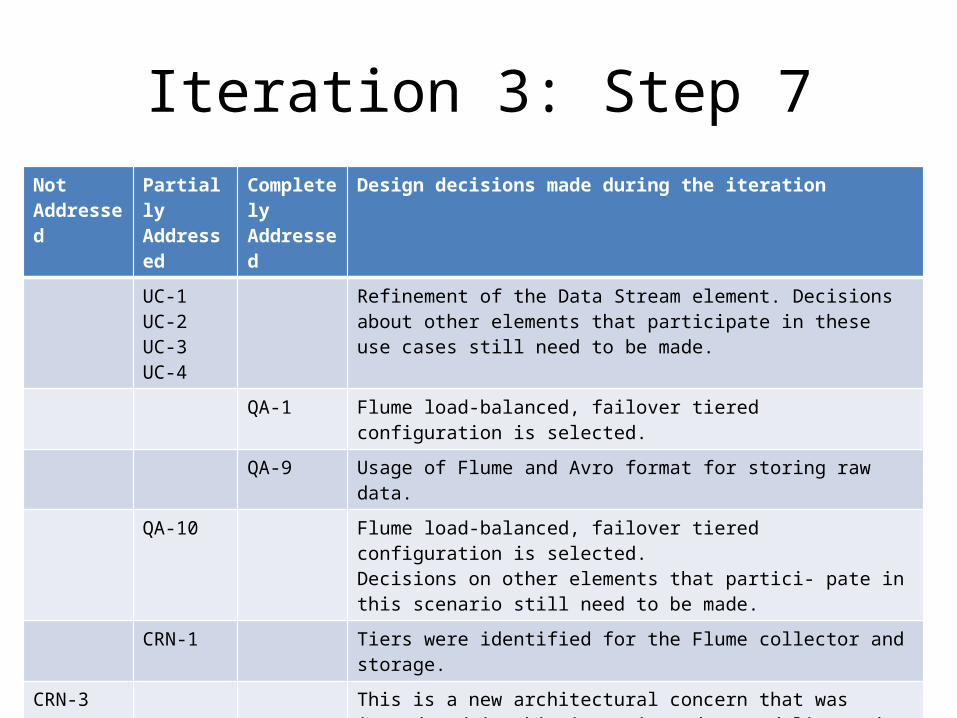
Iteration 3: Step 7Not Addressed
Partially Addressed
Completely Addressed
Design decisions made during the iteration
UC-1 UC-2 UC-3 UC-4
Refinement of the Data Stream element. Decisions about other elements that participate in these use cases still need to be made.
QA-1 Flume load-balanced, failover tiered configuration is selected.
QA-9 Usage of Flume and Avro format for storing raw data.
QA-10 Flume load-balanced, failover tiered configuration is selected.Decisions on other elements that partici- pate in this scenario still need to be made.
CRN-1 Tiers were identified for the Flume collector and storage.
CRN-3 This is a new architectural concern that was introduced in this iteration: data modeling and developing proof-of-concept prototypes for key system elements. At this point, no relevant decisions have been made.
Iteration 4
Iteration 4: Step 2
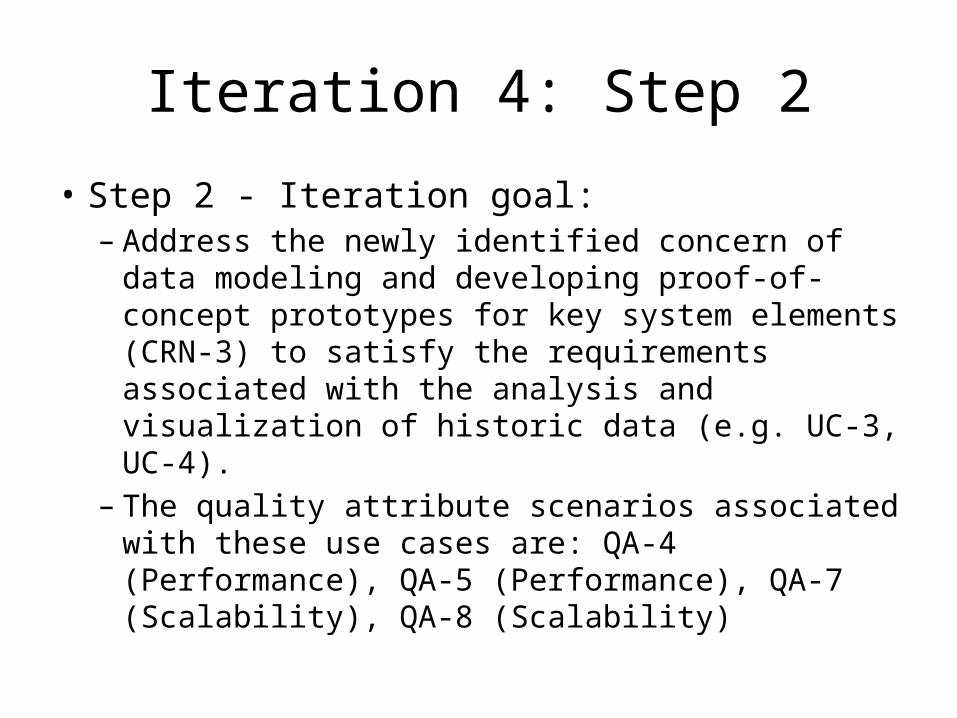
• Step 2 - Iteration goal:– Address the newly identified concern of data
modeling and developing proof-of-concept prototypes for key system elements (CRN-3) to satisfy the requirements associated with the analysis and visualization of historic data (e.g. UC-3, UC-4).
– The quality attribute scenarios associated with these use cases are: QA-4 (Performance), QA-5 (Performance), QA-7 (Scalability), QA-8 (Scalability)
Iteration 4: Step 3
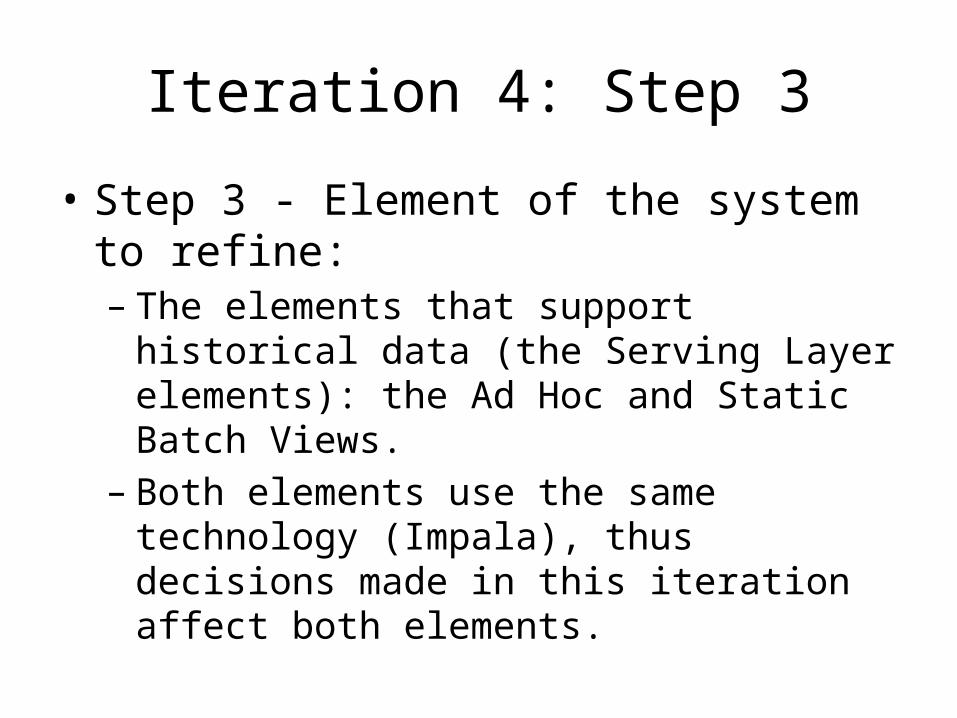
• Step 3 - Element of the system to refine: – The elements that support historical data (the
Serving Layer elements): the Ad Hoc and Static Batch Views.
– Both elements use the same technology (Impala), thus decisions made in this iteration affect both elements.
Iteration 4: Step 4
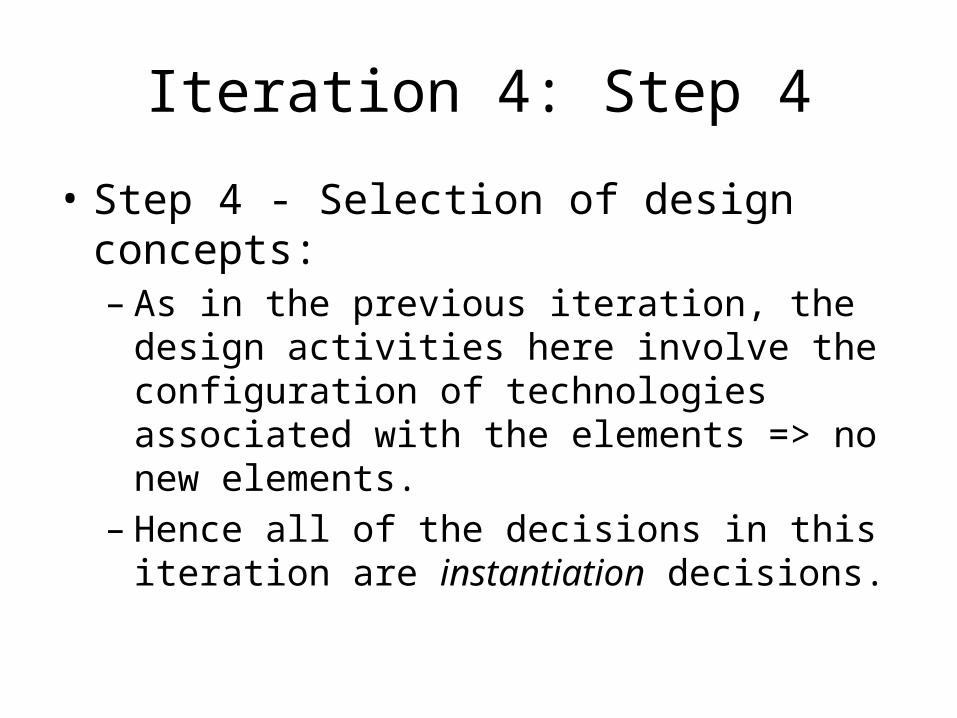
• Step 4 - Selection of design concepts:– As in the previous iteration, the design activities
here involve the configuration of technologies associated with the elements => no new elements.
– Hence all of the decisions in this iteration are instantiation decisions.
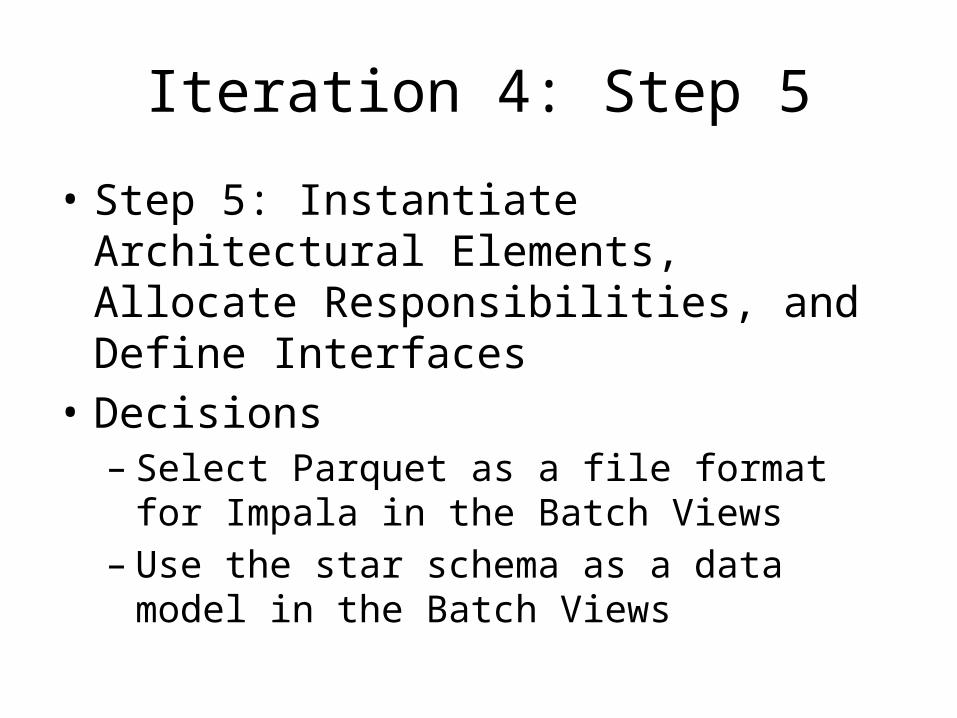
Iteration 4: Step 5
• Step 5: Instantiate Architectural Elements, Allocate Responsibilities, and Define Interfaces
• Decisions– Select Parquet as a file format for Impala in the
Batch Views – Use the star schema as a data model in the Batch
Views
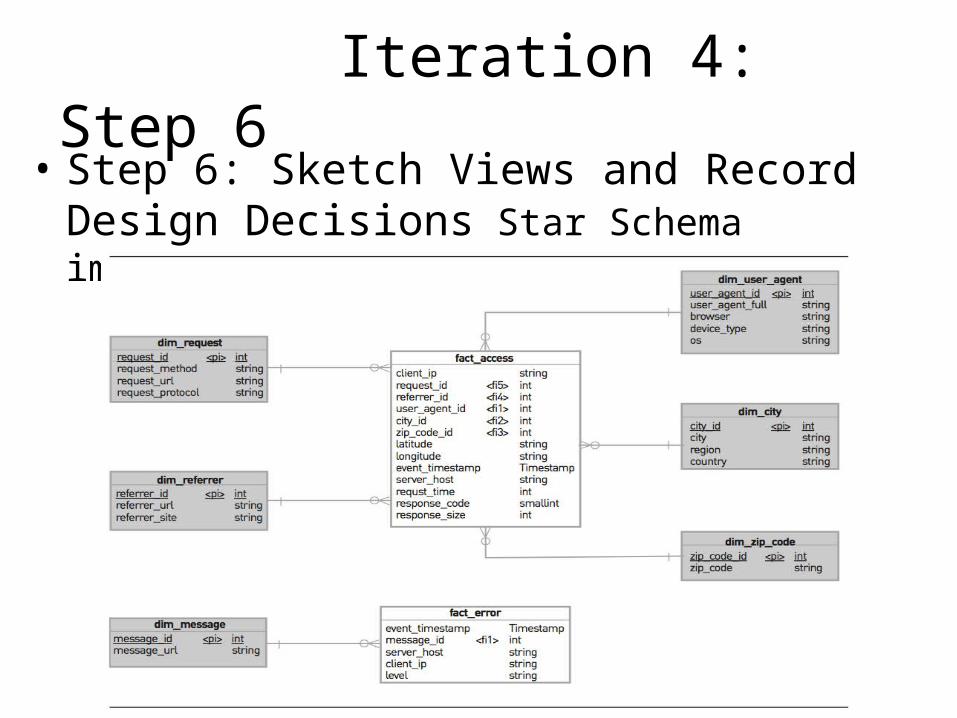
Iteration 4: Step 6• Step 6: Sketch Views and Record Design Decisions
Star Schema implemented in Impala and Parquet:
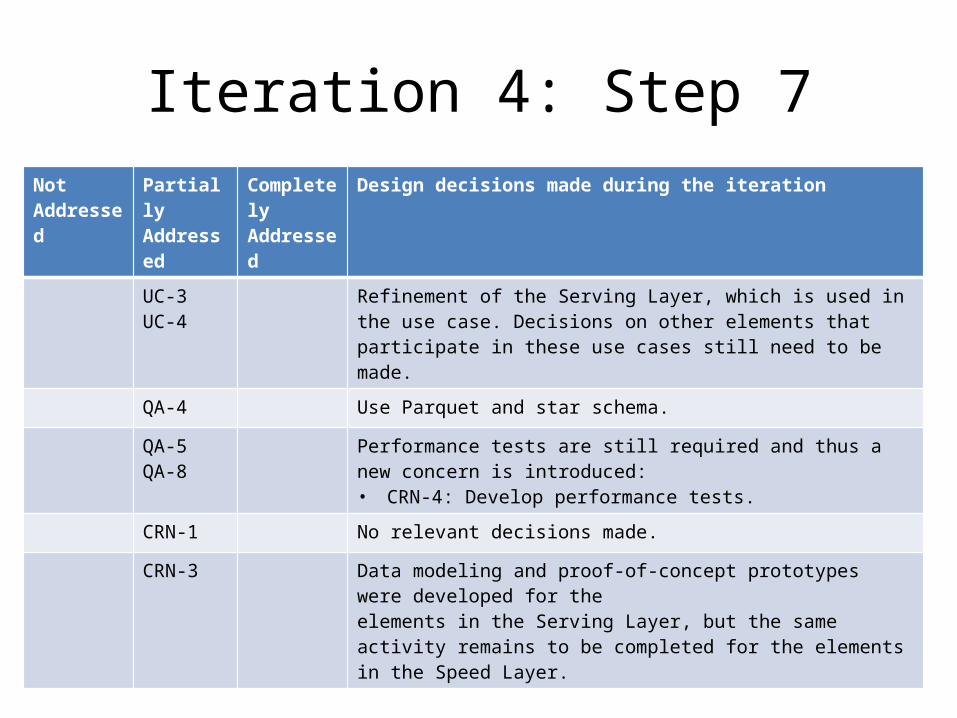
Iteration 4: Step 7Not Addressed
Partially Addressed
Completely Addressed
Design decisions made during the iteration
UC-3 UC-4
Refinement of the Serving Layer, which is used in the use case. Decisions on other elements that participate in these use cases still need to be made.
QA-4 Use Parquet and star schema.
QA-5QA-8
Performance tests are still required and thus a new concern is introduced:• CRN-4: Develop performance tests.
CRN-1 No relevant decisions made.
CRN-3 Data modeling and proof-of-concept prototypes were developed for theelements in the Serving Layer, but the same activity remains to be completed for the elements in the Speed Layer.
Summary• We presented an extended example of using ADD 3.0 in a
relatively novel domain--Big Data. • As this example shows, architectural design can require
many detailed decisions to be made to ensure that the quality attributes will be satisfied.
• Also, this example shows that a large number of decisions rely on knowledge of different patterns and technologies.
• The more novel the domain, the more likely that design concepts catalogs, books of patterns, reference architectures, etc. will not be available.
• In that case you must rely on your own experience, or perform experiments and build prototypes.