Embed Size (px)
Citation preview
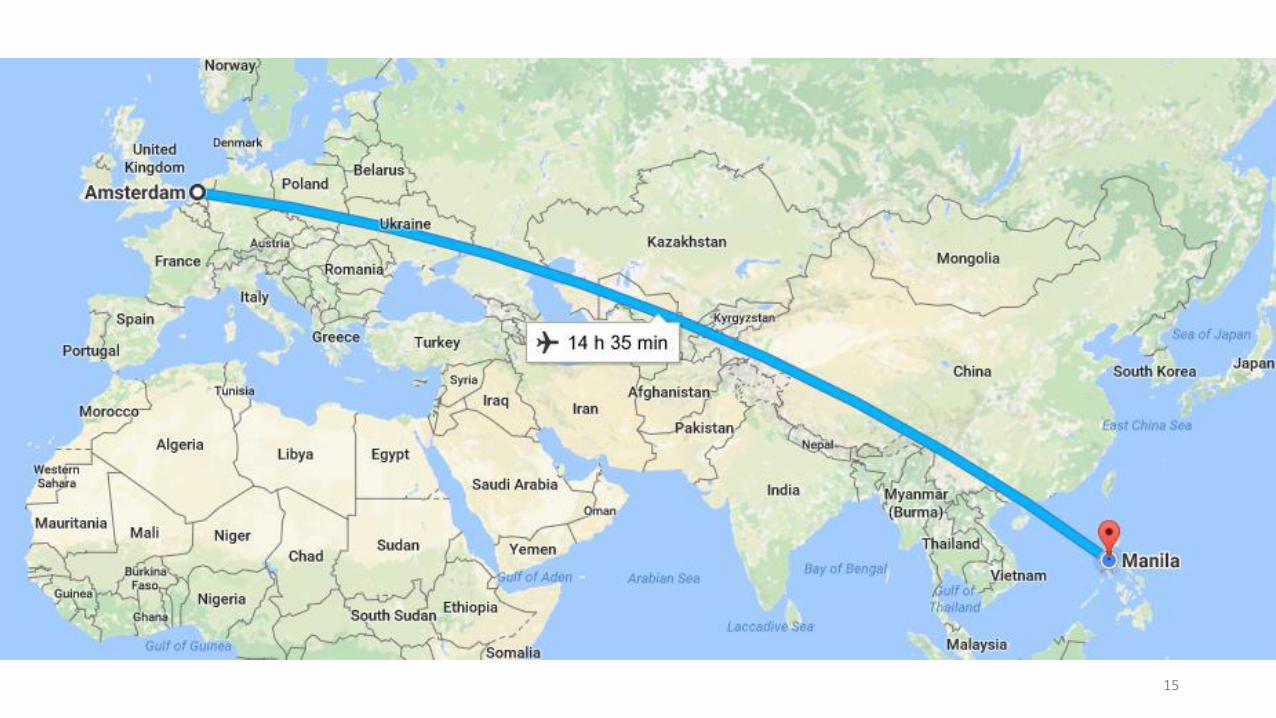
Hydrodynamic modeling and resource-device
suitability analysis of Northern Luzon, Philippines
for tidal stream energy resource assessment
OLIVER DAN G. DE LUNA Training Center for Applied Geodesy and Photogrammetry
University of the Philippines, Diliman, Quezon City
Delft Software Days 2016 Delft, The Netherlands
November 1, 2016
1

BORACAY ISLAND BEACH 2

BORACAY ISLAND BEACH
3

CORON ISLAND
4

CORON ISLAND
5
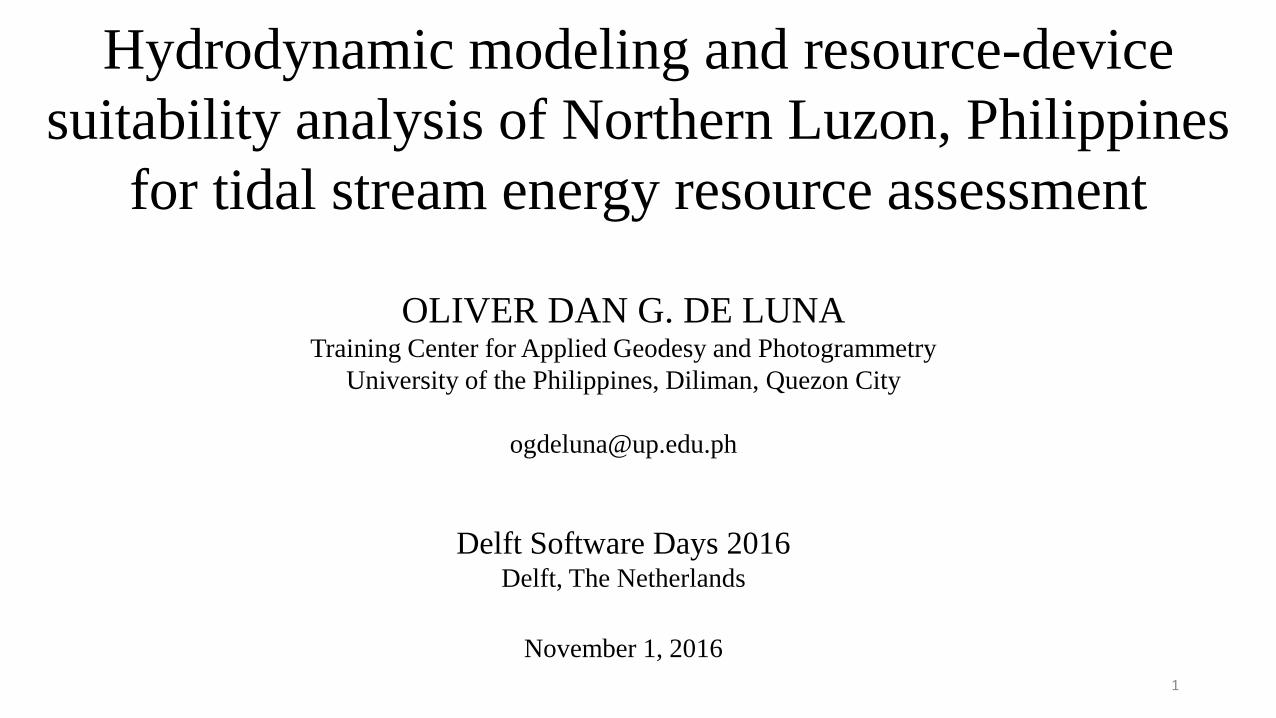
MASUNGI GEORESERVE
6

MASUNGI GEORESERVE
7

DONSOL DIVING
8

DONSOL DIVING
9

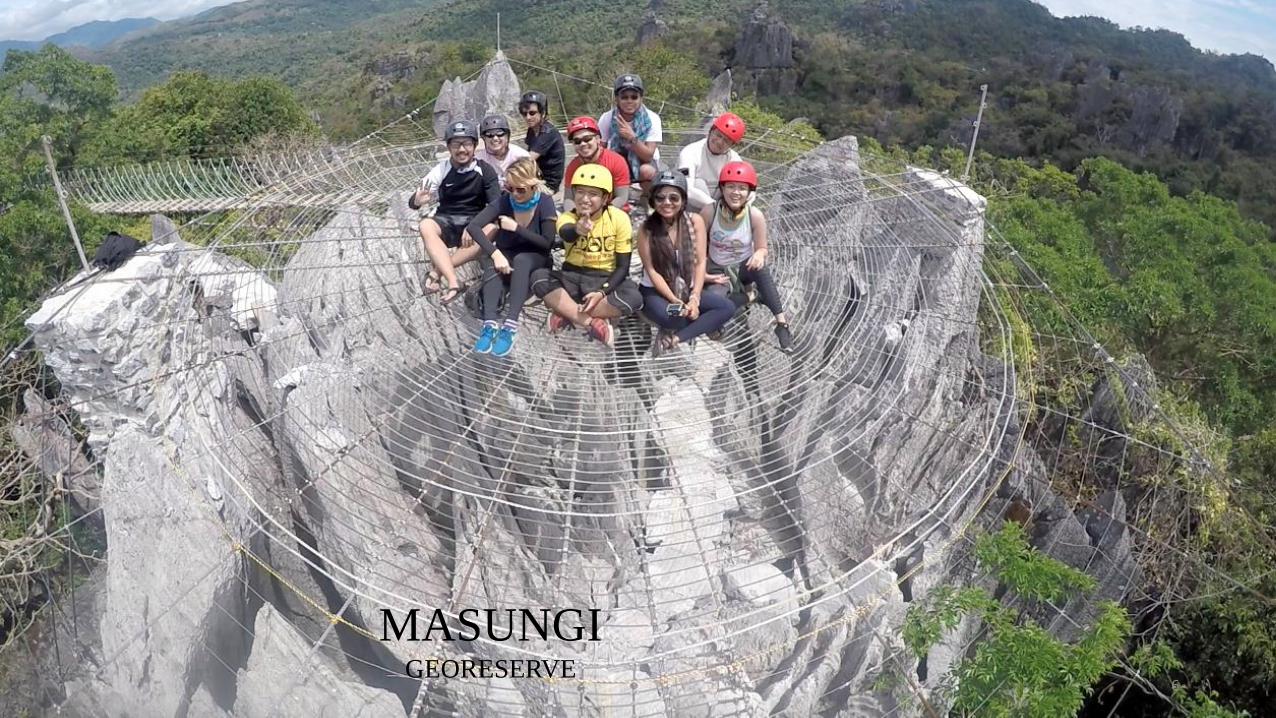
PALAWAN ISLAND UNDERGROUND RIVER
10
11

MANILA WALLED CITY
12

MANILA BONIFACIO GLOBAL CITY
13

MANILA BONIFACIO GLOBAL CITY
14
15

16
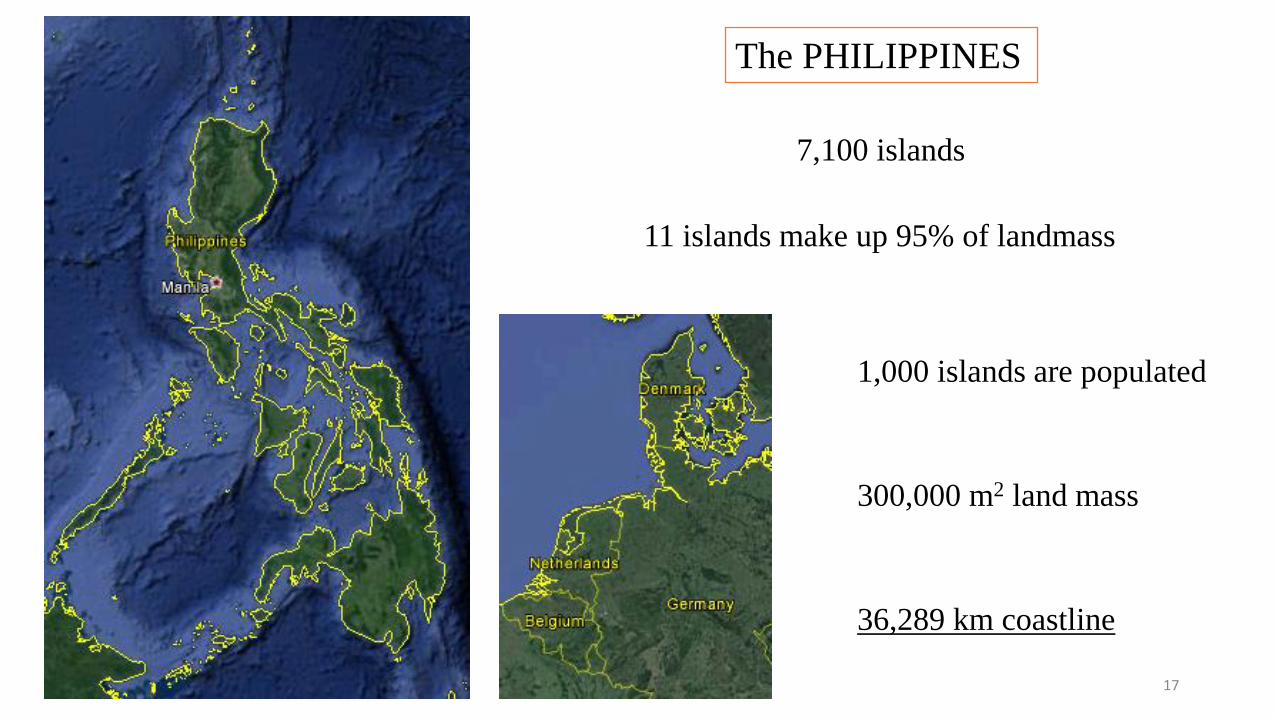
The PHILIPPINES
7,100 islands
1,000 islands are populated
11 islands make up 95% of landmass
300,000 m2 land mass
36,289 km coastline
17

18
RENEWABLE ENERGY
IN THE PHILIPPINES
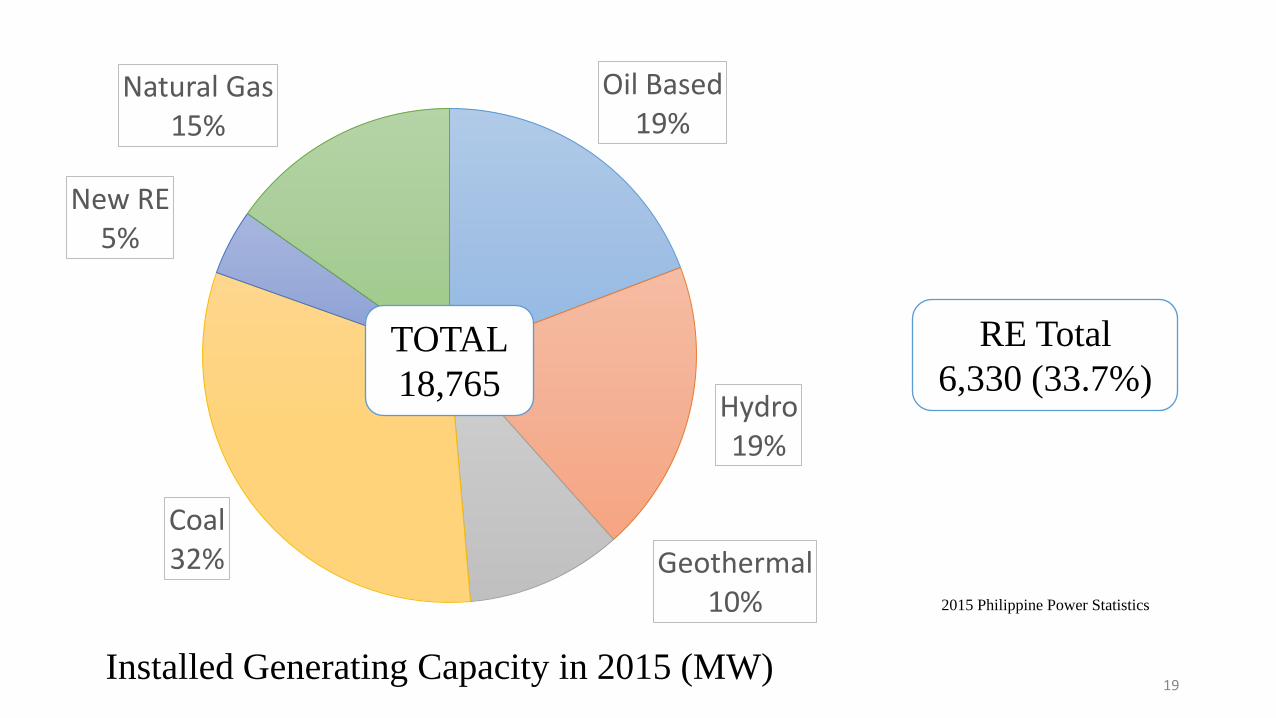
Oil Based 19%
Hydro 19%
Geothermal 10%
Coal 32%
New RE 5%
Natural Gas 15%
Installed Generating Capacity in 2015 (MW)
TOTAL
18,765
RE Total
6,330 (33.7%)
2015 Philippine Power Statistics
19
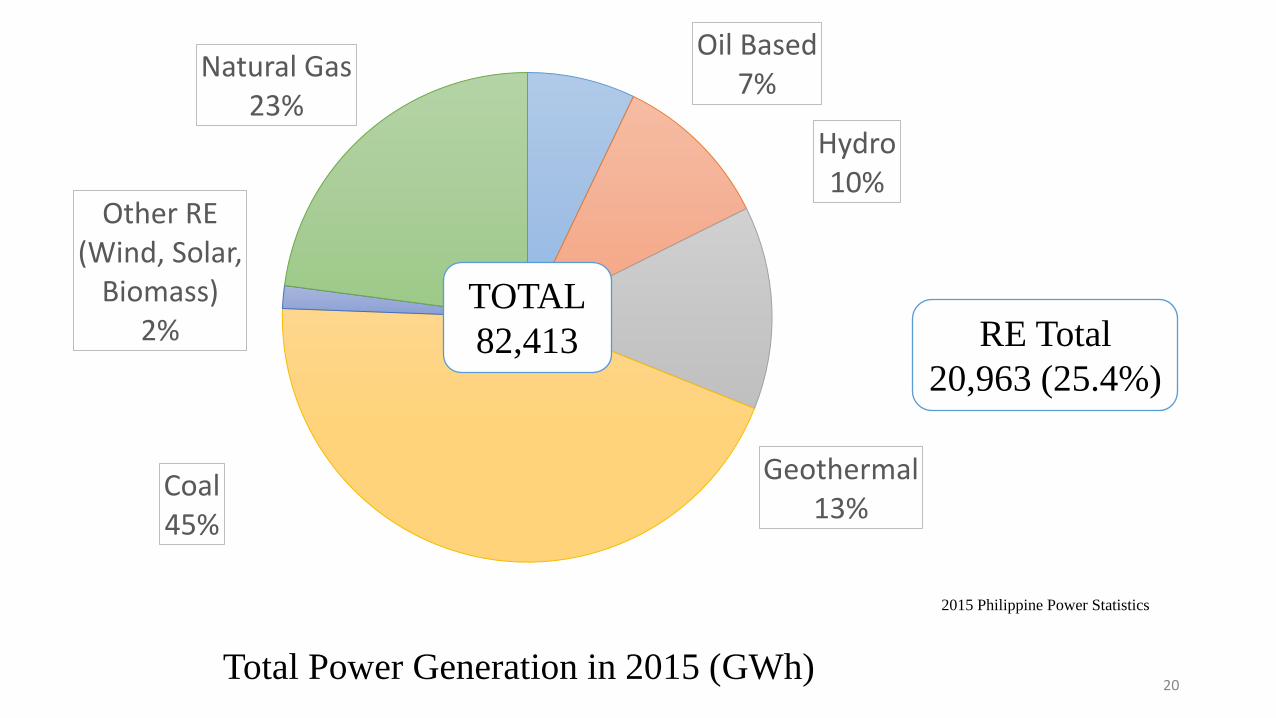
Total Power Generation in 2015 (GWh)
RE Total
20,963 (25.4%)
2015 Philippine Power Statistics
Oil Based 7%
Hydro 10%
Geothermal 13%
Coal 45%
Other RE (Wind, Solar,
Biomass) 2%
Natural Gas 23%
TOTAL
82,413
20
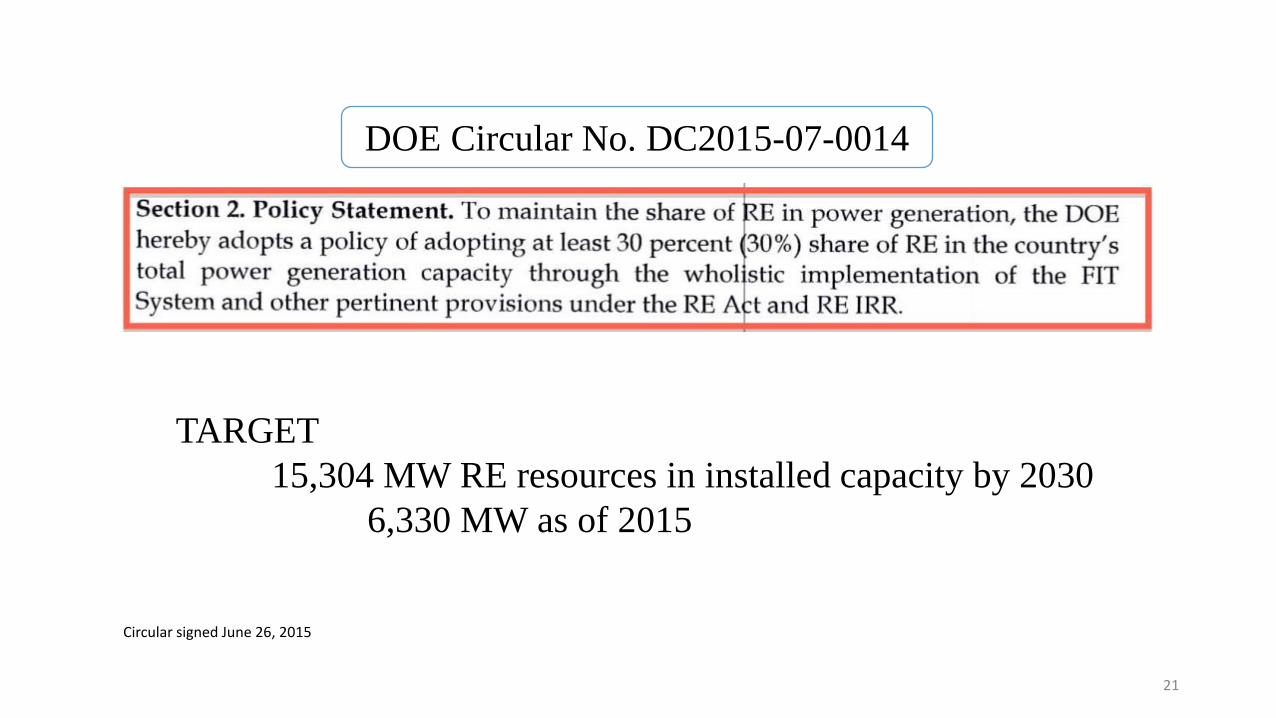
DOE Circular No. DC2015-07-0014
TARGET
15,304 MW RE resources in installed capacity by 2030
6,330 MW as of 2015
Circular signed June 26, 2015
21
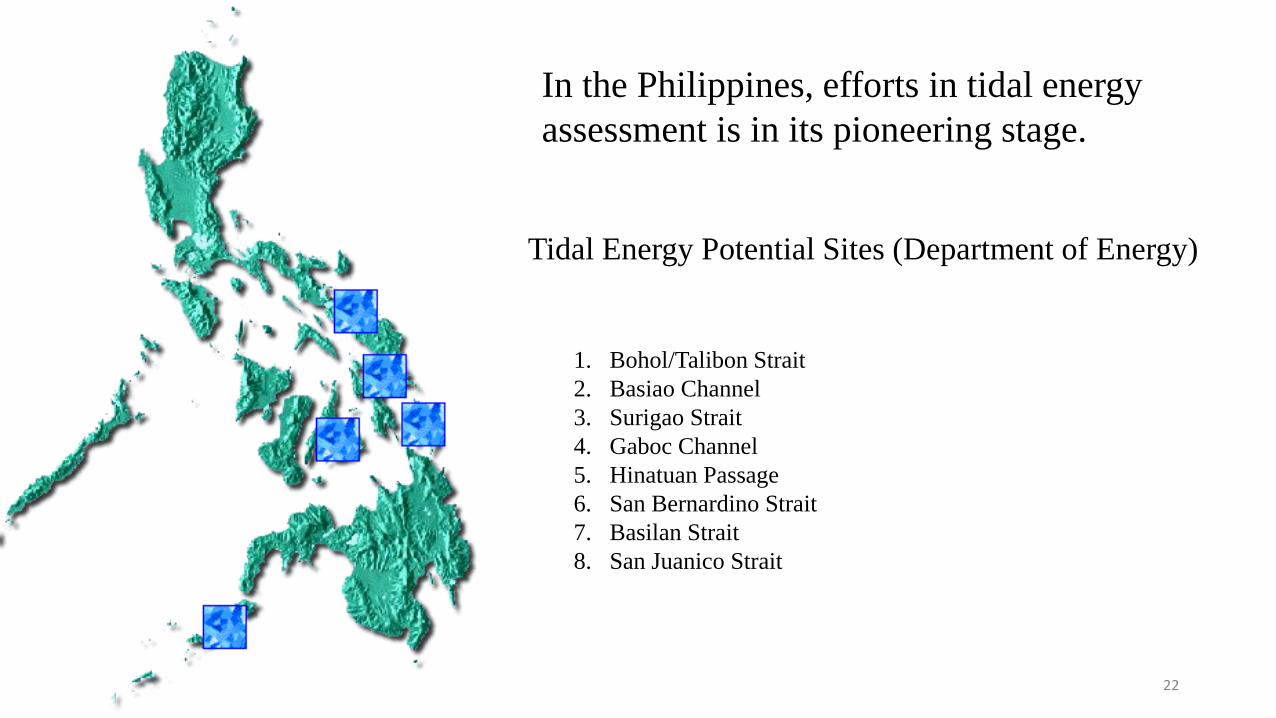
Tidal Energy Potential Sites (Department of Energy)
1. Bohol/Talibon Strait
2. Basiao Channel
3. Surigao Strait
4. Gaboc Channel
5. Hinatuan Passage
6. San Bernardino Strait
7. Basilan Strait
8. San Juanico Strait
In the Philippines, efforts in tidal energy
assessment is in its pioneering stage.
22
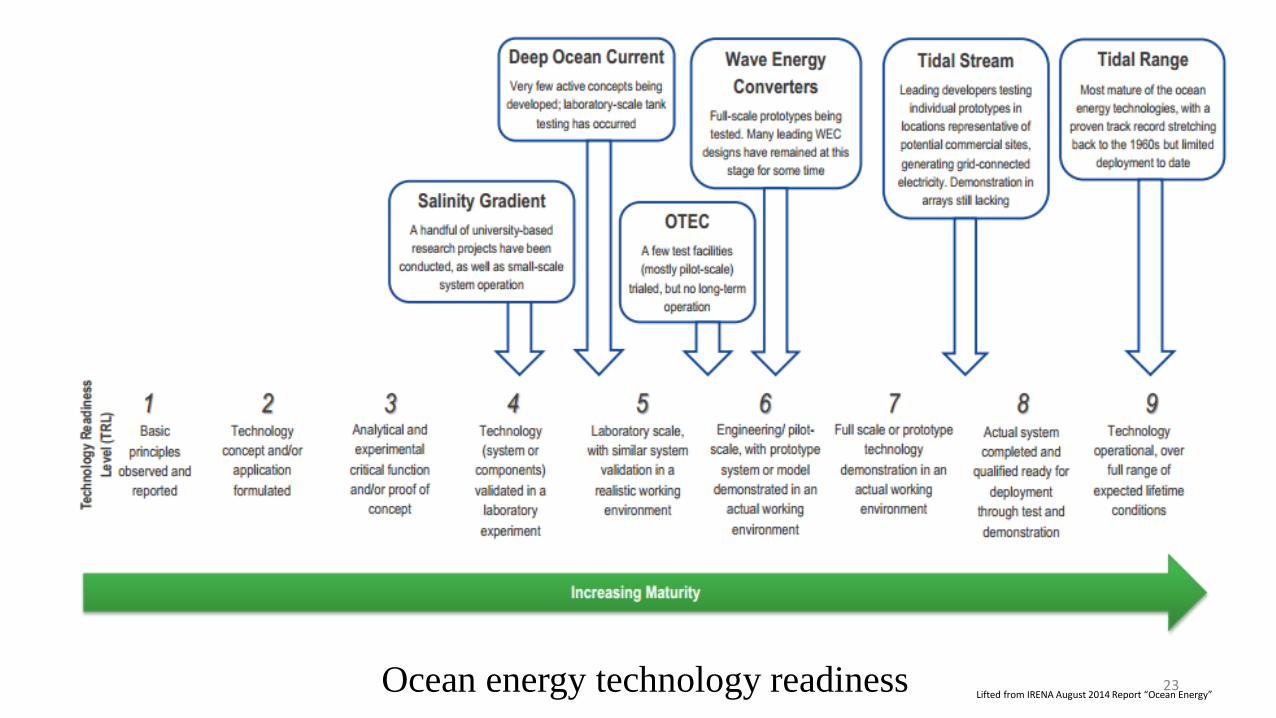
Ocean energy technology readiness Lifted from IRENA August 2014 Report “Ocean Energy”
23

Tidal Current Energy Integrated Resource Assessment and Spatial Planning Tool
Training Center for Applied Geodesy and Photogrammetry MH 406 Melchor Hall, College of Engineering
University of the Philippines Diliman, Quezon City
Department of Science and Technology Philippine Council for Industry, Energy and Emerging Technology
for Research and Development (PCIEERD)
Republic of the Philippines
U.P. Marine Science Institute University of the Philippines Diliman, Quezon City
U.P. Department of Mechanical Engineering University of the Philippines Diliman, Quezon City
24
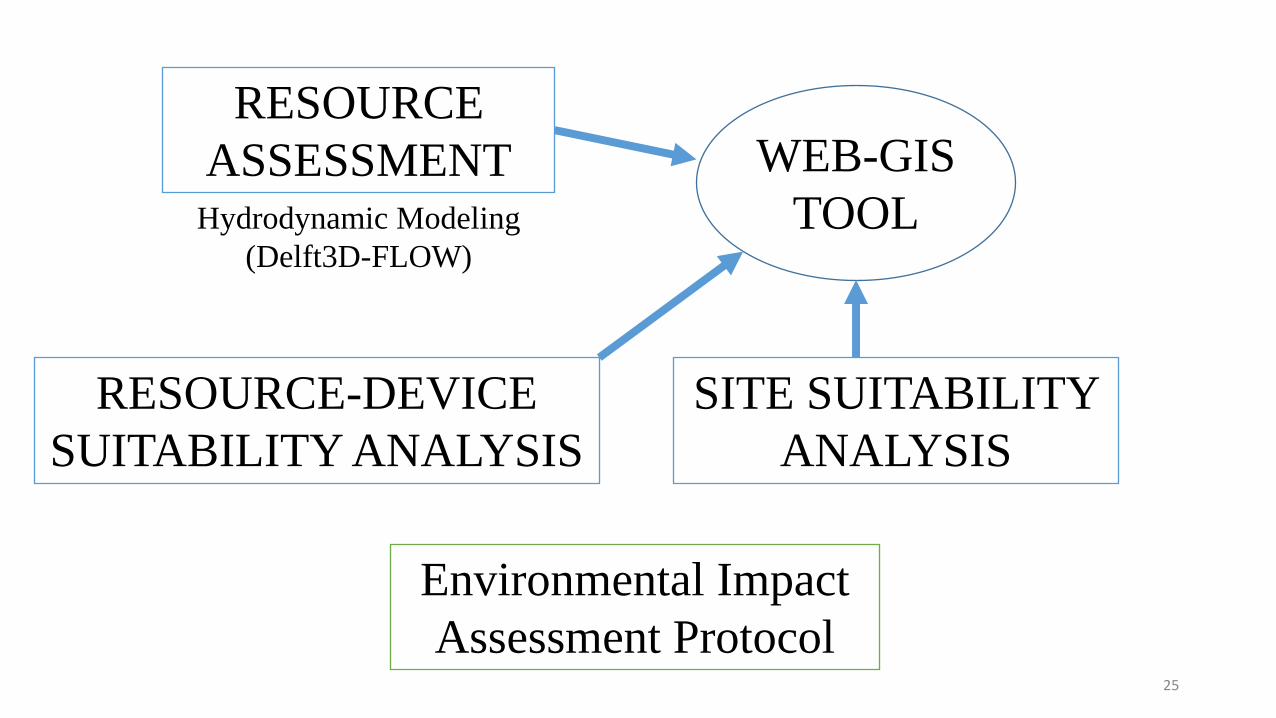
RESOURCE-DEVICE
SUITABILITY ANALYSIS
Environmental Impact
Assessment Protocol
SITE SUITABILITY
ANALYSIS
RESOURCE
ASSESSMENT Hydrodynamic Modeling
(Delft3D-FLOW)
WEB-GIS
TOOL
25

26
RESOURCE ASSESSMENT
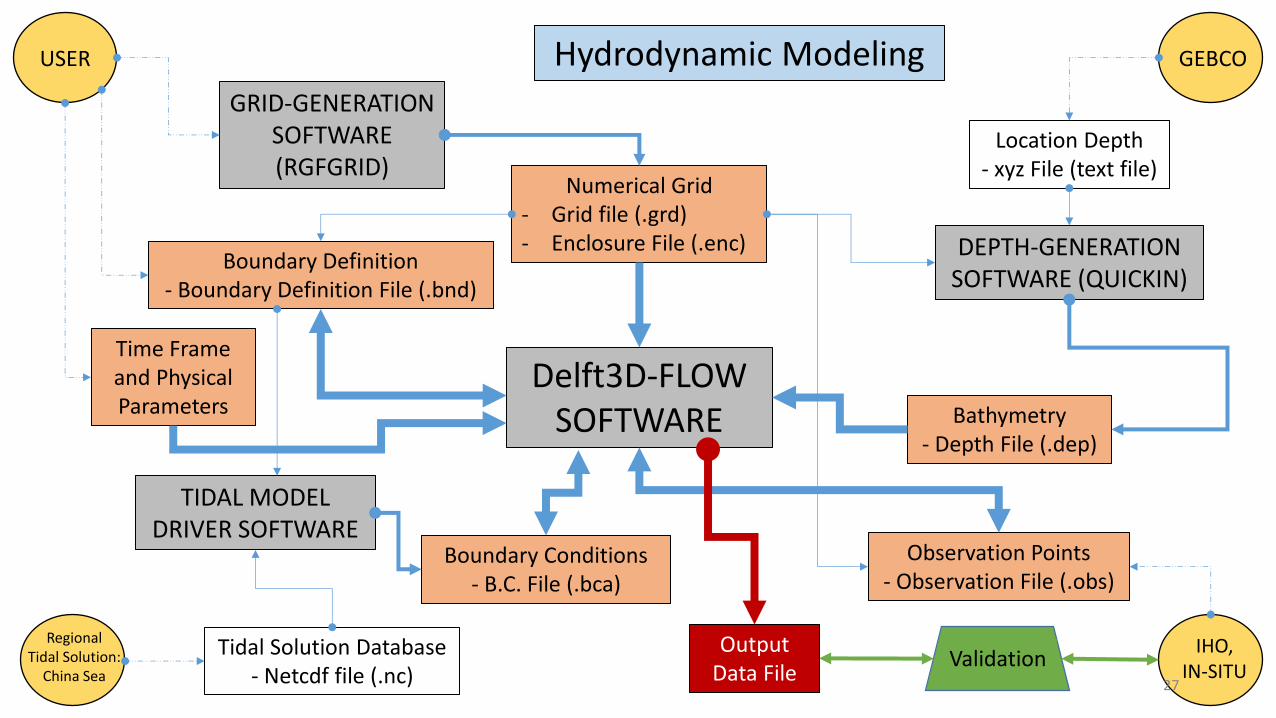
Delft3D-FLOW SOFTWARE
GRID-GENERATION SOFTWARE (RGFGRID)
DEPTH-GENERATION SOFTWARE (QUICKIN)
TIDAL MODEL DRIVER SOFTWARE
Numerical Grid - Grid file (.grd) - Enclosure File (.enc)
Location Depth - xyz File (text file)
Bathymetry - Depth File (.dep)
Tidal Solution Database - Netcdf file (.nc)
Boundary Definition - Boundary Definition File (.bnd)
Boundary Conditions - B.C. File (.bca)
Observation Points - Observation File (.obs)
USER
Time Frame and Physical Parameters
IHO, IN-SITU
GEBCO
Regional Tidal Solution:
China Sea
Output Data File
Validation 27
Hydrodynamic Modeling
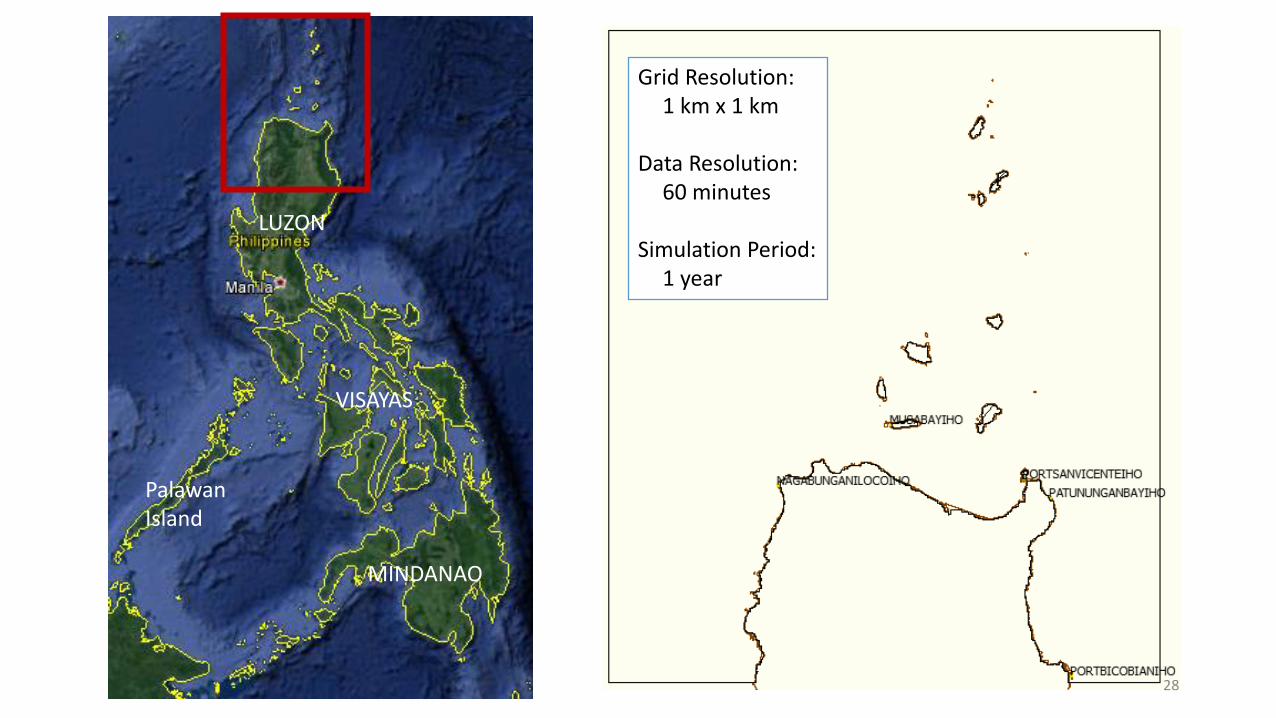
Grid Resolution: 1 km x 1 km
Data Resolution:
60 minutes Simulation Period:
1 year
LUZON
VISAYAS
MINDANAO
Palawan Island
28
-0.4
-0.3
-0.2
-0.1
0
0.1
0.2
0.3
0.4
0.5
-0.4 -0.3 -0.2 -0.1 0 0.1 0.2 0.3 0.4 0.5
Wat
er L
evel
fro
m D
elft
3D
, m
Water Level from IHO Station, m
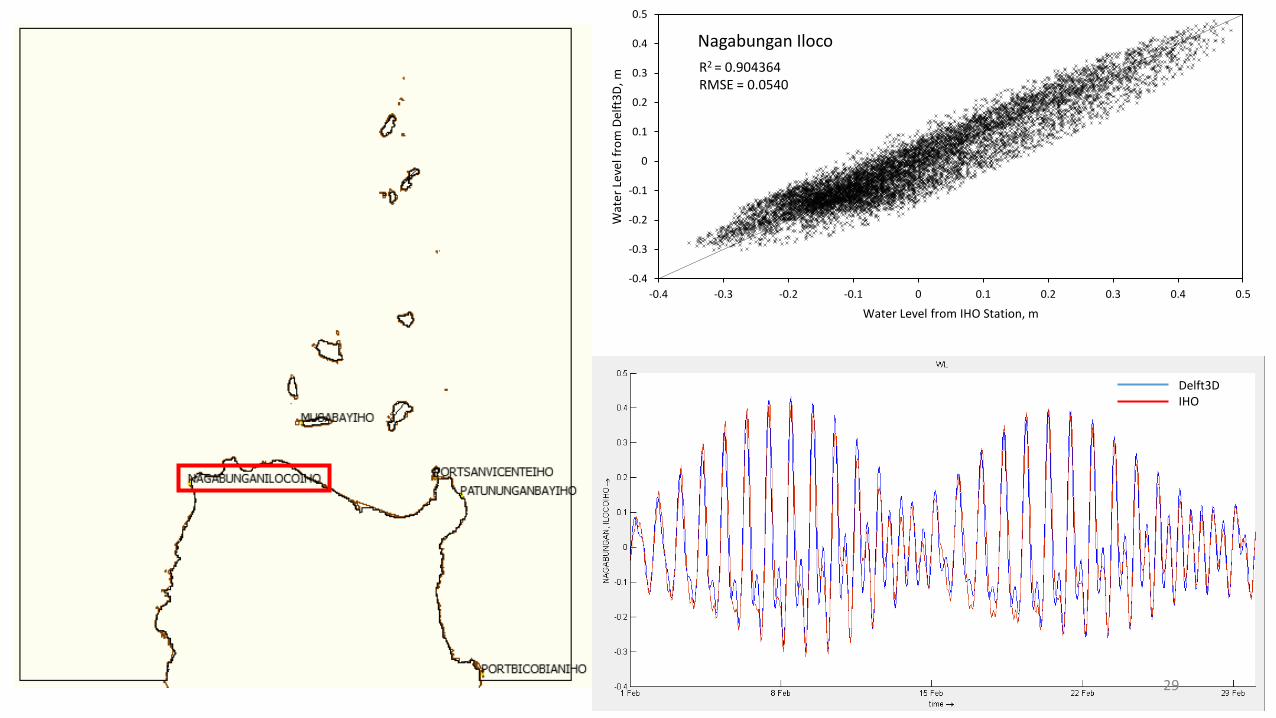
Nagabungan Iloco
R2 = 0.904364 RMSE = 0.0540
Delft3D IHO
29
-0.6
-0.4
-0.2
0
0.2
0.4
0.6
-0.6 -0.4 -0.2 0 0.2 0.4 0.6
Wat
er L
evel
fro
m D
elft
3D
, m
Water Level from IHO Station, m
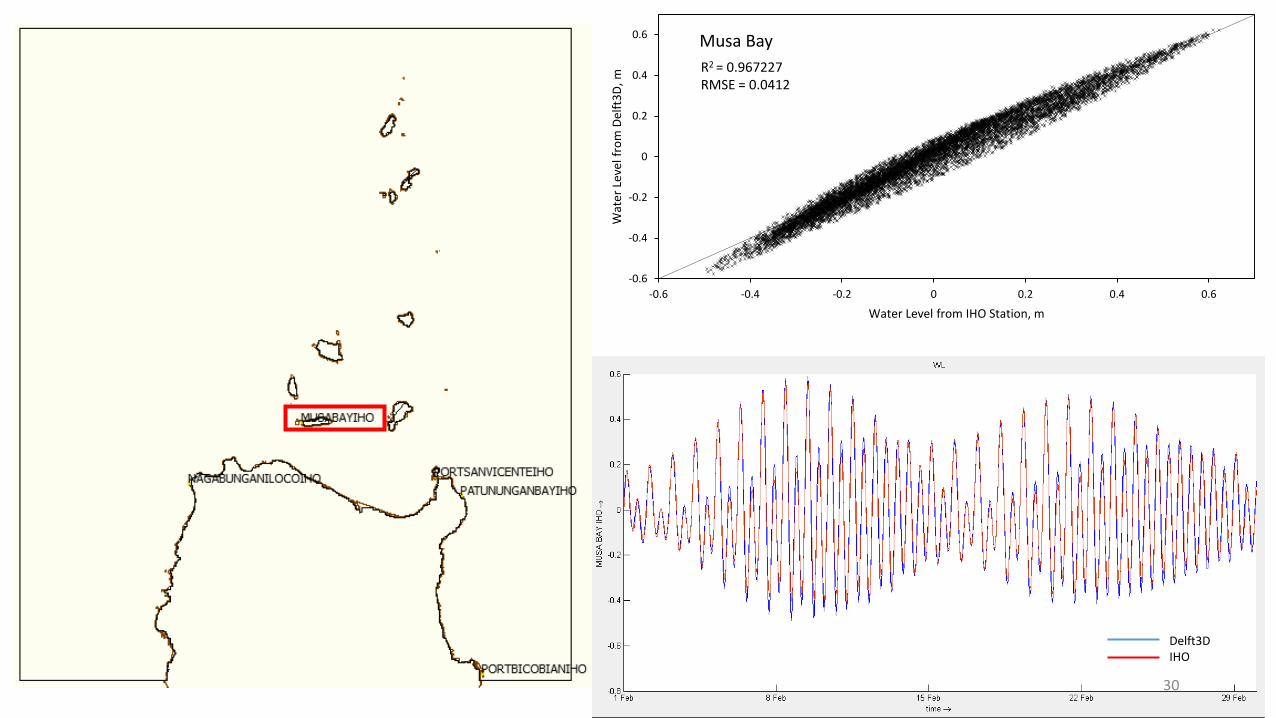
Musa Bay
R2 = 0.967227 RMSE = 0.0412
Delft3D IHO
30
-1
-0.8
-0.6
-0.4
-0.2
0
0.2
0.4
0.6
0.8
-1 -0.8 -0.6 -0.4 -0.2 0 0.2 0.4 0.6 0.8
Wat
er L
evel
fro
m D
elft
3D
, m
Water Level from IHO Station, m
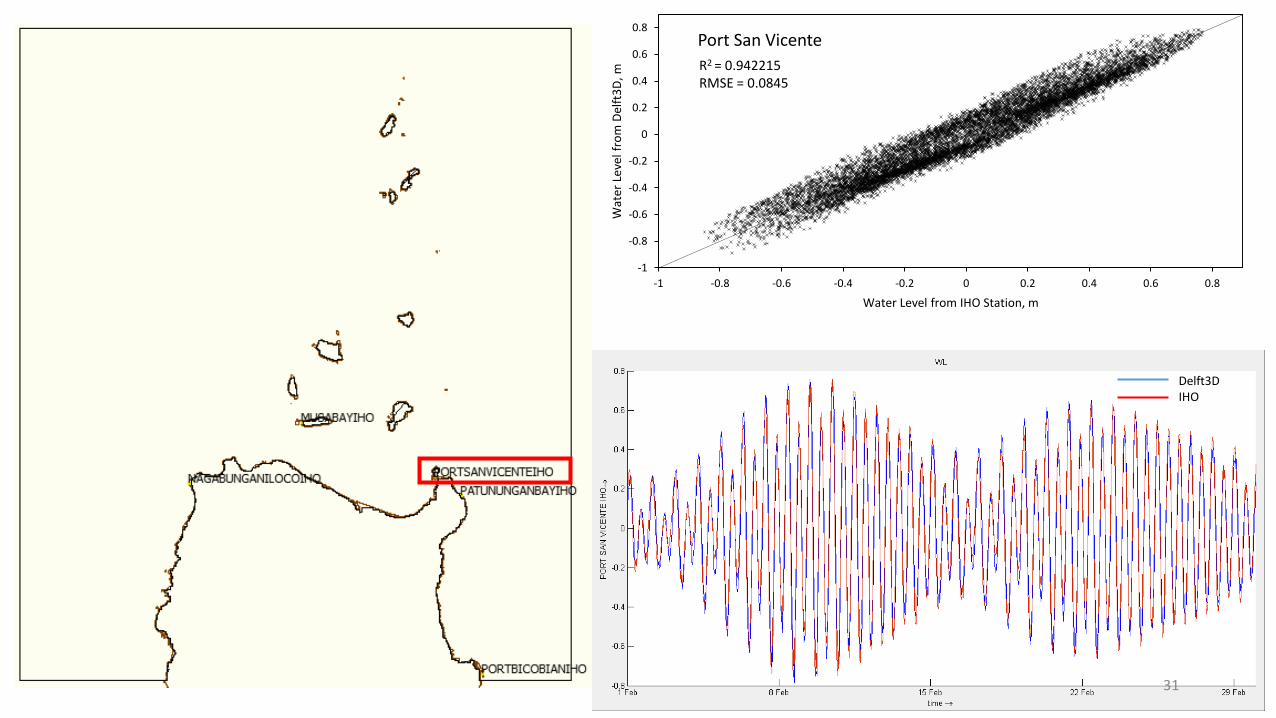
Port San Vicente
R2 = 0.942215 RMSE = 0.0845
Delft3D IHO
31
-1
-0.8
-0.6
-0.4
-0.2
0
0.2
0.4
0.6
0.8
-1 -0.8 -0.6 -0.4 -0.2 0 0.2 0.4 0.6 0.8
Wat
er L
evel
fro
m D
elft
3D
, m
Water Level from IHO Station, m
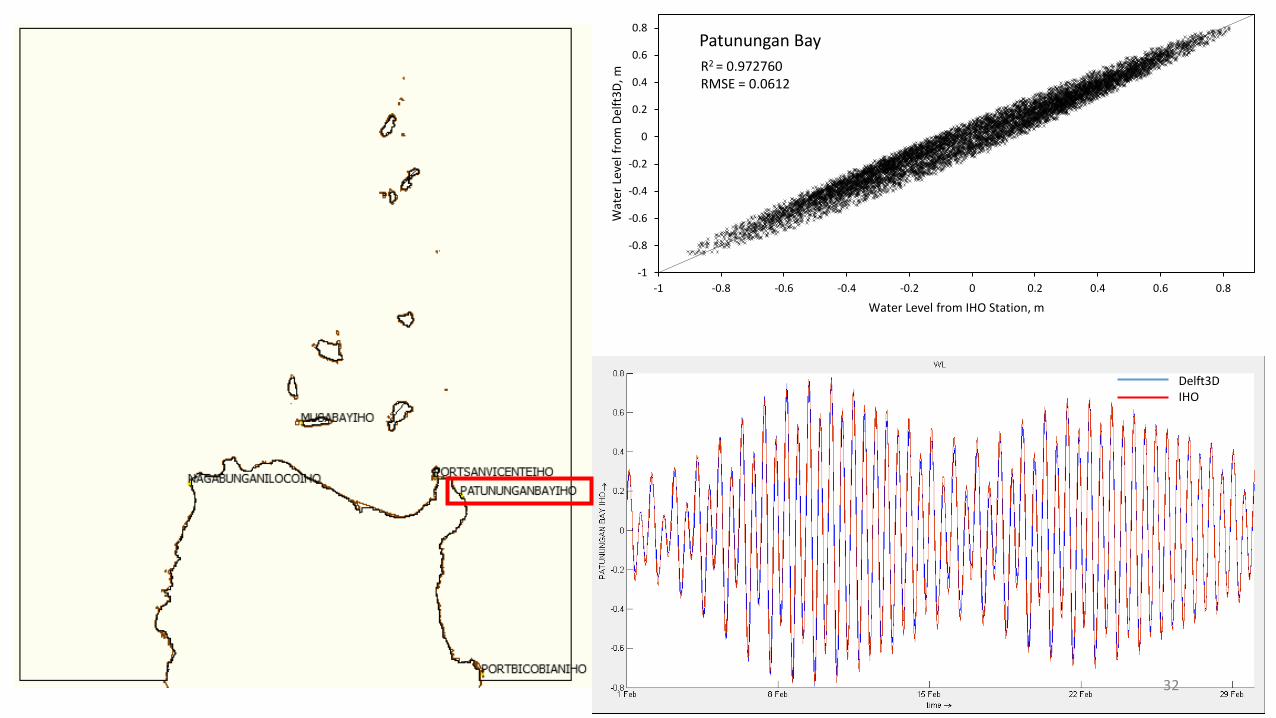
Patunungan Bay
R2 = 0.972760 RMSE = 0.0612
Delft3D IHO
32
-1.1
-0.6
-0.1
0.4
0.9
-1.1 -0.6 -0.1 0.4 0.9
Wat
er L
evel
fro
m D
elft
3D
, m
Water Level from IHO Station, m
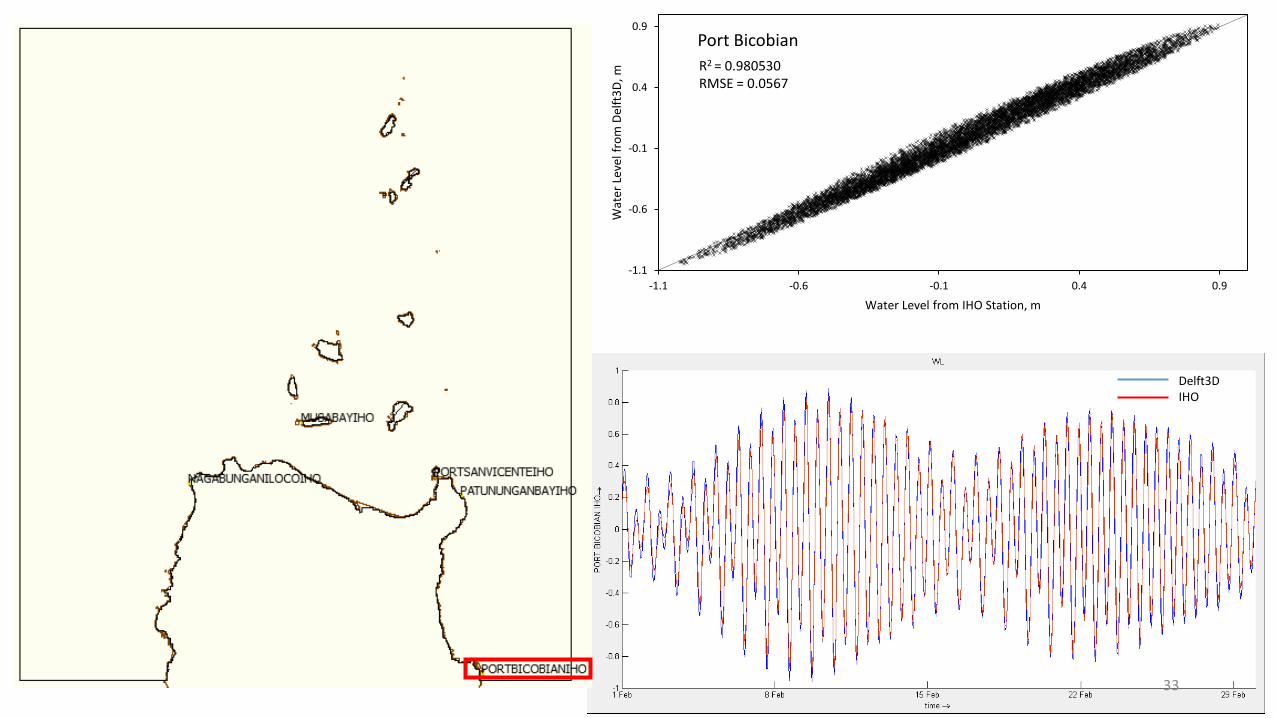
Port Bicobian
R2 = 0.980530 RMSE = 0.0567
Delft3D IHO
33
-1.2
-0.7
-0.2
0.3
0.8
-1.2 -0.7 -0.2 0.3 0.8
Wat
er L
evel
fro
m D
elft
3D
, m
Water Level from IHO Station, m
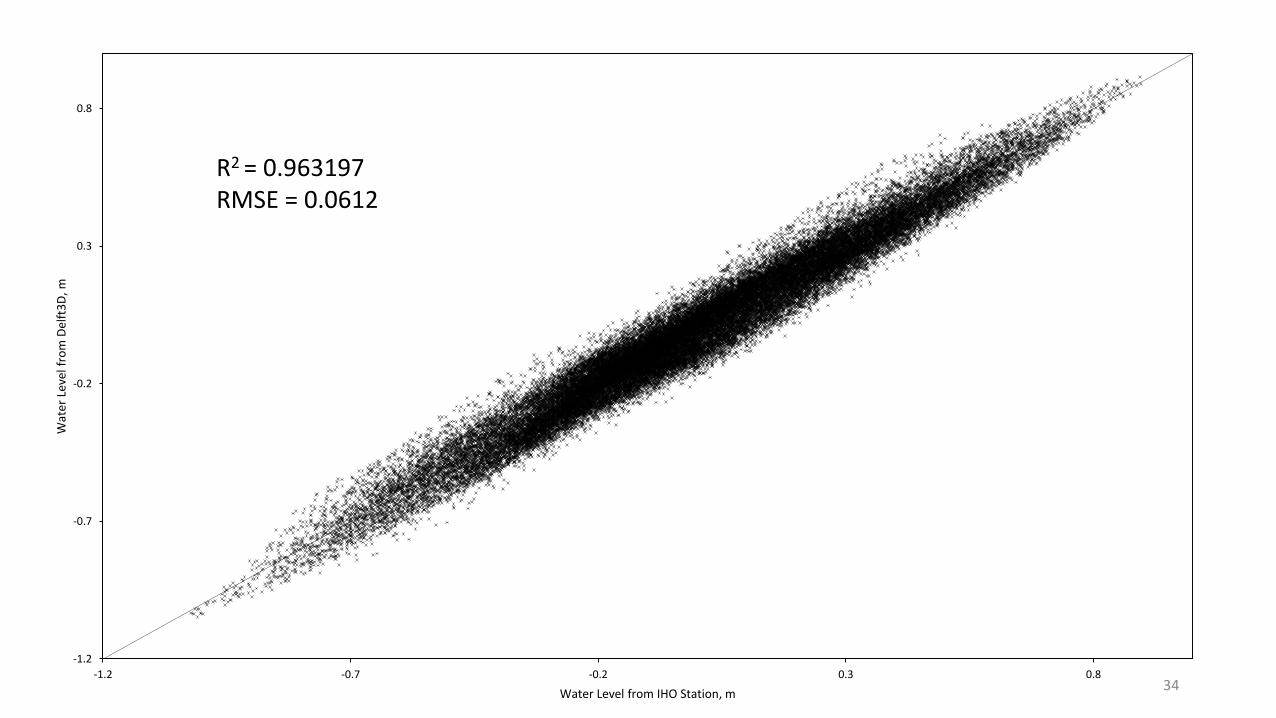
R2 = 0.963197 RMSE = 0.0612
34
35
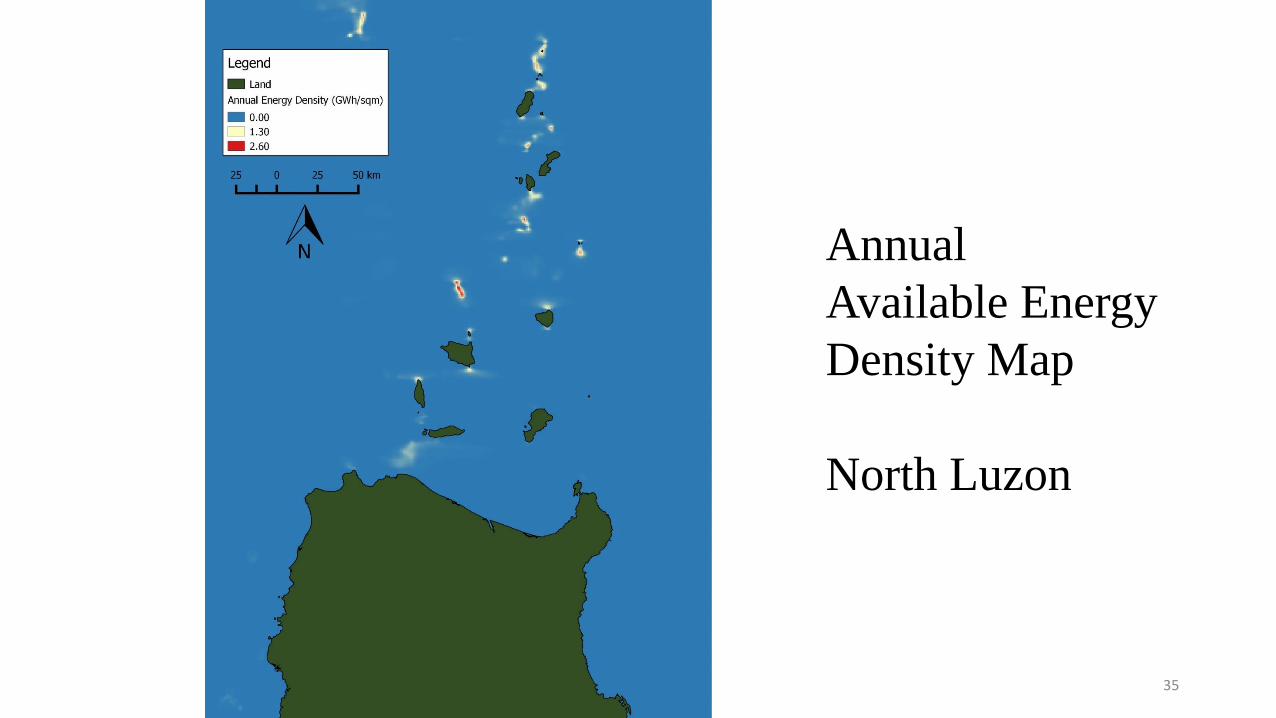
Annual
Available Energy
Density Map
North Luzon
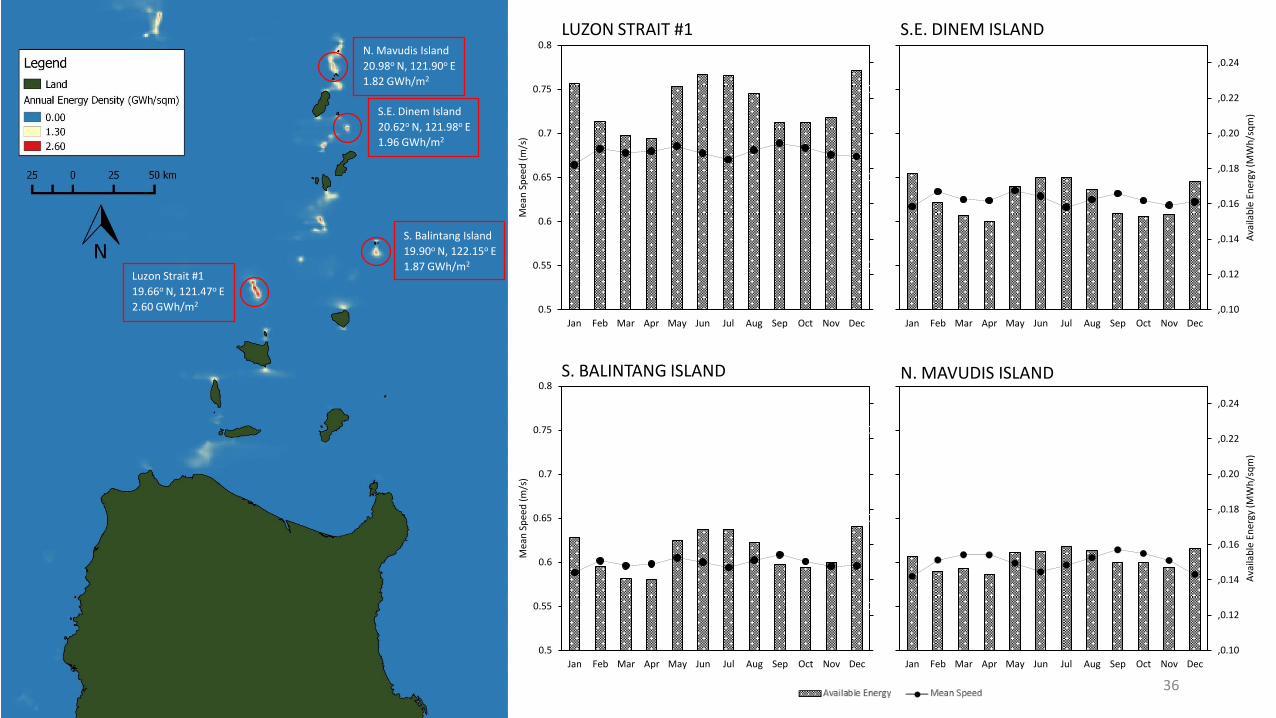
N. Mavudis Island
20.98o N, 121.90o E
1.82 GWh/m2
S.E. Dinem Island
20.62o N, 121.98o E
1.96 GWh/m2
S. Balintang Island
19.90o N, 122.15o E
1.87 GWh/m2 Luzon Strait #1
19.66o N, 121.47o E
2.60 GWh/m2
S. BALINTANG ISLAND
S.E. DINEM ISLAND
N. MAVUDIS ISLAND
LUZON STRAIT #1
,0.10
,0.12
,0.14
,0.16
,0.18
,0.20
,0.22
,0.24
0.5
0.55
0.6
0.65
0.7
0.75
0.8
Jan Feb Mar Apr May Jun Jul Aug Sep Oct Nov Dec
Mea
n S
pee
d (
m/s
)
,0.10
,0.12
,0.14
,0.16
,0.18
,0.20
,0.22
,0.24
0.5
0.55
0.6
0.65
0.7
0.75
0.8
Jan Feb Mar Apr May Jun Jul Aug Sep Oct Nov Dec
Mea
n S
pee
d (
m/s
)
,0.10
,0.12
,0.14
,0.16
,0.18
,0.20
,0.22
,0.24
0.5
0.55
0.6
0.65
0.7
0.75
0.8
Jan Feb Mar Apr May Jun Jul Aug Sep Oct Nov Dec
Ava
ilab
le E
ner
gy (
MW
h/s
qm
)
,0.10
,0.12
,0.14
,0.16
,0.18
,0.20
,0.22
,0.24
0.5
0.55
0.6
0.65
0.7
0.75
0.8
Jan Feb Mar Apr May Jun Jul Aug Sep Oct Nov Dec
Ava
ilab
le E
ner
gy (
MW
h/s
qm
)
36
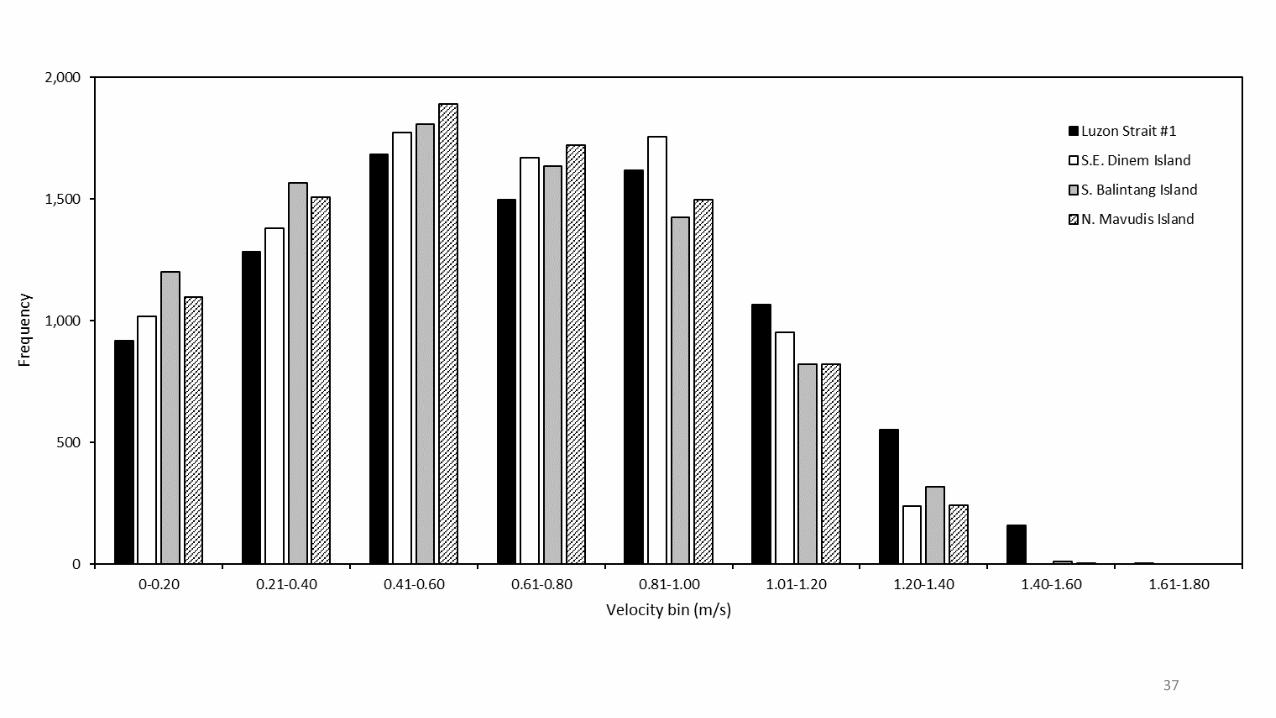
37
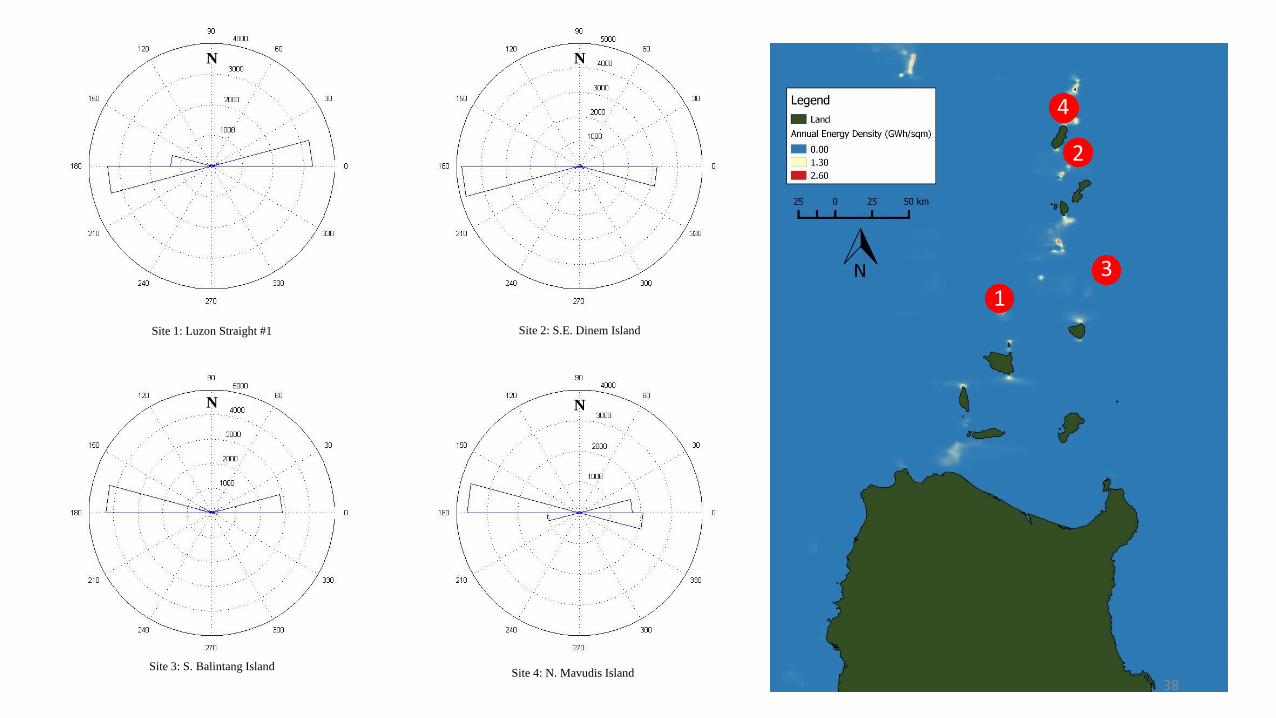
N N
N N
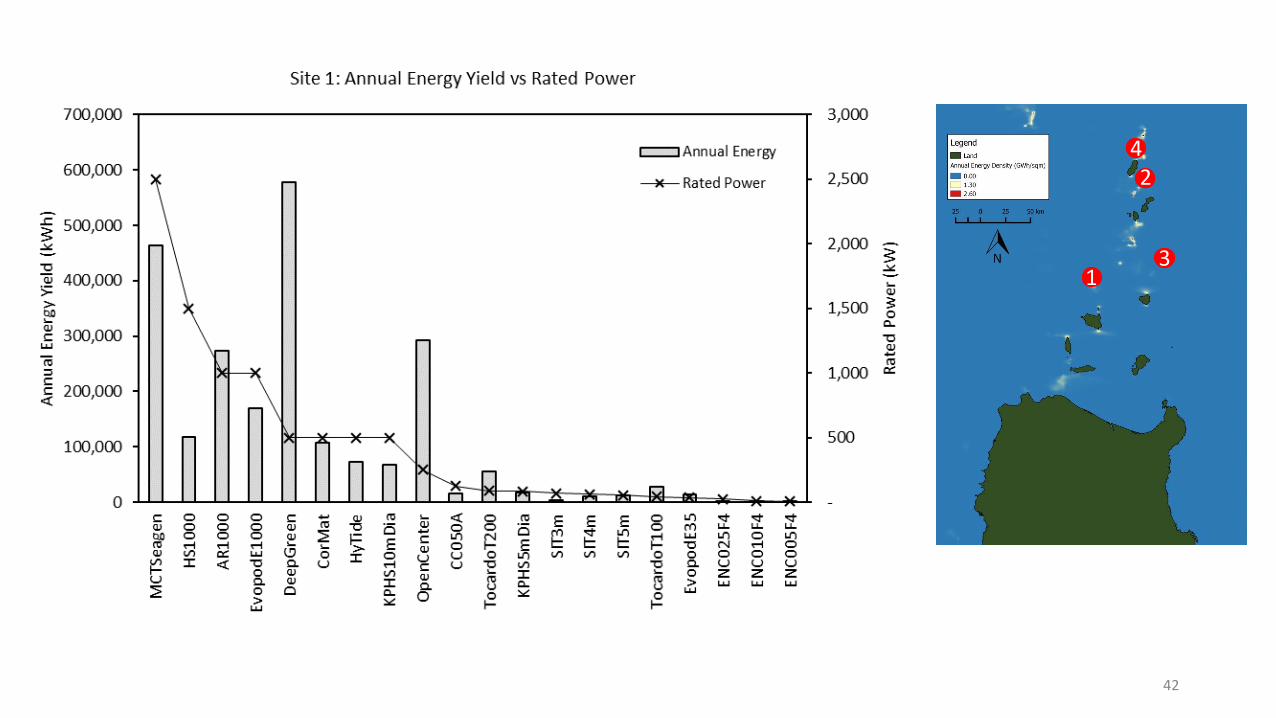
Site 1: Luzon Straight #1 Site 2: S.E. Dinem Island
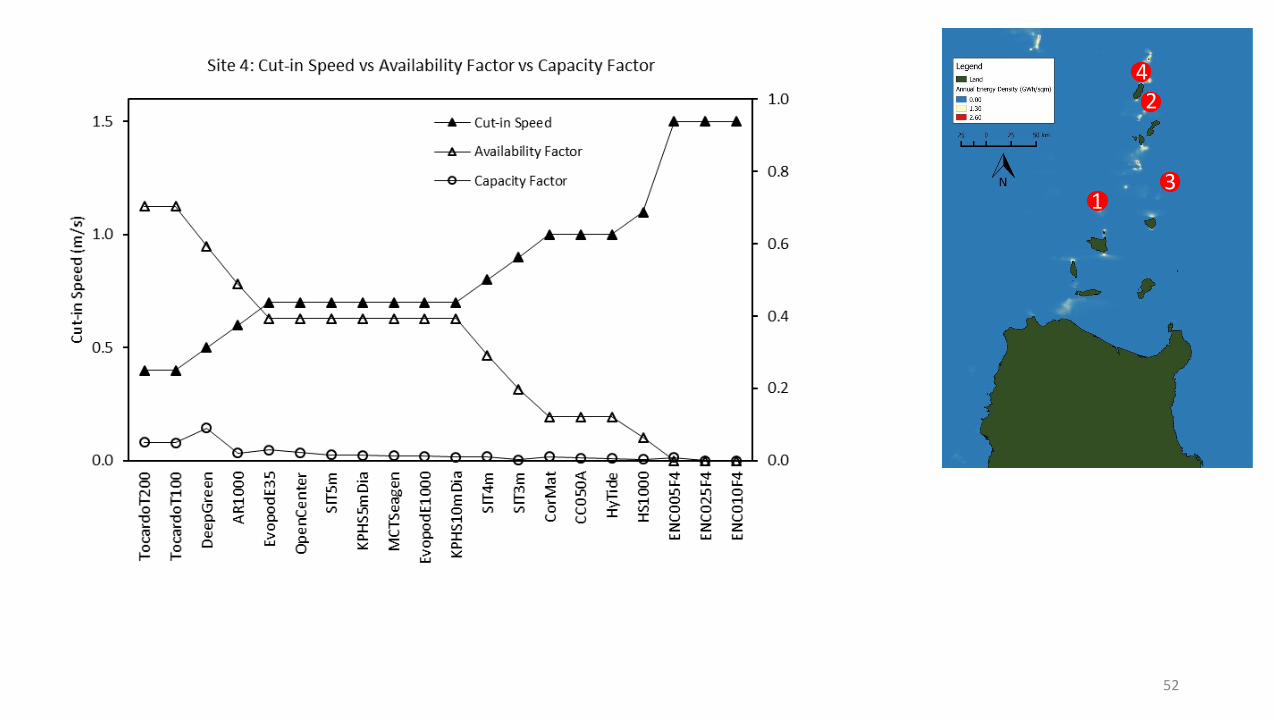
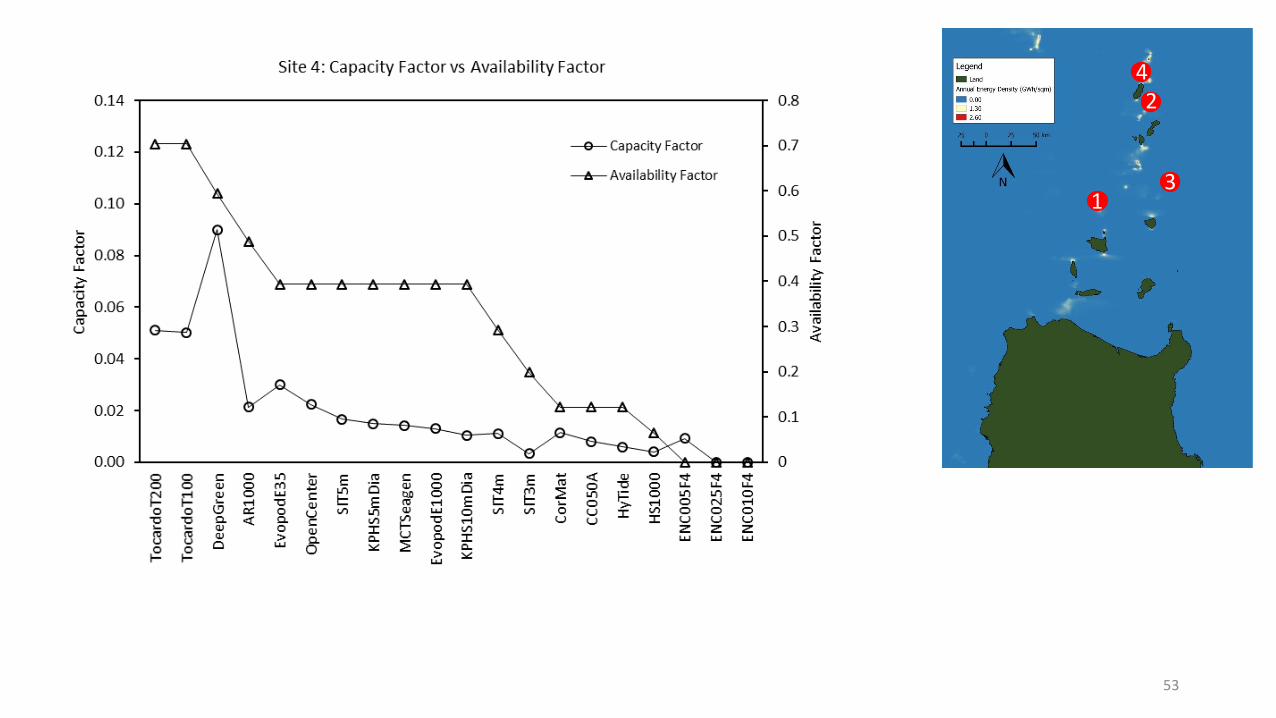
Site 3: S. Balintang Island Site 4: N. Mavudis Island
1
2
3
4
38

39
RESOURCE-DEVICE
SUITABILITY ANALYSIS
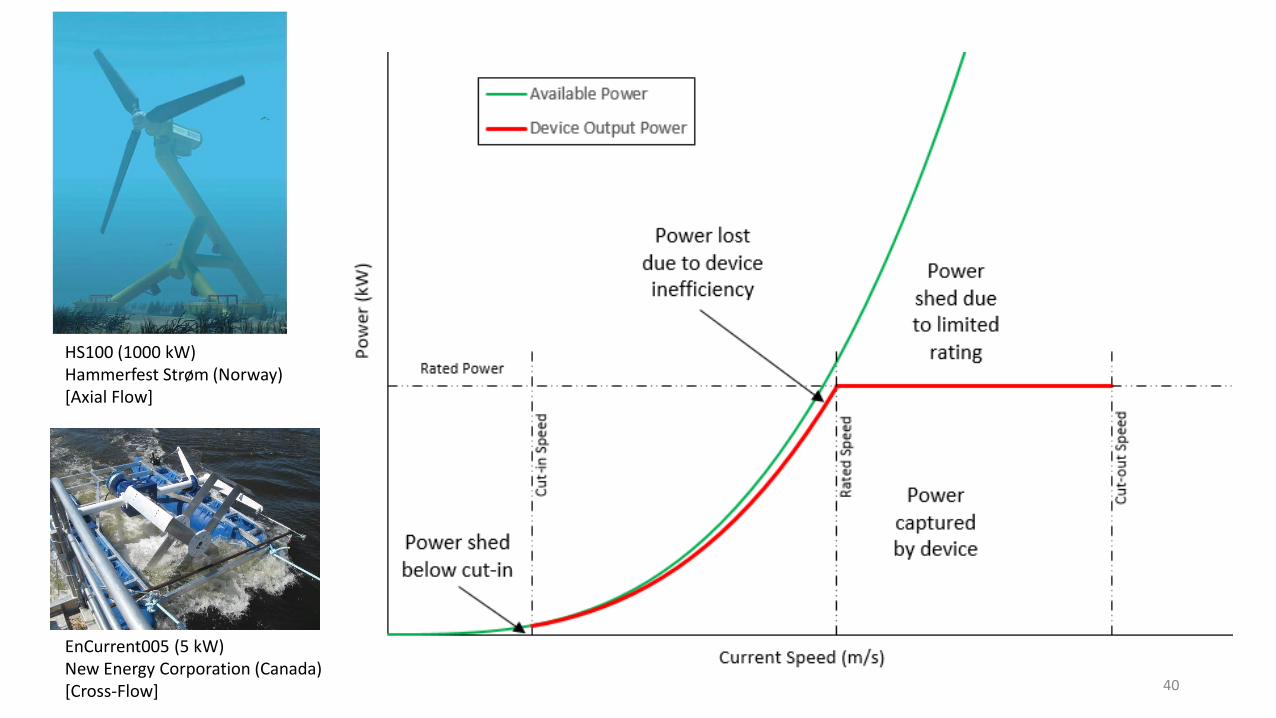
HS100 (1000 kW) Hammerfest Strøm (Norway) [Axial Flow]
EnCurrent005 (5 kW) New Energy Corporation (Canada) [Cross-Flow] 40
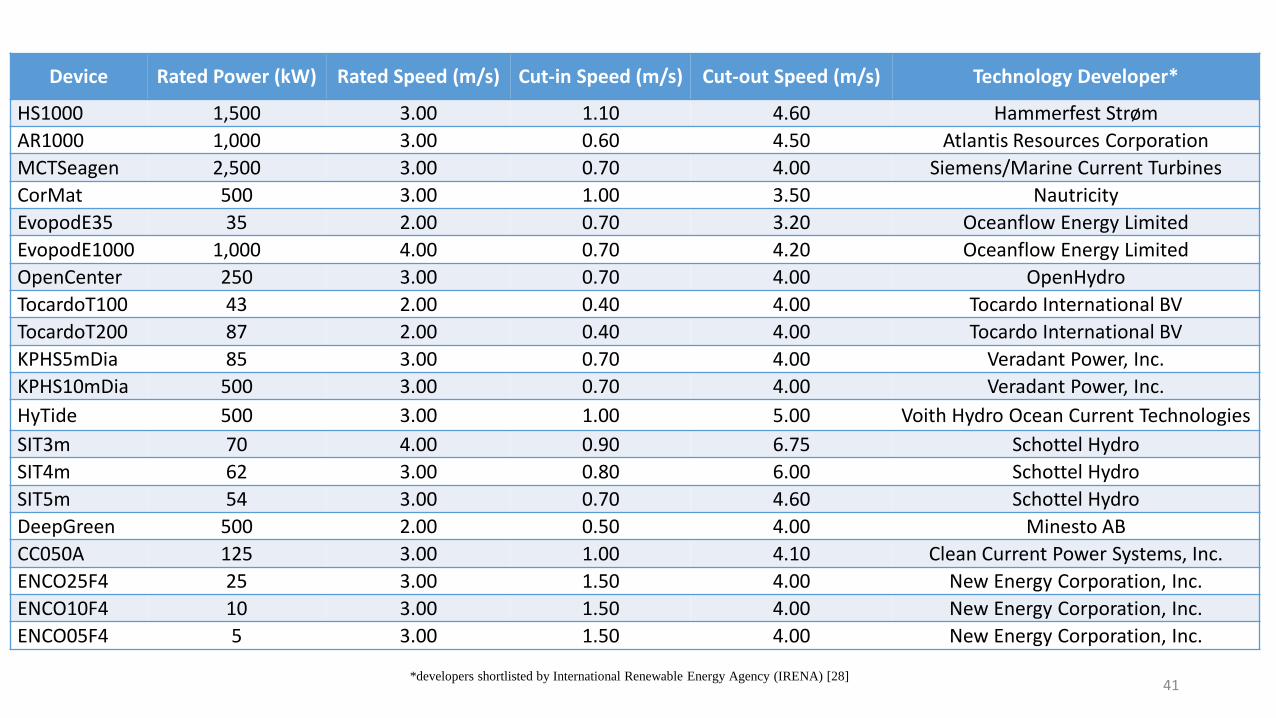
Device Rated Power (kW) Rated Speed (m/s) Cut-in Speed (m/s) Cut-out Speed (m/s) Technology Developer*
HS1000 1,500 3.00 1.10 4.60 Hammerfest Strøm
AR1000 1,000 3.00 0.60 4.50 Atlantis Resources Corporation
MCTSeagen 2,500 3.00 0.70 4.00 Siemens/Marine Current Turbines
CorMat 500 3.00 1.00 3.50 Nautricity
EvopodE35 35 2.00 0.70 3.20 Oceanflow Energy Limited
EvopodE1000 1,000 4.00 0.70 4.20 Oceanflow Energy Limited
OpenCenter 250 3.00 0.70 4.00 OpenHydro
TocardoT100 43 2.00 0.40 4.00 Tocardo International BV
TocardoT200 87 2.00 0.40 4.00 Tocardo International BV
KPHS5mDia 85 3.00 0.70 4.00 Veradant Power, Inc.
KPHS10mDia 500 3.00 0.70 4.00 Veradant Power, Inc.
HyTide 500 3.00 1.00 5.00 Voith Hydro Ocean Current Technologies
SIT3m 70 4.00 0.90 6.75 Schottel Hydro
SIT4m 62 3.00 0.80 6.00 Schottel Hydro
SIT5m 54 3.00 0.70 4.60 Schottel Hydro
DeepGreen 500 2.00 0.50 4.00 Minesto AB
CC050A 125 3.00 1.00 4.10 Clean Current Power Systems, Inc.
ENCO25F4 25 3.00 1.50 4.00 New Energy Corporation, Inc.
ENCO10F4 10 3.00 1.50 4.00 New Energy Corporation, Inc.
ENCO05F4 5 3.00 1.50 4.00 New Energy Corporation, Inc.
*developers shortlisted by International Renewable Energy Agency (IRENA) [28] 41
1
2
3
4
42
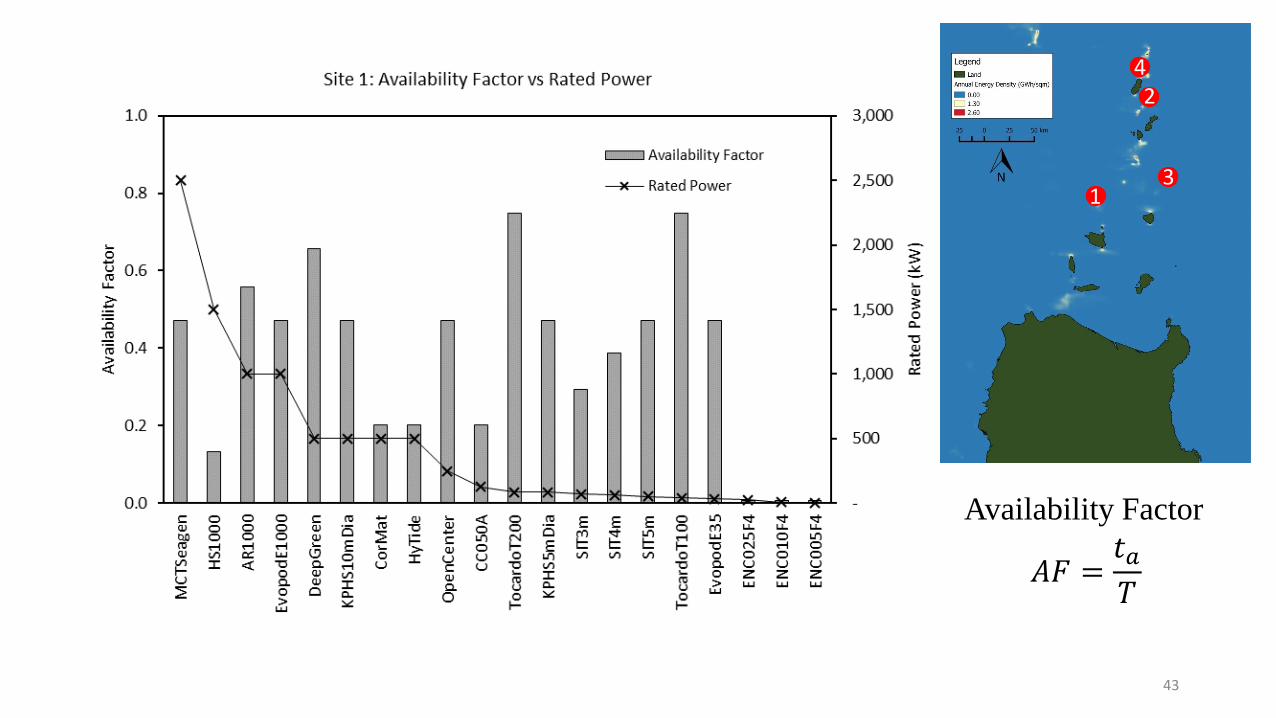
𝐴𝐹 =𝑡𝑎𝑇
Availability Factor
43
1
2
3
4
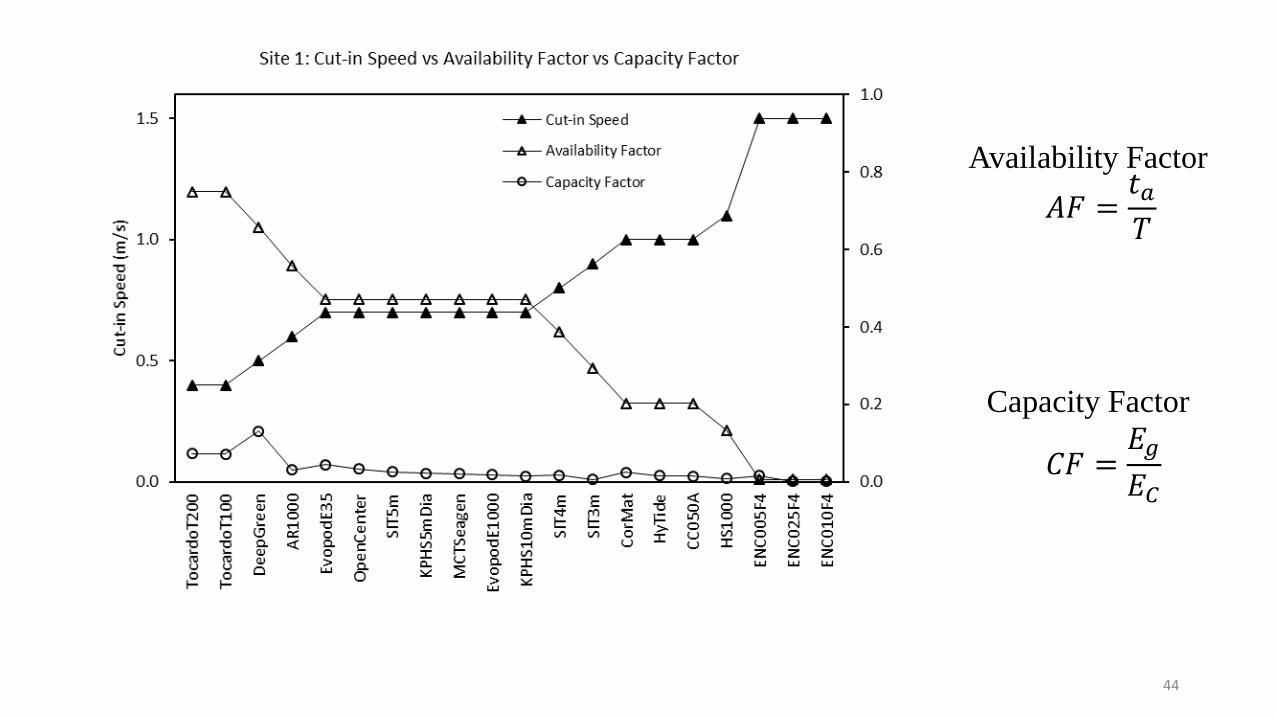
𝐴𝐹 =𝑡𝑎𝑇
𝐶𝐹 =𝐸𝑔
𝐸𝐶
Availability Factor
Capacity Factor
44
45
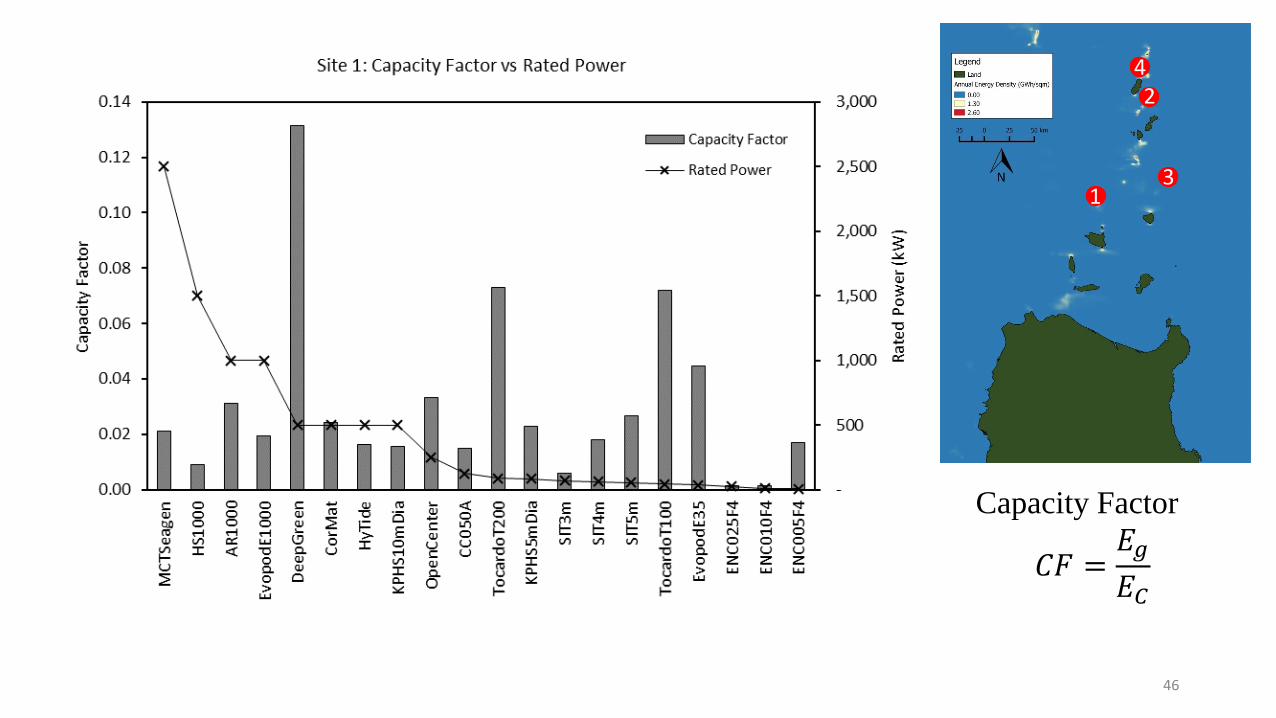
𝐶𝐹 =𝐸𝑔
𝐸𝐶
Capacity Factor
46
1
2
3
4
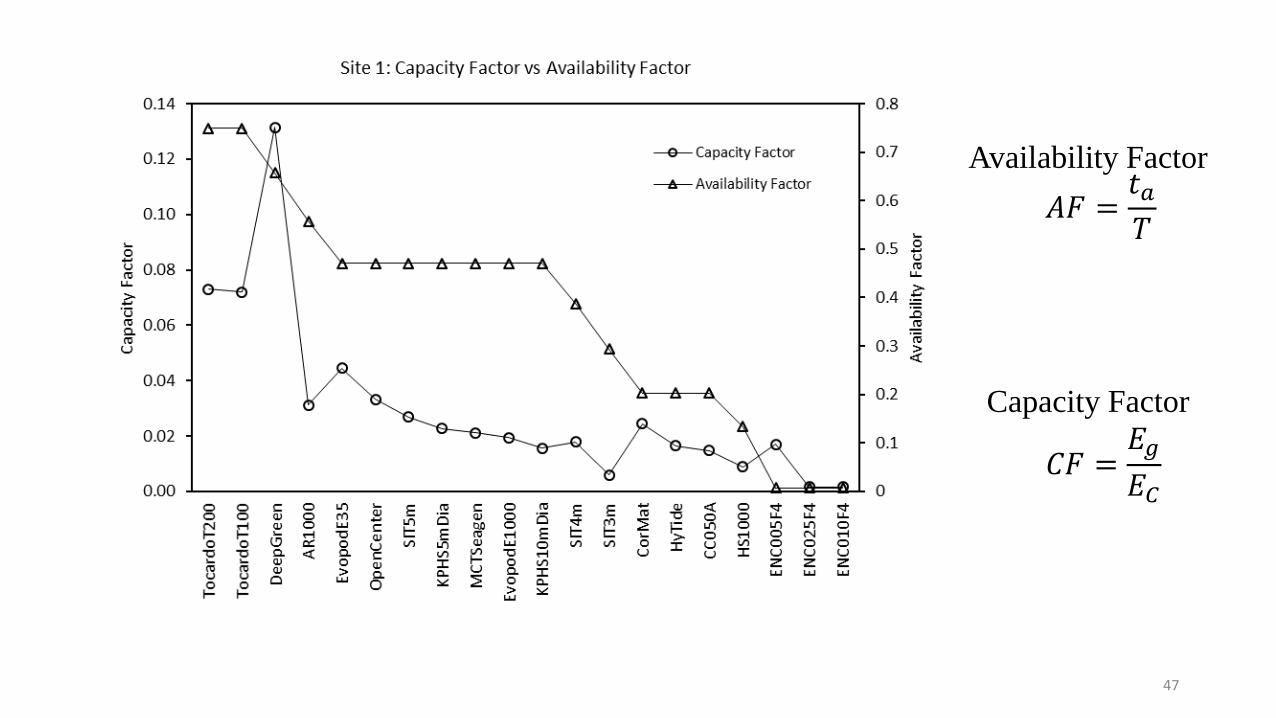
𝐴𝐹 =𝑡𝑎𝑇
𝐶𝐹 =𝐸𝑔
𝐸𝐶
Availability Factor
Capacity Factor
47
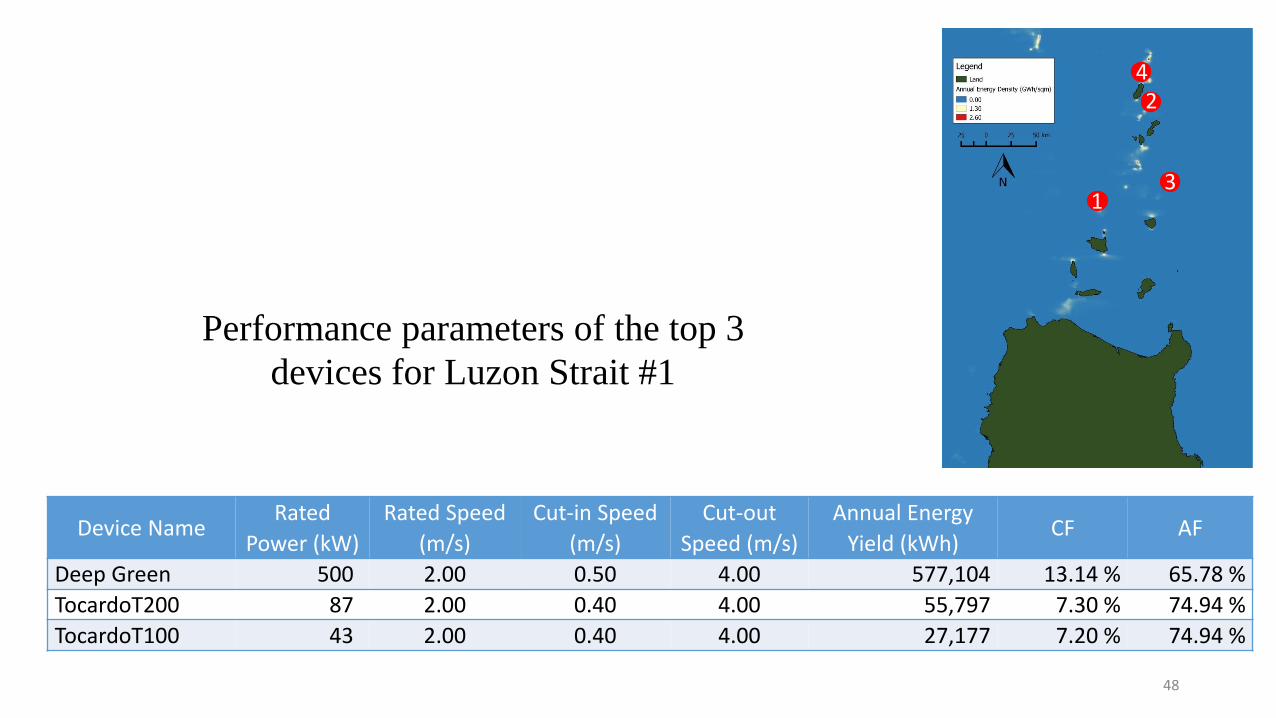
Device Name Rated
Power (kW)
Rated Speed
(m/s)
Cut-in Speed
(m/s)
Cut-out
Speed (m/s)
Annual Energy
Yield (kWh) CF AF
Deep Green 500 2.00 0.50 4.00 577,104 13.14 % 65.78 %
TocardoT200 87 2.00 0.40 4.00 55,797 7.30 % 74.94 %
TocardoT100 43 2.00 0.40 4.00 27,177 7.20 % 74.94 %
Performance parameters of the top 3
devices for Luzon Strait #1
1
2
3
4
48
1
2
3
4
49
1
2
3
4
50
1
2
3
4
51
1
2
3
4
52
1
2
3
4
53
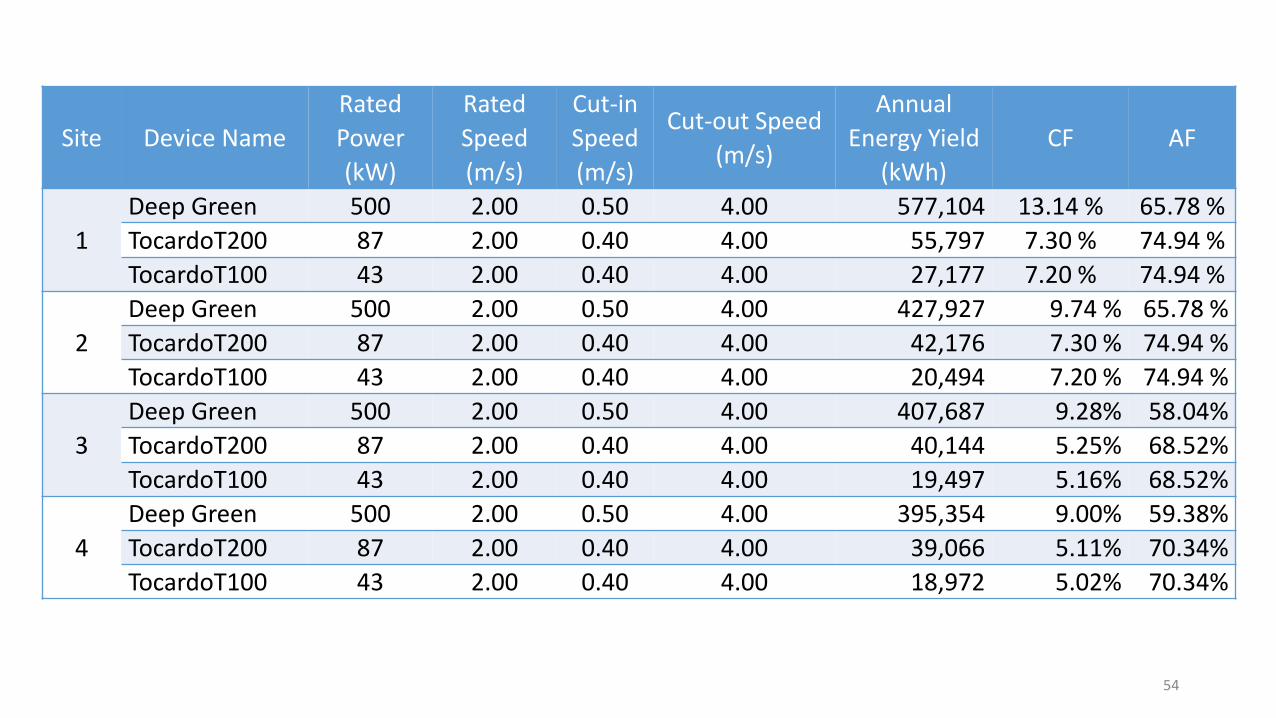
Site Device Name
Rated
Power
(kW)
Rated
Speed
(m/s)
Cut-in
Speed
(m/s)
Cut-out Speed
(m/s)
Annual
Energy Yield
(kWh)
CF AF
1
Deep Green 500 2.00 0.50 4.00 577,104 13.14 % 65.78 %
TocardoT200 87 2.00 0.40 4.00 55,797 7.30 % 74.94 %
TocardoT100 43 2.00 0.40 4.00 27,177 7.20 % 74.94 %
2
Deep Green 500 2.00 0.50 4.00 427,927 9.74 % 65.78 %
TocardoT200 87 2.00 0.40 4.00 42,176 7.30 % 74.94 %
TocardoT100 43 2.00 0.40 4.00 20,494 7.20 % 74.94 %
3
Deep Green 500 2.00 0.50 4.00 407,687 9.28% 58.04%
TocardoT200 87 2.00 0.40 4.00 40,144 5.25% 68.52%
TocardoT100 43 2.00 0.40 4.00 19,497 5.16% 68.52%
4
Deep Green 500 2.00 0.50 4.00 395,354 9.00% 59.38%
TocardoT200 87 2.00 0.40 4.00 39,066 5.11% 70.34%
TocardoT100 43 2.00 0.40 4.00 18,972 5.02% 70.34%
54

55
PROJECT PROGRESS
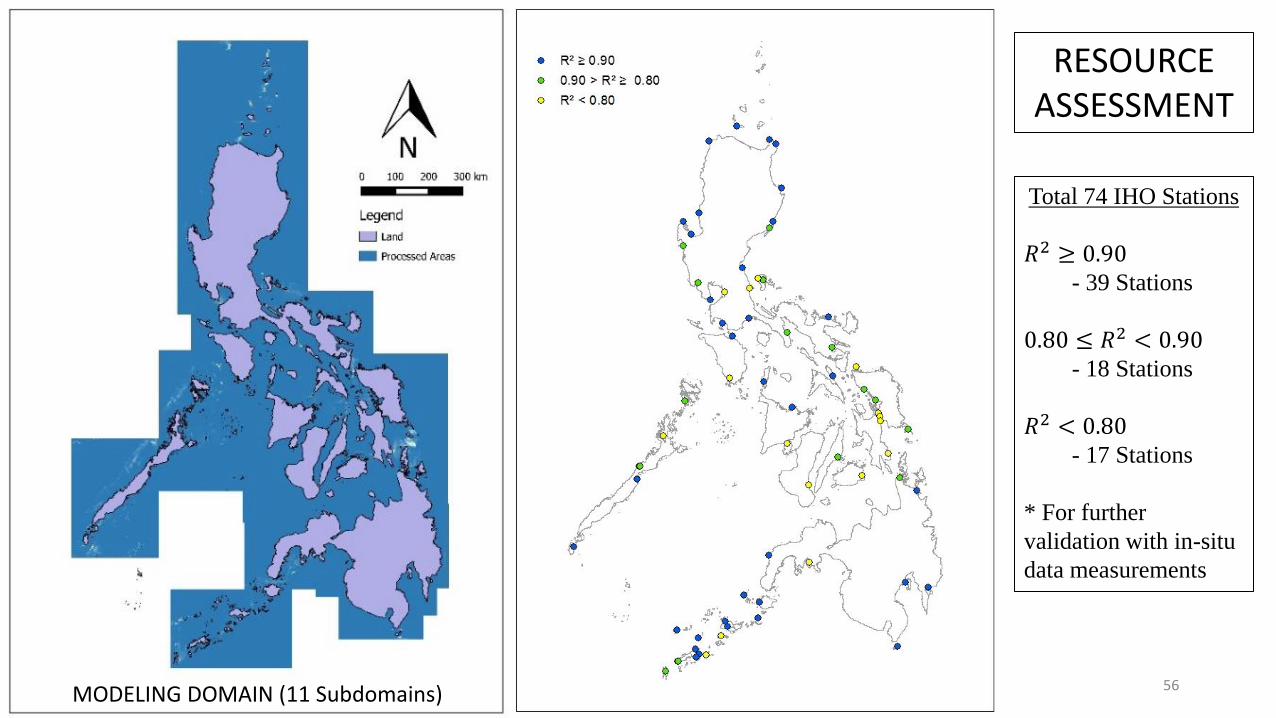
MODELING DOMAIN (11 Subdomains)
Total 74 IHO Stations
𝑅2 ≥ 0.90
- 39 Stations
0.80 ≤ 𝑅2 < 0.90
- 18 Stations
𝑅2 < 0.80
- 17 Stations
* For further
validation with in-situ
data measurements
56
RESOURCE ASSESSMENT
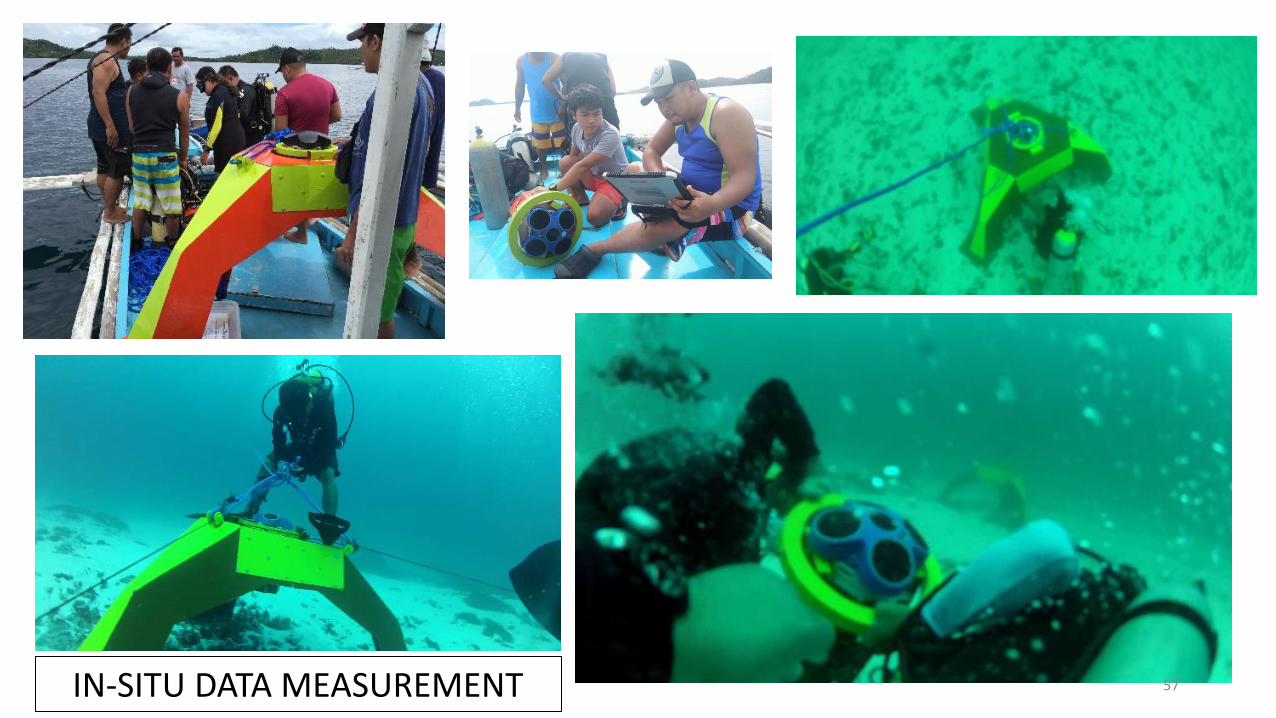
IN-SITU DATA MEASUREMENT 57
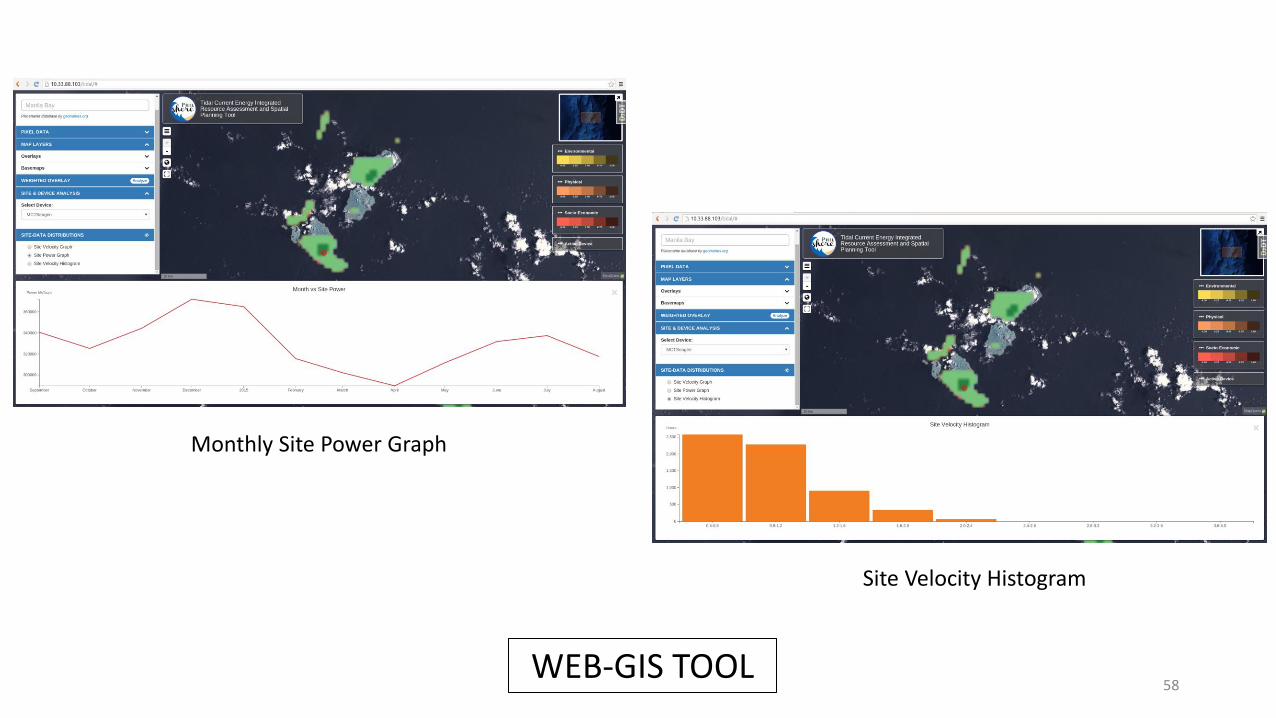
WEB-GIS TOOL
Monthly Site Power Graph
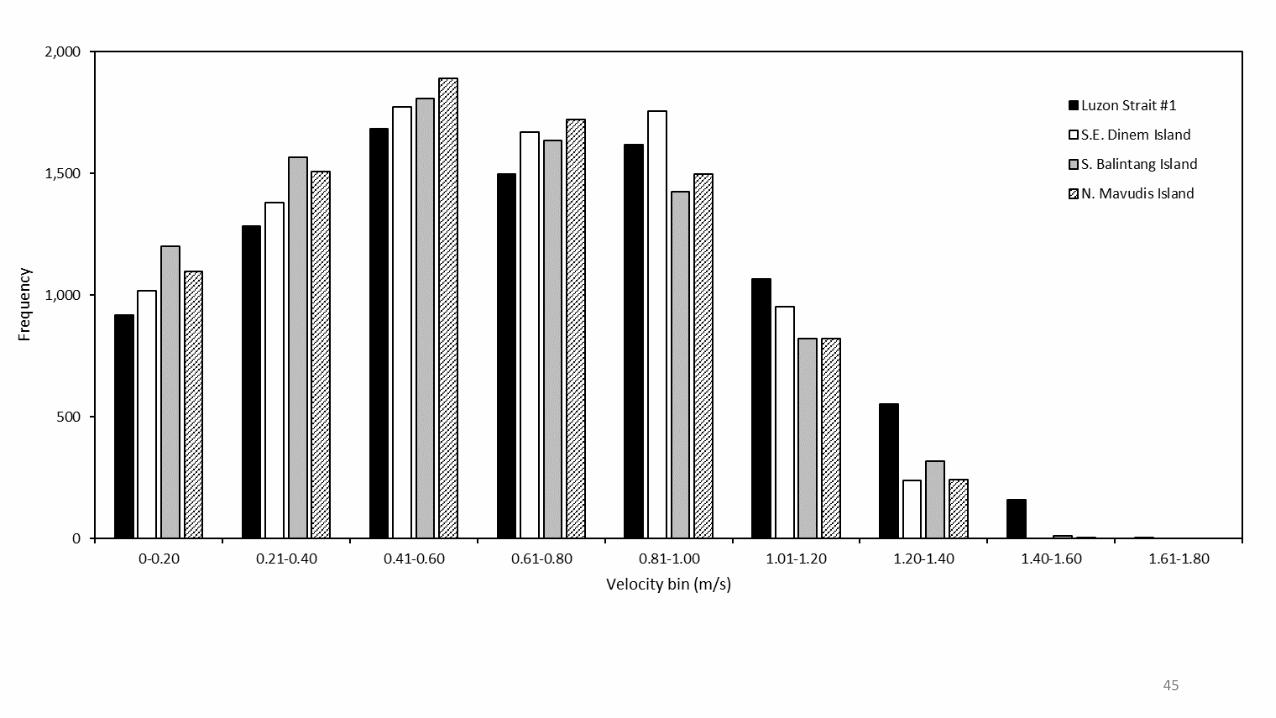
Site Velocity Histogram
58

Tidal Current Energy Integrated Resource Assessment and Spatial Planning Tool
Training Center for Applied Geodesy and Photogrammetry MH 406 Melchor Hall, College of Engineering
University of the Philippines Diliman, Quezon City
Department of Science and Technology Philippine Council for Industry, Energy and Emerging Technology
for Research and Development (PCIEERD)
Republic of the Philippines
U.P. Marine Science Institute University of the Philippines Diliman, Quezon City
U.P. Department of Mechanical Engineering University of the Philippines Diliman, Quezon City
59

60 THANK YOU