Embed Size (px)
Citation preview
Neo4j + Tableau Visual Analytics
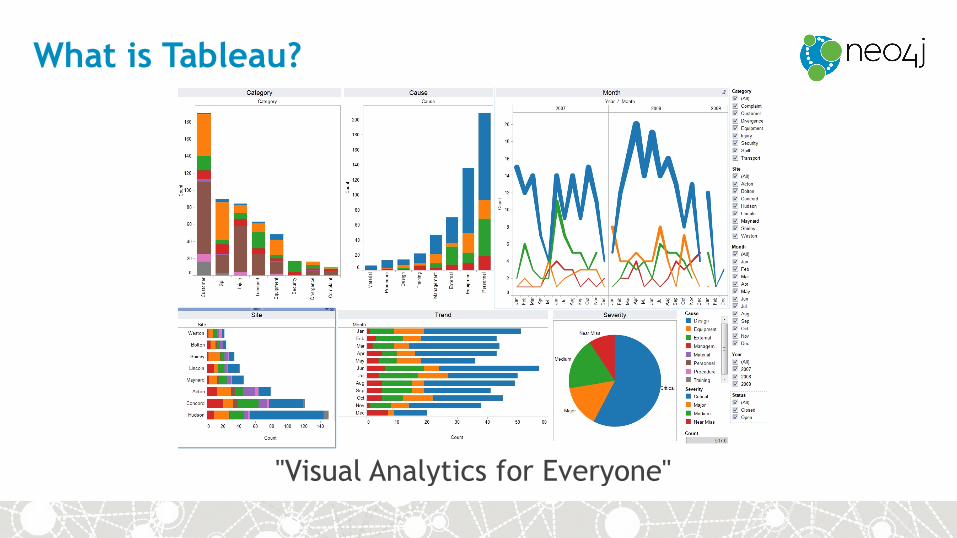
What is Tableau?
"Visual Analytics for Everyone"
But, but... those aren't graphs!
So why is this a good idea?
• Tableau is a market leader for Business Intelligence *
• Super easy to use for "normal" users
• Sometimes, tables are a useful way to look at graphs
* http://www.tableau.com/gartner-magic-quadrant-2015
(neo4j) --> (tableau) 3 ways
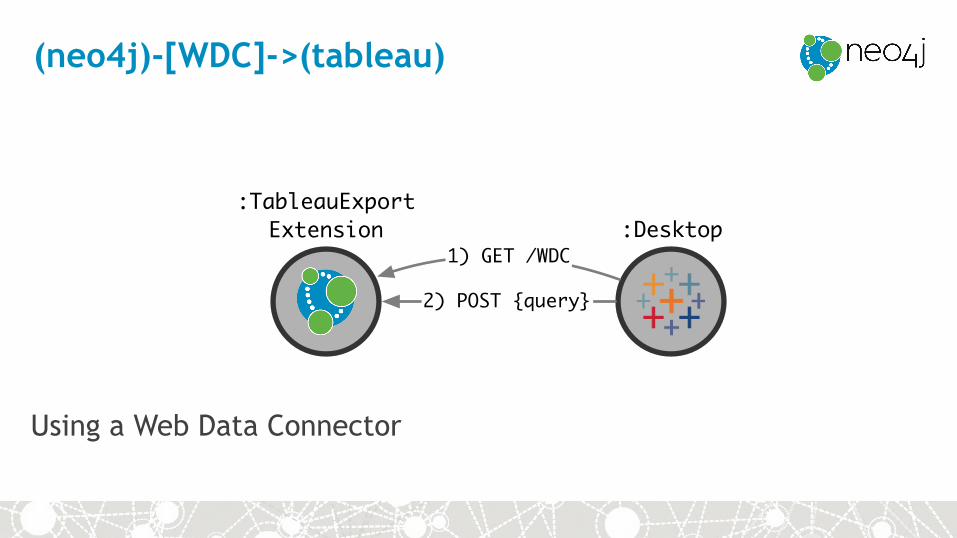
Using a Web Data Connector
(neo4j)-[WDC]->(tableau)
:Desktop:TableauExport
Extension1) GET /WDC
2) POST {query}
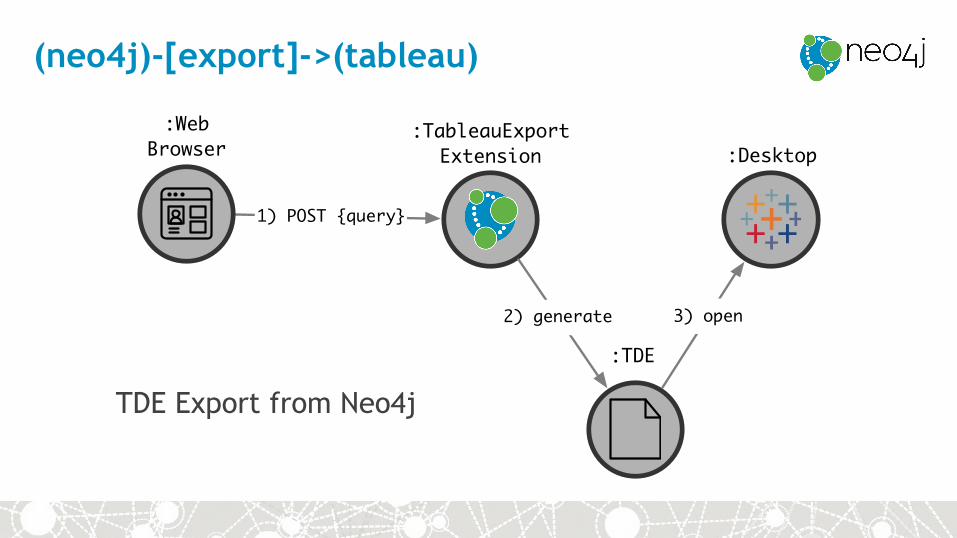
(neo4j)-[export]->(tableau)
TDE Export from Neo4j
:Desktop:TableauExport
Extension
1) POST {query}
:TDE
2) generate
:Web Browser
3) open
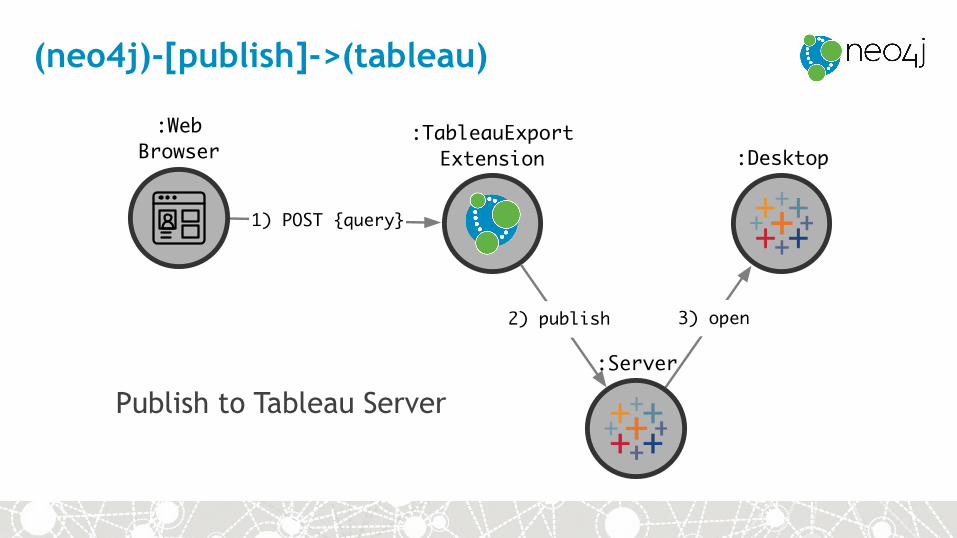
:Desktop:TableauExport
Extension
1) POST {query}
2) publish
:Web Browser
3) open
:Server
(neo4j)-[publish]->(tableau)
Publish to Tableau Server
What's the plan?
• Beta releases by the end of the year
• Limited to queries which return primitive values
• For graphy stuff, return calculated values
• path lengths, node degrees
• Some day, Tableau will learn about graph-graphs
• Node, Relationships, Paths, Subgraphs
* http://www.tableau.com/gartner-magic-quadrant-2015