Embed Size (px)
Citation preview
Planet-HTML5-Game-Engine Javascript Performance
Enhancement
2015. 2. 5. SeungWook Jeong ([email protected])
Prerequisite Background• V8 Javascript Engine Internals
• Hidden Classes
• Tagged Values
• Array Implementation
• Full Compiler, Optimization Compiler, and Deoptimization
• Garbage Collection
• Chrome DevTools
• Timeline
• CPU/Memory Profiling

Planet-HTML5-Game-Engine
• HTML5 Game Engine for Mobile Devices
• Commercially-proven HTML5 game engine based on canvas and DOM/GPU
• Used by “OK CashbagTM” Android App
• Originally Developed and Sponsored by SK planet co., Ltd.
• Hosted at https://github.com/SK-Planet-WebTechTeam/Planet-HTML5-Game-Engine
Let’s Profile It First!• Device Model : SM-G850S (Samsung Galaxy Alpha)
• Android Version : Kitkat 4.4.4
• Web Browser : Chrome 35.0.1916.141
• Tested Application : Cashpang Game (Served at “OK CashbagTM” Android App)
• Timeline, CPU Profiling, Memory Profiling Data from Chrome DevTools (Remote Debugging through USB)
• Machine Code Optimization Logs from Mac OS Chrome Browser
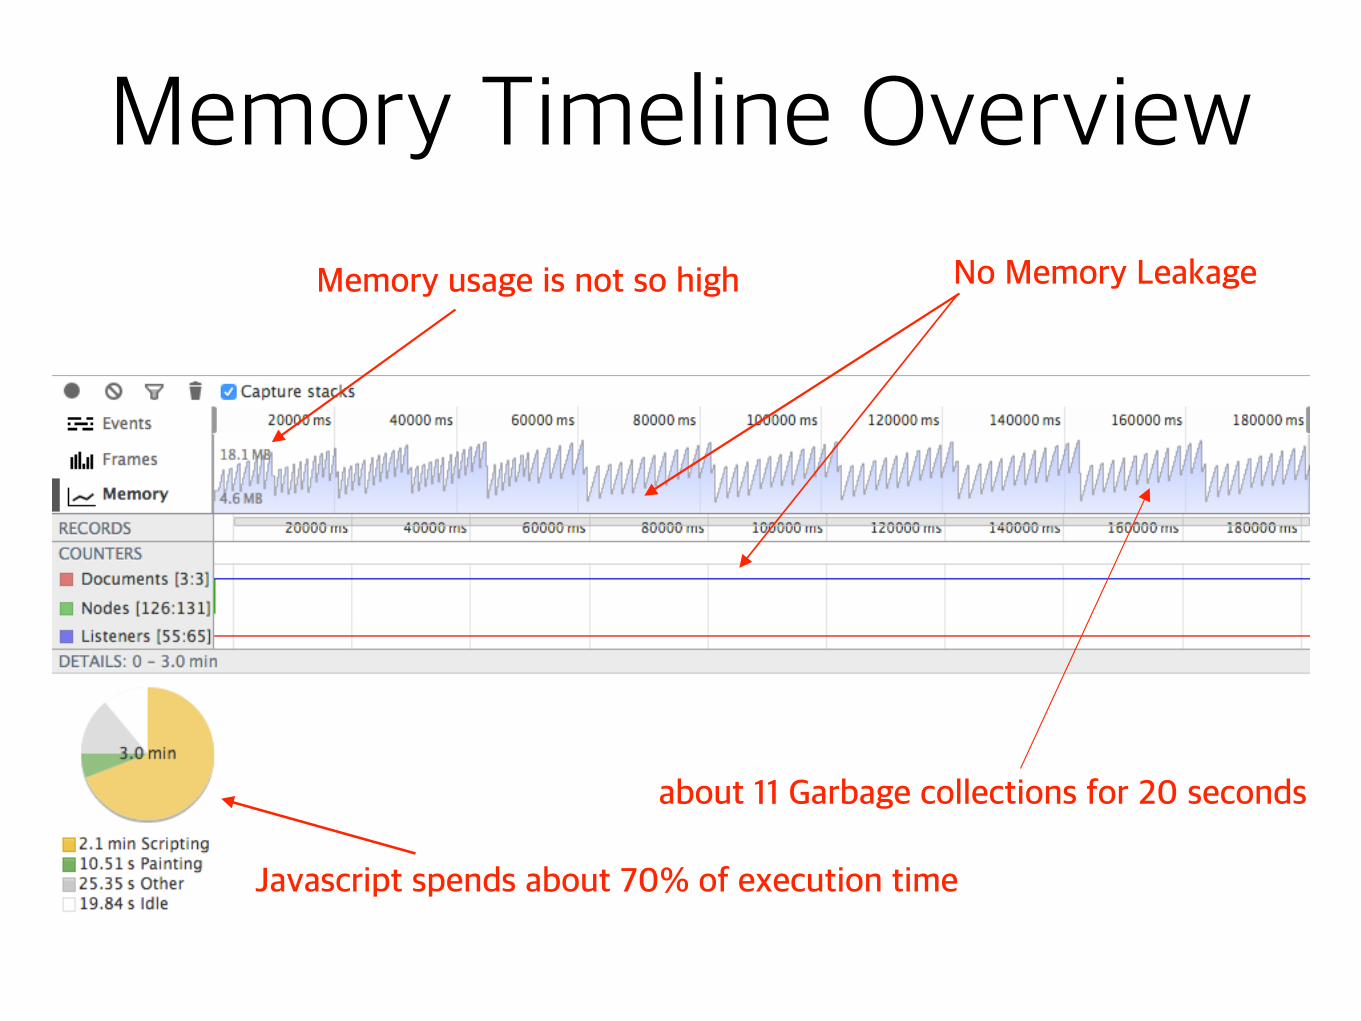
Memory Timeline Overview
No Memory Leakage
Javascript spends about 70% of execution time
Memory usage is not so high
about 11 Garbage collections for 20 seconds
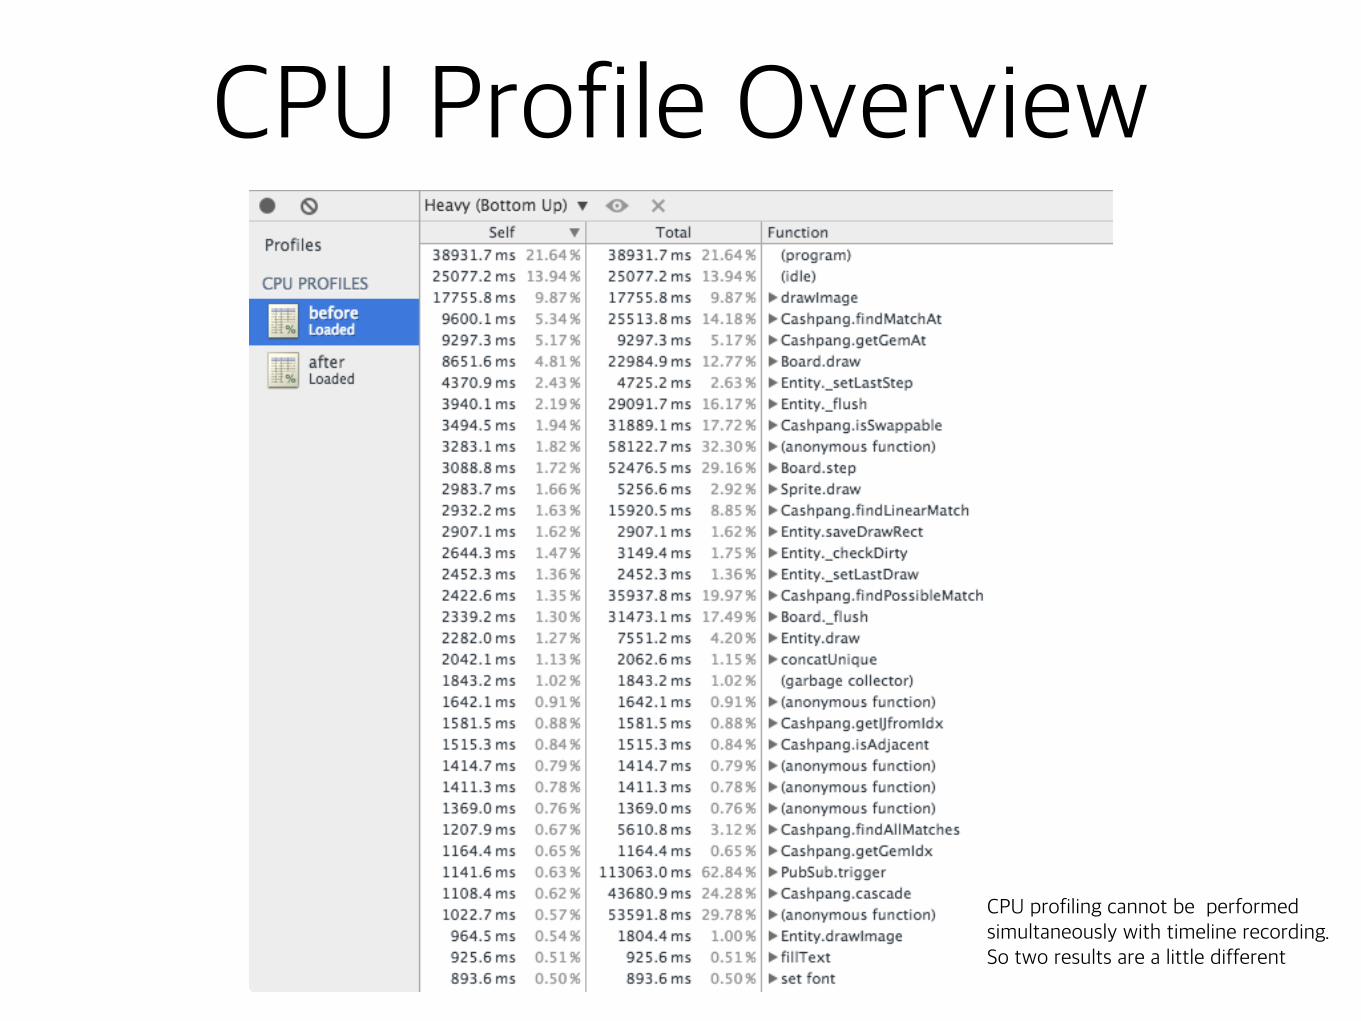
CPU Profile Overview
CPU profiling cannot be performed simultaneously with timeline recording. So two results are a little different
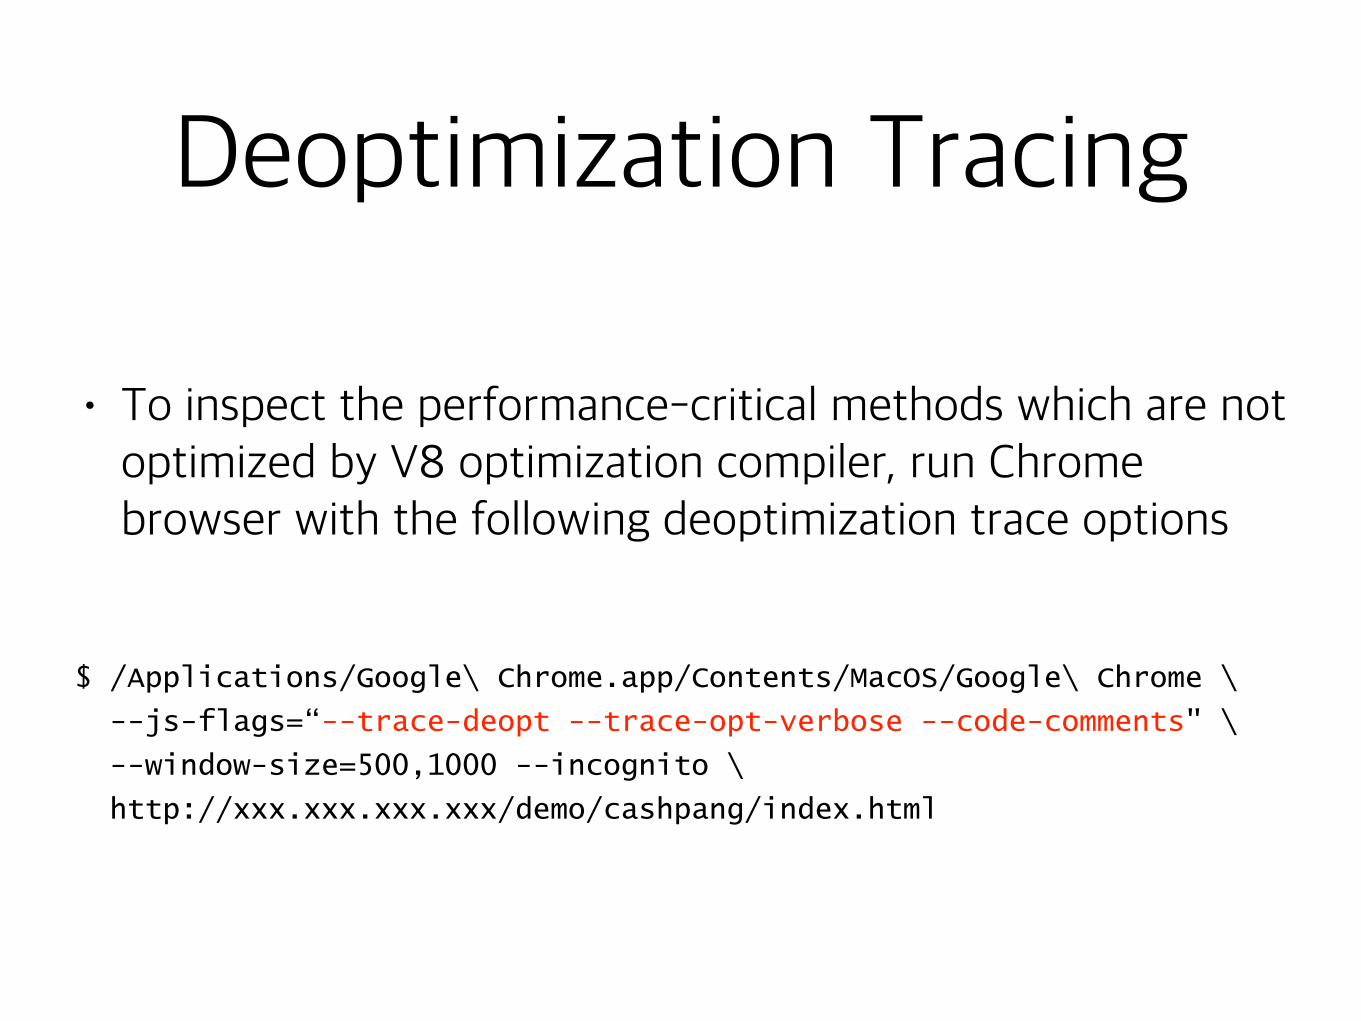
Deoptimization Tracing
• To inspect the performance-critical methods which are not optimized by V8 optimization compiler, run Chrome browser with the following deoptimization trace options
$ /Applications/Google\ Chrome.app/Contents/MacOS/Google\ Chrome \
--js-flags=“--trace-deopt --trace-opt-verbose --code-comments" \
--window-size=500,1000 --incognito \
http://xxx.xxx.xxx.xxx/demo/cashpang/index.html
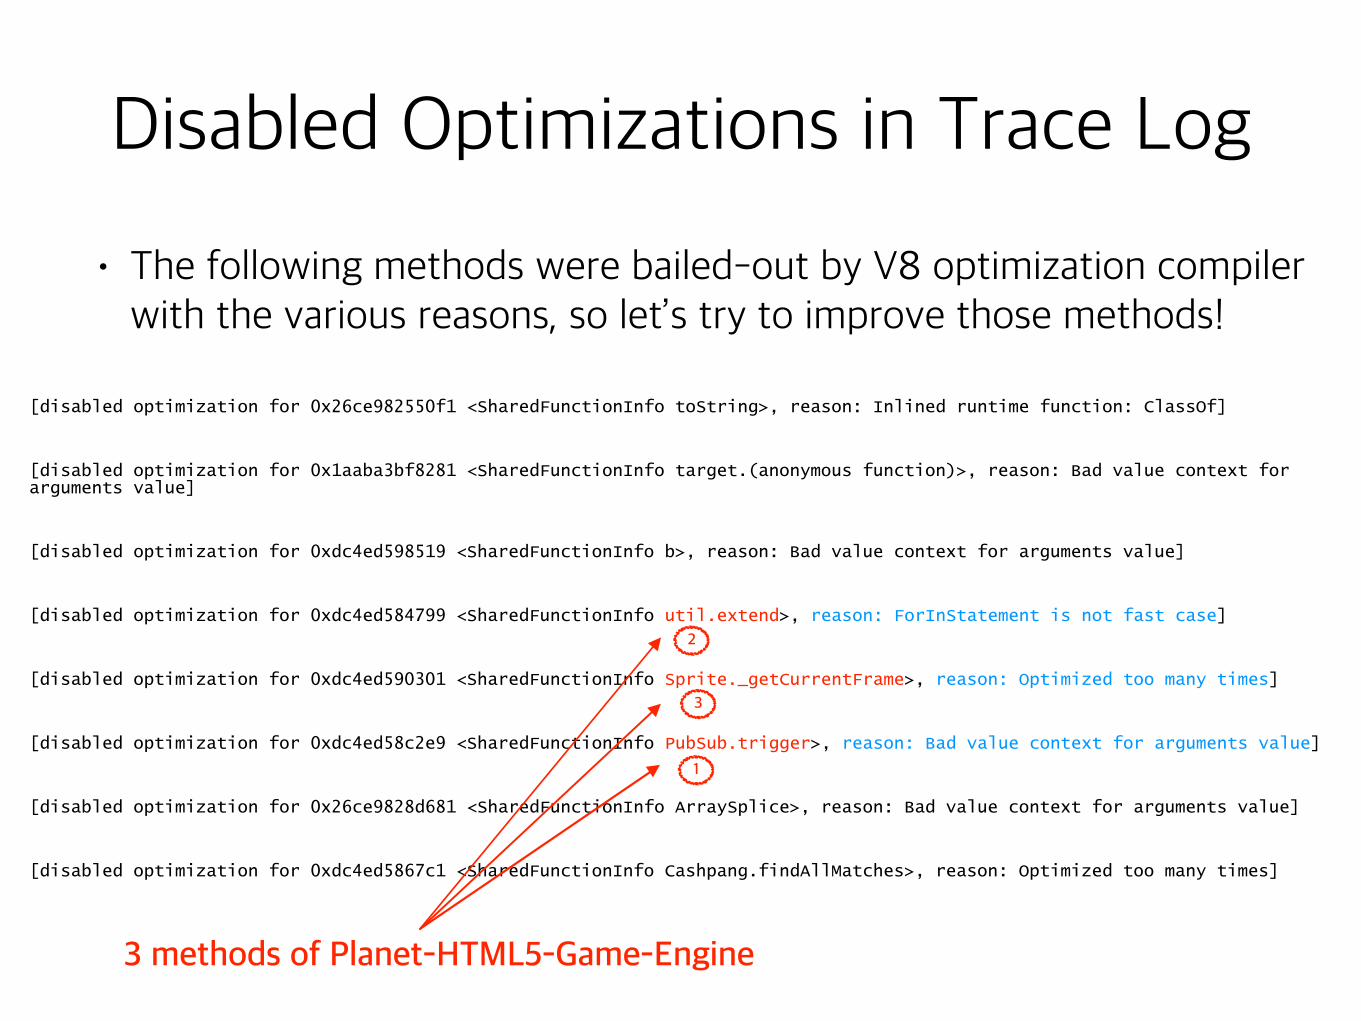
Disabled Optimizations in Trace Log
[disabled optimization for 0x26ce982550f1 <SharedFunctionInfo toString>, reason: Inlined runtime function: ClassOf]
[disabled optimization for 0x1aaba3bf8281 <SharedFunctionInfo target.(anonymous function)>, reason: Bad value context for arguments value]
[disabled optimization for 0xdc4ed598519 <SharedFunctionInfo b>, reason: Bad value context for arguments value]
[disabled optimization for 0xdc4ed584799 <SharedFunctionInfo util.extend>, reason: ForInStatement is not fast case]
[disabled optimization for 0xdc4ed590301 <SharedFunctionInfo Sprite._getCurrentFrame>, reason: Optimized too many times]
[disabled optimization for 0xdc4ed58c2e9 <SharedFunctionInfo PubSub.trigger>, reason: Bad value context for arguments value]
[disabled optimization for 0x26ce9828d681 <SharedFunctionInfo ArraySplice>, reason: Bad value context for arguments value]
[disabled optimization for 0xdc4ed5867c1 <SharedFunctionInfo Cashpang.findAllMatches>, reason: Optimized too many times]
3 methods of Planet-HTML5-Game-Engine
1
3
2
• The following methods were bailed-out by V8 optimization compiler with the various reasons, so let’s try to improve those methods!
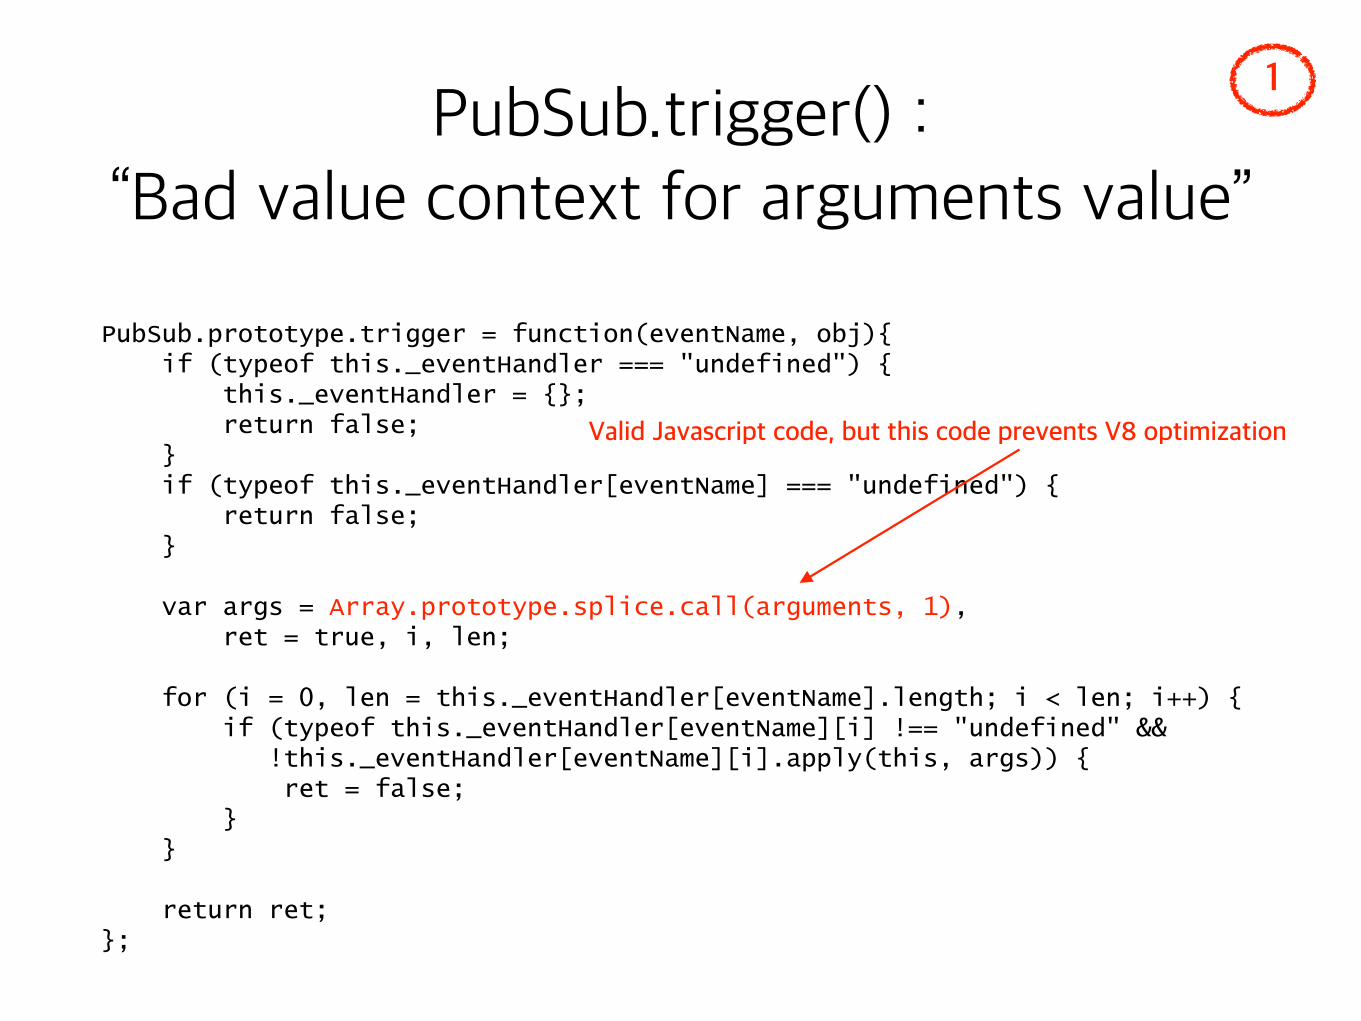
PubSub.trigger() : “Bad value context for arguments value”
PubSub.prototype.trigger = function(eventName, obj){ if (typeof this._eventHandler === "undefined") { this._eventHandler = {}; return false; } if (typeof this._eventHandler[eventName] === "undefined") { return false; }
var args = Array.prototype.splice.call(arguments, 1), ret = true, i, len;
for (i = 0, len = this._eventHandler[eventName].length; i < len; i++) { if (typeof this._eventHandler[eventName][i] !== "undefined" && !this._eventHandler[eventName][i].apply(this, args)) { ret = false; } }
return ret; };
Valid Javascript code, but this code prevents V8 optimization
1
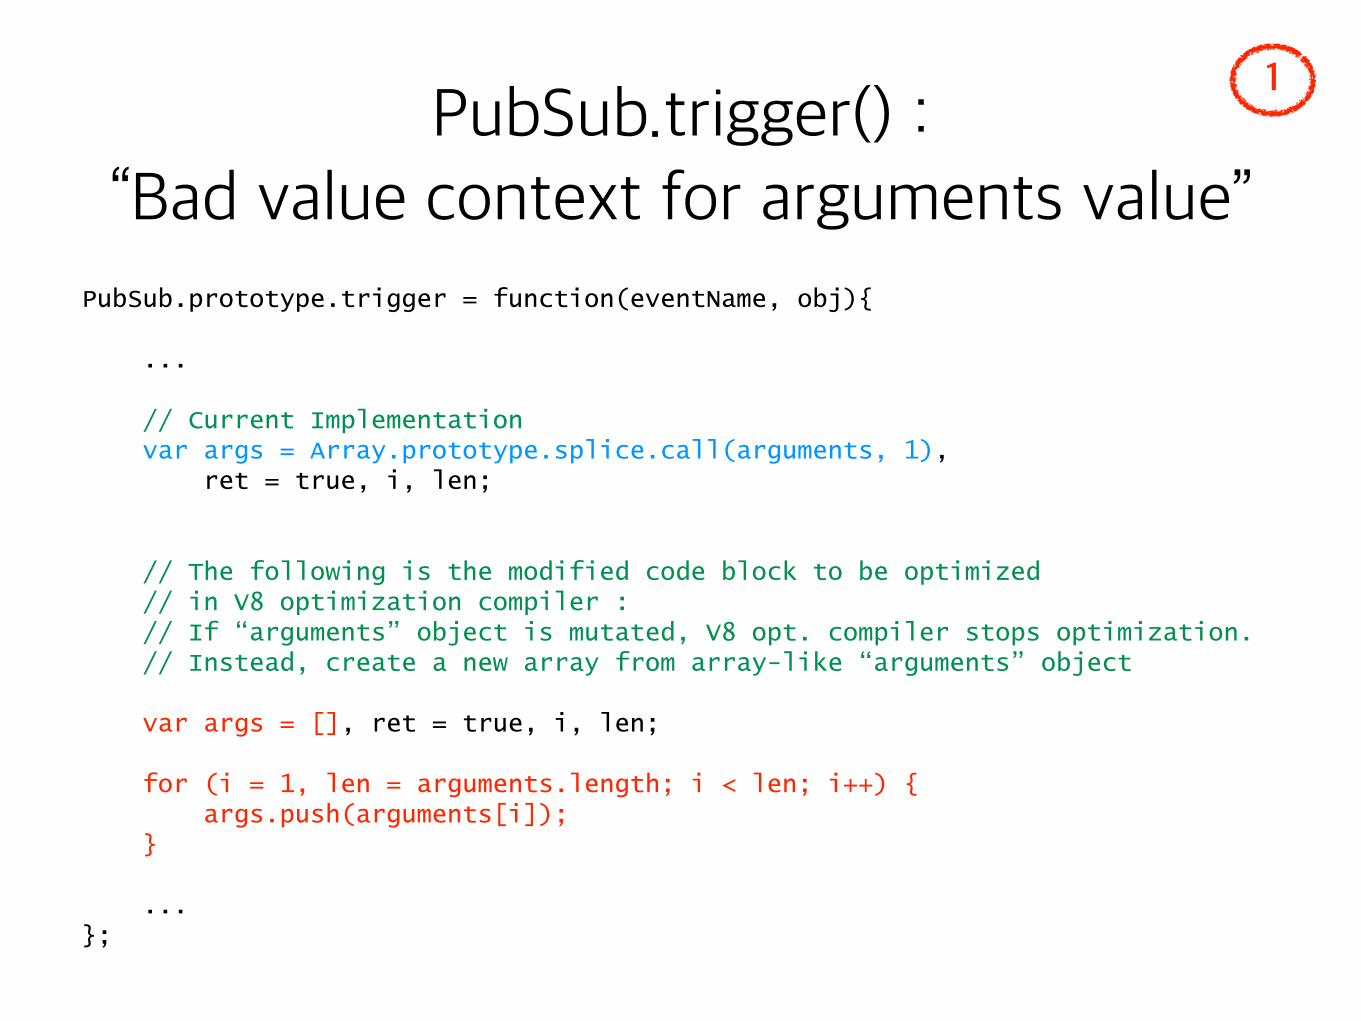
PubSub.prototype.trigger = function(eventName, obj){
...
// Current Implementation var args = Array.prototype.splice.call(arguments, 1), ret = true, i, len;
// The following is the modified code block to be optimized // in V8 optimization compiler : // If “arguments” object is mutated, V8 opt. compiler stops optimization. // Instead, create a new array from array-like “arguments” object
var args = [], ret = true, i, len;
for (i = 1, len = arguments.length; i < len; i++) { args.push(arguments[i]); }
... };
1PubSub.trigger() :
“Bad value context for arguments value”
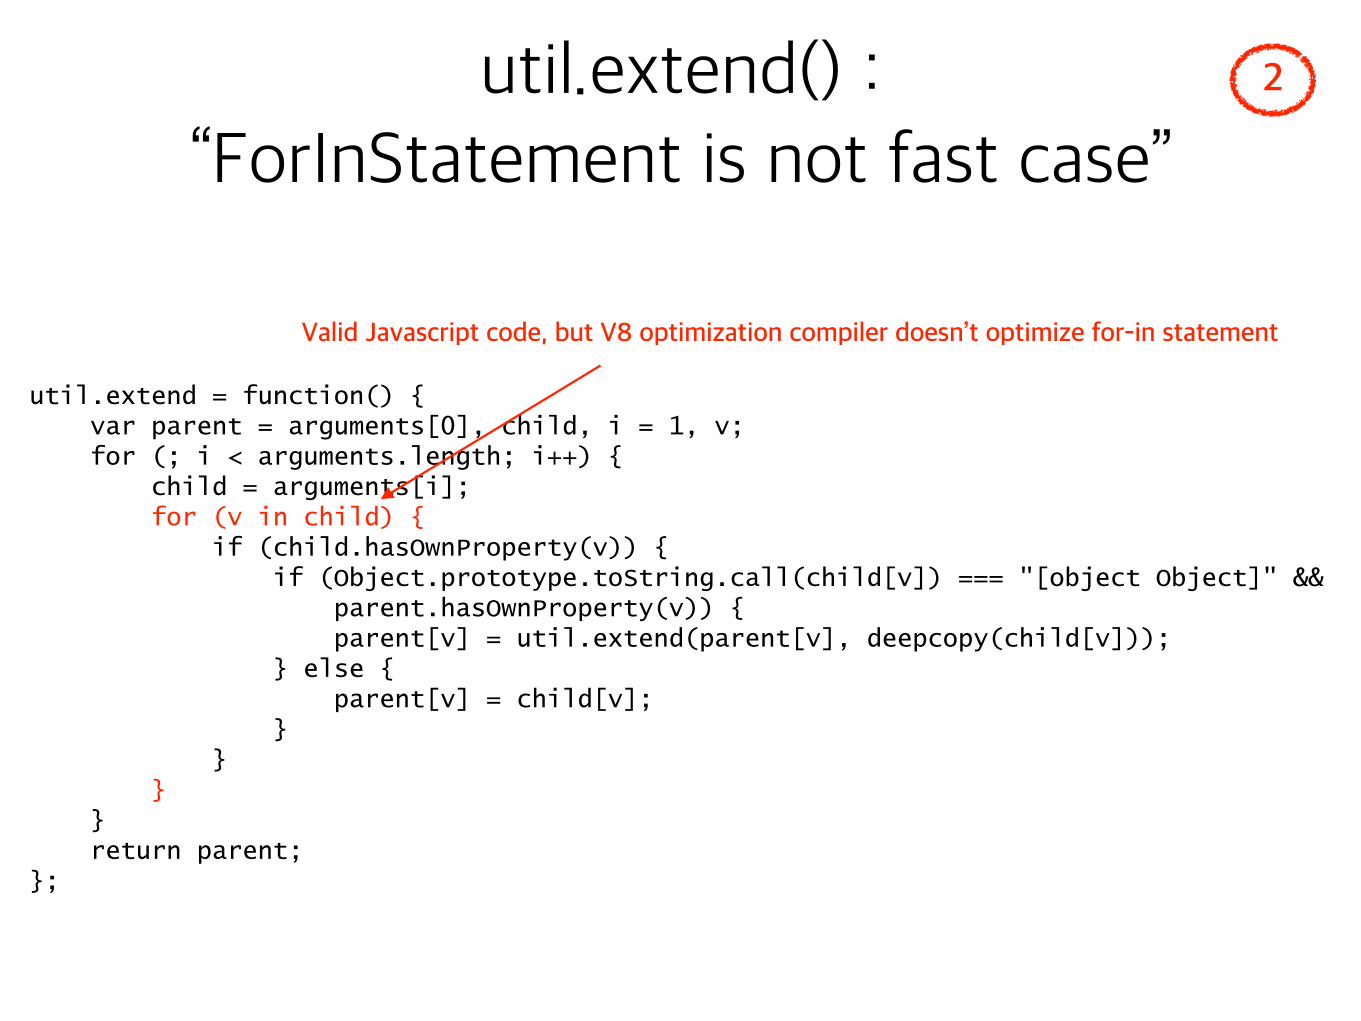
util.extend = function() { var parent = arguments[0], child, i = 1, v; for (; i < arguments.length; i++) { child = arguments[i]; for (v in child) { if (child.hasOwnProperty(v)) { if (Object.prototype.toString.call(child[v]) === "[object Object]" && parent.hasOwnProperty(v)) { parent[v] = util.extend(parent[v], deepcopy(child[v])); } else { parent[v] = child[v]; } } } } return parent; };
Valid Javascript code, but V8 optimization compiler doesn’t optimize for-in statement
2util.extend() : “ForInStatement is not fast case”
util.extend() : “ForInStatement is not fast case”
2
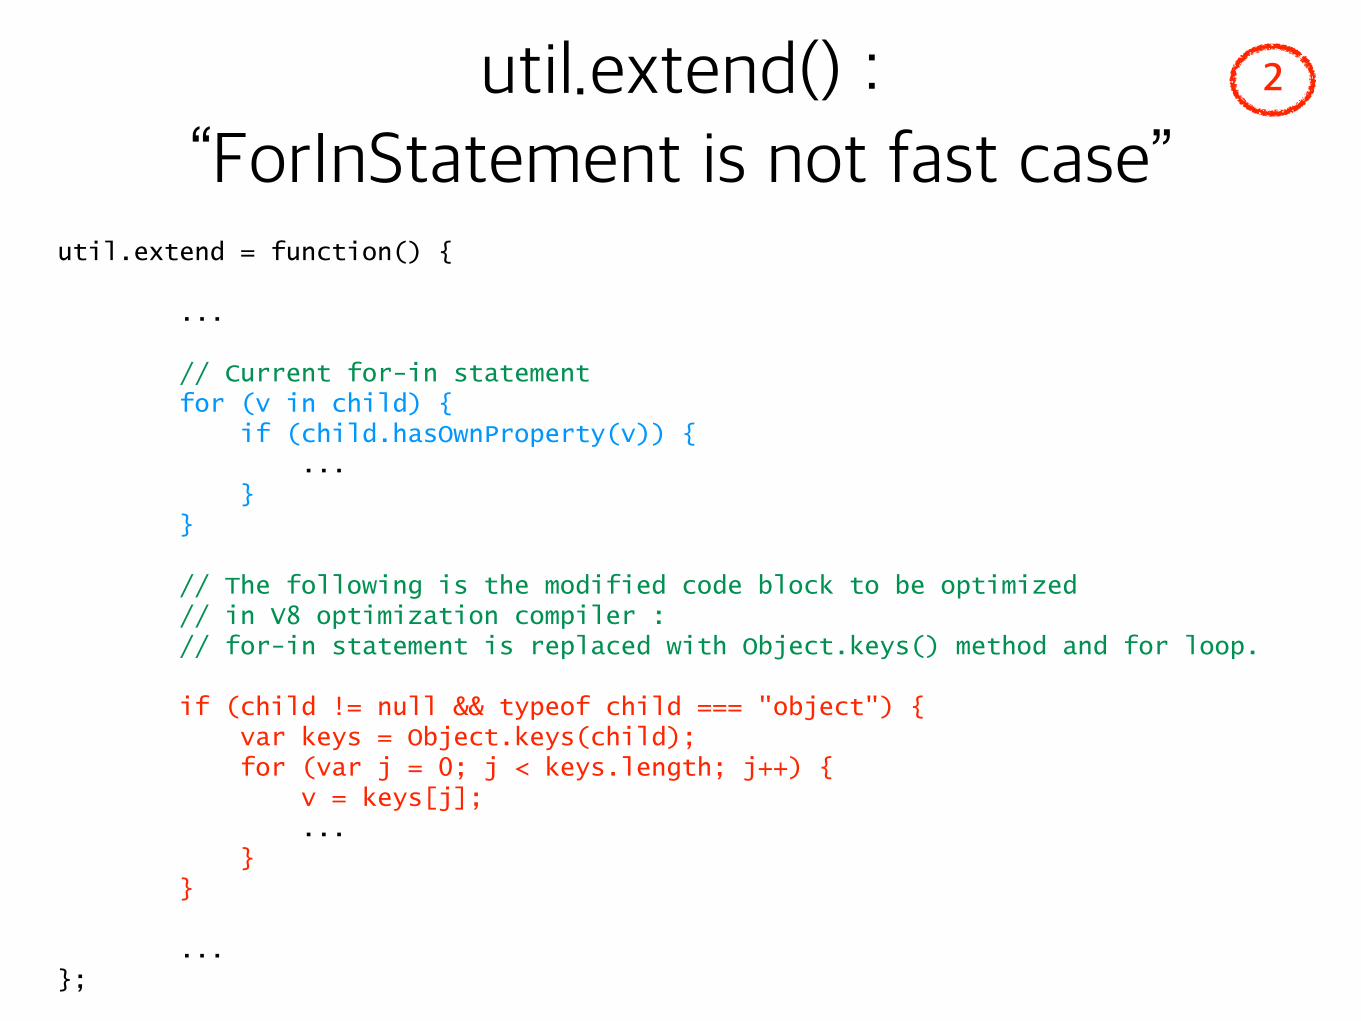
util.extend = function() {
...
// Current for-in statement for (v in child) { if (child.hasOwnProperty(v)) { ... } }
// The following is the modified code block to be optimized // in V8 optimization compiler : // for-in statement is replaced with Object.keys() method and for loop.
if (child != null && typeof child === "object") { var keys = Object.keys(child); for (var j = 0; j < keys.length; j++) { v = keys[j]; ... } }
... };
Sprite._getCurrentFrame() : “Optimized too many times”
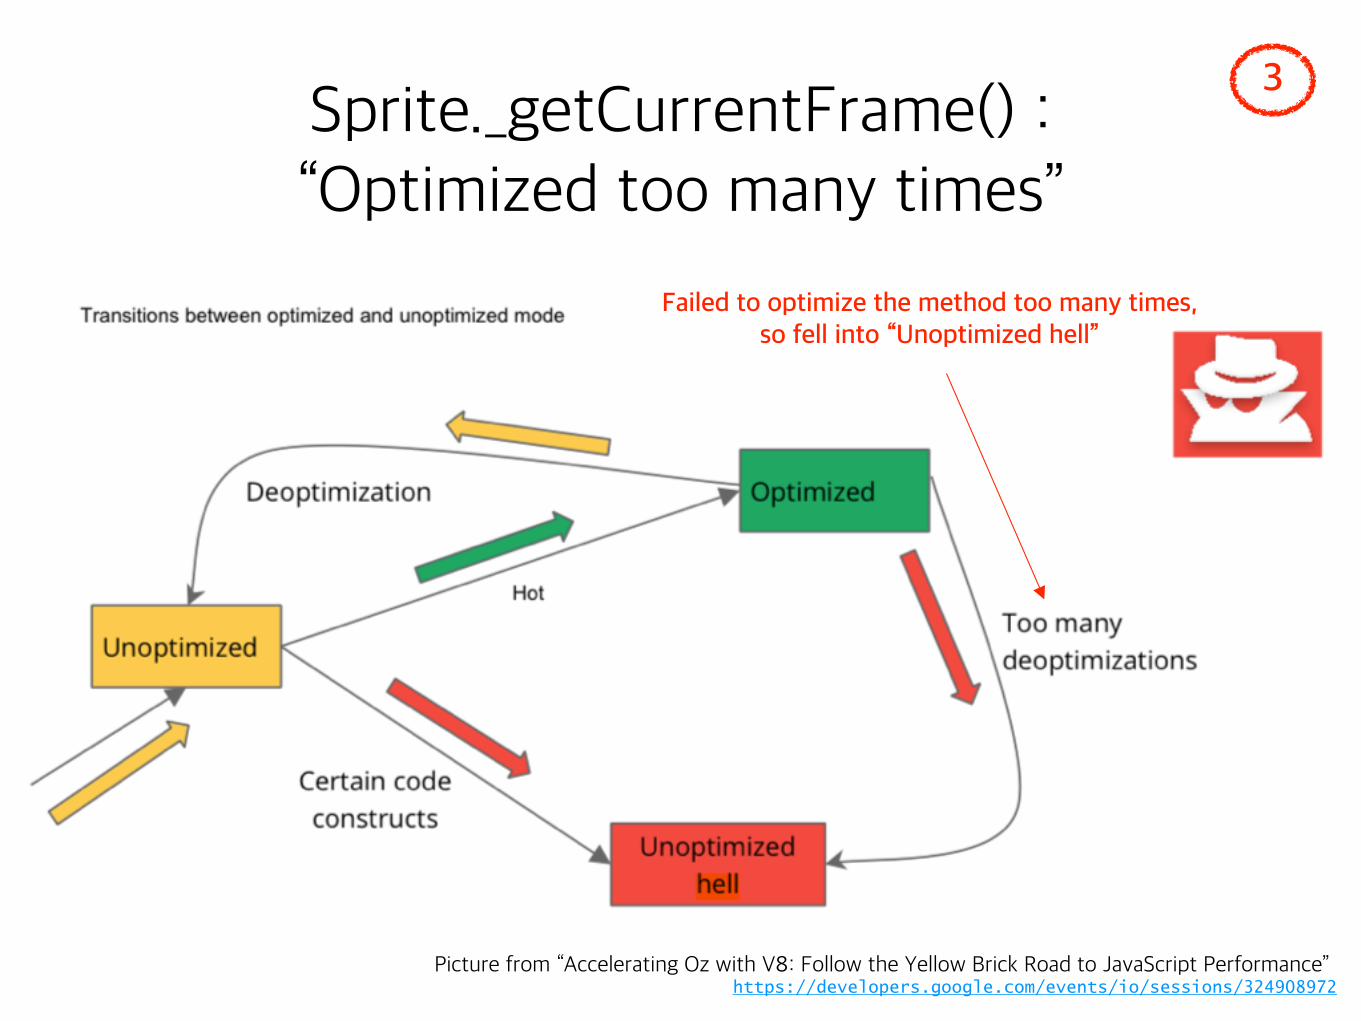
Picture from “Accelerating Oz with V8: Follow the Yellow Brick Road to JavaScript Performance” https://developers.google.com/events/io/sessions/324908972
3
Failed to optimize the method too many times, so fell into “Unoptimized hell”
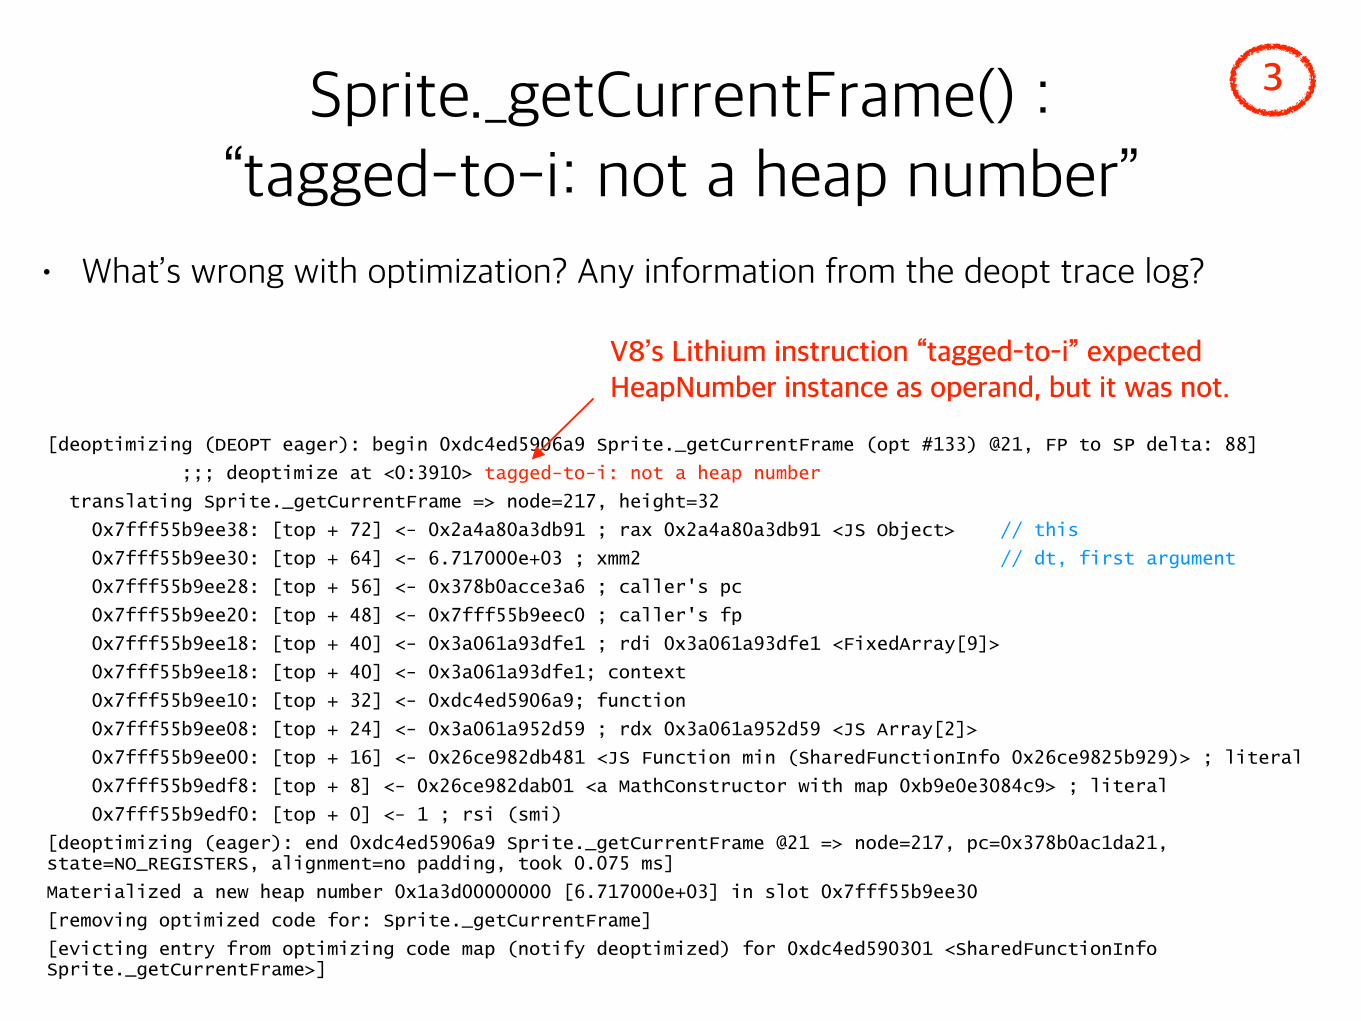
[deoptimizing (DEOPT eager): begin 0xdc4ed5906a9 Sprite._getCurrentFrame (opt #133) @21, FP to SP delta: 88]
;;; deoptimize at <0:3910> tagged-to-i: not a heap number
translating Sprite._getCurrentFrame => node=217, height=32
0x7fff55b9ee38: [top + 72] <- 0x2a4a80a3db91 ; rax 0x2a4a80a3db91 <JS Object> // this
0x7fff55b9ee30: [top + 64] <- 6.717000e+03 ; xmm2 // dt, first argument
0x7fff55b9ee28: [top + 56] <- 0x378b0acce3a6 ; caller's pc
0x7fff55b9ee20: [top + 48] <- 0x7fff55b9eec0 ; caller's fp
0x7fff55b9ee18: [top + 40] <- 0x3a061a93dfe1 ; rdi 0x3a061a93dfe1 <FixedArray[9]>
0x7fff55b9ee18: [top + 40] <- 0x3a061a93dfe1; context
0x7fff55b9ee10: [top + 32] <- 0xdc4ed5906a9; function
0x7fff55b9ee08: [top + 24] <- 0x3a061a952d59 ; rdx 0x3a061a952d59 <JS Array[2]>
0x7fff55b9ee00: [top + 16] <- 0x26ce982db481 <JS Function min (SharedFunctionInfo 0x26ce9825b929)> ; literal
0x7fff55b9edf8: [top + 8] <- 0x26ce982dab01 <a MathConstructor with map 0xb9e0e3084c9> ; literal
0x7fff55b9edf0: [top + 0] <- 1 ; rsi (smi)
[deoptimizing (eager): end 0xdc4ed5906a9 Sprite._getCurrentFrame @21 => node=217, pc=0x378b0ac1da21, state=NO_REGISTERS, alignment=no padding, took 0.075 ms]
Materialized a new heap number 0x1a3d00000000 [6.717000e+03] in slot 0x7fff55b9ee30
[removing optimized code for: Sprite._getCurrentFrame]
[evicting entry from optimizing code map (notify deoptimized) for 0xdc4ed590301 <SharedFunctionInfo Sprite._getCurrentFrame>]
3Sprite._getCurrentFrame() : “tagged-to-i: not a heap number”
• What’s wrong with optimization? Any information from the deopt trace log?
V8’s Lithium instruction “tagged-to-i” expected HeapNumber instance as operand, but it was not.
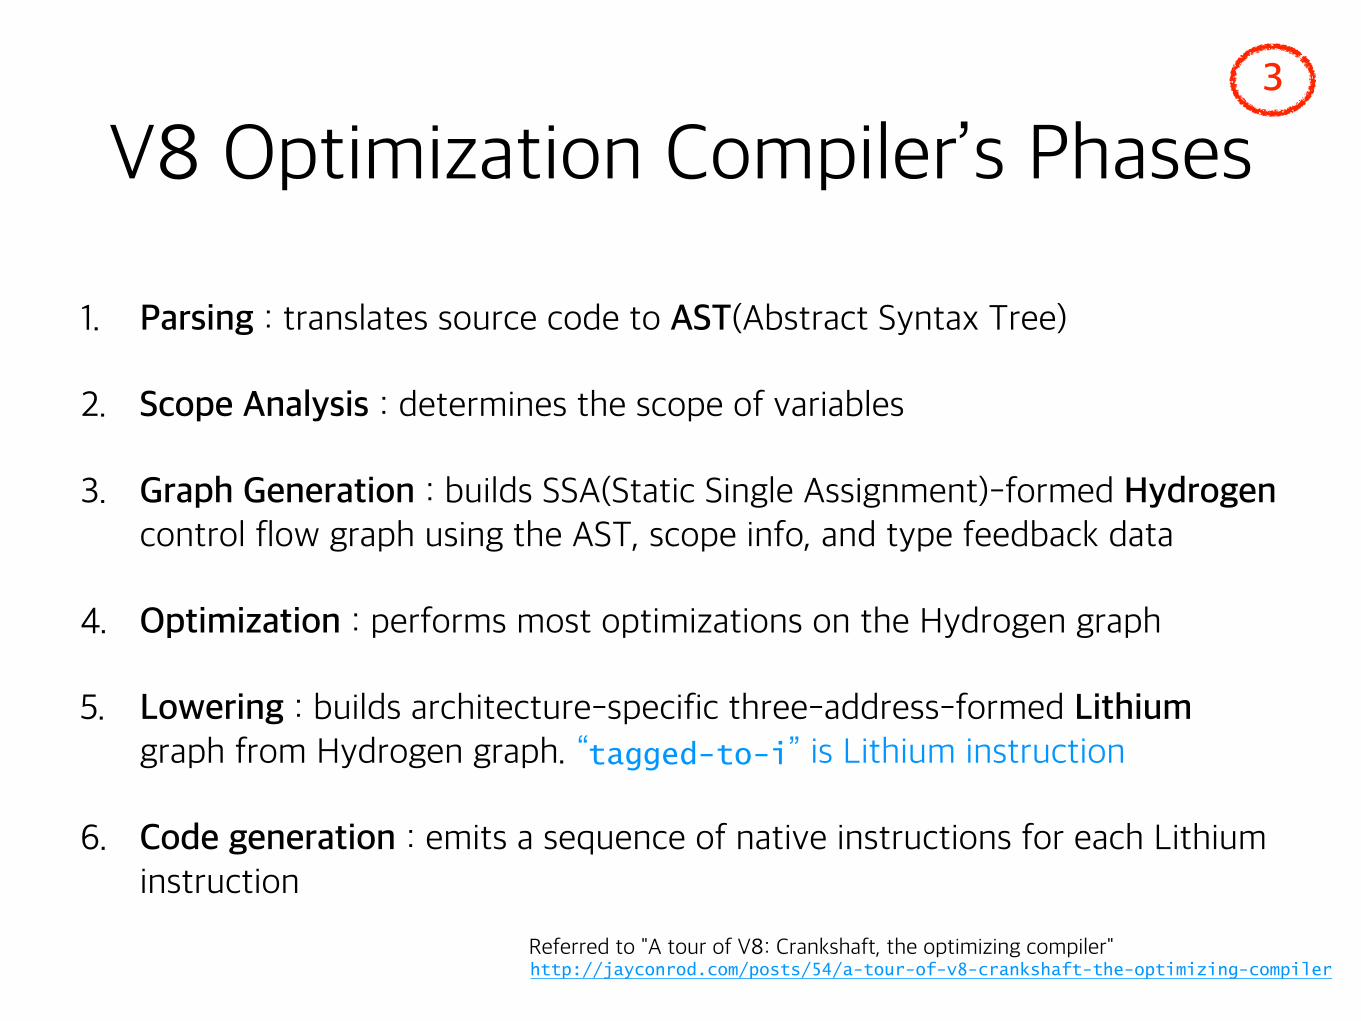
V8 Optimization Compiler’s Phases
1. Parsing : translates source code to AST(Abstract Syntax Tree)
2. Scope Analysis : determines the scope of variables
3. Graph Generation : builds SSA(Static Single Assignment)-formed Hydrogen control flow graph using the AST, scope info, and type feedback data
4. Optimization : performs most optimizations on the Hydrogen graph
5. Lowering : builds architecture-specific three-address-formed Lithium graph from Hydrogen graph. “tagged-to-i” is Lithium instruction
6. Code generation : emits a sequence of native instructions for each Lithium instruction
3
Referred to "A tour of V8: Crankshaft, the optimizing compiler" http://jayconrod.com/posts/54/a-tour-of-v8-crankshaft-the-optimizing-compiler
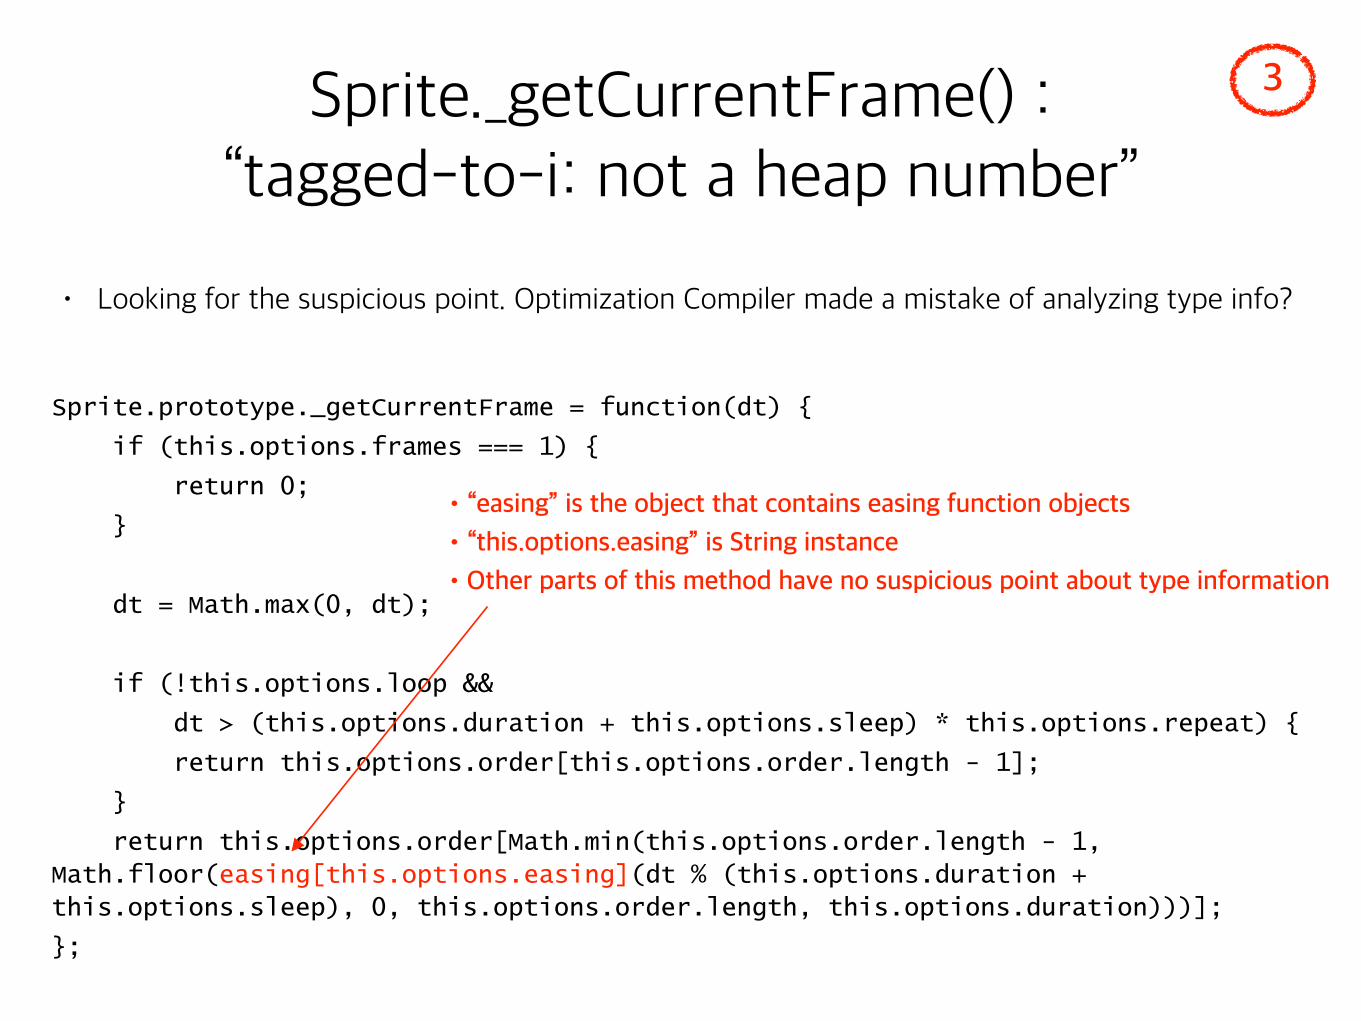
Sprite.prototype._getCurrentFrame = function(dt) {
if (this.options.frames === 1) {
return 0;
}
dt = Math.max(0, dt);
if (!this.options.loop &&
dt > (this.options.duration + this.options.sleep) * this.options.repeat) {
return this.options.order[this.options.order.length - 1];
}
return this.options.order[Math.min(this.options.order.length - 1,
Math.floor(easing[this.options.easing](dt % (this.options.duration +
this.options.sleep), 0, this.options.order.length, this.options.duration)))];
};
3
• Looking for the suspicious point. Optimization Compiler made a mistake of analyzing type info?
Sprite._getCurrentFrame() : “tagged-to-i: not a heap number”
•“easing” is the object that contains easing function objects
•“this.options.easing” is String instance
•Other parts of this method have no suspicious point about type information
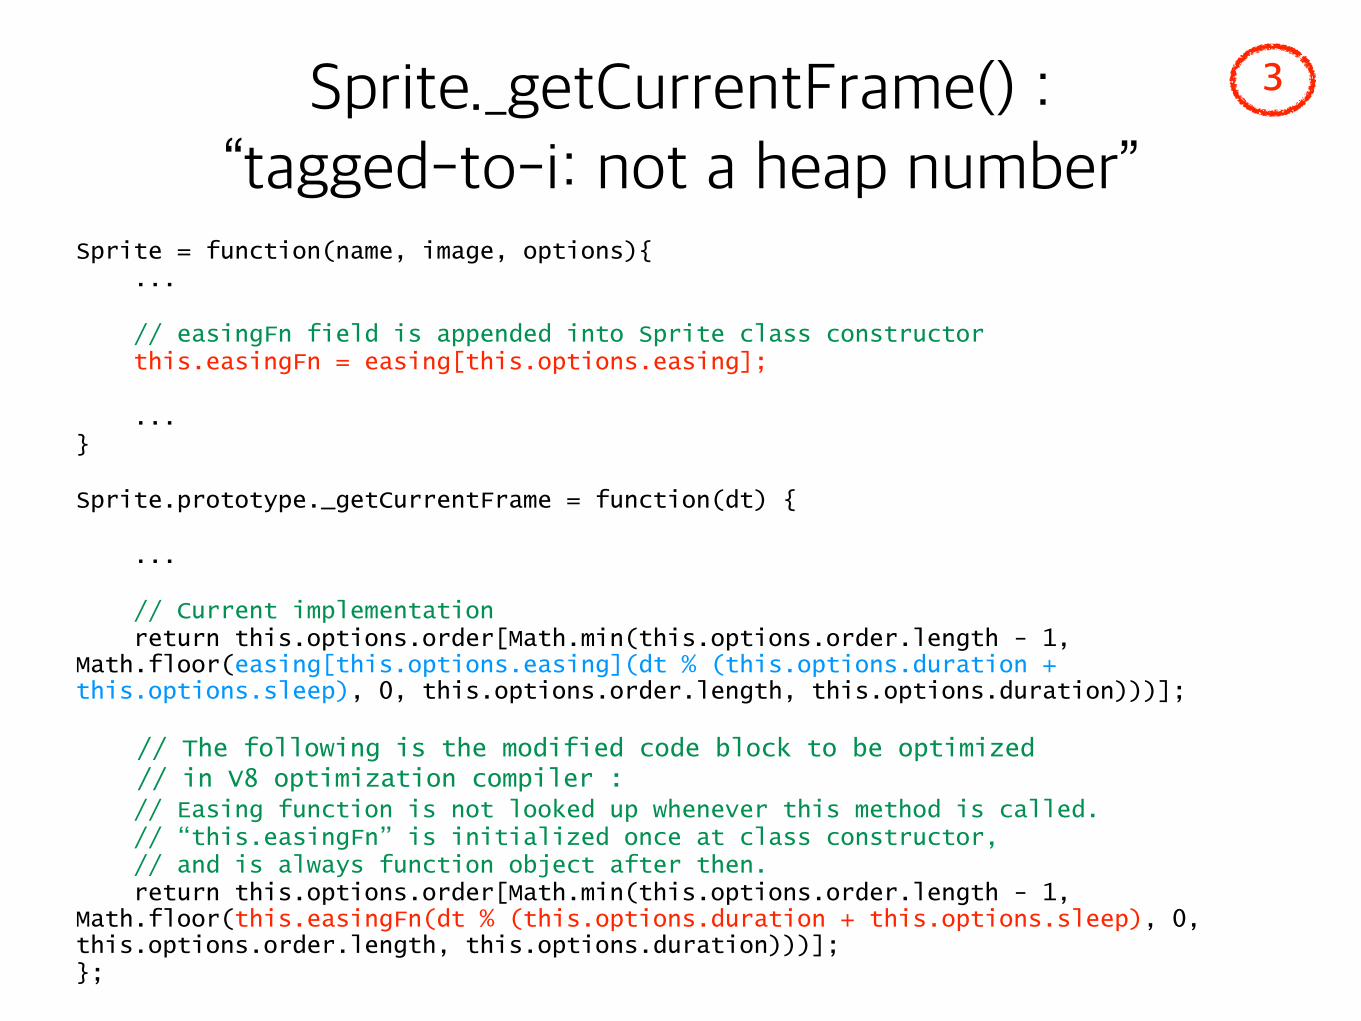
Sprite = function(name, image, options){ ...
// easingFn field is appended into Sprite class constructor this.easingFn = easing[this.options.easing];
... }
Sprite.prototype._getCurrentFrame = function(dt) {
...
// Current implementation return this.options.order[Math.min(this.options.order.length - 1, Math.floor(easing[this.options.easing](dt % (this.options.duration + this.options.sleep), 0, this.options.order.length, this.options.duration)))];
// The following is the modified code block to be optimized // in V8 optimization compiler : // Easing function is not looked up whenever this method is called. // “this.easingFn” is initialized once at class constructor, // and is always function object after then. return this.options.order[Math.min(this.options.order.length - 1, Math.floor(this.easingFn(dt % (this.options.duration + this.options.sleep), 0, this.options.order.length, this.options.duration)))]; };
3Sprite._getCurrentFrame() : “tagged-to-i: not a heap number”
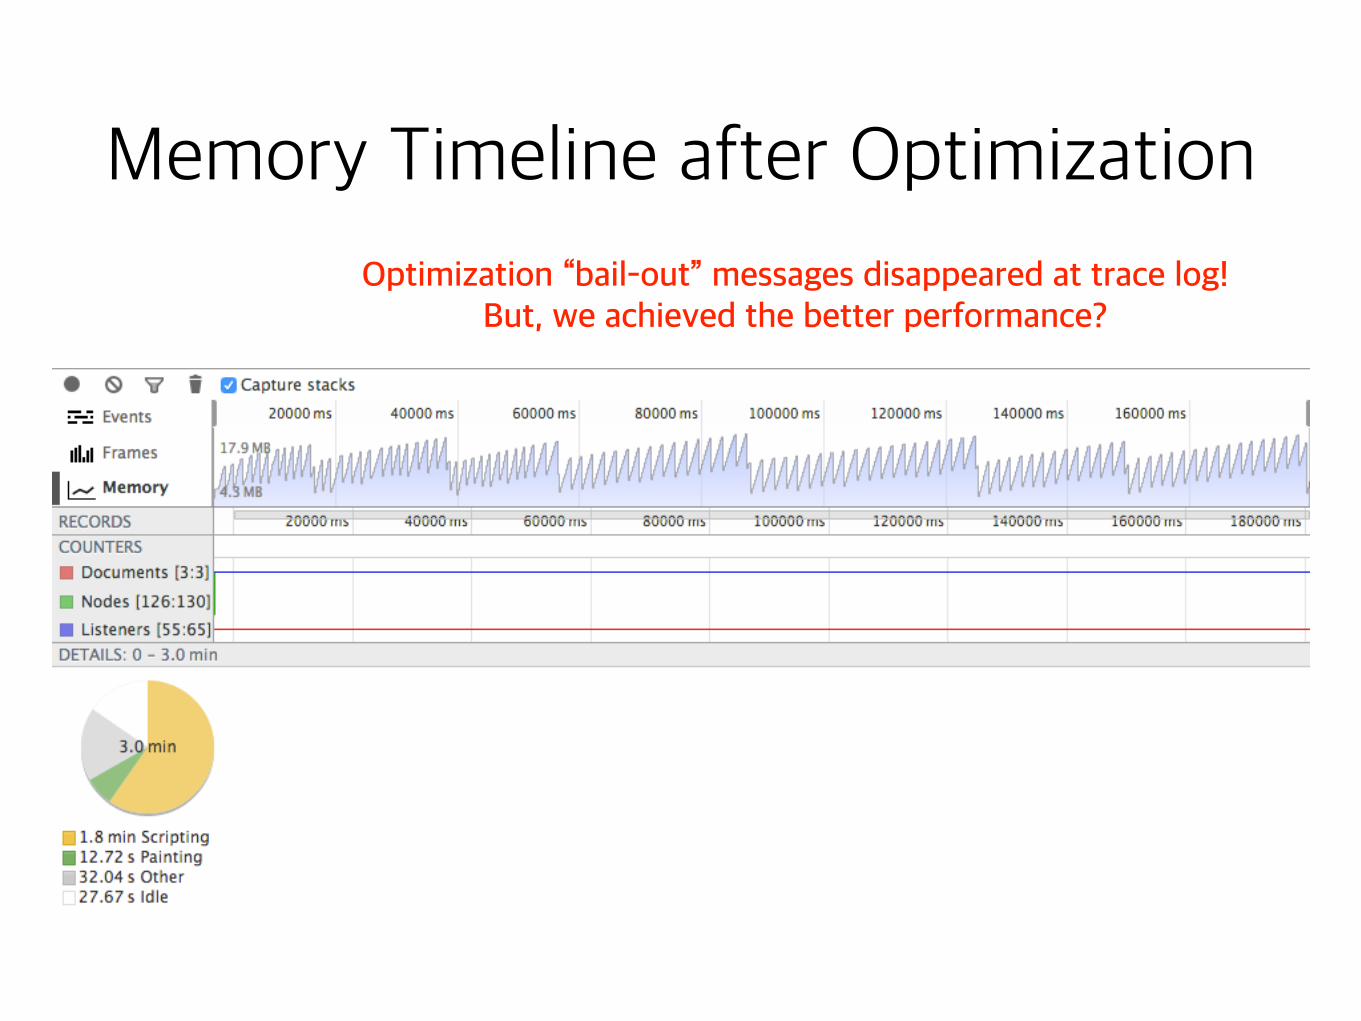
Memory Timeline after Optimization
Optimization “bail-out” messages disappeared at trace log! But, we achieved the better performance?
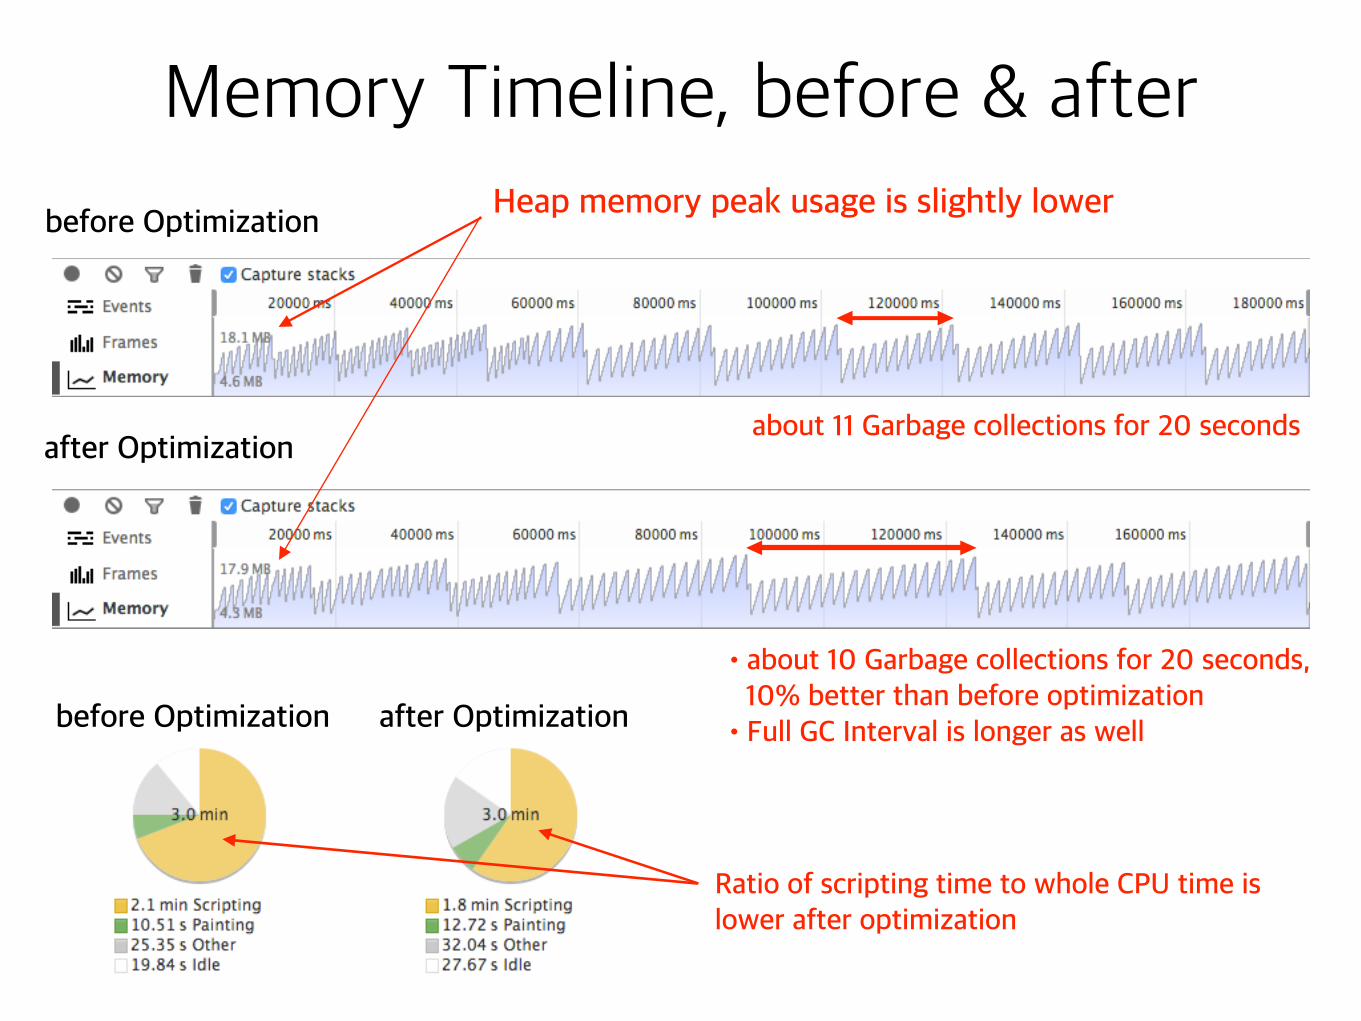
Memory Timeline, before & after
before Optimization
after Optimization
•about 10 Garbage collections for 20 seconds, 10% better than before optimization
•Full GC Interval is longer as well
Heap memory peak usage is slightly lower
about 11 Garbage collections for 20 seconds
before Optimization after Optimization
Ratio of scripting time to whole CPU time is lower after optimization
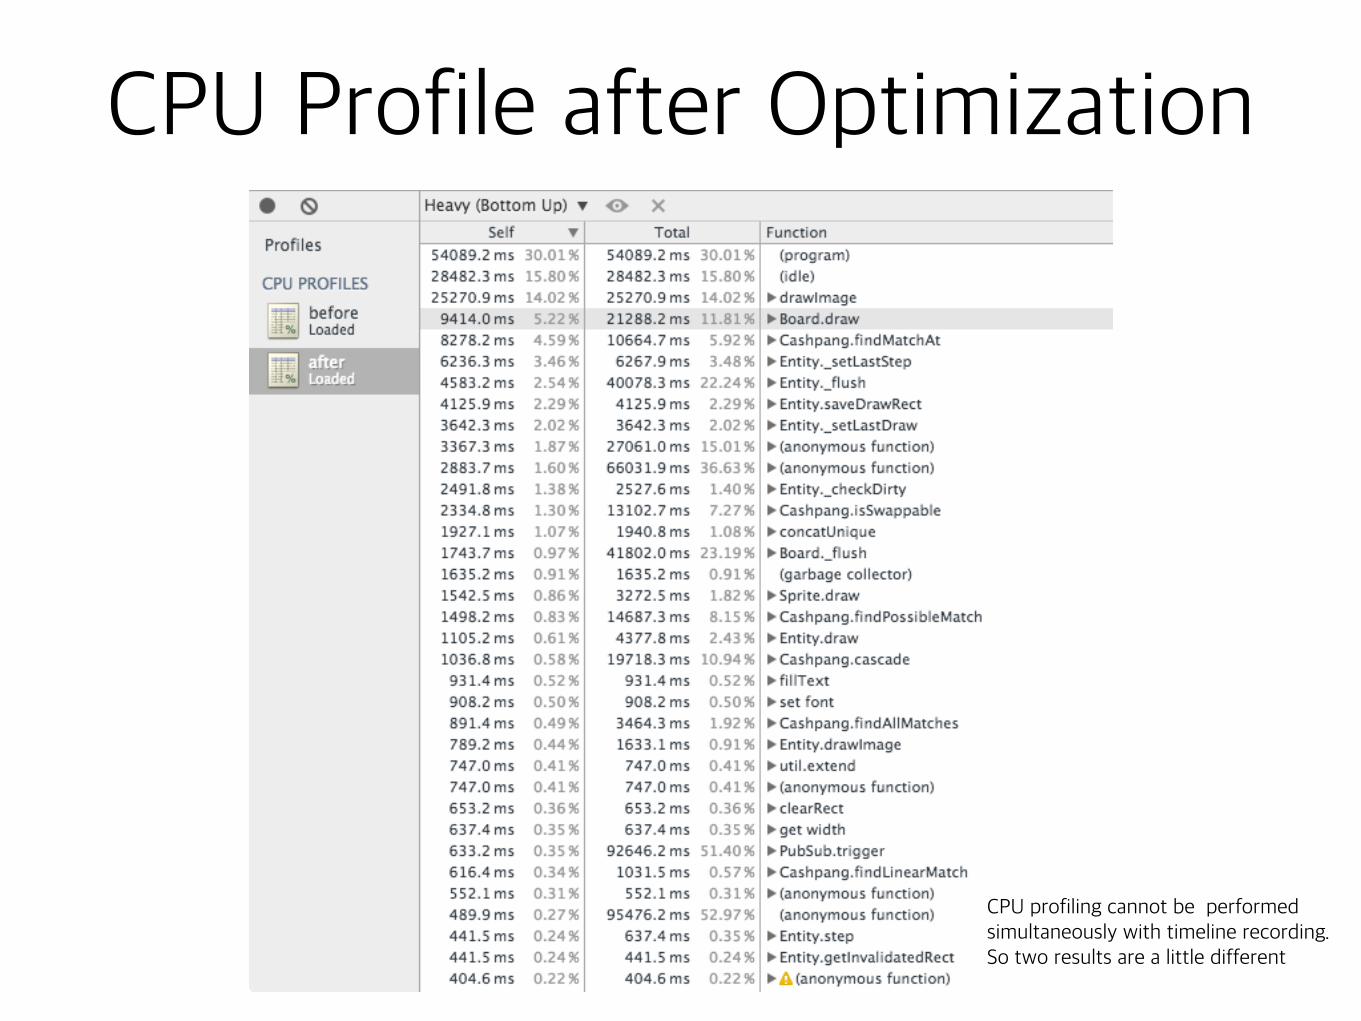
CPU Profile after Optimization
CPU profiling cannot be performed simultaneously with timeline recording. So two results are a little different
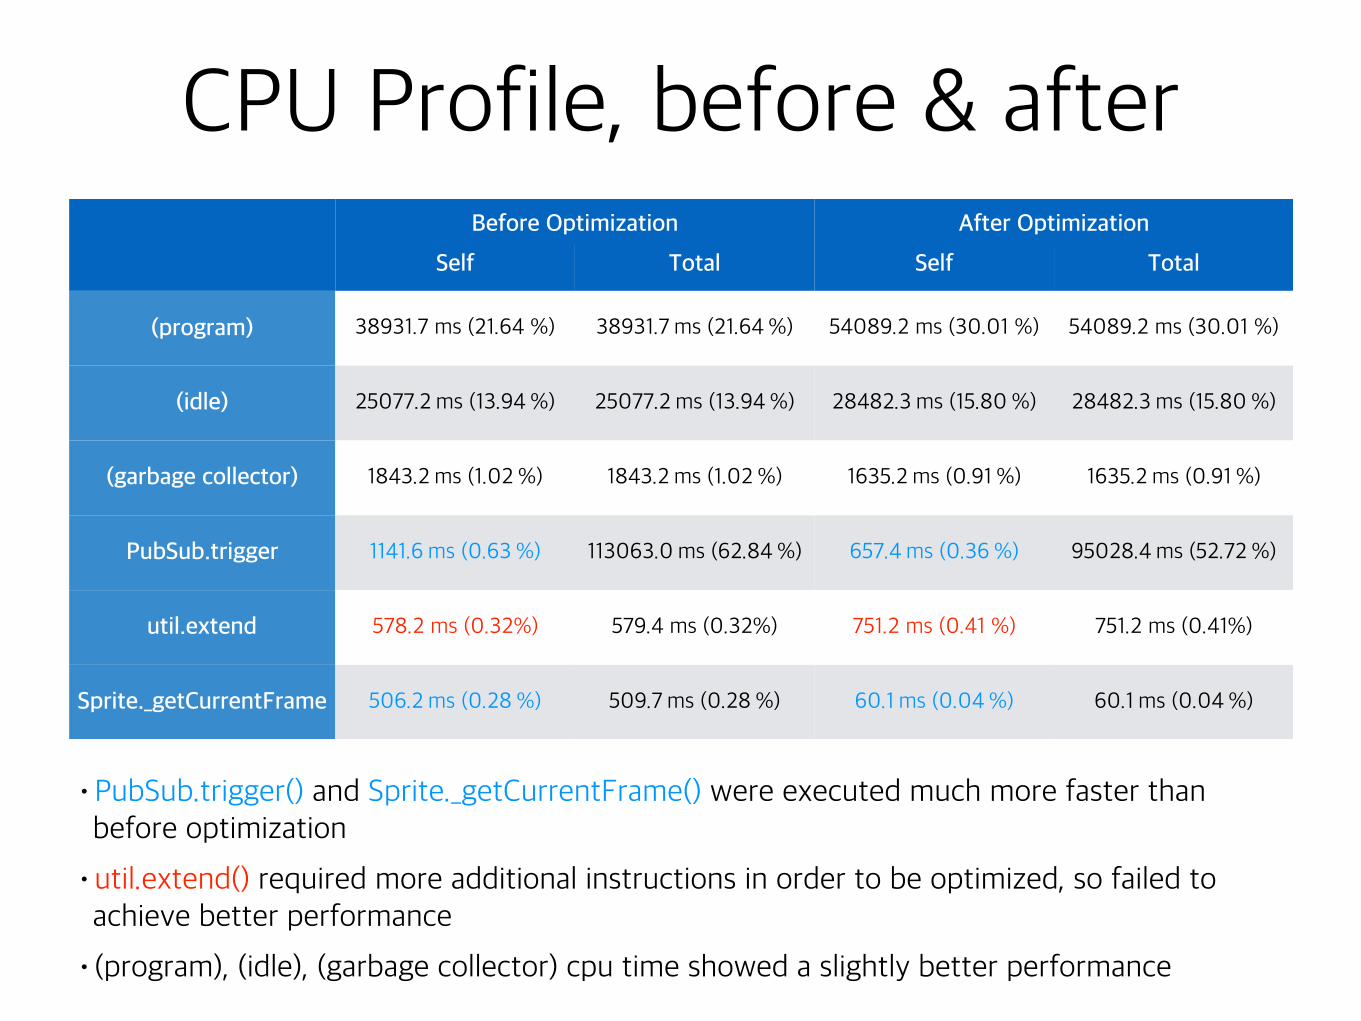
CPU Profile, before & afterBefore Optimization After Optimization
Self Total Self Total
(program) 38931.7 ms (21.64 %) 38931.7 ms (21.64 %) 54089.2 ms (30.01 %) 54089.2 ms (30.01 %)
(idle) 25077.2 ms (13.94 %) 25077.2 ms (13.94 %) 28482.3 ms (15.80 %) 28482.3 ms (15.80 %)
(garbage collector) 1843.2 ms (1.02 %) 1843.2 ms (1.02 %) 1635.2 ms (0.91 %) 1635.2 ms (0.91 %)
PubSub.trigger 1141.6 ms (0.63 %) 113063.0 ms (62.84 %) 657.4 ms (0.36 %) 95028.4 ms (52.72 %)
util.extend 578.2 ms (0.32%) 579.4 ms (0.32%) 751.2 ms (0.41 %) 751.2 ms (0.41%)
Sprite._getCurrentFrame 506.2 ms (0.28 %) 509.7 ms (0.28 %) 60.1 ms (0.04 %) 60.1 ms (0.04 %)
•PubSub.trigger() and Sprite._getCurrentFrame() were executed much more faster than before optimization
•util.extend() required more additional instructions in order to be optimized, so failed to achieve better performance
•(program), (idle), (garbage collector) cpu time showed a slightly better performance
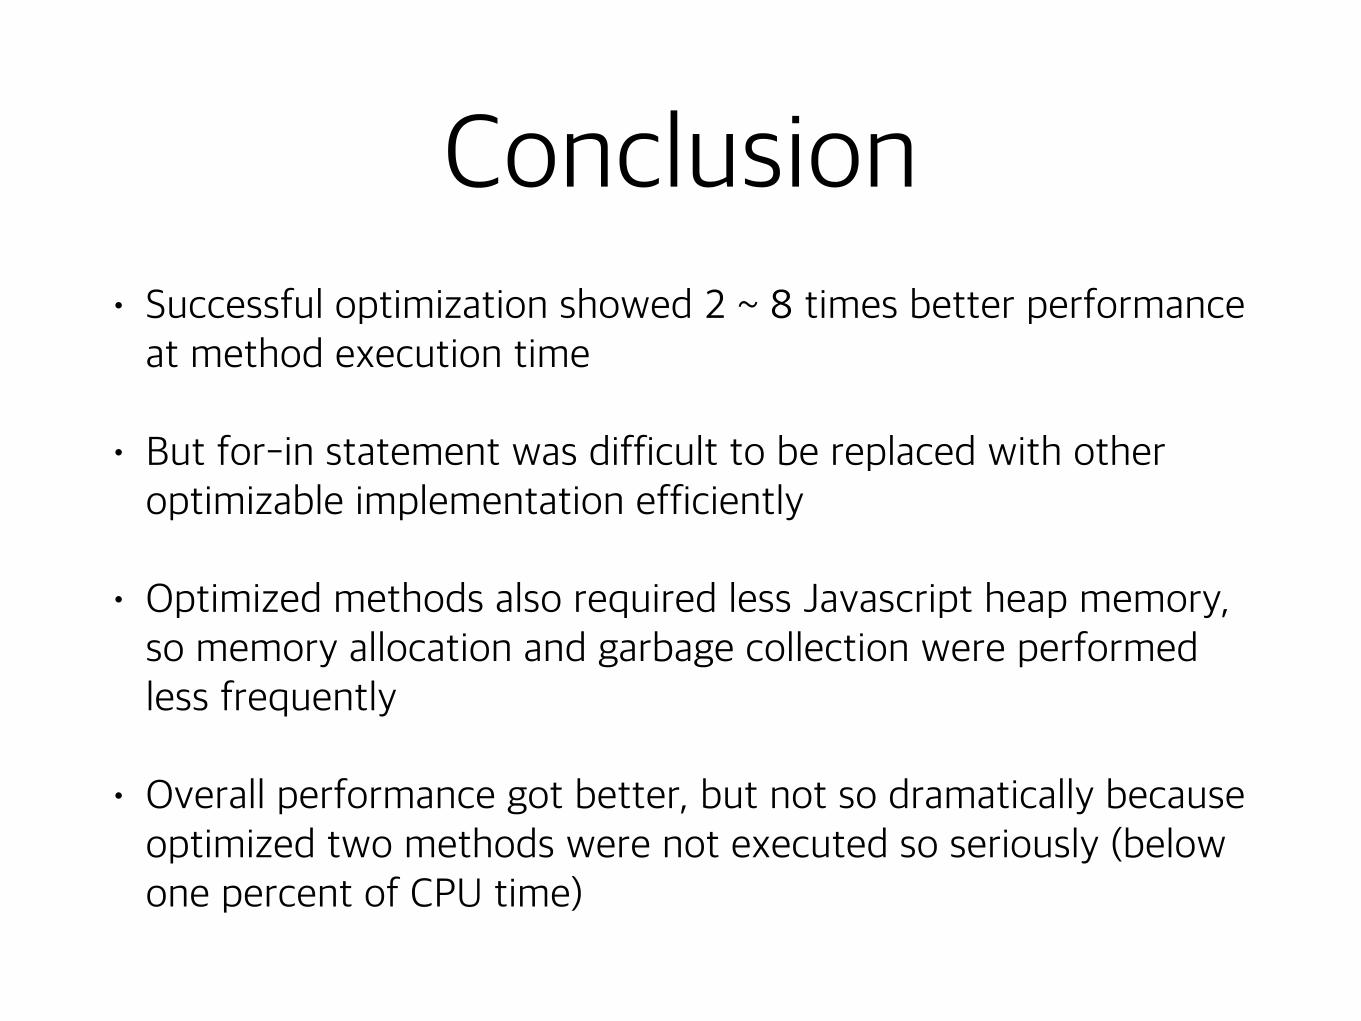
Conclusion• Successful optimization showed 2 ~ 8 times better performance
at method execution time
• But for-in statement was difficult to be replaced with other optimizable implementation efficiently
• Optimized methods also required less Javascript heap memory, so memory allocation and garbage collection were performed less frequently
• Overall performance got better, but not so dramatically because optimized two methods were not executed so seriously (below one percent of CPU time)
V8 References• Breaking the JavaScript Speed Limit with V8
• http://v8-io12.appspot.com/
• Accelerating Oz with V8: Follow the Yellow Brick Road to JavaScript Performance
• https://developers.google.com/events/io/sessions/324908972
• Memory Management Masterclass with Addy Osmani
• https://speakerdeck.com/addyosmani/javascript-memory-management-masterclass
• A tour of V8: Crankshaft, the optimizing compiler
• http://jayconrod.com/posts/54/a-tour-of-v8-crankshaft-the-optimizing-compiler
• A tour of V8: full compiler
• http://jayconrod.com/posts/51/a-tour-of-v8-full-compiler
Chrome References• Profiling JavaScript Performance
• https://developer.chrome.com/devtools/docs/cpu-profiling
• JavaScript Memory Profiling
• https://developer.chrome.com/devtools/docs/javascript-memory-profiling