Embed Size (px)
Citation preview

W16 Session 10/26/2016 3:00:00 PM
Test Metrics in Agile: A Powerful Tool to Demonstrate Value
Presented by:
Iuliia Zavertailo
Itera Norge
Brought to you by:
350 Corporate Way, Suite 400, Orange Park, FL 32073 888---268---8770 ·· 904---278---0524 - [email protected] - http://www.starcanada.techwell.com/

Iuliia Zavertailo Itera Norge A senior test lead in projects at the Nordic Insurance & Pension company—KLP, Iuliia Zavertailo has ten years of experience in the testing and quality assurance field focused on test management and test processes. As a consultant and adviser on test matters, Iuliia has been working with ISO 9000 standards assisting with the implementation of test routines and frameworks at the Itera company. For a large insurance company, IF Skadeforsikring, she implemented the metrics collection framework which is now used to visualize the quality status of key corporate products and to track progress on test process improvements.

TEST METRICS IN AGILE
TEST MANAGEMENT
A POWERFUL TOOL TO SUPPORT CHANGES
Yulia Zavertailo, Senior Test manager

Agenda
− About me.
− Introduction to the client’s case.
− What needs to be improved?
− How do we visualize our results?
− A closer look at the KPIs and how to gather them.
− Conclusions.
21.09.2016 / 3

About me
− 10 years of work experience in the field of
Testing and Quality Assurance, 7.5 years in
Itera.
− Moved to Oslo in November 2014.
− Key competences:
− test management,
− test advisory on process establishment
in a project and entire organization.
− Very passionate about the ISO
9000/ISO29119 standards.
− Mentor and coach for junior testers.
− Love running, skiing and oil painting.
21.09.2016 / 4

IF Skadeforsikring – general
21.09.2016 / 5
− Waypoint is the largest digital solution at IF built on
modern technology platform with lots of interfaces
for clients and internal users (1000+).
− Methodology – Agile (Scrum, Kanban).
− 13 Agile teams.
− Each team has both business and IT competence.
− IT development is done in headquarters in Oslo.
− Large Scandinavian insurance company present in the
Nordic countries and Baltics with 3,6 millions of clients
and 6 800 employees.

– System is not covered by tests.
– No professional IT testing is done in the project.
– Business users are involved to do the functional acceptance and
regression testing.
– Long production cycle: releases are 3-4 times a year.
21.09.2016 / 6
IF Skadeforsikring - as a test challenge
− Critical issues found in production after release.

IF Skadeforsikring - in a result
− IT test team has grown from 1 to 17 IT testers in Riga, Latvia.
− Frequency of releases is every 5 weeks.
− Response on the entire system quality and stability within a few hours.
− Project discovers and fixes 136 bugs in average every release .
− There are still functional modules which do not have enough test
coverage = facing high risk of defects.
21.09.2016 / 7

Specifically…
what are we going to improve?
1. Increase frequency of releases so that IT delivers functionality to the
business every 5 weeks by:
– Automating the regression test coverage.
– Discovering and fixing bugs earlier in the cycle.
– Improving development teams efficiency by doing continuous IT testing.
21.09.2016 / 8

Specifically…
what are we going to improve?
2. Decrease amount of bugs in the production by:
– Running automated regression suits regularly.
– Improving the quality of testing itself.
– Introducing continuous manual testing while developing.
– Focus business resources doing acceptance testing only.
21.09.2016 / 9

Hmmm….
but how to prove the succeeded result?
Present test results our client is interested in:
– Test coverage.
– # of defects found in production.
– # of defects found in sprints.
– Time spent by end users.
– Time for feedback about system’s quality.
21.09.2016 / 10

KPI #1 – Test Coverage
What do we measure?
− Percentage of requirements covered by at least one test.
Why do we gather it in our Agile projects?
– Visualize “black spots” of our application.
– Visualize that the larger test coverage is, the less risk of missing
defects is.
– Visualize the functionality that needs more attention since it is less
covered by tests.
21.09.2016 / 11

Application test coverage - example
21.09.2016 / 12
1075
739
430
800
230
419
310
244
130
465
70
141
54 13 8
69
4 10 0
200
400
600
800
1000
1200
Module 1 Module 2 Module 3 Module 4 Module 5 Module 6
Total user stories US covered manual US covered automated

How to gather Test Coverage KPI
1. Configure your Agile TM tool in order to build a traceability matrix in
TM tool (TFS, Jira, QC).
2. Use the graphs module of your TM tool or export to Pivot tables in
Excel.
3. Go for the Excel-option if you do not have any TM tool.
21.09.2016 / 13

KPI #2 - Defect open and close rates
What Do we measure?
Defect Open and Close rate = Defects found during testing in a release *100 (Defects found during testing in a release + Defects found after release)
21.09.2016 / 14
Why do we gather it in our Agile projects?
− Categorizing defects as either open or closed.
− Certain defects could slip through the cracks and show up in the finalized
release.
− Testers and developers to work together to identify and address software
issues.

Sprint vs production defects - trend example
21.09.2016 / 15
170
131
85 85
150
85
105
129 141
112
182 174
152
231
175
229
139
226
175
222
124
26
7 13 7 10 17
10
29 20 17
47
20 33
21 21 25 24 13 15 18
0
144
124
72 78
140
68
95 100
121
95
135
154
119
210
154
204
115
213
160
204
124
0
50
100
150
200
250
Total Production Defects Sprint Defects
How to gather defect open and close rates KPI
To get a rate:
− Get the number of defects found during a release/sprint.
− Get the number of bugs reported by the business after release to
production.
− Calculate rate based on a formula.
To build a trend graph:
− Jira + Zephyr dashboards.
− TFS + pivot tables in Excel.
21.09.2016 / 16
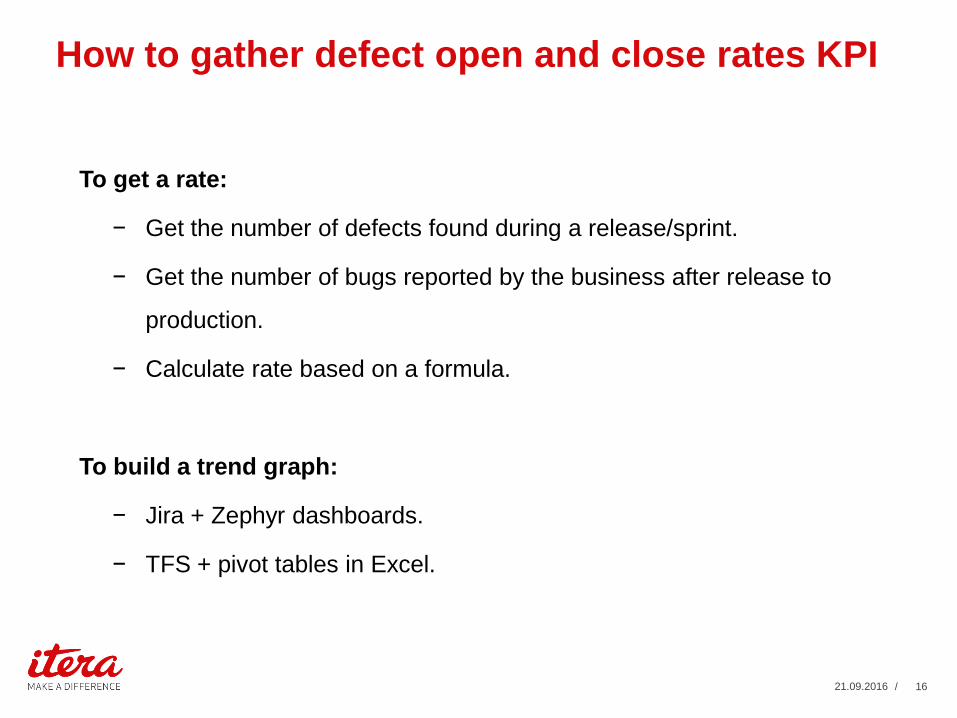
KPI #3 - Issues reported by customers
What Do we measure?
% of customer reported issues = Total # of issues reported by customers *100
total number of issues reported
Why do we gather it in our Agile projects?
− Does the product meet the needs of a customer/end user?
− Effectiveness of test team.
− Types and number of defects lingering in released products.
− Critical issues with current QA processes?
21.09.2016 / 17

Customer issues reported – example of trend
21.09.2016 / 18
1 12 7 3 6 4 2 3 2 1 4 4 3 1 2 9 2
14 8 11 5
144 124
72 78
140
68
95 100
121
95
135
154
119
210
154
204
115
213
160
204
124
0
50
100
150
200
250
Customer reported isues Bugs all
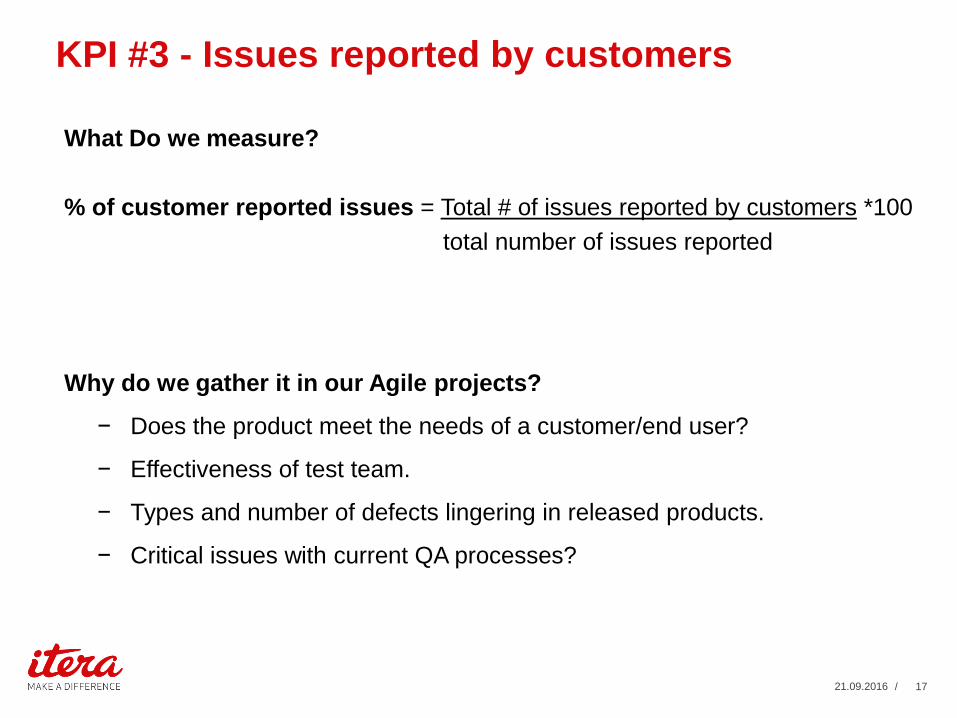
Issues reported by customers per functional
area – example of trend
21.09.2016 / 19
10
3
10
1
6
3
9
3
2
5
15
5
6
1
3
1
1
3
2
1
1
12
2
3
1
4
4
1
5
1
3
4
3
7
2
2
1
2
1
4
6
5
5
2
5
1
2
2
2
2
1
3
2
2
2
1
2
4
9
5
5
5
4
6
4
7
6
0 5 10 15 20 25 30 35 40 45 50
Release1
Release2
Release3
Release4
Release5
Release6
Release7
Release8
Release9
Release10
Release11
Release12
Module1 Module2 Module3 Module4 Module5 Module6 Module7

How to gather issues reported by customers
KPI
To get a rate:
− Get the number of defects found by customers.
− Get the total number of defects found in a sprint.
− Calculate the rate based on a formula.
To build a trend graph:
− TFS + pivot tables in Excel.
21.09.2016 / 20
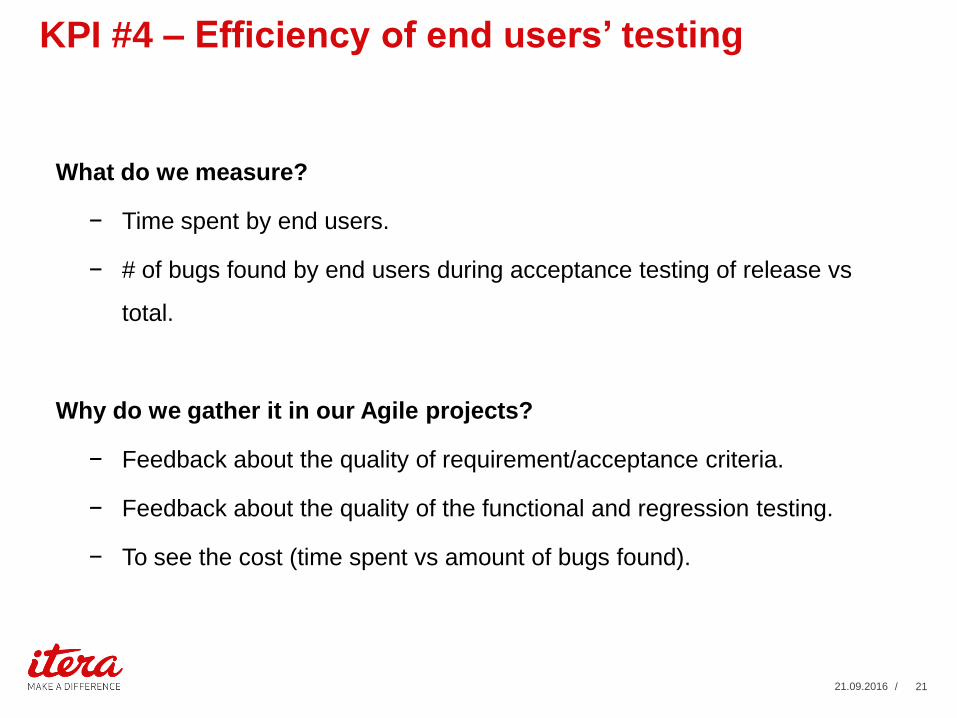
KPI #4 – Efficiency of end users’ testing
21.09.2016 / 21
What do we measure?
− Time spent by end users.
− # of bugs found by end users during acceptance testing of release vs
total.
Why do we gather it in our Agile projects?
− Feedback about the quality of requirement/acceptance criteria.
− Feedback about the quality of the functional and regression testing.
− To see the cost (time spent vs amount of bugs found).

Time spent by end users – example of trend
21.09.2016 / 22
97
83
135.5
161.5
124 127 123
237
152.5
135.5
288.5
112
131.5
147.5 159
110
30 30 29 28.5 30 31 31 26
15.5 16.5 21.5
15 14.5 16 12 13.5
80 75
62 54
34
47 48 40 40
12 10 7.5 6.5 8 9 5 7 6 5 8 5 10 9.5 5 6.5
30 29
79 85
69 69 69
96
39 48
193
54 54 54
77
42
0
50
100
150
200
250
300
350
Total
Country Domain 1
Country Domain 2
Country Domain 3
Country Domain 4
Country Domain 5

KPI #5 - Regression test suite duration
What do we measure?
− Time for feedback about system’s stability and quality – TA.
− Time for feedback about system’s stability and quality – Manual.
Why do we gather it in our Agile projects?
− Get a clue about time needed to regression-test a hot fix or feature.
− Decision-making input for further planning.
− Visualized benefit and efficiency of test automation.
21.09.2016 / 23

Regression test suite duration - example
21.09.2016 / 24
Test suite # of test cases in
a suite Time to run test suite
with TA, hrs
Time to run suite
manually, hrs
Smoke test suite 6 0,2 1,5
Regression suite 1 191 5,5 47,75
Regression suite 2 204 5,5 51
Regression suite 3 194 5,5 48,5
Total 595 16,7 149

KPIs framework – in a few simple steps
1. Decide which KPIs are important for your client (focus on KPIs 1-3).
2. Configure your test management tool and visualize.
3. Continuously use KPIs at all levels of communication.
21.09.2016 / 25

Summary
− KPIs framework is a powerful tool to be an Agile test leader!
− Control the status of quality in a measurable way.
− Control the general healthiness of the test solution and strategy in your
project.
− Lead and make decisions in your project.
− Empower yourself to prove that IT- testing is a must in your project!
21.09.2016 / 26

QUESTIONS?
21.09.2016 / 27
Contacts
• LinkedIn: https://no.linkedin.com/in/yuliazavertailo
• Email: [email protected]
21.09.2016 / 28
THANK YOU!
21.09.2016 / 29