Embed Size (px)
Citation preview
The 5 Essential Steps to Building a Data Product

Webinar notes
Please send questions using the online interface
Attendees muted upon entry
‹#›
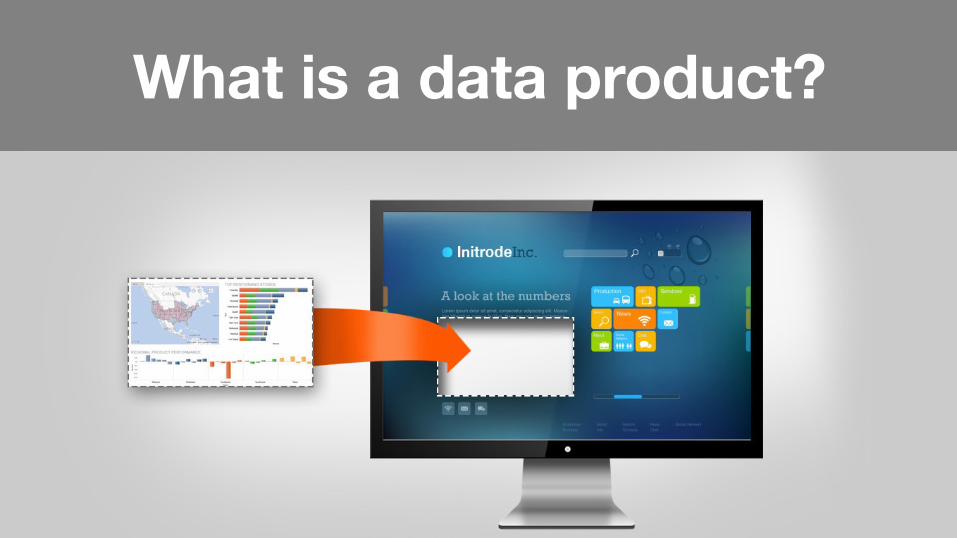
What is a data product?
‹#›
Building a data product is different.

6
It’s a scary proposition.
It’s the first time for most people

‹#›
The stakes can be very high.

‹#›
You have to treat it like a journey, not a switch.
‹#›
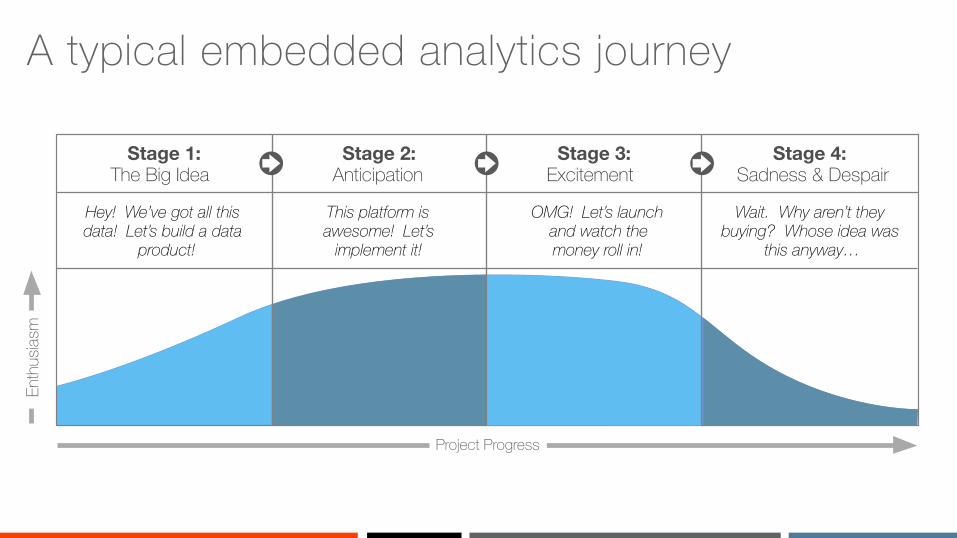
A typical embedded analytics journey
Stage 3:Excitement
Project Progress
Enth
usias
m
Hey! We’ve got all this data! Let’s build a data
product!
This platform is awesome! Let’s
implement it!
OMG! Let’s launch and watch the money roll in!
Wait. Why aren’t they buying? Whose idea was
this anyway…
Stage 1:The Big Idea
Stage 4:Sadness & Despair
Stage 2:Anticipation

‹#›
What?My journey to building analytical products

‹#›
I made one good decision…
‹#›
5 Essential Steps to Building a Data Product

‹#›
Get the team aligned
Step One
1

‹#›
400+ wins don’t happen by chance
Credit: Natursport / shutterstock.com

‹#›
You have to plan for
them.
Credit: Gines Romero / shutterstock.com
16
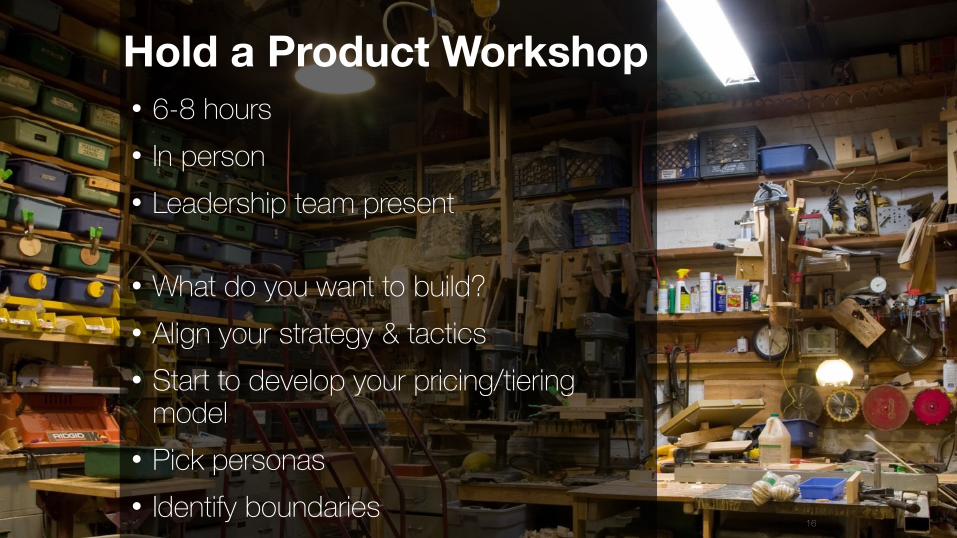
Hold a Product Workshop• 6-8 hours • In person • Leadership team present
• What do you want to build? • Align your strategy & tactics • Start to develop your pricing/tiering
model • Pick personas • Identify boundaries

‹#›
Create your elevator pitch.
‹#›
Step Two
Know your users & their needs2

‹#›Concepts from Nir Eyal “Hooked, How to Build Habit-Forming Products,”
If this is your goal
Goal: an enticing, engaging product that keeps you coming back
‹#›
You get there by linking users’ goals to resolution via analytics

‹#›Concepts from Nir Eyal “Hooked, How to Build Habit-Forming Products,”
You need to know:• Who are you? • What are you
trying to achieve? • Why can’t you do
it today?
‹#›
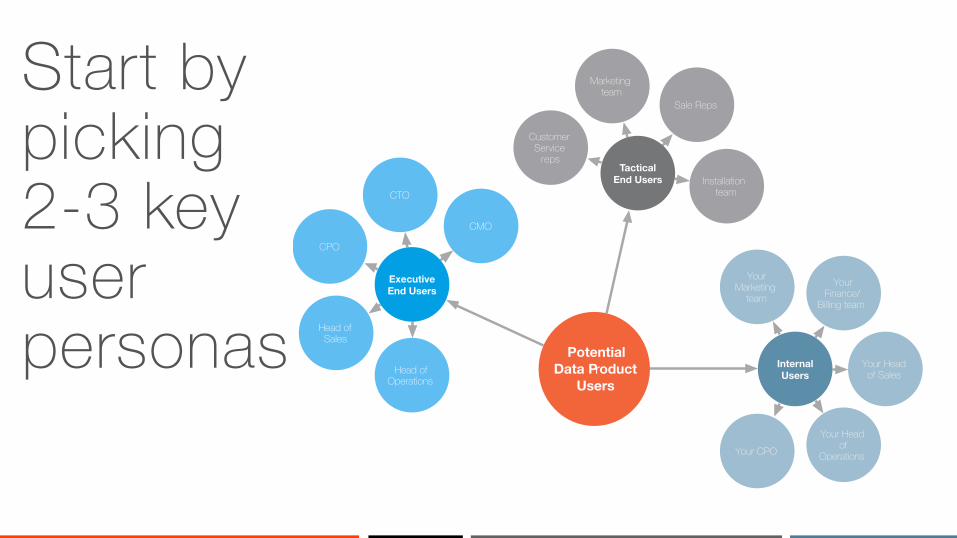
Start by picking 2-3 key user personas Potential
Data Product Users
CMO
CTO
CPO
Head of Sales
Head of Operations
Executive End Users
Internal Users
Tactical End Users Installation
team
Sale Reps
Marketing team
Customer Service
reps
Your CPOYour Head
of Operations
Your Head of Sales
Your Finance/
Billing team
Your Marketing
team

‹#›
“I feel like I’m operating blind. I don’t know what campaigns are doing well and which are doing poorly until it’s way too late to take action and correct any problems”
Salesforce.comMarketoExcel spreadsheetsFunnel toolNetSuite
360 view of customers360 view of campaignsSee gaps and coverageSee geographic overview of campaign reach
Can’t see performance by region, team, or campaignCan’t perform “what if” analysisGuesses at best course of actionCan’t see if campaigns touch customers multiple times or if gaps exist
Key Wishes or NeedsTools Used TodayFrustrations or Pain Points
Needs to develop marketing campaigns that attract new customers and encourage existing customers to try new products and featuresMission
Key CharacteristicsThe focus of all demand gen programsA trusted advisor to the executive and sales teamsPulled in many different directions
VP of Corporate Marketing StrategyRole or Title
Build persona cards for key users
‹#›
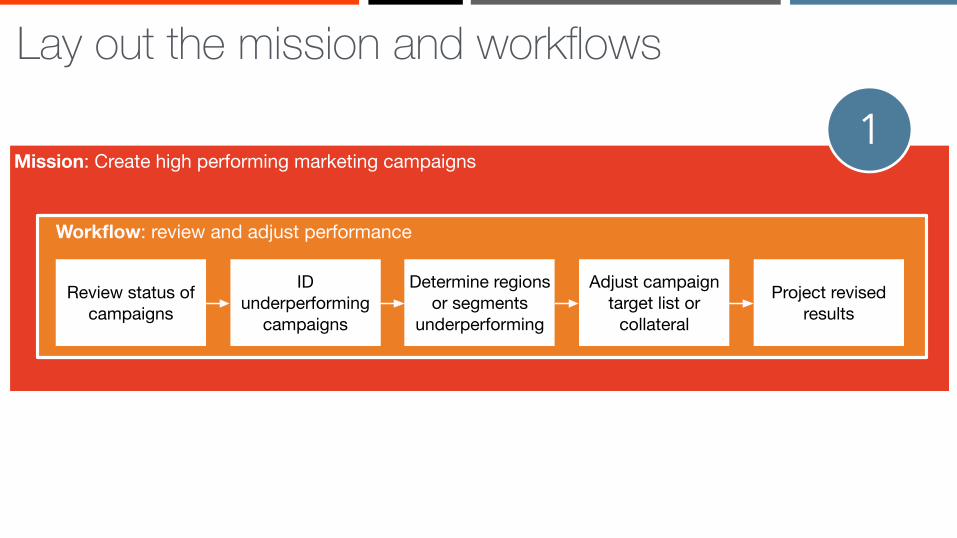
Lay out the mission and workflows
Mission: Create high performing marketing campaigns
Workflow: review and adjust performance
Review status of campaigns
ID underperforming
campaigns
Determine regions or segments
underperforming
Adjust campaign target list or
collateral
Project revised results
1
‹#›
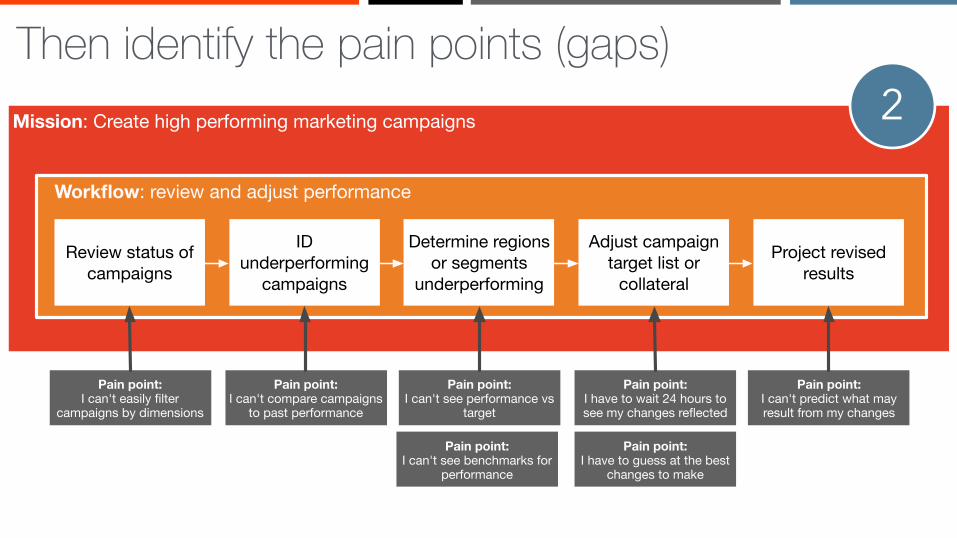
Then identify the pain points (gaps)Mission: Create high performing marketing campaigns
Workflow: review and adjust performance
Review status of campaigns
ID underperforming
campaigns
Determine regions or segments
underperforming
Adjust campaign target list or
collateral
Project revised results
Pain point:I can't compare campaigns
to past performance
Pain point:I can't see performance vs
target
Pain point:I can't see benchmarks for
performance
Pain point:I can't predict what may result from my changes
Pain point:I have to wait 24 hours to see my changes reflected
Pain point:I can't easily filter
campaigns by dimensions
Pain point:I have to guess at the best
changes to make
2

‹#›
And determine the analytics to close the gaps
Table with filter
Clustered bar chart
Predictive analytics
Analytics for this persona
Bar/line chart
Mission: Create high performing marketing campaigns
Workflow: review and adjust performance
Review status of campaigns
ID underperforming
campaigns
Determine regions or segments
underperforming
Adjust campaign target list or
collateral
Project revised results
Pain point:I can't compare campaigns
to past performance
Pain point:I can't see performance vs
target
Pain point:I can't see benchmarks for
performance
Pain point:I can't predict what may result from my changes
Pain point:I have to wait 24 hours to see my changes reflected
Pain point:I can't easily filter
campaigns by dimensions
Pain point:I have to guess at the best
changes to make
3
‹#›
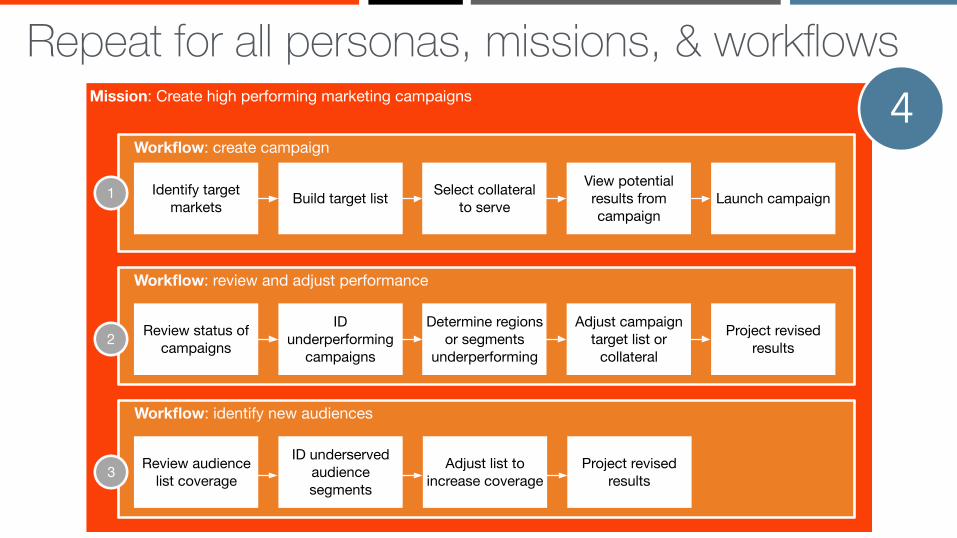
Repeat for all personas, missions, & workflowsMission: Create high performing marketing campaigns
Workflow: create campaign
Workflow: review and adjust performance
Review status of campaigns
ID underperforming
campaigns
Determine regions or segments
underperforming
Adjust campaign target list or
collateral
Project revised results
Identify target markets Build target list Select collateral
to serve
View potential results from campaign
Launch campaign1
2
Workflow: identify new audiences
Review audience list coverage
ID underserved audience segments
Adjust list to increase coverage
Project revised results3
4

‹#›
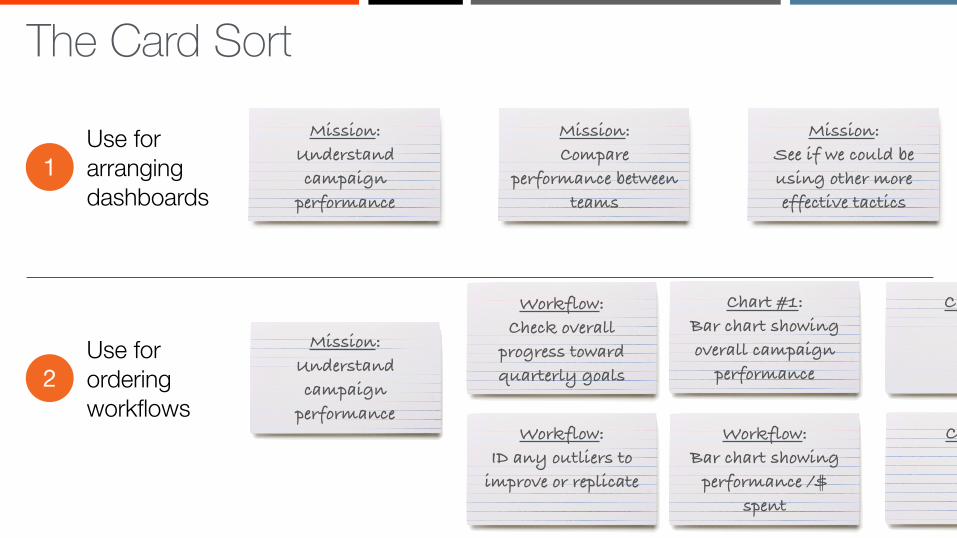
The Card Sort
‹#›
The Card SortMission:
Understand campaign
performance
Mission: Compare
performance between teams
Mission: See if we could be using other more effective tactics
Use for arranging dashboards
1
Use for ordering workflows
2Mission:
Understand campaign
performance
Workflow: Check overall
progress toward quarterly goals
Workflow: ID any outliers to
improve or replicate
Chart #1: Bar chart showing overall campaign
performance
Chart
Workflow: Bar chart showing
performance /$ spent
Chart
‹#›
Decide what you’re offering3
‹#›
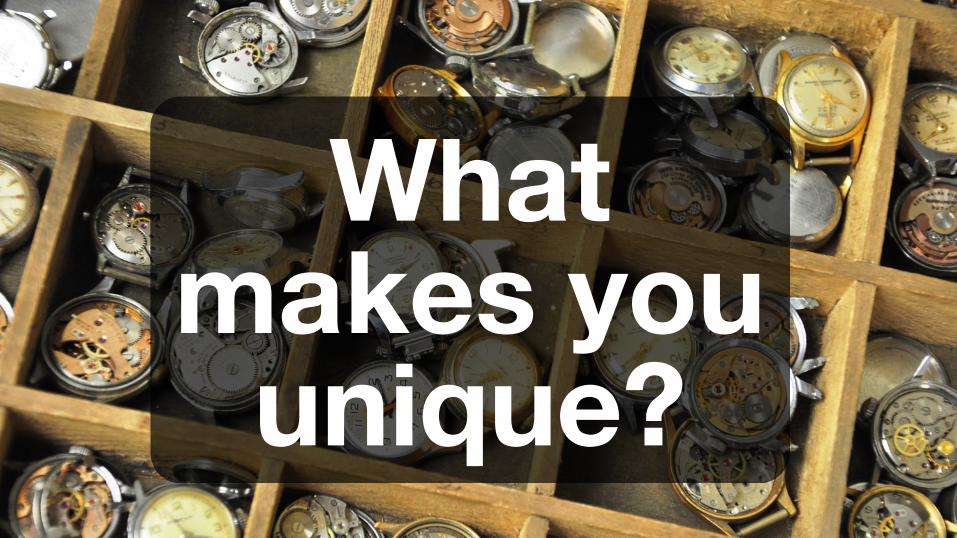
What makes you
unique?

‹#›
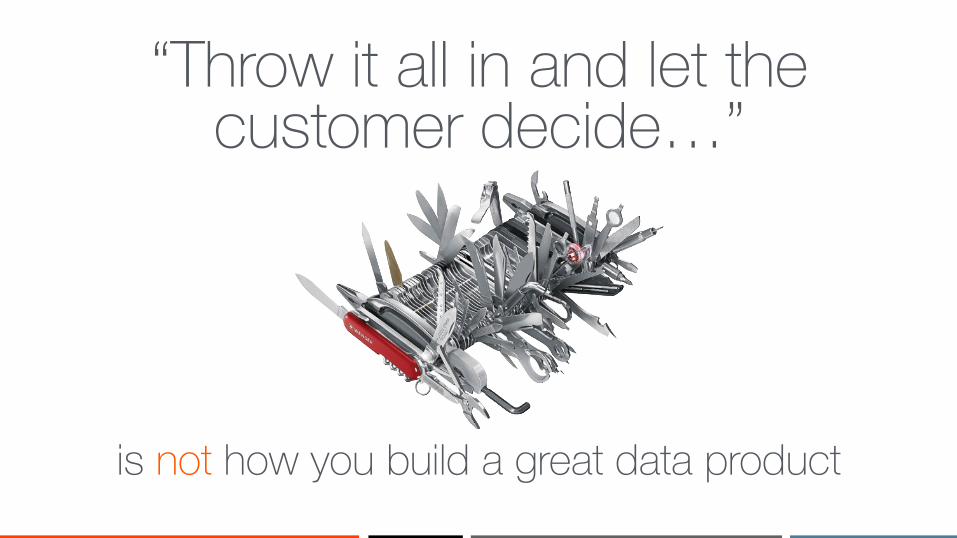
Don’t use the shotgun approach to dashboard design
‹#›
“Throw it all in and let the customer decide…”
is not how you build a great data product
‹#›
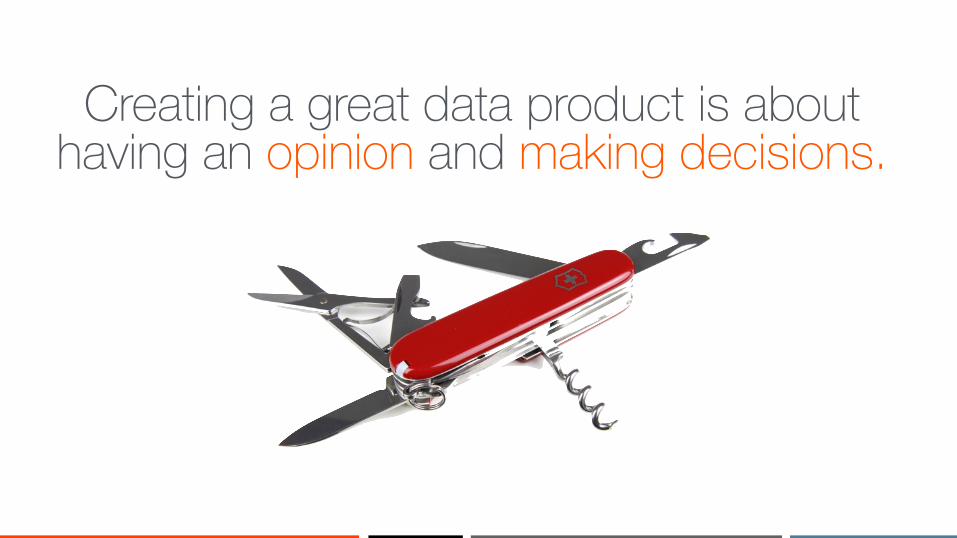
Creating a great data product is about having an opinion and making decisions.

‹#›
Know your boundariesStuff We Won’t Do
Stuff We W
on’t Do
The Product
Stuff We’ll Do as Part of the Core Product
Stuff We’ll Do for an Extra Fee
Stuf
f We
Won
’t Do
Stuff We Won’t Do
‹#›
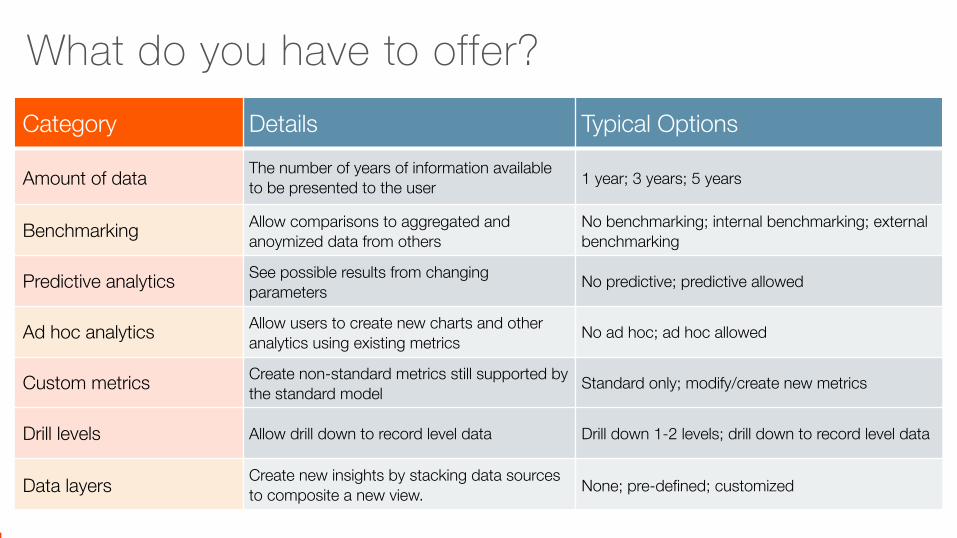
Category Details Typical Options
Amount of data The number of years of information available to be presented to the user 1 year; 3 years; 5 years
Benchmarking Allow comparisons to aggregated and anoymized data from others
No benchmarking; internal benchmarking; external benchmarking
Predictive analytics See possible results from changing parameters No predictive; predictive allowed
Ad hoc analytics Allow users to create new charts and other analytics using existing metrics No ad hoc; ad hoc allowed
Custom metrics Create non-standard metrics still supported by the standard model Standard only; modify/create new metrics
Drill levels Allow drill down to record level data Drill down 1-2 levels; drill down to record level data
Data layers Create new insights by stacking data sources to composite a new view. None; pre-defined; customized
What do you have to offer?
‹#›
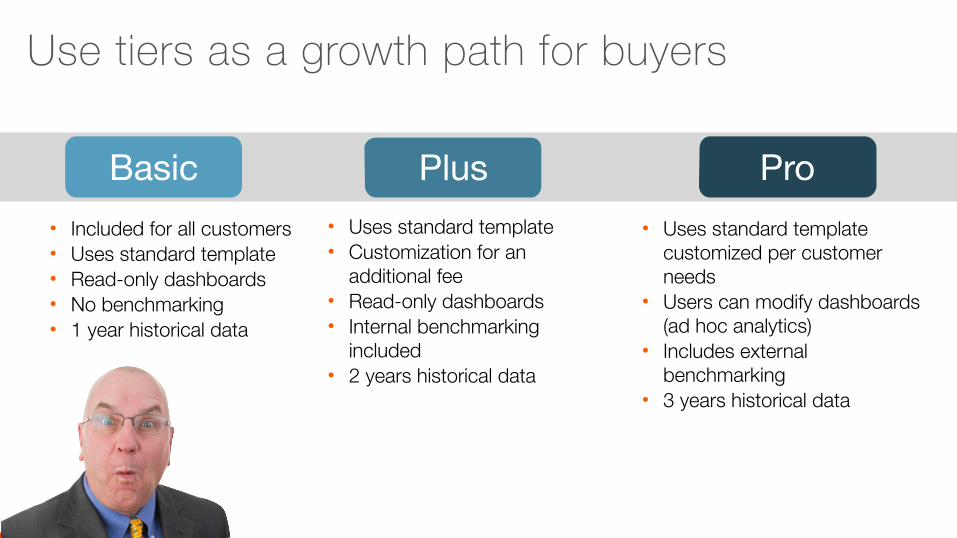
Basic• Included for all customers • Uses standard template • Read-only dashboards • No benchmarking • 1 year historical data
Plus Pro• Uses standard template • Customization for an
additional fee • Read-only dashboards • Internal benchmarking
included • 2 years historical data
• Uses standard template customized per customer needs
• Users can modify dashboards (ad hoc analytics)
• Includes external benchmarking
• 3 years historical data
Use tiers as a growth path for buyers
‹#›
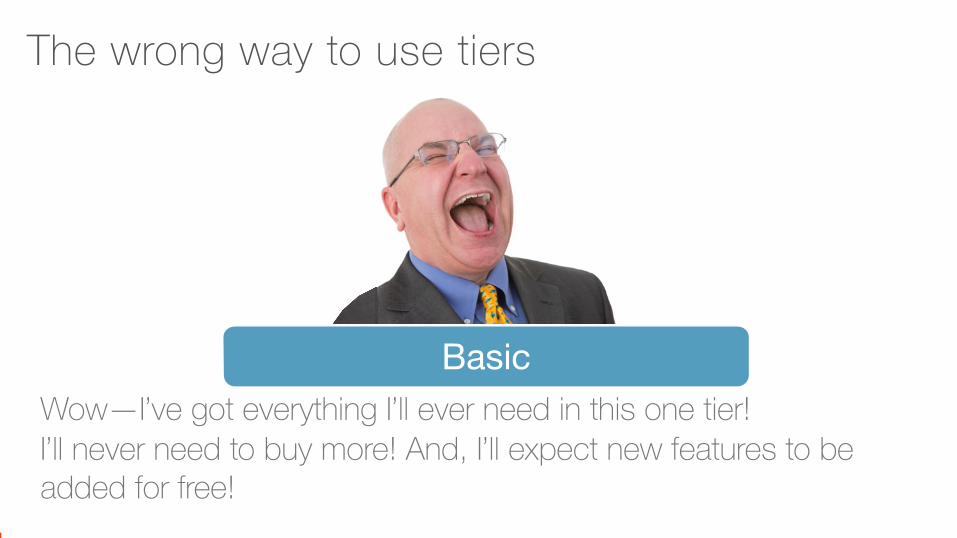
BasicWow—I’ve got everything I’ll ever need in this one tier! I’ll never need to buy more! And, I’ll expect new features to be added for free!
The wrong way to use tiers
‹#›
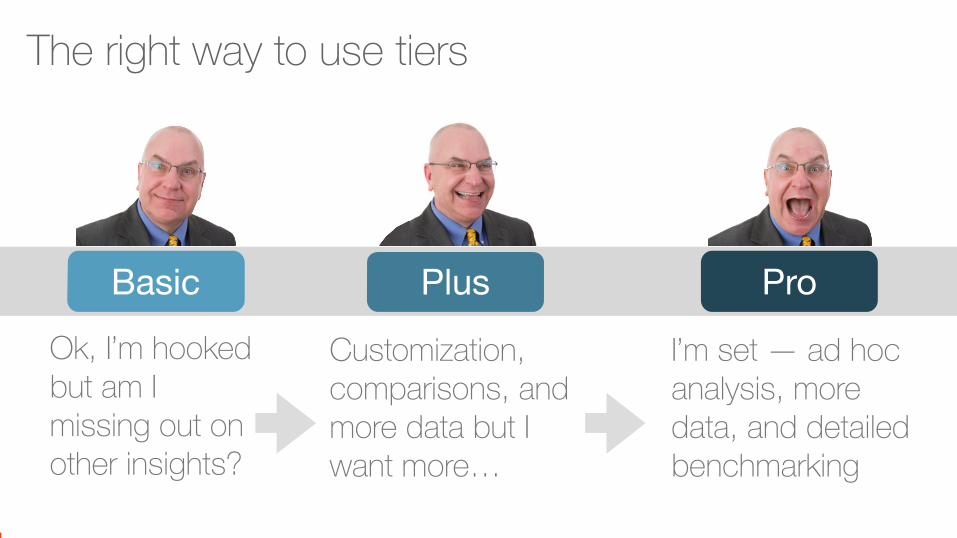
Basic
Ok, I’m hooked but am I missing out on other insights?
Plus Pro
The right way to use tiers
Customization, comparisons, and more data but I want more…
I’m set — ad hoc analysis, more data, and detailed benchmarking
‹#›
Decide how to price your analytics
4
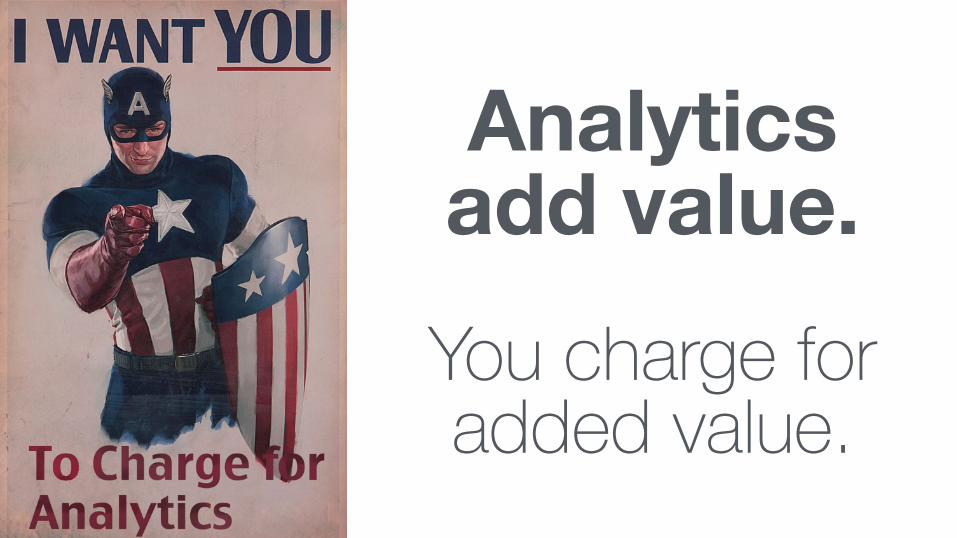
Analytics add value. You charge for added value.
‹#›
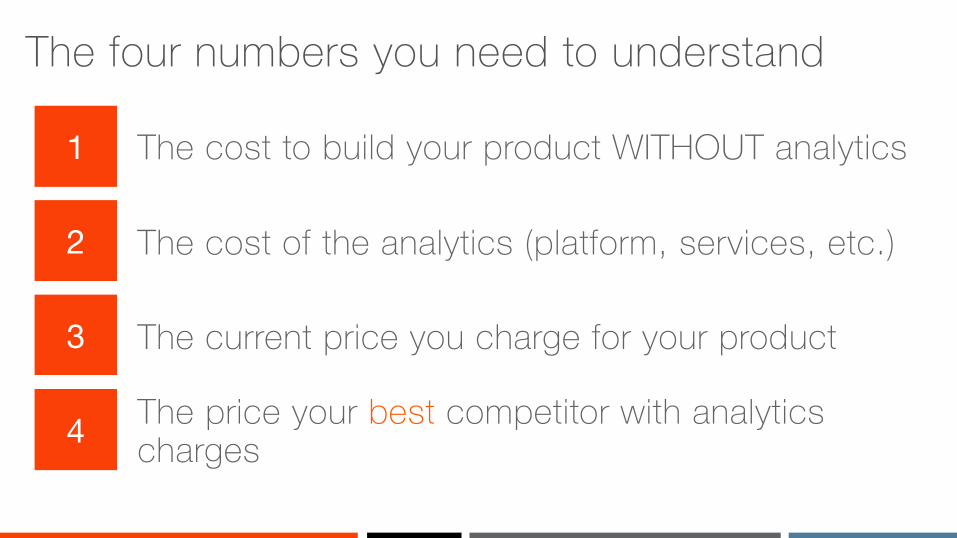
The four numbers you need to understand
1
2
3
4
The cost to build your product WITHOUT analytics
The cost of the analytics (platform, services, etc.)
The current price you charge for your product
The price your best competitor with analytics charges
‹#›
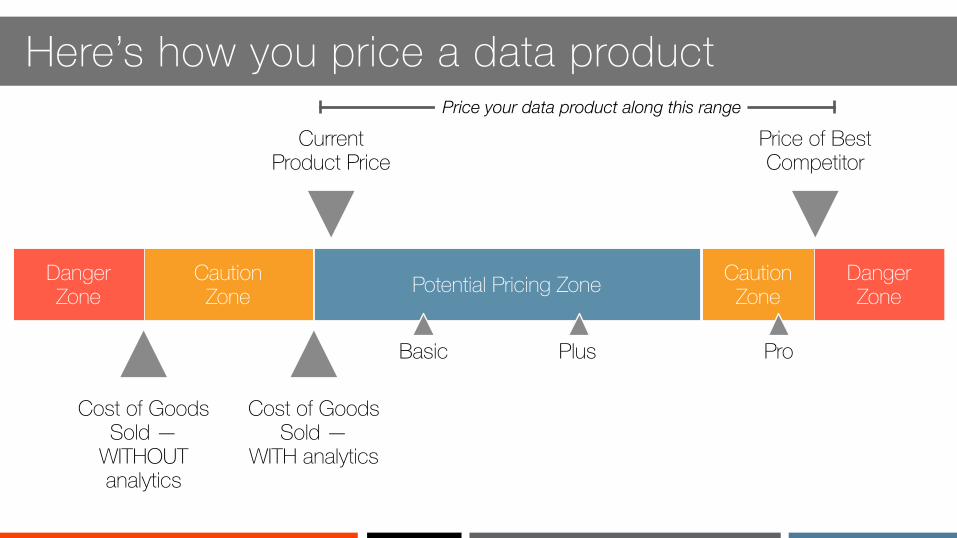
Here’s how you price a data product
Potential Pricing Zone CautionZone
DangerZone
CautionZone
DangerZone
Price your data product along this range
Cost of Goods Sold —
WITHOUT analytics
Cost of Goods Sold —
WITH analytics
Current Product Price
Price of Best Competitor
Basic Plus Pro
‹#›
Build your support system5
45
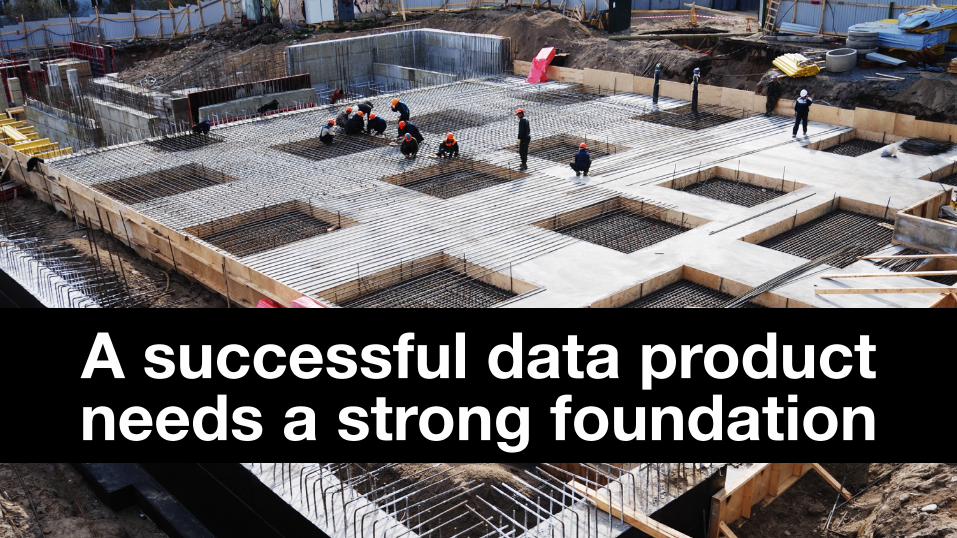
A successful data product needs a strong foundation
‹#›
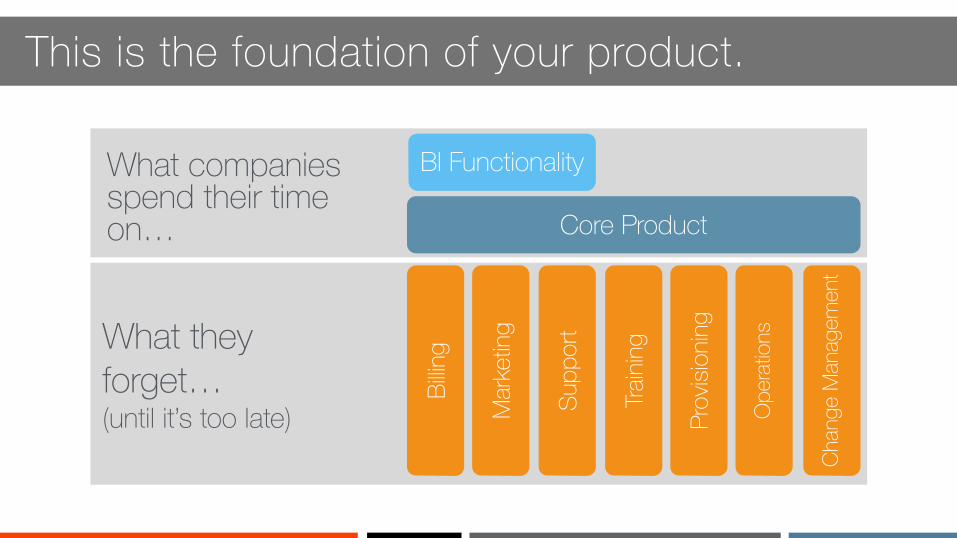
This is the foundation of your product.
Core Product
BI FunctionalityWhat companies spend their time on…
Ope
ratio
ns
Prov
ision
ing
Traini
ng
Supp
ort
Mar
ketin
g
Billin
g
Chan
ge M
anag
emen
t
What they forget… (until it’s too late)

‹#›
Don’t do this when building your support processes
48
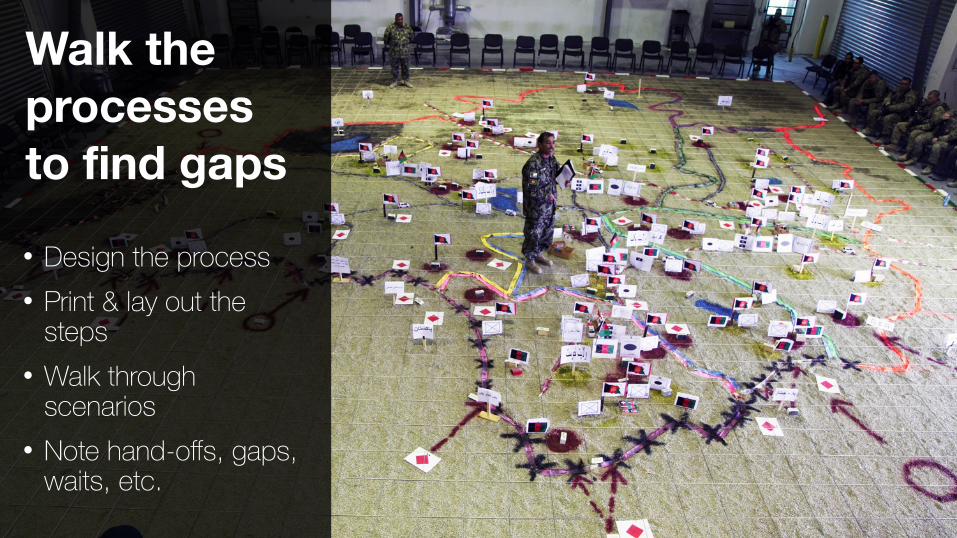
Walk the processes to find gaps
• Design the process • Print & lay out the
steps • Walk through
scenarios • Note hand-offs, gaps,
waits, etc.

49
Set trip wires• Use key launch
metrics • Set “do not cross”
thresholds • Know what to do if
crossed • Do it beforehand • Monitor

50
Establish a command center• Have representative
from all key stakeholder groups
• Establish who is in charge
• Regular reviews • Monitor trip wires
‹#›
Summary1 Get alignment 2 Know your users 3 Determine the structure 4 Price it 5 Create a support system

‹#›

‹#›Concepts from Nir Eyal “Hooked, How to Build Habit-Forming Products,”
If this is your goal
Yes

‹#›Concepts from Nir Eyal “Hooked, How to Build Habit-Forming Products,”
No

‹#›
Thank you!