Embed Size (px)
Citation preview

Monitoring Challenges on Large Environment using Oracle
Rodrigo Mohr - Dell IT

Size of the Problem

3
Operations
4.5k+
Items: 75k+Triggers: 30k+Host Groups: 400+
Monitored Hosts297
Standard interval of 5 minutes
Values per Second
24 avg
Registered: 200+
Active Users
500+ /day
Incidents: 250+Peak: 6k+False positive: 10%
New events50+ /day
Created ad-hoc and via automated process
New maintenances
200+ /month
Monitors Created: 1k+Monitors Updated: 500+Monitors Removed: 200+
Configuration Changes

Background

5
Biography
Bachelor Degree in Computer Science

6
Zabbix Infrastructure at Dell IT
Users

7
Our Processes
Windows and Linux serversServer Monitoring
Oracle and SQL databasesDatabase Monitoring
Incident Mgmt, Change Mgmt, Request Mgmt, …ITIL Process
Focused on setup of monitoringZabbix Admin Team
Focused on watching Monitoring IncidentsMonitoring Team (L1)
Escalation for L1, define monitoring requirementsApplication Team (L2)
Identified by L2, created by Zabbix AdminCustom Monitors
Identified and created by Zabbix AdminBaseline Monitors

8
Global Team
Brazil• Zabbix Admin• Monitoring L1• Application L2• Developers L3
United States• Application L2
India• Application L2• Developers L3
Malaysia• Zabbix Admin• Monitoring L1

Challenges andOur Approach

10
Main Challenges
Environment Maintenances
• Frequent changes in the environment being monitored
• Issues caused by changes
Performance
• Oracle Database
• Large environment
Configuration Updates
• Constant changes on monitored items
Reporting

11
Table Partitioning
Our Approach - 1) Performance
Pros:
- Keep size of tables under control
- Reduces housekeeping effort
Cons:
- Don’t take benefit of partitioning during SELECT
New column: DATE_COL
HISTORY HISTORY LOG
HISTORY STR
HISTORY TEXT
HISTORY UINT
Faster queries in History
- Daily Partition- Daily cleanup job
(deletes old partition)

12
Query Optimization
Our Approach - 1) Performance
Identify top offending
queries
Debug mode in Zabbix
frontend
SQL profiling
tool inside Web servers
DBA Analytics
Optimize queries in
code
Create new
index
Apply SQL
Profile

13
Query Optimization
Our Approach - 1) Performance
• Web Servers
• File: /var/www/html/include/db.inc.php
• Function: Dbselect
• Queries– Last value from history with clock filter
– OLD: SELECT * FROM (SELECT * FROM history_uint h WHERE h.itemid='152604' AND h.clock>1453661848 ORDER BY h.clock DESC) WHERE rownum BETWEEN 0 AND 1
– NEW: SELECT * FROM history_uint h WHERE h.itemid='152604' and h.clock>1453661848 and H.CLOCK = (SELECT MAX(H.CLOCK) FROM history_uint h WHERE h.itemid='152604' and h.clock>1453661848)
– Last value from history– OLD: SELECT * FROM (SELECT * FROM history_uint h WHERE h.itemid='137781' ORDER BY h.clock DESC) WHERE
rownum BETWEEN 0 AND 1
– NEW: SELECT * FROM history_uint h WHERE h.itemid='137781' and H.CLOCK = (SELECT MAX(H.CLOCK) FROM history_uint h WHERE h.itemid='137781')
• Improvement– Execution Time (avg): 0.9s (Old) X 0.001s (New)
– Hourly runs: 300k+
– Hourly savings: 75h (parallel executions)

14
Others
Our Approach - 1) Performance
.last(0) function
Active Proxy
Items Not Supported
Actions with Delay
Passive agents

15
Our Approach - 2) Configuration updates
Generic Templates
Baseline Templates- Basic monitors, valid for all servers of that type- Example: Windows Template with CPU Usage,
Memory Usage, Disk Space monitors- User Macros to customize thresholds per server
Extended Templates
- Specific types of monitors per template- All Items/Triggers are the same, changing only the
macro they refer to- Example:
- service_state[{$SVC01}]- service_state[{$SVC02}]
- If server needs new monitor, add User Macro, link template and enable Item/Trigger
- Limited amount of Items (covering 90% of servers)
- Same concept of the Generic Templates- Difference: number of Items/Triggers pre-configured- Example:
- Generic Service Template- 7 Items/Triggers- 600+ Hosts
- Extended Service Template- 20 Items/Triggers- 30+ Hosts
text
text
Baseline Templates
Generic Templates
Extended Templates
Baseline Templates

16
Our Approach - 2) Configuration updates
Generic Template
Extended Template
17
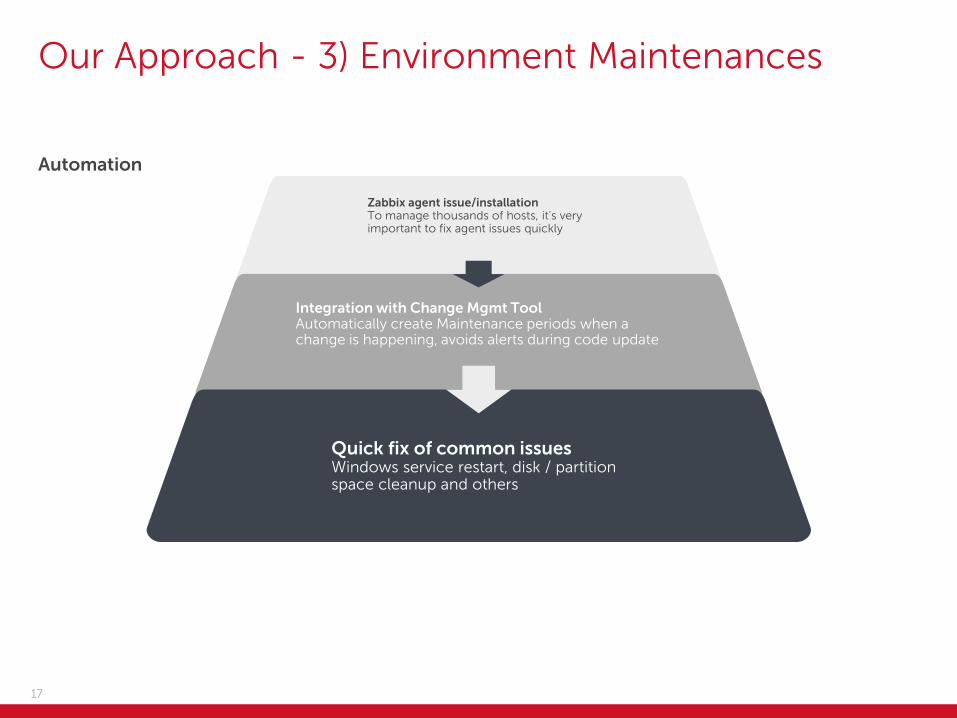
Automation
Our Approach - 3) Environment Maintenances
Zabbix agent issue/installationTo manage thousands of hosts, it’s very important to fix agent issues quickly
Integration with Change Mgmt ToolAutomatically create Maintenance periods when a change is happening, avoids alerts during code update
Quick fix of common issuesWindows service restart, disk / partition space cleanup and others

18
Others
Our Approach - 3) Environment Maintenances
Load Balancer Monitor
Quickly remove traffic from bad Web Server
Oracle Database
Monitor corrupted indexes, automate for quick fix
Action step delay
Wait 30min before sending event to Incident Mgmt tool

19
Our Approach - 4) Reporting
Used
• Availability Report
– Extracted weekly by one person
– Available in shared folder for everyone
• Inventory Hosts
– Checking which groups a Host is part of
Not Used
92% of users are Zabbix Users (no access to configuration)
• IT Services and Maps
– Manual configuration
– Too many triggers (30k+)
– Too many hosts (4.5k+)
– Too many logical groups (400+)

The Upshot

21
Key Achievements
Zabbix
ReportingUnderstand environment stability via weekly reporting
Avoiding IssuesFix code issues in Non-Production before they go into Production
StabilityEnable Testers / Developers to use their systems when needed

22
Wish List
Maintenances flexibility• More flexible permissions for configuring
maintenances• Allowing certain user groups to setup
maintenances without modifying the configuration of the hosts
Dashboards / Reporting• More dashboards allowing multi-group
filtering• Pre-configure report before running it
(availability report)
User Macros• Develop discovery based on User Macros,
to enable dynamic setup/removal of the monitors
• User Macros on Host Groups
Templates• Associate a template with a Host Group,
so that all Hosts inside that group would be linked with that template as well

23
Main Take Away
Database partitioning in
HISTORY tables
User macros are really helpful
for managing custom
monitors
Work with DBA to identify top offending queries, replace them in code if needed
Large Environment with Oracle

Questions??

Thank you!
Keep in touch!
- https://www.facebook.com/rodmohr- https://www.linkedin.com/in/rodmohr


![Zabbix & Security · [root@node03 zabbix-4.4.6]# cat /tmp/zabbix_server.log 27439:20201018:231117.705 Starting Zabbix Server. Zabbix 4.4.6 (revision 8cc702429d). 27439:20201018:231117.705](https://img.pdfslide.net/doc/110x75/60bc81e22945260dcd4c9701/zabbix-security-rootnode03-zabbix-446-cat-tmpzabbixserverlog-2743920201018231117705.jpg)