Embed Size (px)
Citation preview
Can India prevail? A statistical analysis of the ongoing T20 worldcup 3/21/2014
Submitted by:
Sugyan Panda, SIOM
Can India Prevail?
For the Indian cricket fans India has always been a most favoured nation for any cricket cup.
The winning of first ever T20 world cup has increased their expectation by many folds. After the first
one India couldn’t perform up to their expectation in any other T20 world cup.
Here is an analysis showing the potential of the current team to win another world cup. The step by
step analysis represents the current situation, who could be the possible key players and what
changes can be done in the current way of playing.
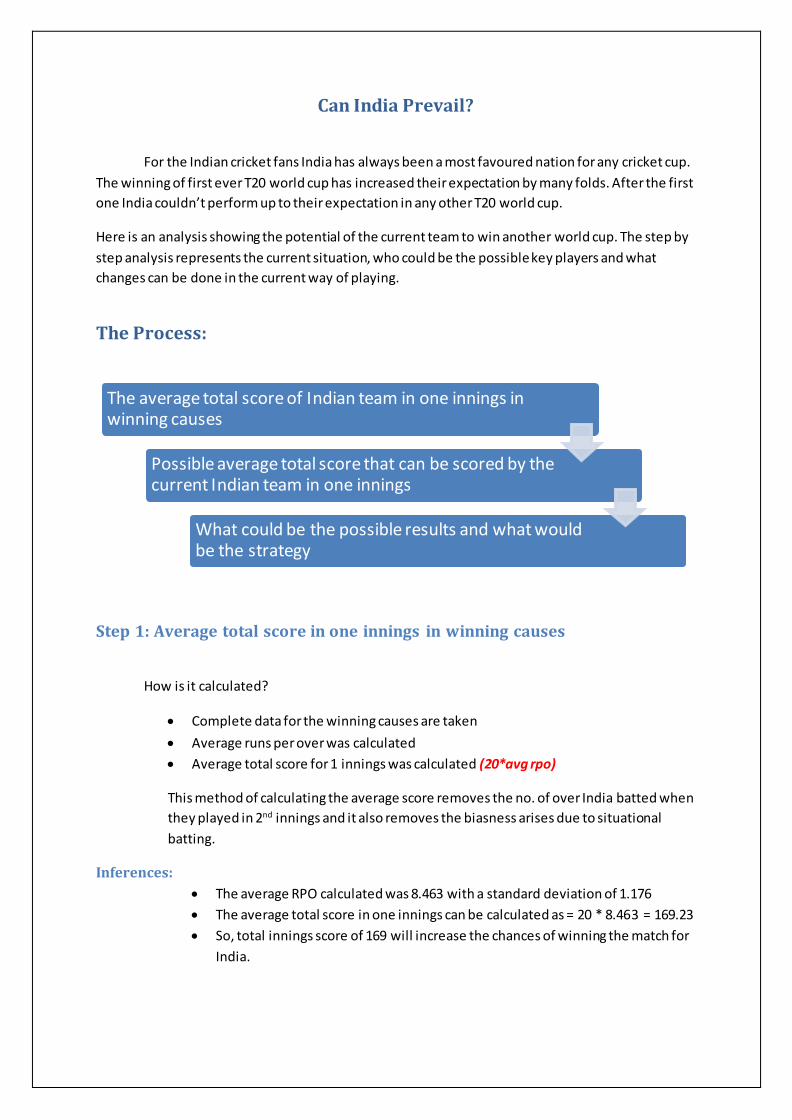
The Process:
Step 1: Average total score in one innings in winning causes
How is it calculated?
Complete data for the winning causes are taken
Average runs per over was calculated
Average total score for 1 innings was calculated (20*avg rpo)
This method of calculating the average score removes the no. of over India batted when
they played in 2nd innings and it also removes the biasness arises due to situational
batting.
Inferences:
The average RPO calculated was 8.463 with a standard deviation of 1.176
The average total score in one innings can be calculated as = 20 * 8.463 = 169.23
So, total innings score of 169 will increase the chances of winning the match for
India.
The average total score of Indian team in one innings in winning causes
Possible average total score that can be scored by the current Indian team in one innings
What could be the possible results and what would be the strategy
11109876
6
5
4
3
2
1
0
RPO
Fre
qu
en
cy
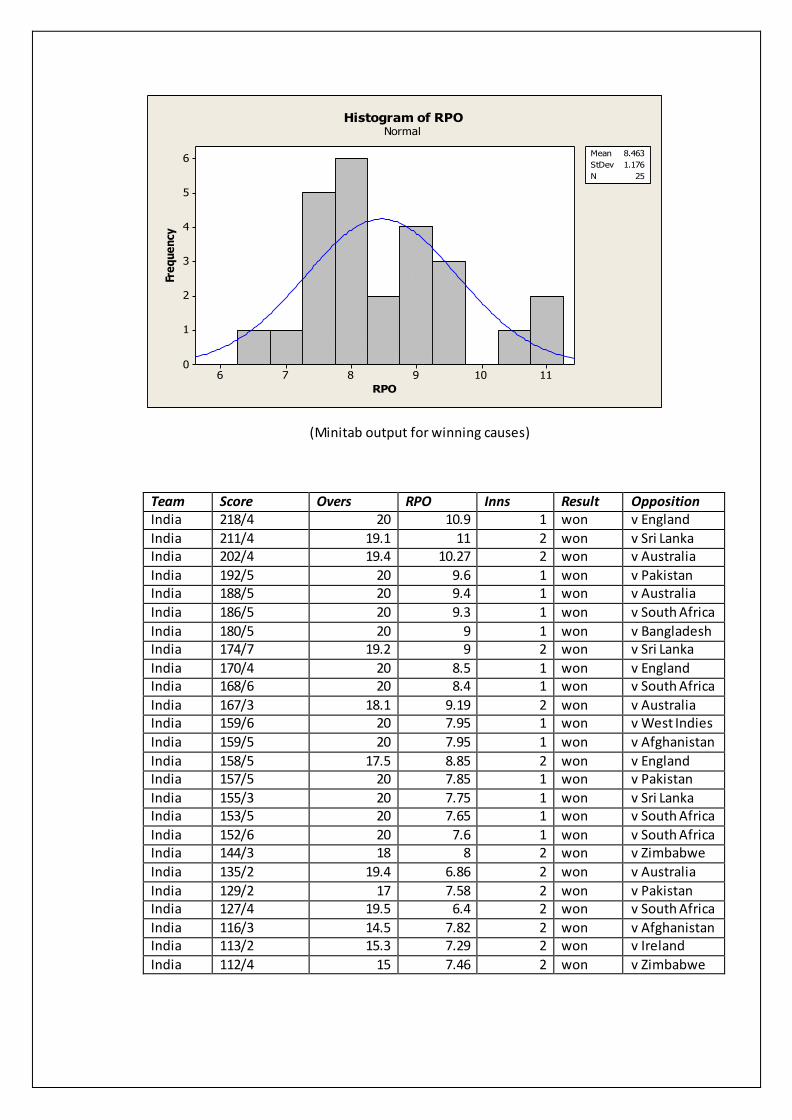
Mean 8.463
StDev 1.176
N 25
Histogram of RPONormal
(Minitab output for winning causes)
Team Score Overs RPO Inns Result Opposition India 218/4 20 10.9 1 won v England
India 211/4 19.1 11 2 won v Sri Lanka India 202/4 19.4 10.27 2 won v Australia
India 192/5 20 9.6 1 won v Pakistan India 188/5 20 9.4 1 won v Australia
India 186/5 20 9.3 1 won v South Africa
India 180/5 20 9 1 won v Bangladesh India 174/7 19.2 9 2 won v Sri Lanka
India 170/4 20 8.5 1 won v England India 168/6 20 8.4 1 won v South Africa
India 167/3 18.1 9.19 2 won v Australia India 159/6 20 7.95 1 won v West Indies
India 159/5 20 7.95 1 won v Afghanistan
India 158/5 17.5 8.85 2 won v England India 157/5 20 7.85 1 won v Pakistan
India 155/3 20 7.75 1 won v Sri Lanka India 153/5 20 7.65 1 won v South Africa
India 152/6 20 7.6 1 won v South Africa India 144/3 18 8 2 won v Zimbabwe
India 135/2 19.4 6.86 2 won v Australia
India 129/2 17 7.58 2 won v Pakistan India 127/4 19.5 6.4 2 won v South Africa
India 116/3 14.5 7.82 2 won v Afghanistan India 113/2 15.3 7.29 2 won v Ireland
India 112/4 15 7.46 2 won v Zimbabwe
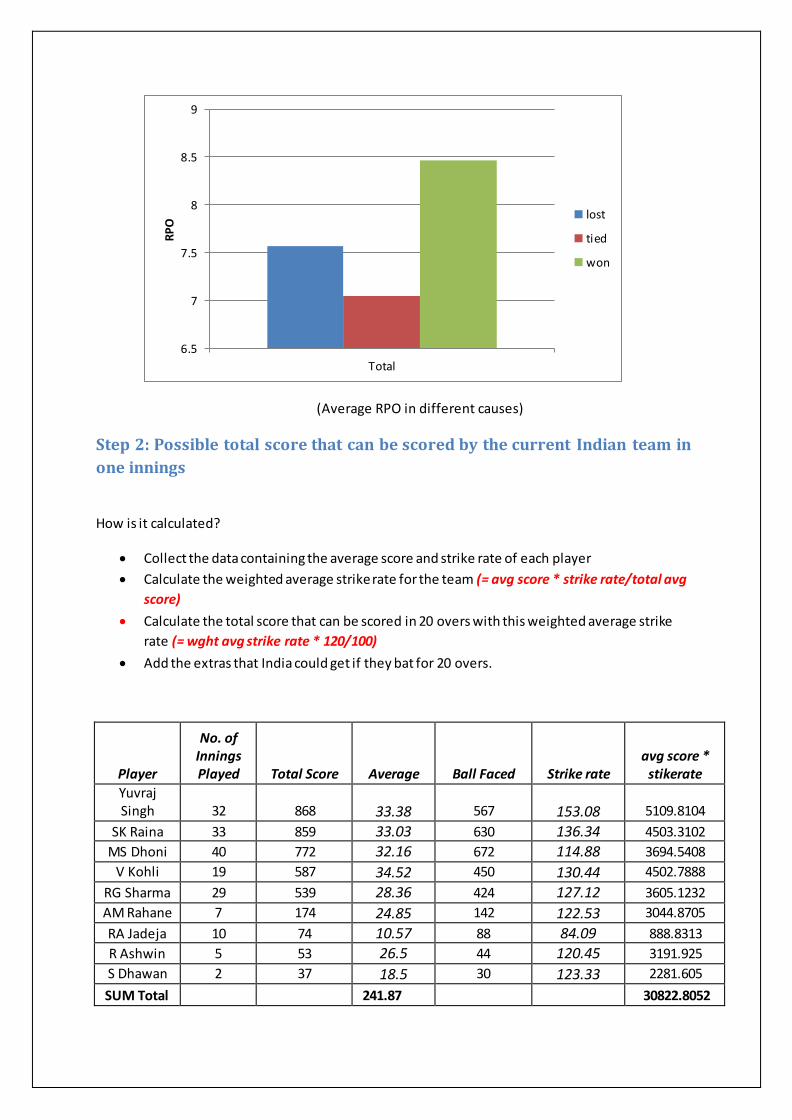
(Average RPO in different causes)
Step 2: Possible total score that can be scored by the current Indian team in
one innings
How is it calculated?
Collect the data containing the average score and strike rate of each player
Calculate the weighted average strike rate for the team (= avg score * strike rate/total avg
score)
Calculate the total score that can be scored in 20 overs with this weighted average strike
rate (= wght avg strike rate * 120/100)
Add the extras that India could get if they bat for 20 overs.
Player
No. of Innings Played Total Score Average Ball Faced Strike rate
avg score * stikerate
Yuvraj Singh 32 868 33.38 567 153.08 5109.8104
SK Raina 33 859 33.03 630 136.34 4503.3102
MS Dhoni 40 772 32.16 672 114.88 3694.5408
V Kohli 19 587 34.52 450 130.44 4502.7888
RG Sharma 29 539 28.36 424 127.12 3605.1232
AM Rahane 7 174 24.85 142 122.53 3044.8705
RA Jadeja 10 74 10.57 88 84.09 888.8313
R Ashwin 5 53 26.5 44 120.45 3191.925
S Dhawan 2 37 18.5 30 123.33 2281.605
SUM Total 241.87 30822.8052
6.5
7
7.5
8
8.5
9
Total
RP
O
lost
tied
won
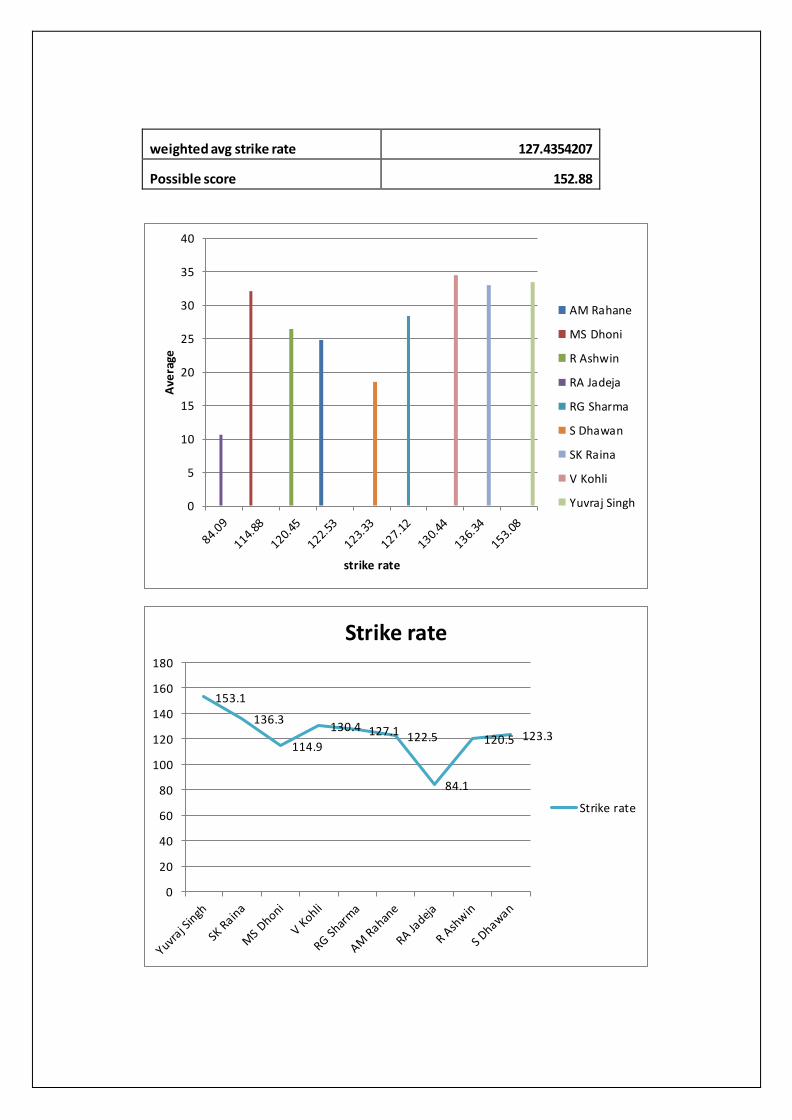
weighted avg strike rate 127.4354207
Possible score 152.88
0
5
10
15
20
25
30
35
40
Ave
rage
strike rate
AM Rahane
MS Dhoni
R Ashwin
RA Jadeja
RG Sharma
S Dhawan
SK Raina
V Kohli
Yuvraj Singh
153.1
136.3
114.9
130.4 127.1 122.5
84.1
120.5 123.3
0
20
40
60
80
100
120
140
160
180
Strike rate
Strike rate
Extras
India has received 6.1% of their total score in extras.
So adding 6% of score to the above calculated average score, we can conclude that at an average
India could get an average of 9 runs as extras.
Inferences:
Total possible score in 20 overs = 153 + 9 = 162
This analysis shows with the current batting line up India could possibly score at an average of 162
runs per innings.
Step 3: Strategy
Obviously India has to score faster than the average strike rate to win the matches. So the key points
they should focus on are:
Change the order of batting line up by putting R. Jadeja (strike rate of 84.1) into 7th or 8th
place.
Give the key players (Yuvraj Singh, Virat Kohli and Suresh Raina ) better opportunities so
they can play without any pressure.
Rest other players should focus more on scoring a little faster instead of focusing more on
scoring high personal score.
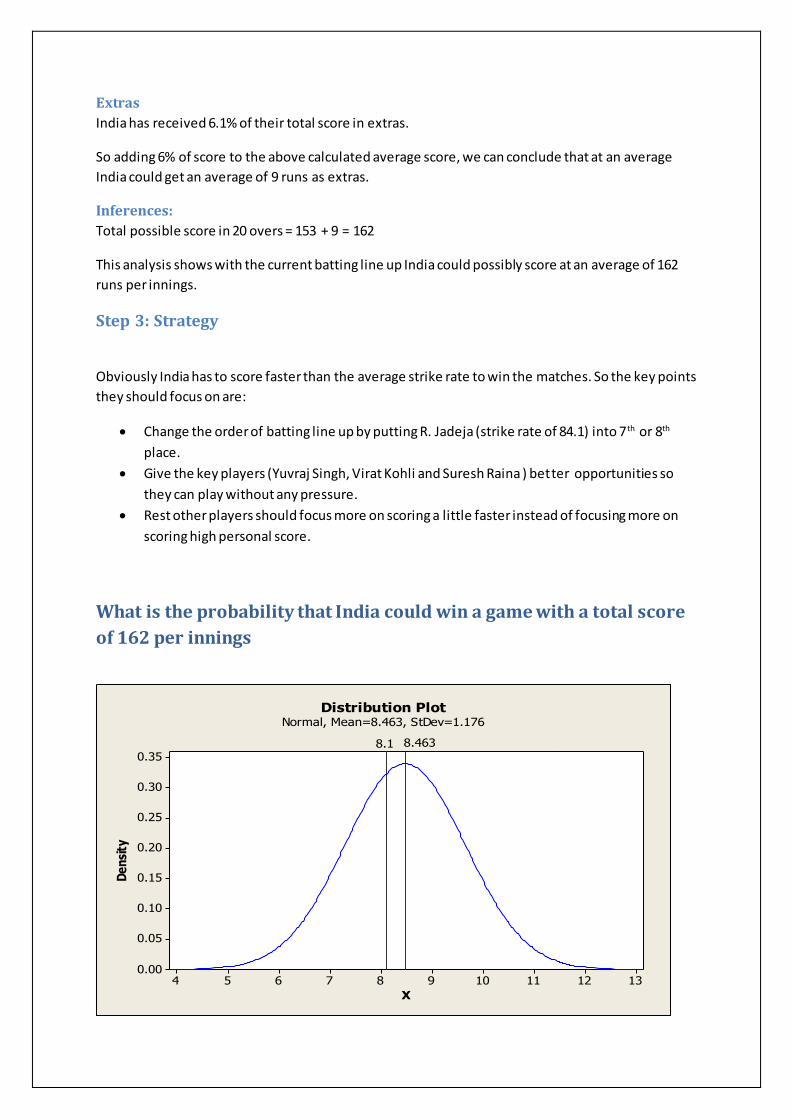
What is the probability that India could win a game with a total score
of 162 per innings
13121110987654
0.35
0.30
0.25
0.20
0.15
0.10
0.05
0.00
X
De
nsi
ty
8.1 8.463
Distribution PlotNormal, Mean=8.463, StDev=1.176
162 runs in an innings is equivalent to 8.1 runs per over.
The average winning RPO for India is 8.463
Calculating the Z value from it
𝑍 =X−Mean
Std Deviation = 0.308
So area under the curve = 0.148
0.5-0.148 = 0.352
So there is 35% Chance that India could win the match with a score of 162 in
20 overs.
5 questions that could be asked by customer (Customer -
Coach/Captain/Selector)
1. Who should be taken in the team and who should be considered in playing 11?
2. What should be the batting/bowling order?
3. What are the other factors that affect the team’s performance?
4. Should they go for bowling or batting if they win the toss and what are the factors influence
this decisions?
5. What are the weaknesses of players of against team?
Source: www.espncricinfo.com