Embed Size (px)
Citation preview

The ‘Land of Wa’ -
and the multi-billion dollar resource projects
Lyne Thomas
Former Assistant Director General Department of Industry and Resources, W.A.

The ‘Land of Wa’ - and the multi-billion dollar resource projects
The big resource projects
• What are they• Where are they
Addressing the issues – policies, strategies
• Historical context• Current directions• Future issues
What do they mean for WA
• Economy• Related and other
Business• New Industries• Community
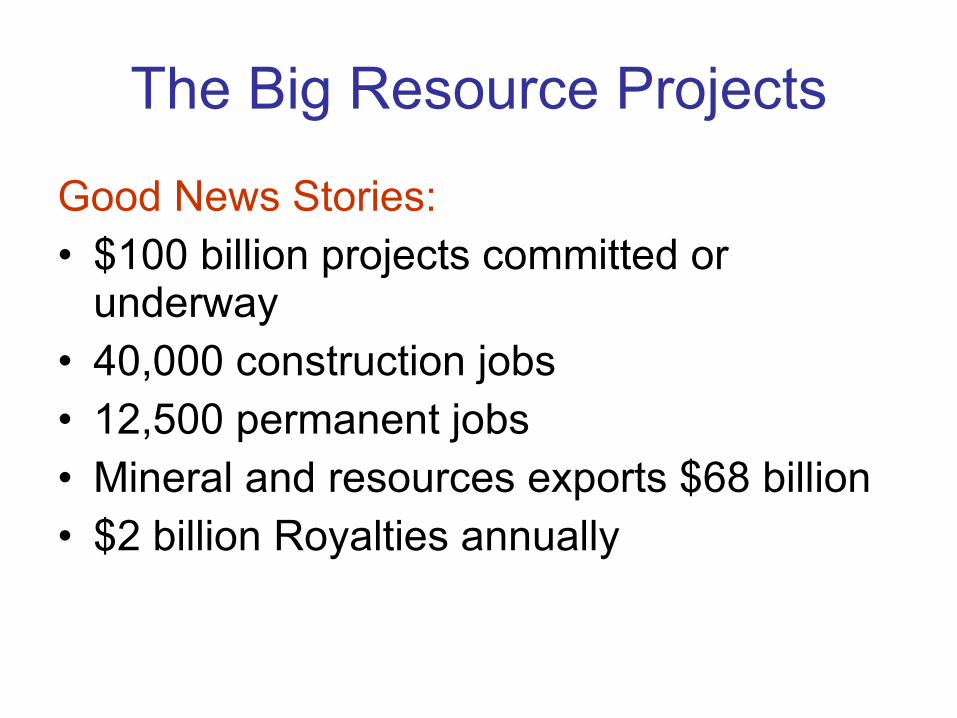
The Big Resource Projects
Good News Stories:• $100 billion projects committed or
underway• 40,000 construction jobs• 12,500 permanent jobs• Mineral and resources exports $68 billion• $2 billion Royalties annually

What are the Big Projects
• Gorgon ($43 billion)• Kimberley LNG Hub ($20 billion)• Woodside -North Rankin / Pluto ($16 billion)• BHP Billiton – Pilbara ($9 billion)• CITIC Pacific (Cape Preston)- ($5 billion)• Cape Lambert – ($3.7 billion)• Oakajee – ($4 billion)• Ord Expansion – ($415 million)• SKA- ($2 billion?)


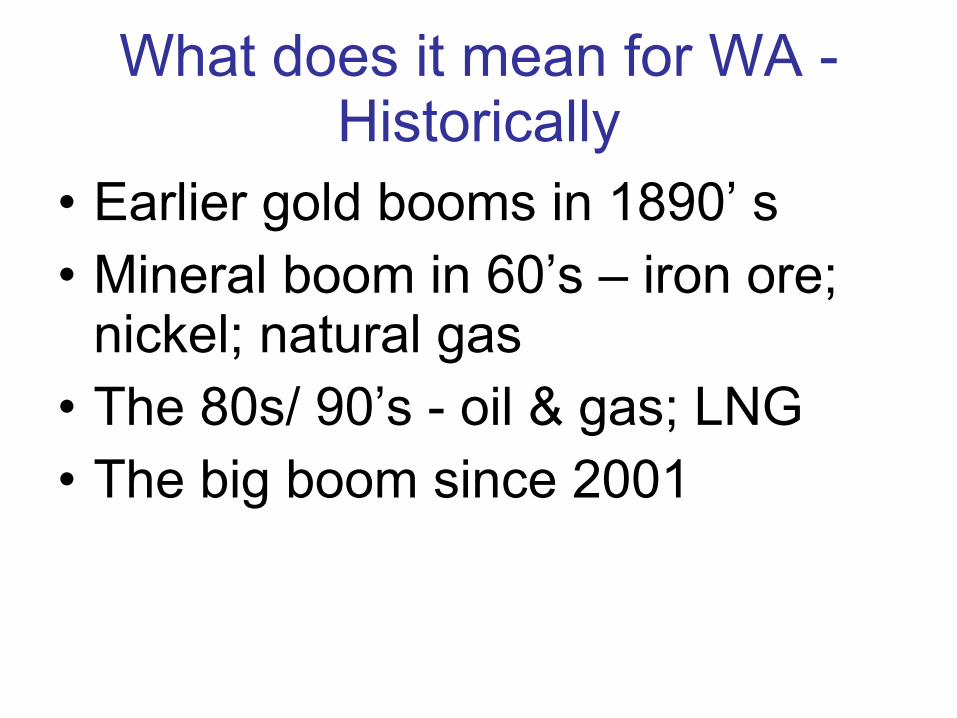
What does it mean for WA - Historically
• Earlier gold booms in 1890’ s• Mineral boom in 60’s – iron ore;
nickel; natural gas• The 80s/ 90’s - oil & gas; LNG • The big boom since 2001

Government of Western Australia Department of State Development
2. Western Australia at a GlanceKey Facts and Figures
Population at end of June 2008 2,171,197
Gross State Product, 2007-08 (a) $146.4 billion
Gross State Product Per Capita, 2007-08 (a) $68,837
Unemployment Rate, March 2009 (b) 4.3%
CPI (all groups), Perth, March Qtr 2009 -0.1%
Exports, 2007-08 $68.8 billion
Imports, 2007-08 $27.4 billion
Key Industries Mining, Property and Business Services, Manufacturing, Construction
(a) In real (chain volume) terms.(b) Trend.
Source: Australian Bureau of Statistics (ABS)
Government of Western Australia Department of State Development
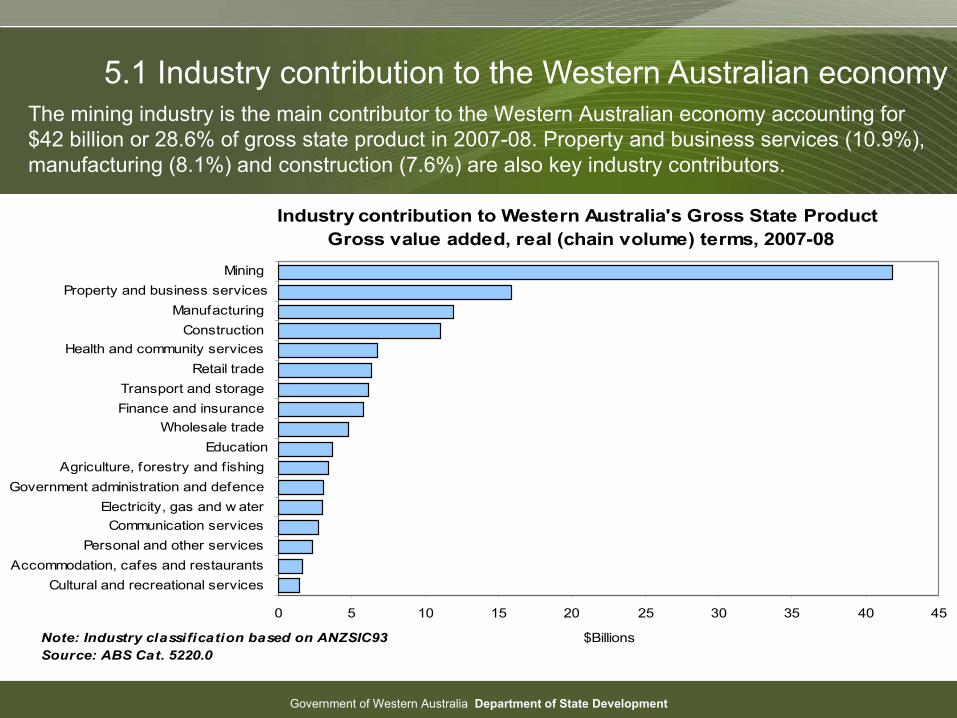
5.1 Industry contribution to the Western Australian economyThe mining industry is the main contributor to the Western Australian economy accounting for $42 billion or 28.6% of gross state product in 2007-08. Property and business services (10.9%), manufacturing (8.1%) and construction (7.6%) are also key industry contributors.
Industry contribution to Western Australia's Gross State Product Gross value added, real (chain volume) terms, 2007-08
0 5 10 15 20 25 30 35 40 45
Cultural and recreational services
Accommodation, cafes and restaurants
Personal and other services
Communication services
Electricity, gas and w ater
Government administration and defence
Agriculture, forestry and fishing
Education
Wholesale trade
Finance and insurance
Transport and storage
Retail trade
Health and community services
Construction
Manufacturing
Property and business services
Mining
$BillionsNote: Industry classification based on ANZSIC93Source: ABS Cat. 5220.0
Government of Western Australia Department of State Development
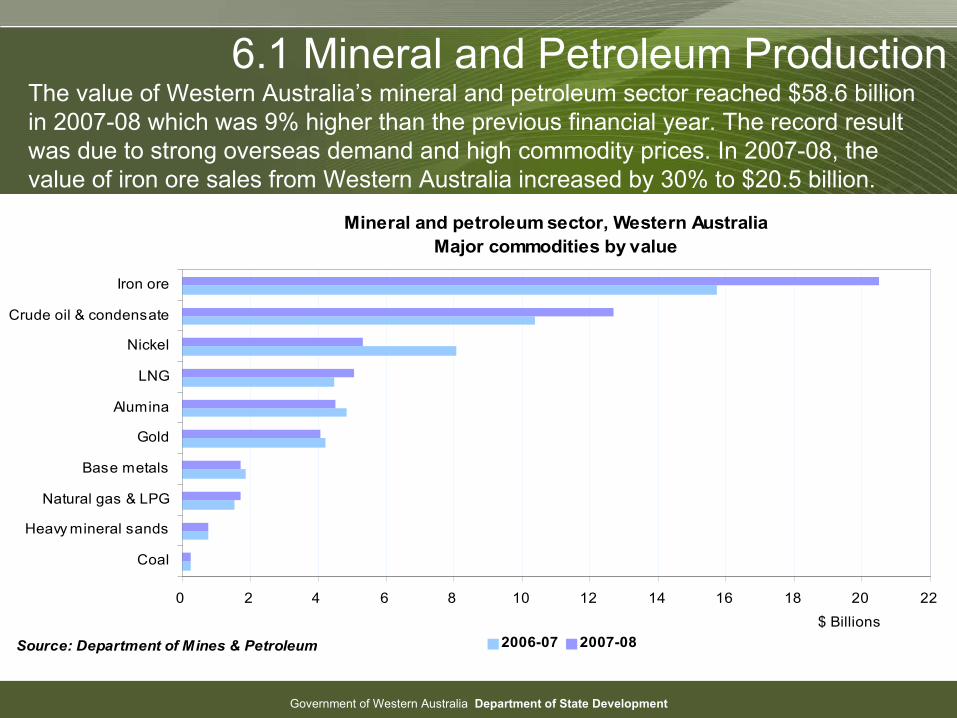
6.1 Mineral and Petroleum ProductionThe value of Western Australia’s mineral and petroleum sector reached $58.6 billion in 2007-08 which was 9% higher than the previous financial year. The record result was due to strong overseas demand and high commodity prices. In 2007-08, the value of iron ore sales from Western Australia increased by 30% to $20.5 billion.
Mineral and petroleum sector, Western AustraliaMajor commodities by value
0 2 4 6 8 10 12 14 16 18 20 22
Coal
Heavy mineral sands
Natural gas & LPG
Base metals
Gold
Alumina
LNG
Nickel
Crude oil & condensate
Iron ore
$ Billions
2006-07 2007-08Source: Department of Mines & Petroleum

Government of Western Australia Department of State Development
6.1 Mineral and Petroleum Production continuedIron ore and petroleum are the largest sectors which together accounted for 68% ($39.9 billion) of the total value ($58.6 billion) of the State’s resources industry in 2007-08. In addition, total royalty receipts in 2007-08 amounted to $2.3 billion which was largely attributable to the iron ore (42%) and petroleum (35%) sectors.
Mineral and petroleum sector, Western AustraliaMajor commodities by value, 2007-08
$58.6 billion
Others
8%Alumina
8%
Gold
7%
Iron ore
34%
Nickel
9%
Natural Gas
2%
LNG
9%
Condensate
7%
Petroleum
34%
Crude Oil
15%
LPG - Butane and
Propane1%
Source: Department of Mines and Petroleum

Government of Western Australia Department of State Development
7.1 Business InvestmentIn 2007-08, total business investment in Western Australia reached $38 billion underpinned by new engineering construction ($15.2 billion) which has grown in recent years due to the mining boom.
Business investment in Western Australia In real (chain volume) terms
0
5
10
15
20
25
30
35
40
1998-99 1999-00 2000-01 2001-02 2002-03 2003-04 2004-05 2005-06 2006-07 2007-08
$ Billions
New engineering construction Other investment Total private business investmentSource: ABS Cat. 5206.0

Government of Western Australia Department of State Development
7.2 Business Investment by IndustryIn 2007-08, business investment in the mining industry was estimated at $17.1 billion (up 27% from 2006-07) while investment in the manufacturing industry was $1.7 billion, up 10%.
Business investment by industryWestern Australia, original, current prices
0
5
10
15
20
25
1998-99 1999-00 2000-01 2001-02 2002-03 2003-04 2004-05 2005-06 2006-07 2007-08
$ Billions
Mining Manufacturing OtherSource: ABS Cat. 5625.0

Government of Western Australia Department of State Development
7.3 Foreign Investment in Australia
The leading investor countries at 31 December 2007 were:
United States of America $445.9 billion or 27%United Kingdom $410.4 billion or 25%Japan $57.5 billion or 3%New Zealand $42.8 billion or 3%Hong Kong (SAR of China) $41.7 billion or 3%China $6.2 billion or 0.4%
Note: Due to the difficulties in obtaining state level foreign investment statistics, only Australian estimates are available.
Whilst ABS foreign investment statistics lists Hong Kong and China separately, care needs to be taken when interpreting country data given that the country of residence of the ultimate beneficial owner/recipient is not identified.
Source: ABS Cat. 5352.0
The level of foreign investment in Australia increased by $201.8 billion to reach $1,659.6 billion at 31 December 2007. The leading investor countries were the United States of America ($445.9 or 27%) and the United Kingdom ($410.4 billion or 25%).

Government of Western Australia Department of State Development
8.1 Western Australia’s International TradeIn 2007-08, Western Australia’s merchandise exports were estimated at $68.8 billion and merchandise imports were estimated at $27.4 billion. The trade surplus for 2007-08 was $41.4 billion.
Western Australia's international trade
0
10
20
30
40
50
60
70
80
1998-99 1999-00 2000-01 2001-02 2002-03 2003-04 2004-05 2005-06 2006-07 2007-08
$ Billions
Exports Imports SurplusSource: ABS Cat. 5368.0
Source: ABS Cat 5368.0

Government of Western Australia Department of State Development
8.2 Australian merchandise exports by state and territoryIn 2007-08, Western Australia accounted for almost 40% of Australian merchandise exports, with the value of the State's exports the highest in the nation at $68.8 billion.
Australian merchandise exports by state and territory, 2007-08
SA
6.0%
QLD
20.4%
VIC
11.9%
NSW
17.3%
WA
39.7%
TAS
2.1%
NT
2.6%
Source: ABS Cat. 5368.0Note: Excludes re-exports

Government of Western Australia Department of State Development
8.3 Top Ten Merchandise ExportsIn 2007-08, iron ore was Western Australia’s largest export item estimated at $20 billion or 29.1% of total exports. Petroleum accounted for $9.2 billion or 13.3% of total Western Australian exports in 2007-08.
Western Australia's top ten merchandise exports, 2007-08
0 2 4 6 8 10 12 14 16 18 20 22
Nickel
Base metal ores and concentrates
Nickel ores and concentrates
Copper ores and concentrates
Wheat and meslin, umilled
Natural gas
Petroleum oils (crude)
Confidential items
Non-monetary gold
Iron ore and concentrates
$ BillionsNote: (a) Non-monetary gold data should be interpreted with caution.(b) Confidential items are thought to mainly comprise of alumina, bauxite and LNG.See explanatory notes.Source: ABS Cat. 5368.0
Government of Western Australia Department of State Development
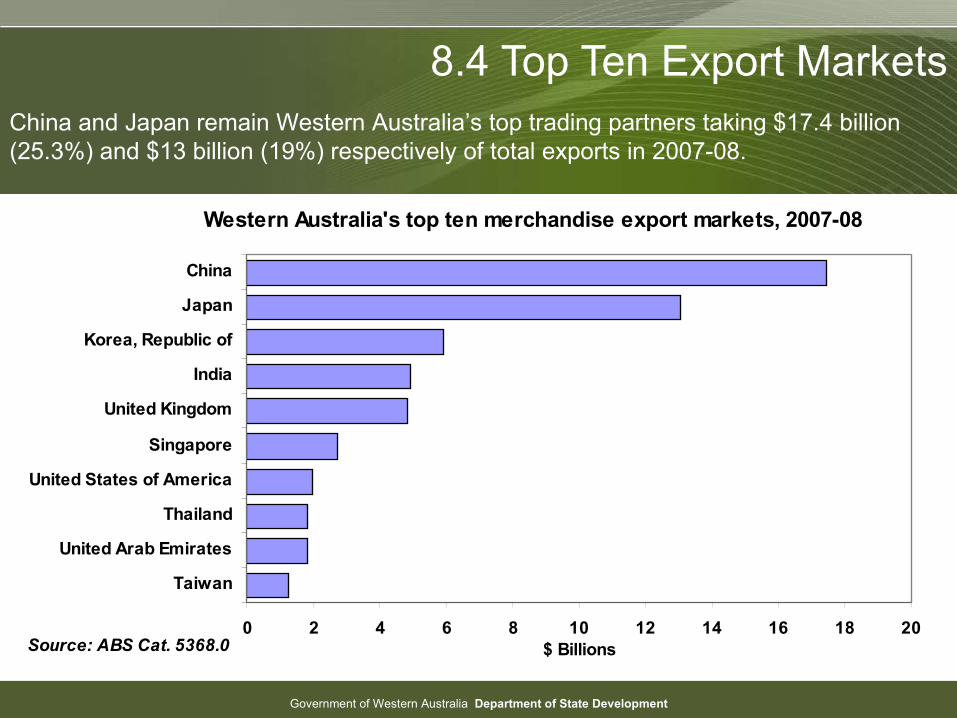
8.4 Top Ten Export MarketsChina and Japan remain Western Australia’s top trading partners taking $17.4 billion (25.3%) and $13 billion (19%) respectively of total exports in 2007-08.
Western Australia's top ten merchandise export markets, 2007-08
0 2 4 6 8 10 12 14 16 18 20
Taiwan
United Arab Emirates
Thailand
United States of America
Singapore
United Kingdom
India
Korea, Republic of
Japan
China
$ BillionsSource: ABS Cat. 5368.0
Government of Western Australia Department of State Development
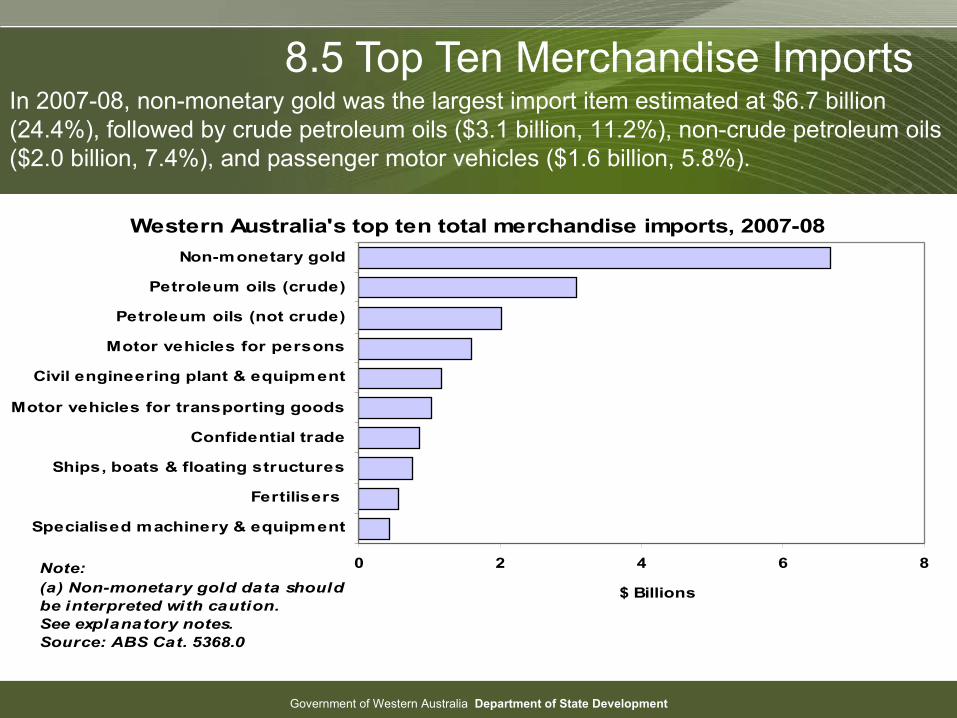
8.5 Top Ten Merchandise ImportsIn 2007-08, non-monetary gold was the largest import item estimated at $6.7 billion (24.4%), followed by crude petroleum oils ($3.1 billion, 11.2%), non-crude petroleum oils ($2.0 billion, 7.4%), and passenger motor vehicles ($1.6 billion, 5.8%).
Western Australia's top ten total merchandise imports, 2007-08
0 2 4 6 8
Specialised machinery & equipment
Fertilisers
Ships, boats & floating structures
Confidential trade
Motor vehicles for transporting goods
Civil engineering plant & equipment
Motor vehicles for persons
Petroleum oils (not crude)
Petroleum oils (crude)
Non-monetary gold
$ Billions
Note: (a) Non-monetary gold data should be interpreted with caution.See explanatory notes.Source: ABS Cat. 5368.0
Government of Western Australia Department of State Development
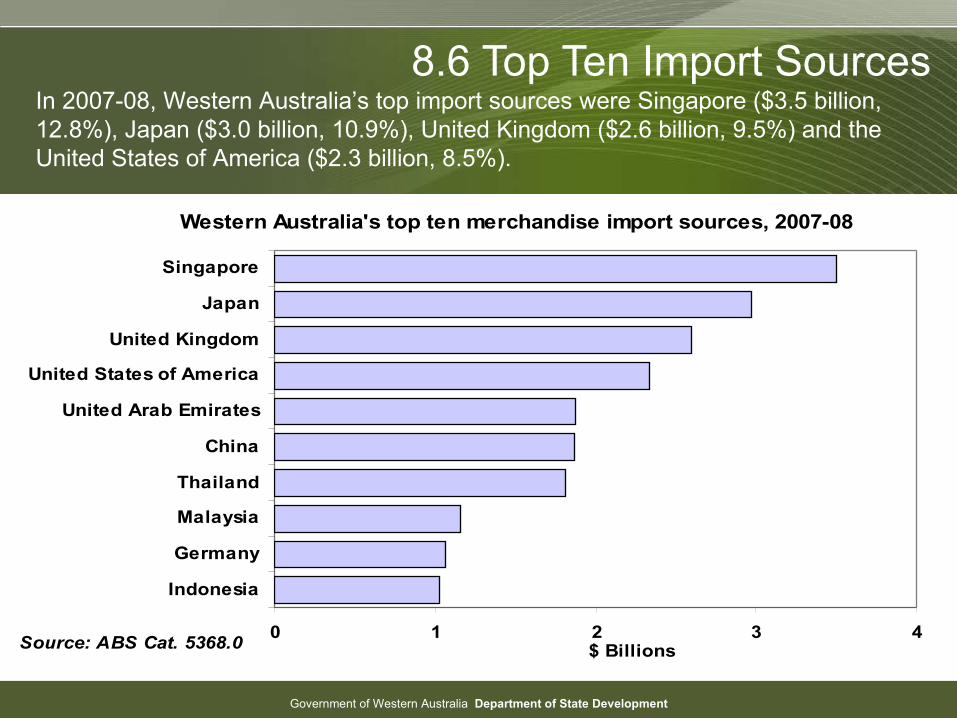
8.6 Top Ten Import SourcesIn 2007-08, Western Australia’s top import sources were Singapore ($3.5 billion, 12.8%), Japan ($3.0 billion, 10.9%), United Kingdom ($2.6 billion, 9.5%) and the United States of America ($2.3 billion, 8.5%).
Western Australia's top ten merchandise import sources, 2007-08
0 1 2 3 4
Indonesia
Germany
Malaysia
Thailand
China
United Arab Emirates
United States of America
United Kingdom
Japan
Singapore
$ BillionsSource: ABS Cat. 5368.0
Government of Western Australia Department of State Development
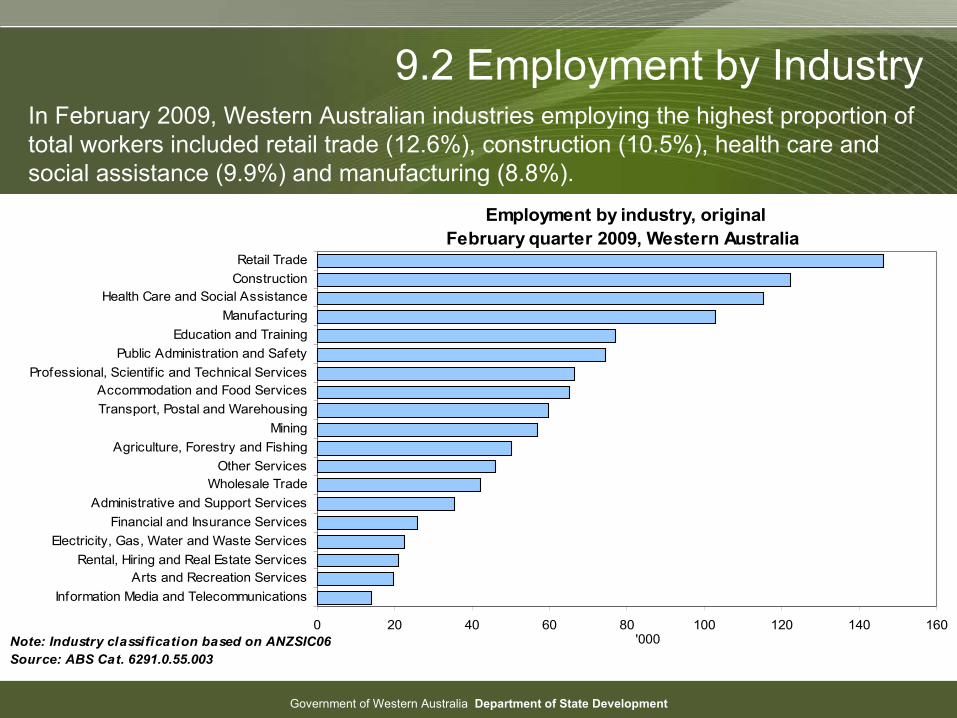
9.2 Employment by IndustryIn February 2009, Western Australian industries employing the highest proportion of total workers included retail trade (12.6%), construction (10.5%), health care and social assistance (9.9%) and manufacturing (8.8%).
Employment by industry, originalFebruary quarter 2009, Western Australia
0 20 40 60 80 100 120 140 160
Information Media and Telecommunications
Arts and Recreation ServicesRental, Hiring and Real Estate Services
Electricity, Gas, Water and Waste Services
Financial and Insurance Services
Administrative and Support Services
Wholesale TradeOther Services
Agriculture, Forestry and Fishing
Mining
Transport, Postal and Warehousing
Accommodation and Food ServicesProfessional, Scientif ic and Technical Services
Public Administration and Safety
Education and Training
Manufacturing
Health Care and Social AssistanceConstruction
Retail Trade
'000Note: Industry classification based on ANZSIC06Source: ABS Cat. 6291.0.55.003

Government of Western Australia Department of State Development
9.3 WagesDue to strong economic conditions in recent years, Western Australia has experienced strong wages growth. Western Australia’s wage price index increased by 5.7% over the year to December 2008 which was above national growth of 4.3% over the same period.
Wage price index, (2003-04 = 100), all sectors, original
2.0
2.5
3.0
3.5
4.0
4.5
5.0
5.5
6.0
6.5
7.0
Dec-02 Dec-03 Dec-04 Dec-05 Dec-06 Dec-07 Dec-08
Western Australia and Australia, annual percentage change%
Western Australia AustraliaSource: ABS Cat. 6345.0
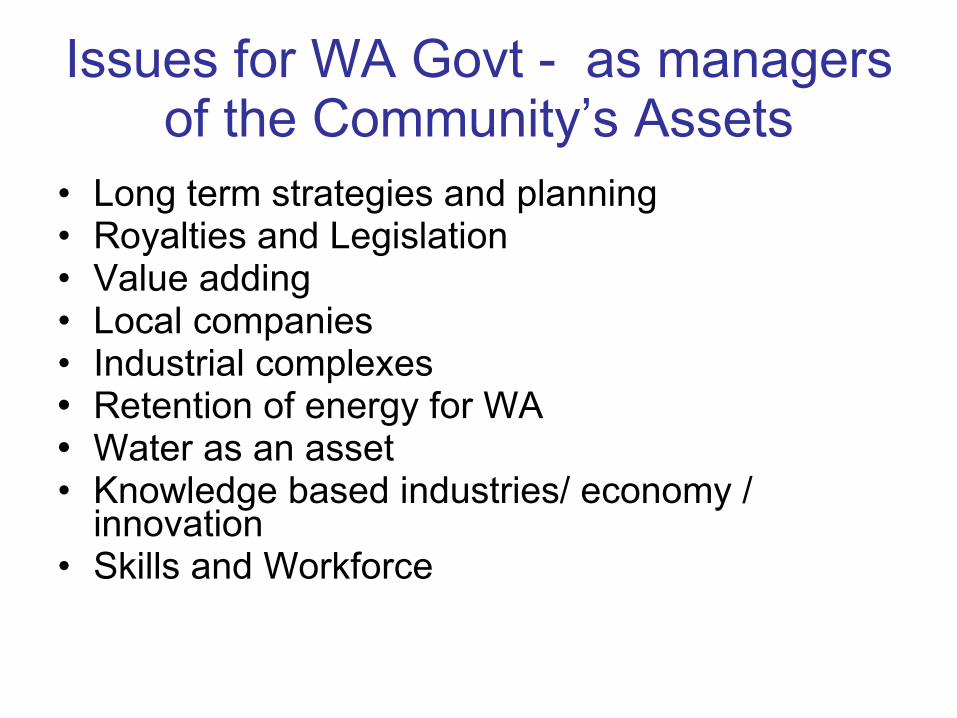
Issues for WA Govt - as managers of the Community’s Assets
• Long term strategies and planning • Royalties and Legislation• Value adding • Local companies • Industrial complexes • Retention of energy for WA• Water as an asset• Knowledge based industries/ economy /
innovation• Skills and Workforce

Knowledge based industries/ economy – TIAC Report (2006)
• ICT industry gross product -$2.9 bill or (3.3%SDP)
• ICT firms in WA - 1800 • ICT revenue - $6.6 billion• Direct employment – 23,000• Size of the WA ICT industry sector –No 12• Value of ICT / contrib to GSP - est 23% • Jobs generated by ICT use – 160,000 or
(17% total workforce)
The Future??
Yellow Brick Road Or
Emerald CityOr
Strawmen – new Wizard?Or Tinmen and Lions?