Embed Size (px)
Citation preview
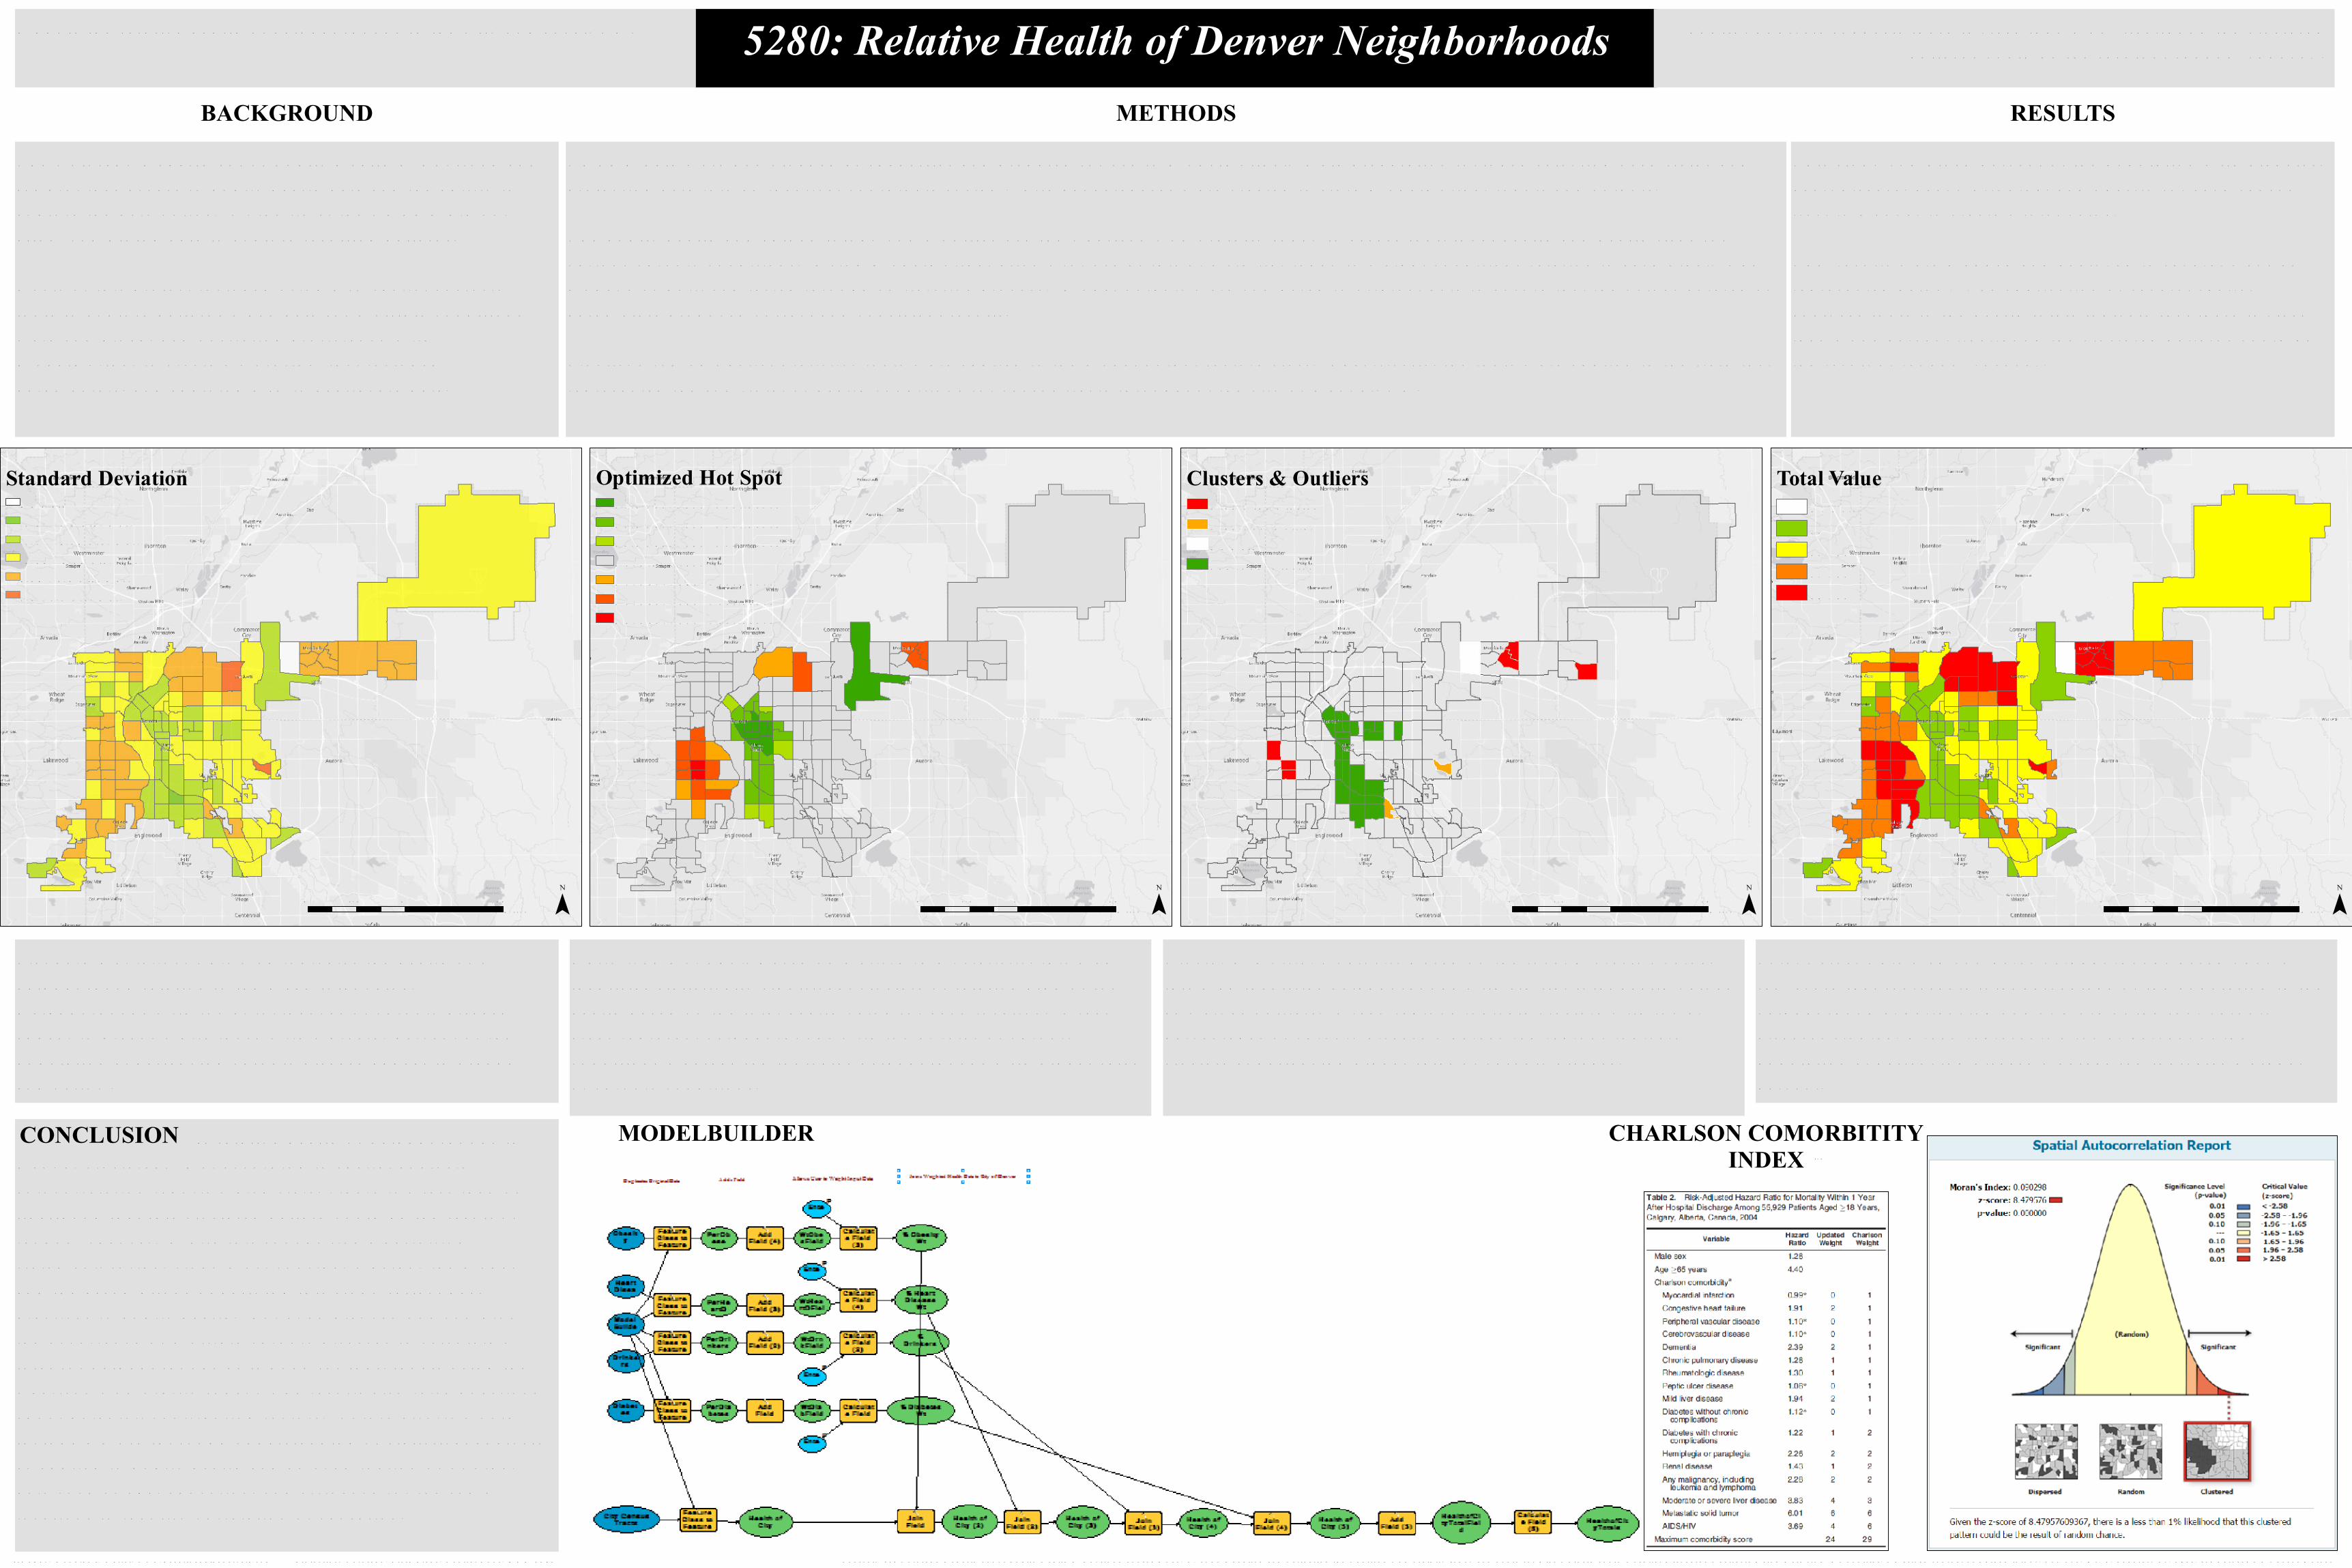
S ta n da rd Devia tion : T his m ap in dica tes the hea lth of an eighborhood rela tive to the m ea n tota l va lue.Neighborhoods with lower in ciden ces of chron ic diseaseappea r in green s while those with a grea ter percen t of thepopula tion experien cin g chron ic disease appea r in ora n gea n d yellow.
Total ValueNo Da ta3334 - 3637 - 3940 - 43
Clusters & OutliersHigh-High ClusterHigh-Low OutlierNo Da taLow-Low Cluster
Standard DeviationNo Da ta-2.5 - -1.5 S td. Dev.-1.5 - -0.50 S td. Dev.-0.50 - 0.50 S td. Dev.0.50 - 1.5 S td. Dev.1.5 - 1.7 S td. Dev.
Optimized Hot SpotCold S pot - 99% Con fiden ceCold S pot - 95% Con fiden ceCold S pot - 90% Con fiden ceNot S ign ifica n tHot S pot - 90% Con fiden ceHot S pot - 95% Con fiden ceHot S pot - 99% Con fiden ce
5280: Relative Health of Denver Neighborhoods
T he Colora do Depa rtm en t of Public Hea lth & En viron m en t(1) provides a ccess to public hea lth data a n d the ability toexplore the data on lin e. At the tim e, the CDPHE did n ota llow com bin in g da ta to explore resultin g pa ttern s.Goa ls of this project in cluded usin g GIS spa tia l a n a lysistools to explore pa ttern s when da ta for m ultiple con dition swere com bin ed, dem onstra tin g proficien cy withModelBuilder to crea te a workflow tha t in cludedpa ra m en ters, a n d applyin g GIS to hea lthca re da ta.
CDPHE da ta were down loa ded as shapefiles a n d prepa red for use in ModelBuilder. Da ta prepa ra tion in cluded selectin g n eed fields a n dprojectin g da ta in to a n iden tica l coordin a te system . File geoda tabases were crea ted to store ModelBuilder inputs a n d outputs.
T he public hea lth a n d epidem iology com m un ities use the Cha rlson Com orbidity In dex to assess in dividua l hea lth a n d hea lth risks forva rious chron ic con dition s. Usin g ModelBuilder a llows for use of this or a sim ila r in dex to weight con dition s rela tive to ea ch other. T hem odel was built a n d tested through a n itera tive process. Model outputs were com pa red to origin a l da ta to ensure tha t the va lues en tered aspa ra m eters produced correct a n d con sisten t results.Fin a lly, ArcMap S pa tia l S ta tistics tools were applied to the m odel output fea ture class. Specifica lly, the tools were applied to the field tha trepresen ted the sum -tota l of hea lth con dition s for census tra cts throughout the city of Den ver, CO.
T his study com bin ed percen t of the popula tion with diabetes,hea rt disease, hea vy drin kin g, a n d obesity for ea ch cen sustra ct in Den ver to crea te a tota l va lue.
T he results were m apped a n d a n a lyzed in severa l wa ys asrepresen ted below. T he applica tion of severa l spa tia la n a lyses tools to the hea lth tota ls in dica te tha t there is “lesstha n a on e percen t likelihood the clustered pa ttern s could bethe result of ra n dom cha n ce”.
(c) 2017, Dougla s F. Ha ller; www.baselin eda ta a n a lysis.com S ources: (1) Colora do Depa rtm en t of Public Hea lth & En viron m en t (2) Qua n , H. et a l, Upda tin g a n d Va lida tin g the Cha rlson Com orbidity In dex a n d S core for R isk Adjustm en t in Hospita l Discha rge Abstra cts Usin g Data from 6 Coun tries, Am erica n Journ a l of Epidem iology, Vol. 173, No. 6, Febura ry 17, 2011. (3) Esri (4) US Census Burea uProjection: Colora do, S ta te Pla n e, Cen tra l Z on e, NAD 1983
¯0 5 102.5Miles ¯0 5 102.5
Miles ¯0 5 102.5Miles ¯0 5 102.5
Miles
What is the relative health of neighborhoods in the City of Denver, CO? Spatial analysis suggests there is "less than a 1% likelihood the clusteredpatterns could be the result of random chance”.
METHODSBACKGROUND RESULTS
Is rela tive hea lth of n eighborhoods inDen ver clustered? Not a ccordin g to spatia l a n a lysisautocorrela tion reports which state, “there is a less tha n 1%likelihood tha t this clustered pa ttern could be the result ofra n dom cha n ce.” W hile this soun ds like a defin itivesta tem en t, further study m ust con sider whether the m odela n d the assum ption s un derlyin g this study reflect bestpra ctices in public hea lth. For exa m ple, ca n on e com bin ethe occurren ce of m ultiple chron ic diseases to ca lcula te atota l for n eighborhoods as is don e for in dividua ls usin g theCha rlson Com orbitiy In dex? T he results a lso ra ise questionsabout poten ta il con tributin g fa ctors. Future efforts wouldin clude a m ore thorough un dersta n din g of sta tistica l a n a lysisas applied to public hea lth a n d a n exa m in a tion of of otherda ta such as a ge, educa tion, a n d a ffluen ce for the sa m eloca tion s to iden tify correla tion or ca usa tion .
CONCLUSION MODELBUILDER CHARLSON COMORBITITYINDEX
SPATIAL ANALYSIS REPORT
Optim ized Hot Spot: Based on Getis-Ord Gi statistic, this m apiden tifies sta tistica lly sign ifica n t clusters of rela tive high or lowhea lth based on the tota l hea lth va lue for ea ch loca tion . Greena rea s represen t n eighborhoods with lower ra tes of chron iccon ditions whereas red in dica tes n eighborhoods with higher ra tesof chron ic con dition s.
Cluster & Outlier An a lysis: Based on the loca l Mora n 's I va lue,this m ap iden tifies n eighborhoods with sim ila r tota l hea lth va luesas well as outliers. Green regions in dica te clusters with lowerpercen ta ges of chron ic disease whereas red region s in dica teclusters experien cin g higher ra tes of chron ic disease.
Tota l Va lue: T his m ap com pa res n eighborhoods based upon ara w score tha t represen ts tota l percen ta ge of the population in then eighborhood experien cin g on e or m ore of the four chron icdiseases studied. Green represen ts a lower percen t of thepopula tion experien cin g disease whereas red in dica tes a higherpercen t.
(2)