Embed Size (px)
DESCRIPTION
Citation preview
1

Sizing
Effort for project depends on many factors Size is the main factor – many experiments
and data analysis have validated this Size in the start is only an estimate; getting
size estimates from requirement is hard Need a size unit that can be “computed”
from requirements Function points attempt to do this
2

Function Points
Is a size measure like LOC Determined from SRS Defines size in terms of “ functionality “ Why “measure” size early ?
Needed for estimation and planning
Five different parametersexternal input typeexternal output typelogical internal file typeexternal interface file typeexternal inquiry type 3

Function Points…
These five parameters capture the functionality of a system
within a type , an element may be simple , average or complex
A weighted sum is taken External input type : each unique input type A input type is unique if the format is
different from others or if the specifications require different processing.
4

Function Points…
Simple : a few data elements Complex : many data elements and many
internal files needed for processing Only files needed by the application are
counted. ( HW/OS config. Files are are not counted )
External output type : each unique output that leave system
boundary E.g.
Reports , messages to user , data to other applications Simple : few columns
5

Function Points…
Average : many columns Complex : references many files for
production Logical internal file type : An application maintains information
internally for its own processes Each logical group of data generated , used
and maintained Same for simple , average and complex
6

Function Points…
External interface file typelogical files passed between application
External inquiry typeinput , output combination
WeightsExternal Input 3 4 6External Output 4 5 7Logical int. file 7 10 15External int. file 5 7 10External inquiry 3 4 6
7

Function Points…
Unadjusted function point : Basic function points Adjusted for other factors 14 such factors
performance objectives , transaction rate etc.
Final FP is adjusteddiffers at most 35%
8
Function Points…
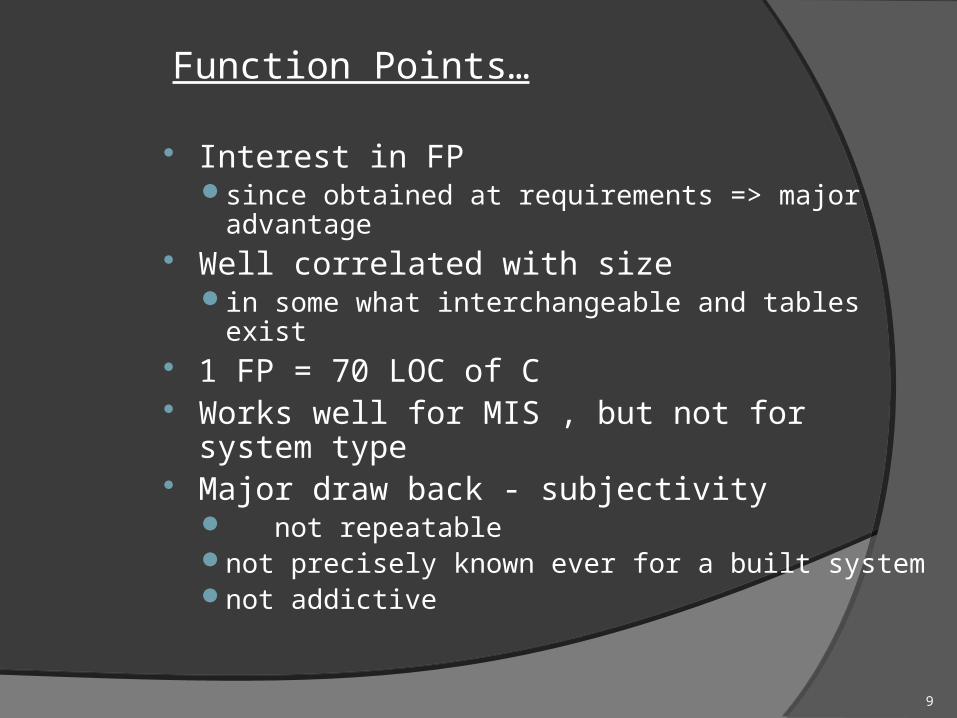
Interest in FP since obtained at requirements => major
advantage Well correlated with size
in some what interchangeable and tables exist 1 FP = 70 LOC of C Works well for MIS , but not for system type Major draw back - subjectivity
not repeatablenot precisely known ever for a built system not addictive
9

10

Project Schedule
A project Schedule is at two levels - overall schedule and detailed schedule
Overall schedule comprises of major milestones and final date
Detailed schedule is the assignment of lowest level tasks to resources
11

Overall Schedule
Depends heavily on the effort estimate For an effort estimate, some flexibility
exists depending on resources assigned Eg a 56 PM project can be done in 8
months (7 people) or 7 months (8 people)
Stretching a schedule is easy; compressing is hard and expensive
12

Overall Scheduling... One method is to estimate schedule S
(in months) as a function of effort in PMs Can determine the fn through analysis of
past data; the function is non linear COCOMO: S = 2.5 E 3.8 Often this schedule is checked and
corrected for the specific project One checking method – square root
check
13
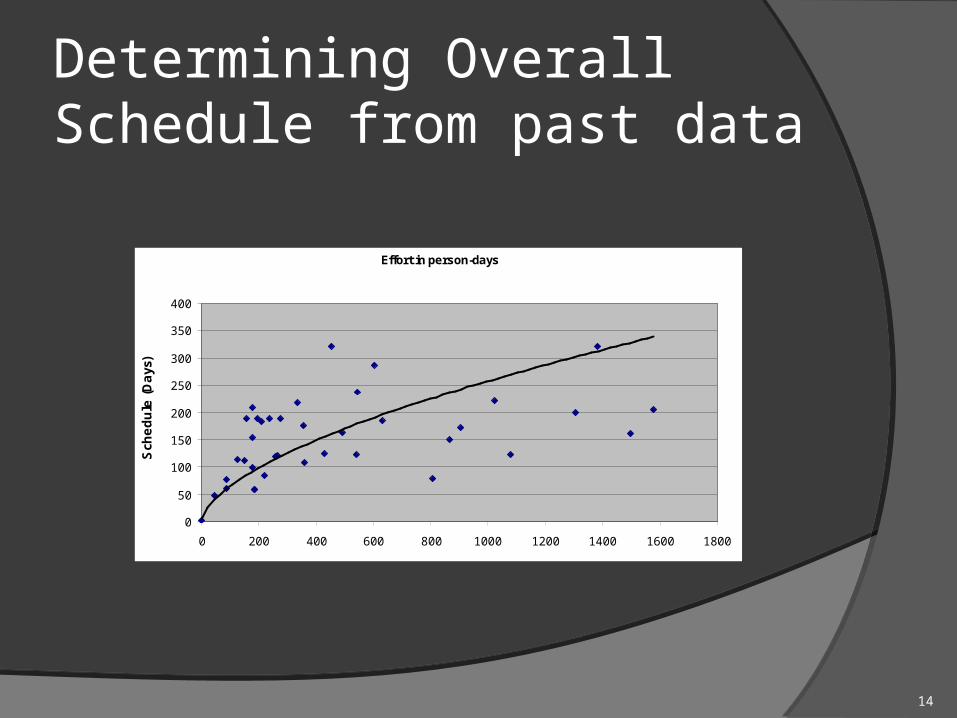
Determining Overall Schedule from past data
Effort in person-days
0
50
100
150
200
250
300
350
400
0 200 400 600 800 1000 1200 1400 1600 1800
Sch
ed
ule
(D
ays
)
14

Determining Milestones
With effort and overall schedule decided, avg project resources are fixed
Manpower ramp-up in a project decides the milestones
Manpower ramp-up in a project follows a Rayleigh curve - like a normal curve
In reality manpower build-up is a step function
15
Milestones ... With manpower ramp-up and effort
distribution, milestones can be decided Effort distribution and schedule distribution
in phases are different Generally, the build has larger effort but not
correspondingly large schedule COCOMO specifies distr of overall sched.
Design – 19%, programming – 62%, integration – 18%
16

An Example Schedule
# Task Dur. (days)
Work (p-days)
Start Date
End Date
2 Project Init tasks 33 24 5/4 6/23
74 Training 95 49 5/8 9/29
104 Knowledge sharing
78 20 6/2 9/30
114 Elaboration iteration I
55 55 5/15 6/23
198 Construction iteration I
9 35 7/10 7/21
17

Detailed Scheduling
To reach a milestone, many tasks have to be performed
Lowest level tasks - those that can be done by a person (in less than 2-3 days)
Scheduling - decide the tasks, assign them while preserving high-level schedule
Is an iterative task - if cannot “fit” all tasks, must revisit high level schedule
18

Detailed Scheduling
Detailed schedule not done completely in the start - it evolves
Can use MS Project for keeping it Detailed Schedule is the most live
document for managing the project Any activity to be done must get
reflected in the detailed schedule
19

An example task in detail schedule
Module Act Code
Task Duration Effort
History PUT Unit test # 17
1 day 7 hrs
St. date End date
%comp Depend. Resource
7/18 7/18 0% Nil SB
20
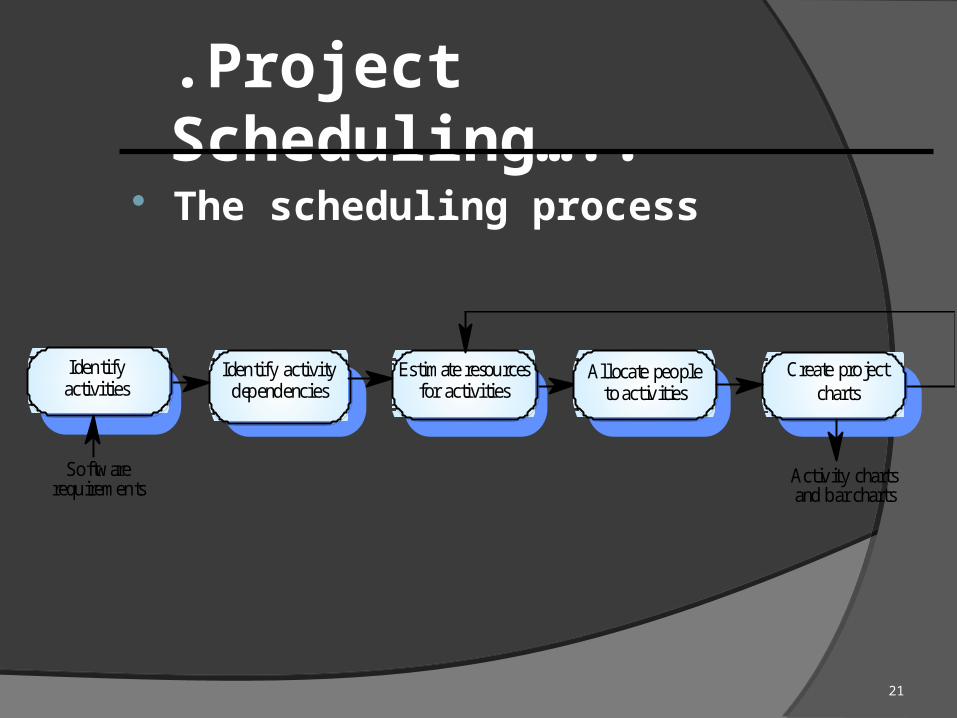
.Project Scheduling…..
The scheduling process
Estimate resourcesfor activities
Identify activitydependencies
Identifyactivities
Allocate peopleto activities
Create projectcharts
Softwarerequirements
Activity chartsand bar charts
21

..Project Scheduling…. Graphical notations used in
software project scheduling:Tables: summary description of tasks Bar charts: show schedule against the timeActivity charts: graphs that depict
dependencies between tasks and indicate the critical path (the longest path in the activity graph)
22

…Project Scheduling… Example of tabular description :
23
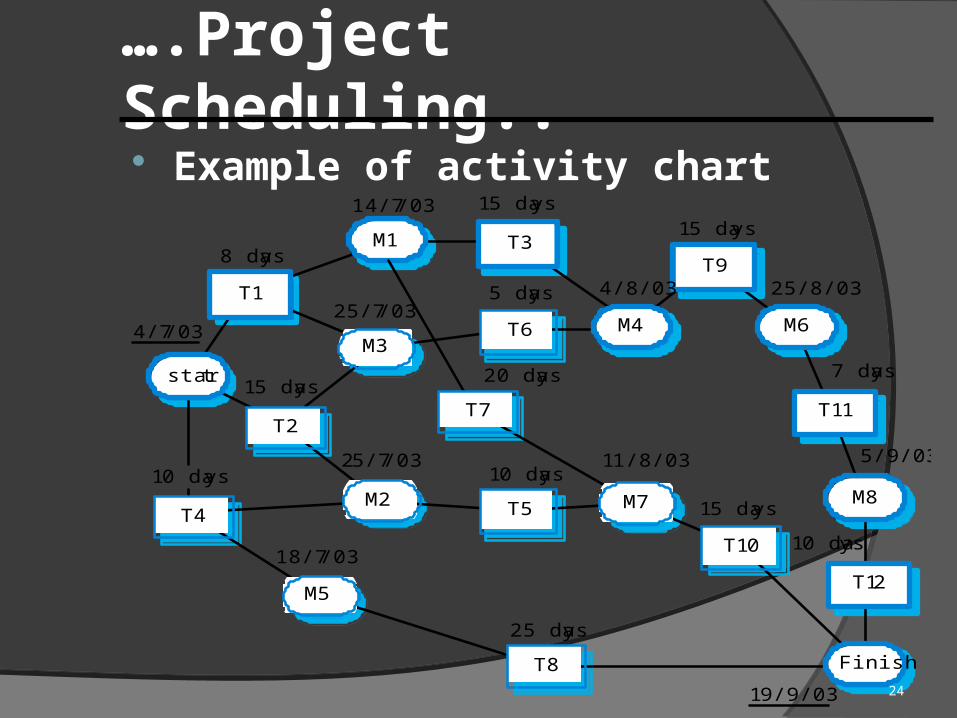
….Project Scheduling.. Example of activity chart
start
T2
M3T6
Finish
T10
M7T5
T7
M2T4
M5
T8
4/7/03
8 days
14/7/03 15 days
4/8/03
15 days
25/8/03
7 days
5/9/03
10 days
19/9/03
15 days
11/8/03
25 days
10 days
20 days
5 days25/7/03
15 days
25/7/03
18/7/03
10 days
T1
M1 T3T9
M6
T11
M8
T12
M4
24

…..Project Scheduling. Example of bar chart4/7 11/7 18/7 25/7 1/8 8/8 15/8 22/8 29/8 5/9 12/9 19/9
T4
T1T2
M1
T7T3
M5T8
M3
M2T6
T5M4
T9
M7T10
M6
T11M8
T12
Start
Finish25

……Project Scheduling Staff allocation chart
4/7 11/7 18/7 25/ 1/8 8/8 15/8 22/8 29/8 5/9 12/9 19/9
T4
T8 T11
T12
T1
T3
T9
T2
T6 T10
T7
T5
Fred
Jane
Anne
Mary
Jim
26

Detail schedule
Each task has name, date, duration, resource etc assigned
% done is for tracking (tools use it) The detailed schedule has to be
consistent with milestonesTasks are sub-activities of milestone level
activities, so effort should add up, total schedule should be preserved
27

Team Structure
To assign tasks in detailed schedule, need to have a clear team structure
Hierarchic team org is most commonProject manager has overall responsibility;
also does design etc.Has programmers and testers for executing
detailed tasksMay have config controller, db manager, etc
28
Team structure..
An alternative – democratic teamsCan work for small teams; leadership
rotates
Another one used for productsA dev team led by a dev mgr, a test team
led by test mgr, and a prog. Mgmt teamAll three report to a product mgrAllows specialization of tasks and separate
career ladders for devs, tests, PMs
29

SCM process and planning Have discussed SCM process earlier During planning, the SCM activities are
planned along with who will perform them
Have discussed planning also earlierIncludes defining CM items, naming
scheme, directory structure, access restrictions, change control, versioning, release procedure etc
30
31

Quality Planning
Delivering high quality is a basic goal Quality can be defined in many ways Current industry standard - delivered
defect density (e.g. #defects/KLOC) Defect - something that causes software
to behave in an inconsistent manner Aim of a project - deliver software with
low delivered defect density
32

Defect Injection and Removal Software development is labor intensive Defects are injected at any stage As quality goal is low delivered defect
density, these defects have to be removed
Done primarily by quality control (QC) activities of reviews and testing
33
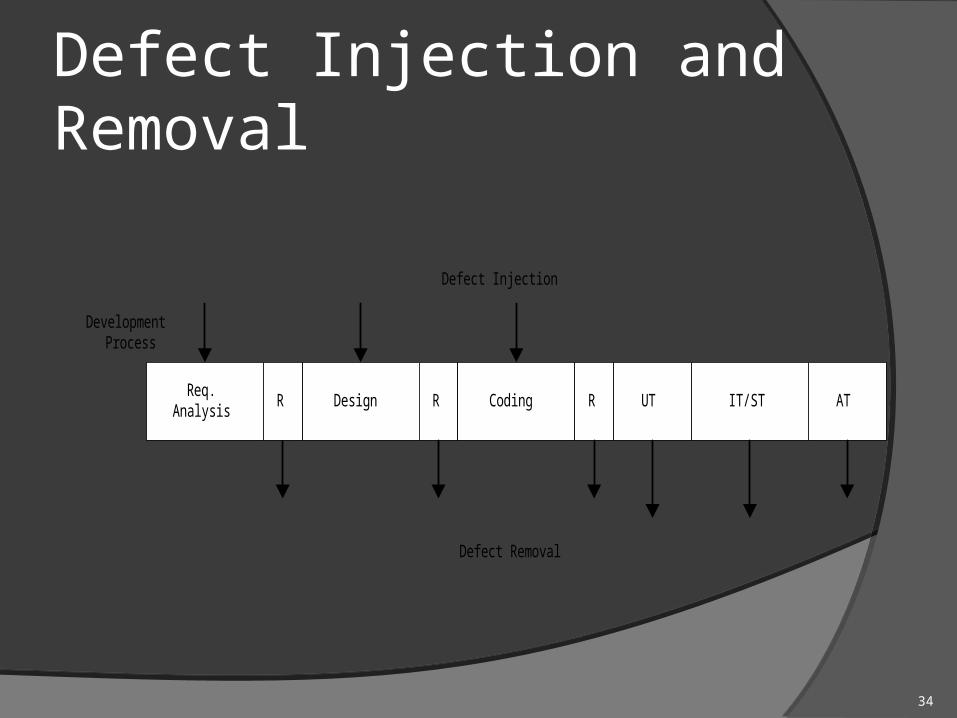
Defect Injection and Removal
Req.Analysis
Design R Coding R UT IT/ST AT
DevelopmentProcess
Defect Injection
R
Defect Removal
34

Approaches to Quality Management Ad hoc - some testing, some reviews
done as and when needed Procedural - defined procedures are
followed in a project Quantitative - defect data analysis done
to manage the quality process
35

Procedural Approach
A quality plan defines what QC tasks will be undertaken and when
Main QC tasks - reviews and testing Guidelines and procedures for reviews
and testing are provided During project execution, adherence to
the plan and procedures ensured
36

Quantitative Approach
Goes beyond asking “has the procedure been executed”
Analyzes defect data to make judgements about quality
Past data is very important Key parameters - defect injection and removal
rates, defect removal efficiency (DRE)
37

Quality Plan
The quality plan drives the quality activities in the project
Level of plan depends on models available
Must define QC tasks that have to be performed in the project
Can specify defect levels for each QC tasks (if models and data available)
38

39

Risk Management
Any project can fail - reasons can be technical, managerial, etc.
Project management aims to tackle the project management aspect
Engineering life cycles aim to tackle the engineering issues
A project may fail due to unforeseen events - risk management aims to tackle this
40

Risk Management
Risk: any condition or event whose occurrence is not certain but which can cause the project to fail
Aim of risk management: minimize the effect of risks on a project
41

Risk Management Tasks
RISKMANAGEMENT
RISK ASSESSMENT
RISK IDENTIFICATION
RISK ANALYSIS
RISK PRIORITIZATION
RISK MANAGEMENTPLANNING
RISK RESOLUTION
RISK MONITORING
RISK CONTROL
42

Risk Identification
To identify possible risks to a project, i.e. to those events that might occur and which might cause the project to fail
No “algorithm” possible, done by “what ifs”, checklists, past experience
Can have a list of “top 10” risks that projects have seen in past
43

Top Risk Examples
Shortage of technically trained manpower
Too many requirement changes Unclear requirements Not meeting performance requirements Unrealistic schedules Insufficient business knowledge Working on new technology
44
Risk Prioritization
The number of risks might be large Must prioritize them to focus attention on
the “high risk” areas For prioritization, impact of each risk
must be understood In addition, probability of the risk
occurring should also be understood
45

Risk Prioritization ...
Risk exposure (RE) = probability of risk occurring * risk impact
RE is the expected value of loss for a risk
Prioritization can be done based on risk exposure value
Plans can be made to handle high RE risks
46
A Simple approach to Risk Prioritization Classify risk occurrence probabilities as: Low,
Medium, High Classify risk impact as: Low, Medium, High Identify those that are HH, or HM/MH Focus on these for risk mitigation Will work for most small and medium sized
projects
47

Risk Control
Can the risk be avoided?E.g. if new hardware is a risk, it can be
avoided by working with proven hardware
For others, risk mitigation steps need to be planned and executedActions taken in the project such that if the
risk materializes, its impact is minimalInvolves extra cost
48

Risk Mitigation Examples
Too many requirement changesConvince client that changes in
requirements will have an impact on the schedule
Define a procedure for requirement changesMaintain cumulative impact of changes and
make it visible to clientNegotiate payment on actual effort.
49

Examples ...
Manpower attritionEnsure that multiple resources are assigned
on key project areasHave team building sessionsRotate jobs among team membersKeep backup resources in the project Maintain documentation of individual’s workFollow the CM process and guidelines
strictly
50

Examples ...
Unrealistic schedulesNegotiate for better scheduleIdentify parallel tasksHave resources ready earlyIdentify areas that can be automatedIf the critical path is not within the schedule,
negotiate with the clientNegotiate payment on actual effort
51

Risk Mitigation Plan
Risk mitigation involves steps that are to be performed (hence has extra cost)
It is not a paper plan - these steps should be scheduled and executed
These are different from the steps one would take if the risk materializes - they are performed only if needed
Risks must be revisited periodically
52

53

Background A plan is a mere document that can
guide It must be executed To ensure execution goes as per plan, it
must be monitored and controlled Monitoring requires measurements And methods for interpreting them Monitoring plan has to plan for all the
tasks related to monitoring
54
Measurements Must plan for measurements in a project Without planning, measurements will not be
done Main measurements – effort, size, schedule,
and defectsEffort – as this is the main resource; often tracked
through effort reporting toolsDefects – as they determine quality; often defect
logging and tracking systems used During planning – what will be measured, how,
tool support, and data management
55

Project Tracking
Goal: To get visibility in project execution so corrective actions can be taken when needed to ensure project succeeds
Diff types of monitoring done at projects; measurements provide data for it
56
Tracking… Activity-level monitoring
Each activity in detailed schd is getting doneOften done daily by managersA task done marked 100%; tools can determine
status of higher level tasks
Status reportsGenerally done weekly to take stockSummary of activities completed, pendingIssues to be resolved
57

Tracking… Milestone analysis
A bigger review at milestonesActual vs estimated for effort and sched is
doneRisks are revisitedChanges to product and their impact may be
analyzed Cost-schedule milestone graph is
another way of doing this
58

Cost-schedule milestone graph
59

Project Management Plan The project management plan (PMP) contains
outcome of all planning activities - focuses on overall project management
Besides PMP, a project schedule is neededReflects what activities get done in the projectMicrosoft project (MSP) can be used for thisBased on project planning; is essential for day-to-
day managementDoes not replace PMP !
60
PMP Structure - Example
Project overview - customer, start and end date, overall effort, overall value, main contact persons, project milestones, development environment..
Project planning - process and tailoring, requirements change mgmt, effort estimation, quality goals and plan, risk management plan, ..
61

PMP Example ...
Project tracking - data collection, analysis frequency, escalation procedures, status reporting, customer complaints, …
Project team, its organization, roles and responsibility, …
62

Project Planning - Summary Project planning forms the foundation of project
management Key aspects: effort and schedule estimation,
quality planning, risk mgmt., … Outputs of all can be documented in a PMP,
which carries all relevant info about project Besides PMP, a detailed project schedule
maintains tasks to be done in the project
63