Embed Size (px)
Citation preview

1522_Title 11/21/03 3:36 PM Page 1
CRC PR ESSBoca Raton London New York Washington, D.C.
JehudaYinonEdited by
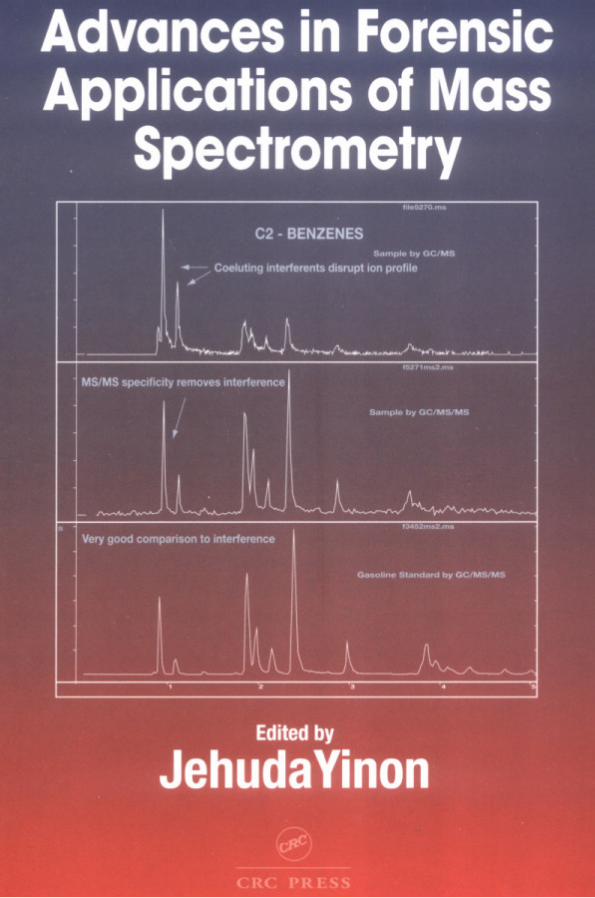
Advances in ForensicApplications of Mass
Spectrometry
This book contains information obtained from authentic and highly regarded sources. Reprinted materialis quoted with permission, and sources are indicated. A wide variety of references are listed. Reasonableefforts have been made to publish reliable data and information, but the author and the publisher cannotassume responsibility for the validity of all materials or for the consequences of their use.
Neither this book nor any part may be reproduced or transmitted in any form or by any means, electronicor mechanical, including photocopying, microfilming, and recording, or by any information storage orretrieval system, without prior permission in writing from the publisher.
All rights reserved. Authorization to photocopy items for internal or personal use, or the personal orinternal use of specific clients, may be granted by CRC Press LLC, provided that $1.50 per pagephotocopied is paid directly to Copyright Clearance Center, 222 Rosewood Drive, Danvers, MA 01923USA. The fee code for users of the Transactional Reporting Service is ISBN 0-8493-1522-0/04/$0.00+$1.50. The fee is subject to change without notice. For organizations that have been granteda photocopy license by the CCC, a separate system of payment has been arranged.
The consent of CRC Press LLC does not extend to copying for general distribution, for promotion, forcreating new works, or for resale. Specific permission must be obtained in writing from CRC Press LLCfor such copying.
Direct all inquiries to CRC Press LLC, 2000 N.W. Corporate Blvd., Boca Raton, Florida 33431.
Trademark Notice:
Product or corporate names may be trademarks or registered trademarks, and areused only for identification and explanation, without intent to infringe.
Visit the CRC Press Web site at www.crcpress.com
© 2004 by CRC Press LLC
No claim to original U.S. Government worksInternational Standard Book Number 0-8493-1522-0
Library of Congress Card Number 2003055691Printed in the United States of America 1 2 3 4 5 6 7 8 9 0
Printed on acid-free paper
Library of Congress Cataloging-in-Publication Data
Advances in forensic applications of mass spectrometry / edited by Jehuda Yinon.p. cm.
Includes bibliographical references and index.ISBN 0-8493-1522-01. Mass spectrometry—Forensic applications. 2. Chemistry, Forensic. I. Yinon, Jehuda.
HV8073.5.A38 2003363.25
¢
62—dc22 2003055691
1522_C00.fm Page iv Wednesday, November 12, 2003 10:34 AM
Introduction
The continuing developments in analytical instrumentation during the lastseveral years have had a major influence on the forensic laboratory. Amongthe instrumental methods used by the forensic analyst, the mass spectrometerhas become the method of choice. While in the early days of forensic massspectrometry GC/MS with electron ionization (EI), and later with chemicalionization (CI), were the only mass spectrometry techniques used, today avariety of MS techniques can be found in many forensic laboratories. Thoseinclude mainly LC/MS with electrospray ionization (ESI) or atmosphericpressure chemical ionization (APCI) and tandem mass spectrometry(MS/MS) in triple quadrupole or ion trap configurations. These techniquesenable the detection and identification of trace components in complex mix-tures at a high sensitivity as well as analysis of nonvolatile and thermally labilecompounds. The incorporation of new mass spectrometry techniques in theforensic laboratory paved the road for new applications in forensic analysis.
The purpose of this book is to assemble in one volume forensic appli-cations using novel mass spectrometry techniques which result in lowerdetection limits and more reliable identification. In addition, the bookdescribes some new applications which were made possible due to thisadvanced instrumentation.
Two chapters have been devoted to the detection and analysis of drugsof abuse and their metabolites in body fluids (forensic toxicology). WhileGC/MS was the main method used for this purpose, LC/MS is now playinga major role in this important area and complements GC/MS.
Testing of athletes for drugs of abuse in major sporting events hasbecome routine. GC/MS and LC/MS have been used for drug testing of urineand blood samples, which provides short-term information. A special chap-ter has been devoted to the detection of doping agents in hair by massspectrometry, as hair testing has a larger surveillance window and can pro-vide a long-term history.
The application of stable isotope ratios has become relevant for forensicpurposes with the development of more sensitive and accurate isotope ratiomass spectrometers. The chapter dealing with this subject describes the meth-
1522_C00.fm Page v Wednesday, November 12, 2003 10:34 AM
© 2004 by CRC Press LLC
odology, the instrumentation, and several forensic applications, includingorigin identification of drugs and explosives and isotope tagging.
For many years, GC/MS has been the major method used for identifica-tion of accelerants in fire debris. MS/MS now provides an additional dimen-sion of identification. GC/MS/MS has the capability to isolate and identifyignitable liquid residues in the presence of background products such aspyrolysates that may mask the target analytes of interest. A chapter devotedto this subject consists of two subchapters written by two different authorswho are using GC/MS/MS with a different approach for the identification ofaccelerants in fire debris.
LC/MS, with electrospray ionization (ESI) and atmospheric pressurechemical ionization (APCI), are now being used for the analysis of explosivesin postblast residues. This chapter describes both ionization techniques andtheir application in explosive residue analysis.
The mass spectrometer in its various configurations is now an integralpart of every forensic laboratory. The number of possible forensic applica-tions of this analytical technique is limited only by the imagination of theforensic chemist.
Finally, I would like to thank the contributing authors who have madethe publication of this book possible. Many thanks are due to authors andpublishers for permission to reproduce copyrighted material.
— Jehuda Yinon
1522_C00.fm Page vi Wednesday, November 12, 2003 10:34 AM
© 2004 by CRC Press LLC
The Editor
Dr. Jehuda Yinon
is currently a visiting professor of forensic science at theNational Center for Forensic Science (NCFS), University of Central Florida(UCF), Orlando, Florida.
Dr. Yinon received his B.Sc. and M.Sc. degrees in electrical engineeringfrom the Technion, Israel Institute of Technology (Haifa, Israel), and hisPh.D. in chemistry from the Weizmann Institute of Science (Rehovot, Israel).
Dr. Yinon was a senior research fellow at the Weizmann Institute ofScience, Rehovot, Israel, for 35 years, until 2000. He was a research associate(1971 to 1973) and a senior research associate (1976 to 1977) at Caltech’s JetPropulsion Laboratory (Pasadena, California), and spent sabbatical leaves asa visiting scientist at the National Institute of Environmental Health Sciences(Research Triangle Park, North Carolina) (1980 to 1981), the EPA Environ-mental Monitoring Systems Laboratory (Las Vegas, Nevada) (1988 to 1989),and the University of Florida, Gainesville (1993 to 1994).
Dr. Yinon’s main research interests are applications of mass spectrometrytechniques in forensic science with emphasis on analysis of explosives andthe application of novel technologies to the detection of explosives.
Dr. Yinon has authored, coauthored, and edited 7 books and publishedover 100 papers in the scientific literature. He is a member of the AmericanAcademy of Forensic Science, the American Chemical Society, the AmericanSociety for Mass Spectrometry, and the Israel Society for Mass Spectrometry.He is a regional editor of Forensic Science Review and is on the editorialboards of the
Journal of Energetic Materials
,
Environmental Forensics Journal
,and
Modern Mass Spectrometry
.
1522_C00.fm Page vii Wednesday, November 12, 2003 10:34 AM
© 2004 by CRC Press LLC
Contributors
José R. Almirall
Department of Chemistry and International Forensic Research Institute
Florida International UniversityMiami, Florida
Maciej J. Bogusz
Department of Pathology and Laboratory Medicine
King Faisal Specialist Hospital and Research Centre
Riyadh, Saudi Arabia
Vincent Cirimele
Institut de Medicine LegaleUniversite Louis PasteurStrasbourg, France
Pascal Kintz
Institut de Medicine LegaleUniversite Louis PasteurStrasbourg, France
Ray H. Liu
Graduate Program in Forensic ScienceDepartment of Justice SciencesUniversity of Alabama at BirminghamBirmingham, Alabama
Hans H. Maurer
Department of Experimental and Clinical Toxicology
Institute of Experimental and Clinical Pharmacology and Toxicology
University of SaarlandHomburg (Saar), Germany
Wolfram Meier-Augenstein
Queen’s University BelfastEnvironmental Engineering Research
GroupSchool of Civil EngineeringBelfast, U.K.
Jeannette Perr
Department of Chemistry andInternational Forensic Research Institute
Florida International UniversityMiami, Florida
Dale Sutherland
Activation Laboratories Ltd.Ancaster, Ontario, Canada
Marion Villain
Institut de Medicine LegaleUniversite Louis PasteurStrasbourg, France
Jehuda Yinon
National Center for Forensic ScienceUniversity of Central FloridaOrlando, Florida
1522_C00.fm Page ix Wednesday, November 12, 2003 10:34 AM
© 2004 by CRC Press LLC
List of Abbreviations
2-ADNT — 2-amino-4,6-dinitrotoluene4-ADNT — 4-amino-2,6-dinitrotoluene2-D — two-dimension6-MAM — 6-monoacetylmorphineA — amphetamineAC — acetylationAC — acetylcodeineACE — angiotensin converting enzymeACN — acetonitrileACS — activated charcoal stripAGC — automatic gain controlAN — ammonium nitrateAPCI — atmospheric pressure chemical ionizationAPE — atom% excessAPI — atmospheric pressure ionizationAPPI — atmospheric pressure photoionizationASTM — American Society for Testing and MaterialsAT
1
— angiotensin II AT
1
receptorBDB — benzodioxolybutanamineBMA — benzphetamineBSIA — bulk stable isotope analysisBU — buprenorphineBUG — buprenorphine glucuronideBZE — benzoylecgonineBZP —
N
-benzylpiperazineC4 — composition 4C6G — codeine-6-glucuronideCAD — collisionally activated dissociationCAM — crassulacean acid metabolismCE — capillary electrophoresisCF — continuous flowCI — chemical ionizationCID — collision-induced dissociation
1522_C00.fm Page xi Wednesday, November 12, 2003 10:34 AM
© 2004 by CRC Press LLC
CL-20 — hexanitrohexazaisowurtzitaneCod — codeineCSIA — compound specific isotope analysisDAD — diode array detectionDAM — diacetylmorphineDC — direct currentDHEA — dehydroepiandrosteroneDHM — dihydromorphineDHT — dihydrotestosteroneDLI — direct liquid introductionDMT —
N,N
-dimethyltryptamineDNA — deoxyribonucleic acidDNB — dinitrobenzeneDNT — dinitrotolueneDUID — driving under the influence of drugsE — ephedrineEA — elemental analysisECG — ecgonineEDDP — 2-ethylidene-1,5-dimethyl-3,3-diphenylpyrrolidineEGDN — ethylene glycol dinitrateEI — electron ionizationEM — electron multiplierEMDP — 2-ethyl-5-methyl-3,3-diphenyl-1-pyrrolineEME — ecgonine methyl esterESI — electrospray ionizationEU — extraction uniformityFC — Faraday cupFID — flame ionization detectorFT-ICR — Fourier transform ion cyclotron resonanceGC — gas chromatographyGC/C — gas chromatography/conversion interfaceGC/FID — gas chromatograph/flame ionization detectorGCxGC — two-dimension gas chromatographyGC/HRMS — gas chromatography/high resolution mass spectrometryGC/MS — gas chromatography/mass spectrometryGC/MS/MS — gas chromatography/tandem mass spectrometryGC/PID — gas chromatograph/photoionization detectorGHB — gamma-hydroxybutyrateH3G — hydromorphine-3-glucuronideHexyl — hexanitrodiphenylamineHFB — heptafluorobutyrationHFB — heptafluorobutyrate
1522_C00.fm Page xii Wednesday, November 12, 2003 10:34 AM
© 2004 by CRC Press LLC
HMTD — hexamethylenetriperoxidediamineHMX — 1,3,5,7-tetranitro-1,3,5,7-tetrazacyclooctaneHNS — hexanitrostilbeneHPLC — high performance liquid chromatographyHRcGC — high resolution capillary gas chromatographyHRMS — high resolution mass spectrometryHYC — hydrocodoneHYM — hydromorphoneID — internal diameterIDT — isotope dilution techniqueIFD — ion fingerprint detectionILA — isotope-labeled analogILR — ignitable liquid residueIOC — International Olympic CommitteeIRMS — isotope ratio mass spectrometryIS — internal standardISCIRA — internal standard carbon isotope ratio analysisLC/MS — liquid chromatography/mass spectrometryLC/MS/MS — liquid chromatography/tandem mass spectrometryLLE — liquid–liquid extractionLOD — limit of detectionLOQ — limit of quantitationLSD — lysergic acid diethylamideK9 — canineM — morphineM3G — morphine-3-glucuronideM6G — morphine-6-glucuronideMA — methamphetamineMBDB —
N
-methyl-benzodioxolylbutanamineMBHFA —
N
-methyl-
N
-trimethylsilylheptafluorobutyramideMBHFBA —
N
-methyl-bis-heptafluorobutyramidemCPP — 1-(3-chlorophenyl)piperazineMDA — methylenedioxyamphetamineMDBP —
N
-(3,4-methylenedioxybenzyl)piperazineMDE — methylenedioxyethylamphetamineMDEA — methylenedioxyethylamphetamineMDMA — methylenedioxymethamphetamineMDPPP — 3
¢
,4
¢
-methylenedioxy-alpha-pyrrolidinopropiophenoneME — methylation, methylatedMeOPP — 1-(4-methoxyphenyl)piperazineMF — matrix factorMOPPP — 4
¢
-methoxy-alpha-pyrrolidinopropiophenone
1522_C00.fm Page xiii Wednesday, November 12, 2003 10:34 AM
© 2004 by CRC Press LLC
MPHP — 4
¢
-methyl-alpha-pyrrolidinohexaphenoneMRM — multiple reaction monitoringMS — mass spectrometryMS/MS — tandem mass spectrometryMSTFA —
N
-methyltrimethylsilyltrifluoroacetamideNBU — norbuprenorphineNG — nitroglycerinNICI, NCI — negative-ion chemical ionizationNMT —
N
-methyltryptamineNorCod — norcodeineNor-K — nor-ketobemidoneNor-M — normorphineNQ — nitroguanidineNSAID — non-steroidal anti-inflammatory drugNTO — 5-nitro-2,4-dihydro-3H-1,2,4-triazol-3-oneODS — octadecylsilicaPB — particle beamPBI — particle beam ionizationPDB — PeeDee belemnites (standard)PETN — pentaerythritol tetranitratePFP — pentafluoropropionylationPholcod — pholcodinePID — photoionization detectorPMA — paramethoxyamphetaminePPP — alpha-pyrrolidinopropiophenoneQ — single stage quadrupole mass analyzerQIT — quadrupole ion trapqIT — quadrupole/ion trap mass analyzerQQQ — triple stage quadrupole mass analyzerqTOF — quadrupole/time-of-flight mass analyzerRDX — 1,3,5-trinitro-1,3,5-triazacyclohexaneRF — radio frequencyRIA — radioimmunological assayRT — retention timeSB — secobarbitalSD — standard deviationSIM — selected ion monitoringSMOW — standard mean ocean waterSPE — solid-phase extractionSPME — solid-phase microextractionSRM — single reaction monitoringSSI — sonic spray ionization
1522_C00.fm Page xiv Wednesday, November 12, 2003 10:34 AM
© 2004 by CRC Press LLC
SSRI — selective serotonin reuptake inhibitorSTA — systematic toxicological analysisTC — thermal conversionTCA — tricyclic antidepressantsTFA — trifluoroacetateTFA — trifluoroacetic acidTFA — trifluoroacetylationTFMPP — 1-(3-trifluoromethylphenyl)piperazineTHC — tetrahydrocannabinolTLC — thin layer chromatographyTMC — trimethoxycocaineTMS — trimethylsilylationTMSI — trimethylsilyl imidazoleTNB — 1,3,5-trinitrobenzeneTNC — trinitro-
m
-cresolTNT — 2,4,6-trinitrotolueneTOF — time-of-flightTS — thermosprayTSQ — triple stage quadrupoleUV — ultraviolet
1522_C00.fm Page xv Wednesday, November 12, 2003 10:34 AM
© 2004 by CRC Press LLC
Table of Contents
1
Screening for Drugs in Body Fluids byGC/MS
Hans H. Maurer
2
Liquid Chromatography–Mass Spectrometry in Forensic Toxicology
Maciej J. Bogusz
3
Substance Abuse in Sports: Detectionof Doping Agents in Hair by MassSpectrometry
Marion Villain, Vincent Cirimele, and Pascal Kintz
4
Forensic Applications of Isotope Ratio MassSpectrometry
Wolfram Meier-Augenstein and Ray H. Liu
5
Identification of Ignitable Liquid Residuesin Fire Debris by GC/MS/MS
Dale Sutherland, Jeannette Perr, and José R. Almirall
6
Analysis of Explosives by LC/MS
Jehuda Yinon
1522_C00.fm Page xvii Wednesday, November 12, 2003 10:34 AM
© 2004 by CRC Press LLC
1522_C01.fm Page 1 Tuesday, December 2, 2003 10:05 AM
© 2004 by CRC Press LLC
1
Screening for Drugs in Body Fluids by GC/MSHANS H. MAURER
Contents
1.1 Introduction1.1.1 Matrices for Drug Screening1.1.2 Sample Preparation
1.2 Screening for Drugs in Blood, Serum, or Plasma by GC/MS1.3 Screening for Drugs in Alternative Matrices by GC/MS1.4 Screening for Drugs in Urine by GC/MS
1.4.1 Screening Procedures for Detection of Particular DrugClasses in Urine by GC/MS1.4.1.1 Screening Procedures for Detection of Particular
Drug Classes of Basic or Neutral Drugs and/orTheir Metabolites in Urine
1.4.1.2 Screening Procedures for Detection of Particular Drug Classes of Acidic Drugs and/or TheirMetabolites in Urine
1.4.2 General Screening Procedures for Simultaneous Detectionof Several Drug Classes in Urine by GC/MS1.4.2.1 General Screening Procedure for Drug Classes
Relevant in Doping after Enzymatic Hydrolysis,SPE, and Combined TMS and TFADerivatization
1.4.2.2 General Screening for Most of the Basic andNeutral Drug Classes in Urine after AcidHydrolysis, LLE, and AC
1.4.2.3 General Screening Procedures for Simultaneous Detection of Several Classes of Acidic Drugs inUrine after Extractive Methylation
1.5 Conclusions and PerspectivesAcknowledgmentsReferences
1522_C01.fm Page 2 Tuesday, December 2, 2003 10:05 AM
1.1 Introduction
In forensic toxicology, proof of abuse of illegal drugs or of murder by poi-soning are important tasks. Furthermore, drugs, which may reduce the penalresponsibility of a defendant, or which may reduce the fitness to drive a car,must be monitored in body fluids or tissues.
In clinical toxicology, the diagnosis or the definite exclusion of an acuteor chronic poisoning is of great importance. Furthermore, patients addictedto alcohol, medicaments, or illegal drugs have to be monitored. For deter-mination of clinical death as a prerequisite for explantation of organs, thepresence of drugs which may depress the central nervous system must beanalytically excluded. The compliance of patients can be monitored by deter-mination of the prescribed drugs. Finally, monitoring of drugs with a narrowtherapeutic range can be performed by the clinical toxicologist. Similiarproblems arise in forensic toxicology.
In doping control, the use or abuse of drugs that may stimulate the build-up of muscles, enhance endurance during competition, lead to reduction ofbody weight, or that may reduce pain caused by overexertion must be mon-itored, typically in urine.
An efficient toxicological analysis is the basis of competent toxicologicaljudgement, consultation, and expertise. The choice of methods in analyticaltoxicology depends on the problems to be solved. Usually, the compoundsto be analyzed are unknown. Therefore, the first step is the identification ofthe compounds of interest which can then be quantified, e.g., in plasma. Thescreening strategy of systematic toxicological analyses (STA) must be veryextensive because several thousands of drugs or pesticides have to be consid-ered. It often includes screening and confirmatory tests. If only a single drugor category has to be monitored, immunoassays can be used for screeningin order to differentiate between negative and presumptively positive samples.Positive results must be confirmed by a second independent method that isat least as sensitive as the screening test and that provides the highest levelof confidence in the result. Without doubt, GC/MS, especially in the full-scan electron ionization (EI) mode, is still the reference method for confir-mation of positive screening tests.1–21 Nevertheless, LC/MS has also beenapplied for screening and confirmation of particular drugs or drug classes,especially in blood.22–31
The two-step strategy, immunoassay screening and MS confirmation, isemployed only if those drugs or poisons have to be determined that arescheduled, e.g., by law or by international organizations, and for whichimmunoassays are commercially available. If this is not the case, the screeningstrategy must be more extensive, because several thousands of drugs orpesticides are on the market worldwide.32 For these reasons, STA procedures
© 2004 by CRC Press LLC
1522_C01.fm Page 3 Tuesday, December 2, 2003 10:05 AM
are necessary that allow the simultaneous detection of as many toxicants inbiosamples as possible. As already mentioned, GC/MS procedures are mostoften used today. HPLC coupled to diode array detectors (DAD)33–39 havealso been described for general screening purposes, but the specificity is lowerthan that of full-scan EI MS. Valli et al.40 combined GC/MS blood screeningwith urine REMEDi testing and Saint-Marcoux et al.26 combined GC/MS,HLPC-DAD, and LC/MS. LC/MS procedures in this field were several timesreviewed in the last years, e.g., by Maurer,41 Van Bocxlaer et al.,42 Marquet,28
and Bogusz.31,43
Most of the STA procedures cover basic (and neutral) drugs, whichinclude the majority of toxicants. For example, most of the psychotropicdrugs have basic properties like neurotransmitters. Nevertheless, some classesof acidic drugs or drugs producing acidic metabolites, like cardiovasculardrugs such as angiotensin converting enzyme (ACE) inhibitors and angio-tensin II AT1 receptor blockers, dihydropyridine-type calcium channel block-ers (metabolites), diuretics, coumarin anticoagulants, antidiabetics of thesulfonylurea type, barbiturates, or nonsteroidal antiinflammatory drugs(NSAIDs), are relevant to clinical and forensic toxicology or doping. There-fore, GC/MS screening procedures are described here not only for detectionof basic and neutral, but also acidic drugs in biosamples. After the unequiv-ocal identification, reliable quantification of the drugs can also be performedby GC/MS, especially if stable isotopes are used as internal standards (forexample, see References 44, 45), or in case of rather polar or unstable com-pounds, by LC/MS, even using universal internal standards like deuteratedtrimipramine.22,24,25,46 However, whatever technique is used, quantificationprocedures must be validated according to international guidelines, whichhave recently been reviewed by Peters and Maurer.47
1.1.1 Matrices for Drug Screening
Blood (plasma, serum) is the sample of choice for quantification. However,if the blood concentration is high enough, screening can also be performedherein. This is especially advantageous if only blood samples are availableand/or the procedures allow simultaneous screening and quantifica-tion.6,9,32,48,49 In driving under the influence of drugs (DUID) cases, bloodanalysis is even mandatory. A GC/MS screening procedure has beendescribed for about 100 acid, neutral, and basic drugs in horse plasma.50
Methods for postmortem drug analysis have been reviewed recently.51
GC/MS analysis of drugs in alternative matrices like hair,8,19,52 sweat andsaliva,7,19 meconium,53 or nails54 have also been described, but a comprehen-sive screening for a series of various drugs has not yet been described inalternative matrices, probably because the concentrations are too low for
© 2004 by CRC Press LLC
1522_C01.fm Page 4 Tuesday, December 2, 2003 10:05 AM
full-scan GC/MS detection. Negative-ion chemical ionization (NICI) allowsmarkedly lowering the detection limits,20,24,44 but this technique is not suitablefor comprehensive screening because the analytes must contain an electrone-gative moiety and the NICI mass spectra are less informative and reproduc-ible than EI spectra.
In conclusion, urine is still the sample of choice for comprehensivescreening for, and identification of, unknown drugs or poisons, mainlybecause concentrations of drugs are relatively high in urine and the samplescan be taken noninvasively.1,2,4,16,18,32 However, the metabolites of theseunknowns must be identified, additionally or even exclusively. In (horse)doping control, urine is also the common sample for screening.55
1.1.2 Sample Preparation
Suitable sample preparation is an important prerequisite for GC/MS analysisin biosamples. It may involve cleavage of conjugates, isolation, and derivati-zation, preceded or followed by cleanup steps. Cleavage of conjugates can beperformed by fast acid hydrolysis or by gentle but time-consuming enzymatichydrolysis.2 However, the enzymatic hydrolysis of acyl glucuronides (esterglucuronides of carboxy derivatives like NSAIDs) may be hindered due toacyl migration,56 an intramolecular transesterification at the hydroxy groupsof the glucuronic acid, which leads to b-glucuronidase-resistant derivatives.If the analysis must be finished within a rather short time as in emergencytoxicology, it is preferable to cleave the conjugates by rapid acid hydroly-sis.57–62 Alkaline hydrolysis is only suitable for cleavage of ester conjugates.However, the formation of artifacts during chemical hydrolysis must be con-sidered.63 A compromise over both cleavage techniques is the use of a columnpacked with immobilized glucuronidase/arylsulfatase. It combines the advan-tages of both methods — the speed of acid hydrolysis and the gentle cleavageof enzymatic hydrolysis.64 Acyl glucuronides, e.g., of acidic drugs are readilycleaved under the conditions of extractive alkylation (alkaline pH, elevatedtemperature) and need no extra cleavage step.65–69
Isolation can be performed by liquid–liquid extraction (LLE) at a pH atwhich the analyte is nonionized or by solid-phase extraction (SPE) precededor followed by cleanup steps. Sample pretreatment for SPE depends on thesample type: whole blood and tissue (homogenates) need deproteinizationand filtration/centrifugation steps before application to the SPE columns,whereas for urine usually a simple dilution step and/or centrifugation issatisfactory. Whatever SPE column is used, the analyst should keep in mindthat there are large differences from batch to batch, and that comparablesorbents from different manufacturers may also lead to different results.70
Therefore, use of a suitable internal standard (e.g., deuterated analytes) isrecommended.
© 2004 by CRC Press LLC
1522_C01.fm Page 5 Tuesday, December 2, 2003 10:05 AM
Solid-phase microextraction (SPME) is becoming a modern alternativeto SPE and LLE. SPME is a solvent-free and concentrating extraction tech-nique especially for rather volatile analytes. It is based on the adsorption ofthe analyte on a stationary phase, coating a fine rod of fused silica. Theanalytes can be desorbed directly in the GC injector. Fast GC/MS proceduresfor screening, e.g., for benzodiazepines,71 for barbiturates,72 clozapine,73 orfor drugs of abuse74–82 have been published in recent years.
Extractive alkylation has been proved to be a powerful procedure forsimultaneous extraction and derivatization of acidic compounds.65–69,83 Theacidic compounds are extracted at pH 12 as ion pairs with a phase-transfercatalyst (tetrahexyl ammonium iodide, THA+I–) into the organic phase (tol-uene). In the organic phase, the phase-transfer catalyst could easily be sol-vated due to its lipophilic hexyl groups, whereas poor solvation of the anionicanalytes leads to a high reactivity with the alkylation (most often methyla-tion) reagent alkyl (methyl) iodide. Part of the phase-transfer catalyst canalso reach the organic phase as an ion pair with the iodide anion formedduring the alkylation reaction or with anions of the urine matrix. Therefore,the remaining part had to be removed to prevent a loss of the GC column’sseparation power and to exclude interactions with analytes in the GC injec-tion port. Several SPE sorbents and different eluents have been tested forefficient separation of the vestige of the phase-transfer catalyst from theanalytes. A diol sorbent yielded best reproducibility and recovery under thedescribed conditions. Further advantages of such SPE columns were easyhandling, commercial availability, and that they had not to be manuallyprepared as described by Lisi et al.84
Derivatization steps are necessary if relatively polar compounds contain-ing, e.g., carboxylic, hydroxy, primary, or secondary amino groups are to bedetermined by GC/MS, and/or if electronegative moieties (e.g., halogenatoms) have to be introduced into the molecule for sensitive NICI detection.The following procedures are typically used for basic compounds: acetylation(AC), trifluoroacetylation (TFA), pentafluoropropionylation (PFP), hep-tafluorobutyration (HFB), trimethylsilylation (TMS), or for acidic com-pounds: methylation (ME), extractive methylation, PFP, TMS or tert-butyldimethylsilylation. Further details on derivatization methods can befound in References 57, 63, and the pros and cons of derivatization proce-dures were discussed in a review of Segura et al.85
1.2 Screening for Drugs in Blood, Serum, or Plasma by GC/MS
GC/MS procedures have been published for blood screening, mainly of drugsof abuse6,86–89 because they have to be monitored or confirmed after
© 2004 by CRC Press LLC
1522_C01.fm Page 6 Tuesday, December 2, 2003 10:05 AM
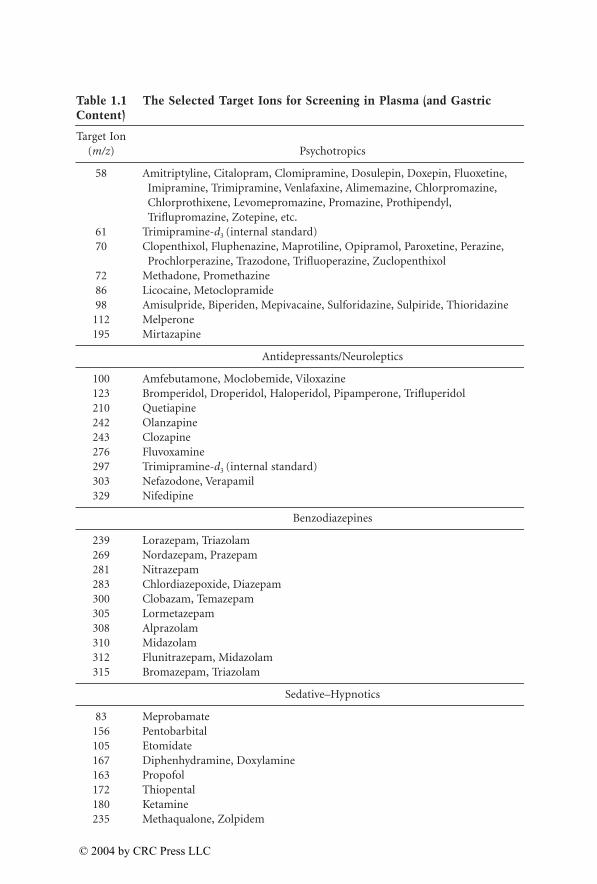
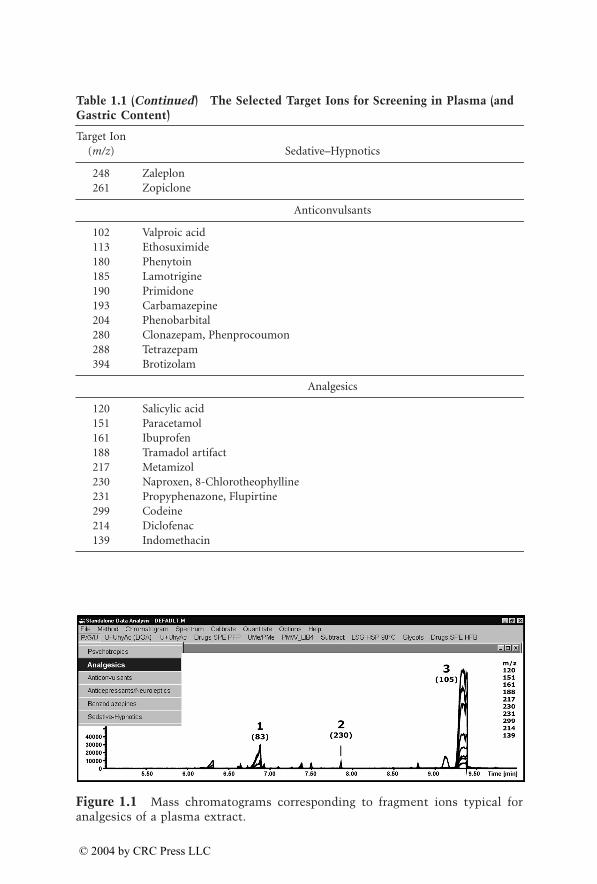
immunoassay prescreening, e.g., in DUID cases.21,90 An automated screeningprocedure for barbiturates, benzodiazepines, antidepressants, morphine, andcocaine in blood after SPE and TMS has been developed.9,48 The samplepreparation consists of SPE and TMS derivatization, both automated usingan HP PrepStation. The samples are directly injected by the PrepStation andanalyzed by full-scan GC/MS. Using macros, peak identification, and thereporting of results are also automated. This fully automated procedure takesabout 2 h, which is acceptable for forensic drug testing or doping control butnot for emergency toxicology. Automation of the data evaluation is a com-promise between selectivity and universality. If the exclusion criteria are cho-sen too narrowly, peaks may be overlooked. If the window is too large, a seriesof proposals is given by the computer, which have to be revised by the toxi-cologist. In order to extend this limited blood screening, one working grouprecommended to combine it with a urine screening using the REMEDI blackbox system.40 Maurer57 has described a rather comprehensive plasma screen-ing procedure based on a standard LLE after addition of the universal internalstandard trimipamine-d3. This universal extract can be used for GC/MS aswell as for LC/MS25 screening, identification, and quantification. The GC/MSscreening is based on mass chromatography24,46 using macros for selection ofsuspected drugs,91 followed by identification of the unknown spectra bylibrary search.92 The selected ions for screening in plasma (and gastric con-tent) have recently been updated by the author’s coworkers using experiencesfrom their daily routine work with this procedure, and they are summarizedin Table 1.1. The drugs or poisons which can be detected in plasma aftertherapeutic or toxic dosage are listed in the author’s handbook.32 Of course,further compounds can be detected,93 if they are present in the extract, volatilein GC, and their mass spectra are contained in the reference libraries.92,94–96
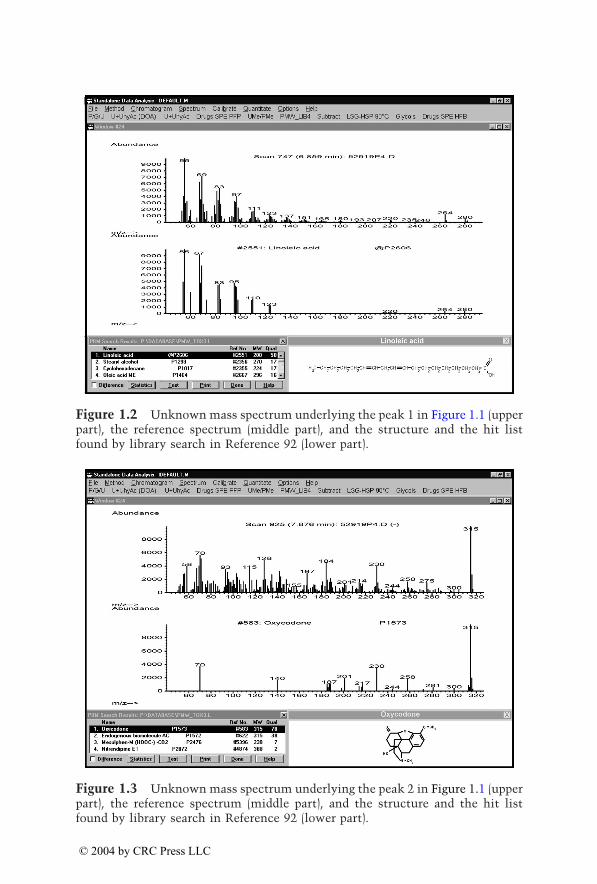
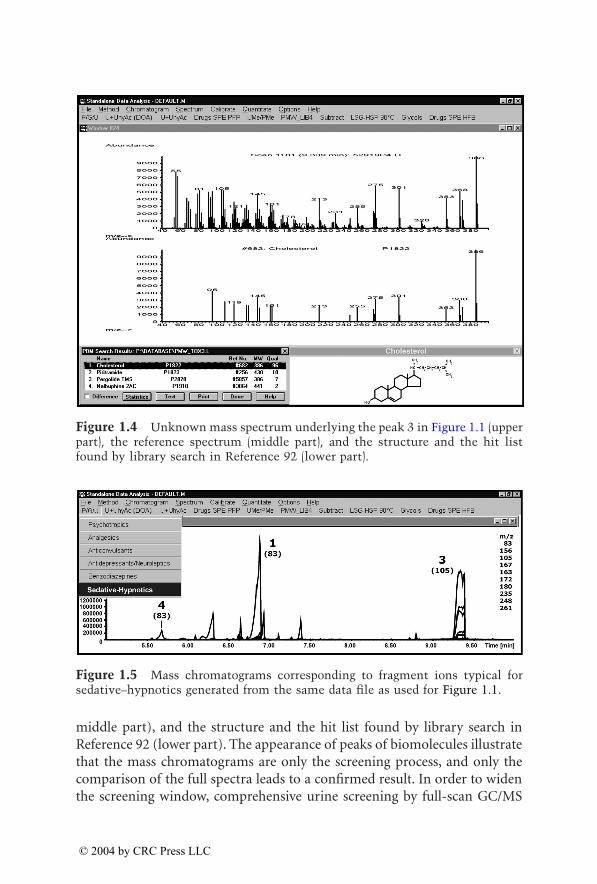
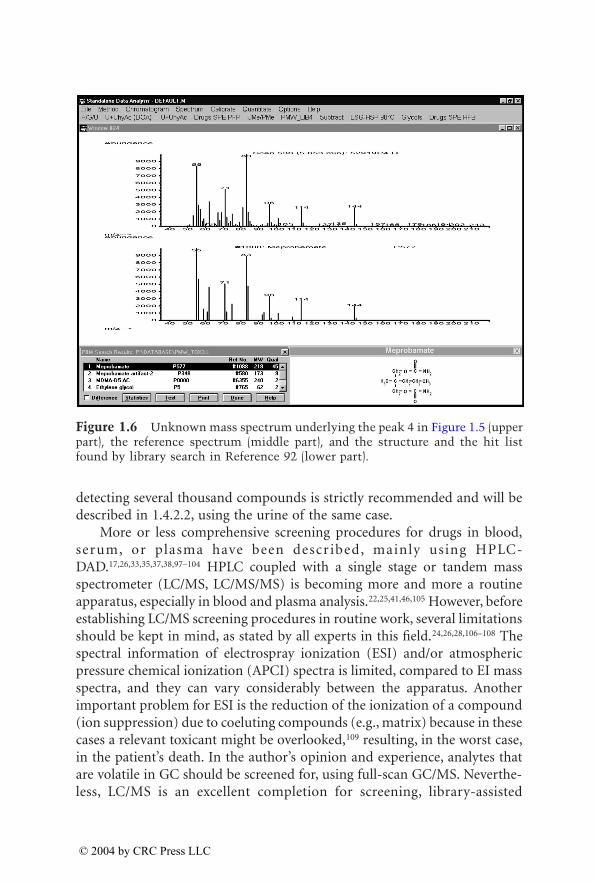
The plasma screening procedure is illustrated in Figure 1.1 to Figure 1.6.Figure 1.1 shows mass chromatograms corresponding to fragment ions typ-ical for analgesics of a plasma extract. Generation of the mass chromatogramscan be started by clicking the corresponding pull-down menu which executesthe user-defined macros.91 Three major peaks appear, the identity of whichis confirmed by comparison of the underlying full mass spectrum with ref-erence spectra. Figure 1.2 shows the unknown mass spectrum underlyingpeak 1 (upper part), the reference spectrum (biomolecule linoleic acid, mid-dle part), and the structure and the hit list found by library search in Refer-ence 92 (lower part). Figure 1.3 and Figure 1.4 show the same for peaks 2(oxycodone) and 3 (biomolecule cholesterol). Figure 1.5 shows mass chro-matograms corresponding to fragment ions typical for sedative–hypnoticsgenerated from the same data file. The peaks 1 and 3 indicate the samecompounds as indicated in Figure 1.1. Figure 1.6 shows the mass spectrumunderlying peak 4 (upper part), the reference spectrum (meprobamate,
© 2004 by CRC Press LLC
1522_C01.fm Page 7 Tuesday, December 2, 2003 10:05 AM
Table 1.1 The Selected Target Ions for Screening in Plasma (and Gastric Content)
Target Ion(m/z) Psychotropics
58 Amitriptyline, Citalopram, Clomipramine, Dosulepin, Doxepin, Fluoxetine, Imipramine, Trimipramine, Venlafaxine, Alimemazine, Chlorpromazine, Chlorprothixene, Levomepromazine, Promazine, Prothipendyl, Triflupromazine, Zotepine, etc.
61 Trimipramine-d3 (internal standard)70 Clopenthixol, Fluphenazine, Maprotiline, Opipramol, Paroxetine, Perazine,
Prochlorperazine, Trazodone, Trifluoperazine, Zuclopenthixol 72 Methadone, Promethazine 86 Licocaine, Metoclopramide 98 Amisulpride, Biperiden, Mepivacaine, Sulforidazine, Sulpiride, Thioridazine
112 Melperone195 Mirtazapine
Antidepressants/Neuroleptics
100 Amfebutamone, Moclobemide, Viloxazine123 Bromperidol, Droperidol, Haloperidol, Pipamperone, Trifluperidol 210 Quetiapine242 Olanzapine 243 Clozapine 276 Fluvoxamine 297 Trimipramine-d3 (internal standard)303 Nefazodone, Verapamil 329 Nifedipine
Benzodiazepines
239 Lorazepam, Triazolam 269 Nordazepam, Prazepam 281 Nitrazepam 283 Chlordiazepoxide, Diazepam 300 Clobazam, Temazepam 305 Lormetazepam 308 Alprazolam 310 Midazolam 312 Flunitrazepam, Midazolam 315 Bromazepam, Triazolam
Sedative–Hypnotics
83 Meprobamate 156 Pentobarbital 105 Etomidate 167 Diphenhydramine, Doxylamine 163 Propofol172 Thiopental 180 Ketamine235 Methaqualone, Zolpidem
© 2004 by CRC Press LLC
1522_C01.fm Page 8 Tuesday, December 2, 2003 10:05 AM
Target Ion(m/z) Sedative–Hypnotics
248 Zaleplon261 Zopiclone
Anticonvulsants
102 Valproic acid 113 Ethosuximide180 Phenytoin 185 Lamotrigine 190 Primidone193 Carbamazepine204 Phenobarbital280 Clonazepam, Phenprocoumon288 Tetrazepam 394 Brotizolam
Analgesics
120 Salicylic acid151 Paracetamol 161 Ibuprofen188 Tramadol artifact217 Metamizol230 Naproxen, 8-Chlorotheophylline 231 Propyphenazone, Flupirtine 299 Codeine214 Diclofenac139 Indomethacin
Figure 1.1 Mass chromatograms corresponding to fragment ions typical foranalgesics of a plasma extract.
Table 1.1 (Continued) The Selected Target Ions for Screening in Plasma (and Gastric Content)
© 2004 by CRC Press LLC
1522_C01.fm Page 9 Tuesday, December 2, 2003 10:05 AM
Figure 1.2 Unknown mass spectrum underlying the peak 1 in Figure 1.1 (upperpart), the reference spectrum (middle part), and the structure and the hit listfound by library search in Reference 92 (lower part).
Figure 1.3 Unknown mass spectrum underlying the peak 2 in Figure 1.1 (upperpart), the reference spectrum (middle part), and the structure and the hit listfound by library search in Reference 92 (lower part).
© 2004 by CRC Press LLC
1522_C01.fm Page 10 Tuesday, December 2, 2003 10:05 AM
middle part), and the structure and the hit list found by library search inReference 92 (lower part). The appearance of peaks of biomolecules illustratethat the mass chromatograms are only the screening process, and only thecomparison of the full spectra leads to a confirmed result. In order to widenthe screening window, comprehensive urine screening by full-scan GC/MS
Figure 1.4 Unknown mass spectrum underlying the peak 3 in Figure 1.1 (upperpart), the reference spectrum (middle part), and the structure and the hit listfound by library search in Reference 92 (lower part).
Figure 1.5 Mass chromatograms corresponding to fragment ions typical forsedative–hypnotics generated from the same data file as used for Figure 1.1.
© 2004 by CRC Press LLC
1522_C01.fm Page 11 Tuesday, December 2, 2003 10:05 AM
detecting several thousand compounds is strictly recommended and will bedescribed in 1.4.2.2, using the urine of the same case.
More or less comprehensive screening procedures for drugs in blood,serum, or plasma have been descr ibed, mainly using HPLC-DAD.17,26,33,35,37,38,97–104 HPLC coupled with a single stage or tandem massspectrometer (LC/MS, LC/MS/MS) is becoming more and more a routineapparatus, especially in blood and plasma analysis.22,25,41,46,105 However, beforeestablishing LC/MS screening procedures in routine work, several limitationsshould be kept in mind, as stated by all experts in this field.24,26,28,106–108 Thespectral information of electrospray ionization (ESI) and/or atmosphericpressure chemical ionization (APCI) spectra is limited, compared to EI massspectra, and they can vary considerably between the apparatus. Anotherimportant problem for ESI is the reduction of the ionization of a compound(ion suppression) due to coeluting compounds (e.g., matrix) because in thesecases a relevant toxicant might be overlooked,109 resulting, in the worst case,in the patient’s death. In the author’s opinion and experience, analytes thatare volatile in GC should be screened for, using full-scan GC/MS. Neverthe-less, LC/MS is an excellent completion for screening, library-assisted
Figure 1.6 Unknown mass spectrum underlying the peak 4 in Figure 1.5 (upperpart), the reference spectrum (middle part), and the structure and the hit listfound by library search in Reference 92 (lower part).
© 2004 by CRC Press LLC
1522_C01.fm Page 12 Tuesday, December 2, 2003 10:05 AM
identification, and quantification of unstable, low-dosed, and/or rather polarcompounds, especially in plasma.22–31
1.3 Screening for Drugs in Alternative Matricesby GC/MS
There are several advantages of alternative matrices over urine and blood fordrugs of abuse testing. They can be collected rather easily and noninvasivelywith low risk of adulteration. In addition, using hair, the window of drugdetection is dramatically extended to weeks, months, or even years.19 Thegreat advances in analytical techniques today allow us to monitor drugs insuch matrices. Several reviews on drug testing in alternative matrices havebeen published in the last years.7,8,10,12–15,19,53,110 Most procedures published inlast 2 years are still based on GC/MS; for example, see References 75, 76, 78,111–120. However, as already mentioned above, it must be kept in mind that,until now, no really comprehensive screening procedure has been describedfor alternative matrices as would be necessary in general unknown cases, andthat the pharmacokinetic interpretation is often difficult.
1.4 Screening for Drugs in Urine by GC/MS
1.4.1 Screening Procedures for Detection of Particular Drug Classes in Urine by GC/MS
As already discussed above, urine still remains the standard for comprehen-sive screening, especially in general unknown cases in clinical and forensictoxicology and doping control. Procedures are described not for single drugsbut for all, or at least several, drugs of a pharmacological or chemical class.For toxicological screening procedures in urine, the detectability of the parentcompound is of minor value if the concentrations of the metabolites aremuch higher in urine than those of the parent drug and if the metabolitescan be detected by the procedure. Most of the toxicologically relevant drugsare rather lipophilic substances that undergo extensive metabolism. As puresubstances of the metabolites are usually not available, it is necessary tocontrol the quality of the screening procedures using urine samples of vol-unteers or in-patients treated with a known dose of the drug. The procedureshould be sufficiently sensitive to detect therapeutic concentrations at leastover a 12 to 24 h period after ingestion. Papers on the detection time of drugsof abuse in urine have recently been reviewed.121 An interesting experimentalapproach for the validation of qualitative chromatographic methods and itsapplication in an antidoping control laboratory was recently described.122
© 2004 by CRC Press LLC
1522_C01.fm Page 13 Tuesday, December 2, 2003 10:05 AM
1.4.1.1 Screening Procedures for Detection of Particular Drug Classes of Basic or Neutral Drugs and/or Their Metabolites in Urine
1.4.1.1.1 Central Stimulants. Central stimulants are drugs of abuse aswell as doping agents. Immunoassays are available for amphetamine andsome of its derivatives as well as for cocaine metabolites. In the past, seriesof papers have described confirmation of amphetamines or cocaine aftersuitable isolation and derivatization and GC/MS.5,123 SPME is a more recentalternative for rapid, sensitive, and solvent-free determination of ampheta-mines in urine.80,124 However, such confirmation of positive immunoassayresults for amphetamines should not be limited to detection of amphetamineand methamphetamine by GC/MS in the selected-ion monitoring (SIM)mode unless the testing program forbids analysis of analytes not specificallyput into the testing program. Amphetamine and methamphetamine derivedmedicaments must be considered as part of a proper interpretation ofamphetamine-positive results. Detection of the hydroxy metabolites may helpextend the time of differentiation of illicit amphetamine abuse from intakeof medicaments.125–132 However, in the late phase of excretion after intake ofamphetamine-derived medicaments, amphetamine, or methamphetamineare often the only metabolites which can be detected in urine. In such urinesamples, differentiation of illicit amphetamine or methamphetamine intakefrom the intake of such medicaments may not be possible. In recent years,review articles have been published which discussed these problems.5,133,134
1.4.1.1.2 Designer Drugs (Rave Drugs). The amphetamine-deriveddesigner drugs MDA, MDMA, and MDE as well as BDB and MBDB havegained great popularity as “rave drugs.”135 They produce feelings of euphoriaand energy and a desire to socialize. Nichols coined the term entactogens forthis new group of drugs.136 Although the designer drugs had the reputationof being safe, several experimental studies in rats and humans and epidemi-ological studies indicated risks to humans. Recent papers and reviewsdescribe the current knowledge on hepatotoxicity137–141 and neurotoxicity,142
psychopathology and abuse potential of such designer drugs.135,142–156 Screen-ing procedures are needed because these drugs may lead to more or less severepoisonings138 and driving impairment.21,157 Commercial immunoassays areavailabe for urine (and blood) testing, but not all amphetamine IAs aresuitable for detection of its methylenedioxy derivatives.158–162 There is no IAavailable for testing the new piperazine-derived designer drugs which havebeen found on the illicit market as a new group of designer drugs.45,60,163–167
Shulgin mentioned BZP as a “pure stimulant” and TFMPP as an “activehallucinogen” in his book Pikhal.168 BZP is said to produce similar effects asdexamphetamine169 and to act as a central serotoninomimetic.170
© 2004 by CRC Press LLC
1522_C01.fm Page 14 Tuesday, December 2, 2003 10:05 AM
Again, GC/MS procedures were described for confirmation of amphet-amine-derived designer drugs after extraction and derivatization2,171–175 orSPME,80,176 as well as for screening for and differentiation of all thesedrugs.61,94,172 The latter procedure is part of a very comprehensive screeningprocedure (cf. 1.4.2.2) and the only one which also covers the new piperazine-derived designer drugs N-benzylpiperazine (BZP, “A2”),166 N-(3,4-methyl-enedioxybenzyl)piperazine (MDBP, MDBZP), 1-(3-trifluoromethylphe-nyl)piperazine (TFMPP), 1-(3-chlorophenyl)piperazine (mCPP), and 1-(4-methoxyphenyl)piperazine (MeOPP).60
Alpha-pyrrolidinophenone derivatives like R,S-alpha-pyrrolidinopro-piophenone (PPP), R,S-4¢-methyl-alpha-pyrrolidinopropiophenone(MPPP), R,S-4¢-methyl-alpha-pyrrolidinohexanophenone (MPHP),R,S-4¢-methoxy-alpha-pyrrolidinopropiophenone (MOPPP), and R,S-3¢,4¢-methylenedioxy-alpha-pyrrolidinopropiophenone (MDPPP) are newdesigner drugs which have appeared on the illicit drug market.177–181 Mean-while, most of these substances are scheduled in the German ControlledSubstances Act. So far, little information about the dosage as well as thepharmacological and toxicological effects of the pyrrolidinophenones isavailable. The chemical structures of all the alpha-pyrrolidinophenones areclosely related to alpha-aminopropiophenone anorectics like amfepramone,drugs of abuse like cathinone/methcathinone, and antidepressants likebupropion and might, therefore, evoke similar effects including dopamine-release and sympathomimetic properties.182–185 The metabolism and toxi-cological detection of such designer drugs were recently studied.178–181,186–188
Unfortunately, these drugs cannot be detected by common screening pro-cedures due to the zwitterionic structure of their metabolites. SPE showedgood results because mixed-mode SPE has proven to be suitable for theextraction even of their zwitterionic metabolites.181 Common trimethylsi-lylation leads to good GC properties.
1.4.1.1.3 Hallucinogens. Cannabis (marijuana) is the most frequentlyabused illegal drug around the world. Lysergide (LSD) and phencylidine aremore rarely abused, but the margin of “therapeutic” safety is smaller. Again,immunoassays are available for these hallucinogens and confirmation byGC/MS or LC/MS (especially for LSD189–191) has been common for manyyears1; only a few recent papers cover tetrahydrocannabinol (THC) urinetesting. For example, the need for coping with a big series of urine workplacetesting leads to the development of high-throughput methods.192 Anothernew aspect concerns the differentiation of therapeutic intake of syntheticTHC (dronabinol/marinol as antiemetic under cytostatic treatment) andcannabis abuse. 11-Nor-d9-tetrahydrocannabivarin-9-carboxylic acid, theurinary metabolite of the natural component of most cannabis products,
© 2004 by CRC Press LLC
1522_C01.fm Page 15 Tuesday, December 2, 2003 10:05 AM
d9-tetrahydrocannabivarin, was found to be a marker for marijuana or arelated product use.193
1.4.1.1.4 Opioid (Narcotic) and Other Potent Analgesics. Opioid anal-gesics, often called narcotics, are widely used to reduce severe pain, especiallyin a postoperative state and in the final state of cancer diseases. These arealso abused because of their euphoriant and anxiolytic effects. While opioidmedicaments are usually misused by medical staff, heroin is widely abusedby drug addicts. If heroin is not available the addicts often take opioidmedicaments. For legal reasons, the use of heroin must analytically be dif-ferentiated from an intake of other opioids. Therefore, 6-monoacetylmor-phine, the only heroin specific metabolite, must be detected in biosamples.Several papers have been published on the detection of 6-monoacetylmor-phine, employing SPE or LLE and derivatization by TFA, PFP, propionyla-tion, or by TMS.1
Screening procedures have been described for the detection of most ofthe opioids and other potent analgesics after acid or enzymatic hydrolysiswith LLE or SPE at pH 8 to 9, followed by TMS or AC.1,194–197 The latterprocedure is part of a very comprehensive screening procedure (cf. 1.4.2.2)and the only one which also covers most of the synthetic opioids. The anti-tussive pholcodine was found to cross-react with opiate immunoassays, butit lacks opioid potency. Pholcodine is partly hydrolyzed to morphine byhydrochloric acid, so careful enzymatic hydrolysis must be used if differen-tiation in urine is needed.198–200 In recent years, buprenorphine and oxyco-done testing became more and more of interest. Since a few years ago,buprenorphine has been used, besides methadone and levomethadol, forheroin substitution therapy as an effective means of decreasing illicit heroinuse, crime, HIV risk, and death, and in improving employment and socialadjustment.201 Urine testing can be performed by GC/MS,83,202,203 while bloodtesting requires LC/MS, especially for precise quantification.204–206
Oxycodone has very high abuse potential because it is highly effectivewhen taken orally, is often easily available, and has a high degree of consistentpotency. Opiate tests might be negative for oxycodone. Therefore, urinespecimens must be analyzed specifically for oxycodone, preferably by GC/MSafter enzymatic hydrolysis, LLE or SPE, and derivatization by AC, TMS, PFP,or HFB.1,194,207–210
Recently, an improved GC/MS method for the simultaneous identifica-tion and quantification of opiates in urine was reported.194 In this method,methoxyamine was used after enzymatic hydrolysis to form methoximederivatives of the keto-opiates, which were extracted using solid-phase col-umns and derivatized with propionic anhydride/pyridine. This method dem-onstrated acceptable precision, lack of cross-interference from other opioids,
© 2004 by CRC Press LLC
1522_C01.fm Page 16 Tuesday, December 2, 2003 10:05 AM
short analysis time of about 6.5 min, and a small sample volume of 2.0 mlurine. However, LC/MS is the preferred technique for quantification.211 It hasthe further advantage that the pharmacologically active morphine-6-glucu-ronide can also be monitored.
1.4.1.1.5 Nonopioid Analgesics. Nonopioid analgesics are widely used asover-the-counter drugs. Patients with chronic pain often misuse these drugswithout control by physicians. Although perceived to be safe drugs, they maylead to severe toxic effects in case of acute overdosage or in case of chronicabuse. They are also misused in doping of humans and horses. Therefore,they may be encountered in clinical and forensic toxicological analysis, aswell as in doping control. Analysis of such nonopioid analgesics was reviewedby Kraemer and Maurer.212 GC/MS was described to be suitable for screeningfor, and confirmation of, nonopioid analgesics.213,214 However, the moreacidic compounds like the NSAIDs, can be better detected in acidic screeningprocedures (cf. 1.4.1.2.8).
1.4.1.1.6 Anticonvulsants. Anticonvulsants are usually not abused, butthey relatively often lead to accidental, iatrogenic, or suicidal poisonings.They may impair the ability to drive a car or to work with machines. Forthese reasons a screening procedure for anticonvulsants is necessary. Immu-noassays are available for drug monitoring of particular drugs in plasma. Asthe class of anticonvulsants is chemically heterogeneous, there is no immu-noassay suitable for screening of the whole class of drugs.
Many papers have been published for quantification of anticonvulsantsby HPLC, LC/MS, or GC/MS,46,215–217 but there is still only one for screeningand identification in urine by GC/MS.218 Newer anticonvulsants like gaba-pentin, lamotrigine, oxcarbazepine, or valpromide can also be detected bythis procedure.32
1.4.1.1.7 Benzodiazepines. Benzodiazepines are used as tranquilizers,hypnotics, anticonvulsants, or muscle relaxants and belong to the most fre-quently prescribed drugs. They may impair the ability to drive a car or tooperate machines, and they may lead to addiction or severe poisonings,especially in combination with alcohol. Therefore, screening for benzodi-azepines is necessary in clinical, forensic, and occupational toxicology.39
Immunoassays are available for screening, but they need off- or on-linecleavage of conjugates to avoid a high percentage of false negatives. Also, forGC/MS confirmation or screening, cleavage of conjugates is mandatory.Both, enzymatic hydrolysis39 or acid hydrolysis, are used. The latter cleavesthe benzodiazepines to benzophenone derivatives or analogues,219–221 whichcan sensitively be detected by GC/MS after derivatization, e.g., by AC. How-
© 2004 by CRC Press LLC
1522_C01.fm Page 17 Tuesday, December 2, 2003 10:05 AM
ever, some benzodiazepines lead to common benzophenones, so that theinterpretation of the result may be difficult.32,219 An alternative to this workupis enzymatic hydrolysis, SPE and silylation.222 The sensitivity of GC/MS pro-cedures, e.g., for detection of low-dosed benzodiazepines, can be markedlyimproved by using the the NICI mode.20,24 This technique is very suitable forbenzodiazepine analysis in blood and alternative matrices20 if LC/MS is notavailable.24
1.4.1.1.8 Sedative–Hypnotics. Sedative–hypnotic drugs are one of thelargest groups of drugs, and they can be divided into barbiturates, benzodi-azepines (already separately discussed), zopiclone and zolpidem, diphenhy-dramine and others, including meprobamate, methaqualone, chloral hydrate,and clomethiazole. They are widely used for the treatment of insomnia,anxiety, and convulsive disorders, as well as for anesthetic and preanesthetictreatment. Because of their central nervous and respiratory depressant effects,they may cause, alone or in combination with other drugs and/or ethanol,severe poisoning for which treatment is necessary. Furthermore, they mayimpair driving ability and the fitness to work with machines, even aftertherapeutic doses. In particular, barbiturates and benzodiazepines may leadto drug dependence, and they are misused by heroin addicts to ease thewithdrawal symptoms from heroin or to augment the effects of “weak her-oin.” For all these reasons, sedative–hypnotics may be encountered in clinicalor forensic toxicological analysis.
Use of barbiturates has been markedly decreased in recent years. How-ever, some of them, like phenobarbital and its precursor primidone, are stillused as anticonvulsants for which drug monitoring is necessary. Thiopentalis widely used as a short-term intravenous anesthetic. Thiopental and itsmetabolite pentobarbital are often monitored prior to diagnosis of braindeath. A confirmation or screening and identification can be performed byGC/MS in the EI, full-scan, or SIM mode. Barbiturates have only weaklyacidic properties and can be detected in screening and confirmation proce-dures for basic and neutral drugs (e.g., after acid hydrolysis, LLE, and AC223),as well as in corresponding procedures for acidic drugs (e.g., after extractivemethylation68).
Zopiclone and zolpidem have been found to interact with the omega-1receptor subtype belonging to the GABAA receptor. They have rapid onsetof action and short elimination half-life. Unlike benzodiazepines, they haveweak myorelaxant and anticonvulsant effects. They are more and more pre-scribed as hypnotics instead of benzodiazepines. Diphenhydramine is clini-cally used as an antihistaminic, antiemetic, and sedative–hypnotic drug.Immunoassays for screening for zopiclon, zolpidem or diphenhydramine,meprobamate, methaqualone, and clomethiazole are not commercially
© 2004 by CRC Press LLC
1522_C01.fm Page 18 Tuesday, December 2, 2003 10:05 AM
available. Screening for and identification of these drugs can be performedby GC/MS (acid hydrolysis, LLE, and AC).58,223,224 Chloral hydrate, the hydrateof trichloroacetaldehyde, is still used as a sedative–hypnotic, especially inpediatrics. Trichloroethanol is the main pharmacologically active principleof chloral hydrate therapy, and should therefore be included in the analysis.The usual screening procedures do not cover chloral hydrate or trichloroeth-anol. Therefore, the Fujiwara reaction for halogenated hydrocarbons is rec-ommended as a qualitative test.225 However, only chloral hydrate itself leadsto the red reaction product, whereas the main metabolite, trichloroethanol,produces only a yellow color which cannot be differentiated from typicalurine color. Chloral hydrate and/or trichloroethanol can be determined inurine or plasma by simple GC/MS.226–228 Further procedures for seda-tive–hypnotics were reviewed by Kraemer and Maurer.229
1.4.1.1.9 Antidepressants. Tricyclic antidepressants (TCA), monamineoxidase inhibitors, and/or the newer selective serotonin reuptake inhibitors(SSRIs) are in use for the pharmacotherapy of depression. Among these, theSSRIs are less toxic since they do not show significant noradrenergic or anti-cholinergic properties. However, even if they are considered to be safe and welltolerated, they may multiply — by inhibition of cytochrome P450 metabolism— the pharmacological and toxic effects of other drugs like TCAs or anticon-vulsants.230,231 Therefore, they may be encountered in clinical and forensiccases. Methods for quantification have been reviewed.232–234 In addition,immunoassays are available, but due to different cross-reactivity and potency,the TCA taken must be identified before calculation of the plasma level. There-fore, a systematic toxicological screening must cover these drugs.58,59,235
1.4.1.1.10 Neuroleptics of the Phenothiazine and ButyrophenoneType. Neuroleptics (phenothiazines, butyrophenones, and atypics) havesuppressing effects on the consciousness and the respiration. Most exhibitanticholinergic effects in the autonomic nervous system. As overdosage maylead to severe poisonings, fast diagnosis is required. Immunoassays are notavailable, so screening must be performed directly by GC/MS.1,58,236 Onlyrisperidone cannot be detected by GC/MS; LC/MS is required.24 Screening,library-assisted identification, and validated quantification of fifteen neu-roleptics and three of their metabolites in plasma have recently beendescribed using LC/MS with atmospheric pressure chemical ionization.22
1.4.1.1.11 Antihistamines (Histamine H1-Receptor Blockers). B l o c k -ers of the histamine H1-receptor (antihistamines) are used as allergy reme-dies, nonprescription hypnotics, and in combination with other drugs suchas cold medicines. Antihistamines, often combined with other drugs or
© 2004 by CRC Press LLC
1522_C01.fm Page 19 Tuesday, December 2, 2003 10:05 AM
alcohol, reduce the ability to drive a car or to work with machines, and theyoften are the cause of poisonings. Therefore, screening for antihistamines isnecessary in clinical, forensic, and occupational toxicology. Identification of50 H1-blockers and their metabolites in urine has been described. This pro-cedure allows rapid and specific detection and differentiation of therapeuticconcentrations of alkanolamine-, alkylamine-, ethylenediamine-, pipera-zine-, and phenothiazine antihistamines (H1-blockers). They are integratedin a systematic GC/MS screening procedure.1,224,237–239 Simultaneous screen-ing and quantitation of 18 antihistamine drugs in blood has been describedusing liquid chromatography ionspray tandem MS.30
1.4.1.1.12 Antiparkinsonian Drugs. Antiparkinsonian drugs may lead tosevere poisonings because of their central depressive and anticholinergic prop-erties. Toxicological detection of these drugs has been described as part of asystematic screening and confirmation procedure.1,132,240 Selegiline is of specialinterest since it is metabolized to R(–)-methamphetamine and R(–)-amphet-amine, which interfere with immunoassays for amphetamines.5,132,133,241 Enan-tioselective procedures help with differentiation of selegiline andamphetamine/methamphetamine ingestion in urine132 and blood.44
1.4.1.1.13 Beta-Blockers (b-Adrenoceptor Blockers). b-Adrenoceptorblockers, conveniently named beta-blockers, are widely used, and thereforethey are frequently encountered in clinical and forensic analysis as well as indoping control.242 For both indications, GC/MS urine screening procedureshave been published using enzymatic or acidic hydrolysis, followed by variousderivatization procedures.1,243–249 Leloux et al.248 studied the effectiveness ofthree derivatization procedures: TFA of the amino group and TMS of thehydroxy group, twofold TFA, and n-butylboronylation to form a cyclic bor-onate. The combination of N-TFA with O-TMS proved to be the best pro-cedure. Detection of beta-blockers in human urine by GC/MS-MS has beendescribed and the implications have been discussed for doping control.250
1.4.1.1.14 Antiarrhythmics (Class I and IV). Antiarrhythmics may leadto severe cardiac and central nervous disorders if overdosed. As the symptomsof such overdosing are similiar to symptoms of poisonings with other drugsor to symptoms of internal or neurological diseases, a toxicological analysismay be of great importance for diagnosis. Before quantification in plasma,the drug must first be identified, preferably within a systematic screeningprocedure.1,244,251
1.4.1.1.15 Laxatives. Abuse of laxatives may lead to serious disorders likehypokalemia or chronic diarrhea. Toxicological screening should be
© 2004 by CRC Press LLC
1522_C01.fm Page 20 Tuesday, December 2, 2003 10:05 AM
performed before extensive diagnostic work is started.252 Laxative use iscommon among adolescents with anorexia nervosa, and the risk of associ-ated medical complications increases over time.253 GC/MS procedures havebeen described for this purpose.1,254,255 For the detection of the anthraqui-none glycosides, which cannot easily be analyzed by GC/MS, high-perform-ance thin-layer chromatographic (HPTLC) methods256,257 as well as HPLC-DAD methods have been developed.258
1.4.1.2 Screening Procedures for Detection of Particular Drug Classes of Acidic Drugs and/or Their Metabolites in Urine
Some classes of acidic drugs, or drugs which are metabolized to acidic com-pounds like the cardiovascular drugs ACE inhibitors and AT-II blockers,dihydropyridine calcium channel blockers, diuretics, coumarin anticoagu-lants, antidiabetics of the sulfonylurea type, barbiturates, or NSAIDs, arerelevant to clinical and forensic toxicology or doping. Therefore, these acidicdrugs should also be monitored, ideally in one procedure.
For STA of acidic drugs and/or their metabolites, gas chromatographicprocedures (GC with MS or other detectors), liquid chromatographic proce-dures (LC with DAD or other detectors), thin-layer chromatographic (TLCwith different detection modes) or capillary electrophoretic (CE) procedureshave been used.16 As in STA, a broad range of unknown compounds — evenin unknown combinations — must be screened, differentiated, and identified;the separation must be as powerful and universal as possible, and the detectionmodes must be of the highest specificity and universality. In most papers, theGC/MS coupling was applied.9,36,55,65–67,72,214,259–269 As acidic compounds are toopolar for sensitive GC separation, derivatization by alkylation or silylation isrequired. Extractive alkylation has proved to be a powerful procedure forsimultaneous extraction and derivatization of many acidic compounds.16,65–69,84
1.4.1.2.1 ACE Inhibitors and Angiotensin II AT1 Receptor Blockers.ACE inhibitors are widely used in the treatment of hypertension and con-gestive heart failure. AT1 blockers, a new drug class, are used for the sameindication. In case of poisoning, ACE inhibitors or AT1 blockers may lead tosevere cardiovascular disorders like hypotension and shock. For diagnosis orfor differential diagnostic exclusion of such poisoning, a screening procedureis necessary for the detection of these drugs in urine. ACE inhibitors have afree carboxylic acid group. A further carboxylic group is formed by hydrolysisof the ethyl esters during metabolism and/or sample preparation. The phar-macologically active dicarboxylic acids, the so-called “prilates,” are used forparenteral application. AT1 blockers have also acidic properties, resultingfrom a carboxylic acid function and/or from the tetrazole ring. Only one
© 2004 by CRC Press LLC
1522_C01.fm Page 21 Tuesday, December 2, 2003 10:05 AM
screening procedure for ACE inhibitors and AT-II blockers has been pub-lished that allows the detection of therapeutic concentrations of most of theACE inhibitors and for the AT1 blocker valsartan in human urine samplesafter extractive methylation.66 If necessary, the drugs can be quantified inplasma using GC/MS270–274 or GC/MS-NICI.24,270,275
1.4.1.2.2 Anticoagulants of the Hydroxycoumarin Type. A n t i co a g u -lants of the 4-hydroxycoumarin type are used as therapeutics or as rodenti-cides of the so-called first generation. Coumarins of the second generation,the so-called “superwarfarins,” are very potent rodenticides and thereforevery low-dosed. For the differential diagnosis of unclear coagulopathies,which may occur after ingestion of therapeutic or rodenticide coumarins,screening is needed. Several screening procedures published in recent yearsare described. The relatively polar coumarin derivatives can be sufficientlyseparated by reversed phase chromatography. DADs were applied for screen-ing of coumarin anticoagulants of the first generation and for indanedioneanticoagulants.36,276 As coumarins have fluorescent properties, fluorescencedetection was used with at least ten times better sensitivity.277–280 For deter-mination of “superwarfarins,” HPLC with fluorescence detection was neces-sary.280 GC/MS was used for the detection of the 4-hydroxycoumarinanticoagulants of the first generation and their metabolites in urine afterextractive methylation.65 Derivatization was essential for sensitive GC/MSdetection of these vinylogous carboxylic acids and their metabolites (ani-line/anilide derivatives or phenols). Only alcoholic hydroxy groups could notbe methylated due to their lower nucleophilicity, but this fact did not mark-edly influence the sensitivity. If necessary, the identified anticoagulants canbe quantified in plasma by HPLC 276,277 or TLC.281
1.4.1.2.3 Calcium Channel Blockers of the Dihydropyridine Type.Calcium channel blockers, formerly named calcium antagonists, cover threemain types: the phenylalkylamines (e.g., verapamil), the benzothiazepines(e.g., diltiazem), and the dihydropyridines (e.g., nifedipine). They are usedin the treatment of cardiac dysrhythmias, angina, and/or hypertension. Incase of overdose, they may lead to severe cardiovascular disorders like hypo-tension and shock, possibly resulting in life-threatening situations. For diag-nosis or, even more important, for differential diagnostic exclusion ofpoisoning, a screening procedure is necessary for the detection of these drugsin urine prior to quantification in plasma. The phenylalkylamines and thebenzothiazepines and their metabolites can be detected within the STA pro-cedure for basic and neutral compounds.1,251 The dihydropyridines areexcreted only in minor amounts as parent compounds.282–296 Most of theurinary metabolites are acidic compounds, so that they can be detected by
© 2004 by CRC Press LLC
1522_C01.fm Page 22 Tuesday, December 2, 2003 10:05 AM
screening procedures for acidic drugs and/or metabolites.67 If necessary,quantification in plasma can be performed using GC/MS,297–300 GC,291,301–304
HPLC,305–308 LC/MS-MS,309,310 or modifications of these procedures. Enanti-oselective determination has been reviewed by Tokuma and Noguchi.311
1.4.1.2.4 Diuretics. Diuretics are misused mainly to reduce body weight.The resulting hypokalemia may lead to severe cardiac disorders. Toxicologicalscreening for diuretics should be performed before extensive diagnostic workis started. Diuretics are also misused for doping purposes and therefore, theyhave been banned by the IOC. For both indications, screening is necessary.1,312
Besides recent LC/MS procedures,313–315 GC/MS procedures after (extractive)methylation are preferred,84,316–318 which simultaneously cover most of thediuretics with series of other drugs relevant in clinical and forensic toxicologyor doping.32,65–69,92,319
1.4.1.2.5 Antidiabetics of the Sulfonylurea Type. Antidiabetics of thesulfonylurea type have been used since the 1950s in the treatment of hyper-glycemia in diabetes mellitus. Besides this therapeutic use, sulfonylureas arealso misused. For differential diagnosis of unclear hypoglycemia, screeningis necessary to allow differentiation between a surreptitious misuse of sulfo-nylureas or pathophysiological causes like insulinoma. Before exploratorysurgery or even subtotal pancreatectomy, misuse of sulfonylurea drugs shouldanalytically be excluded. Several LC or CE procedures have been publishedfor screening, confirmation, and/or quantification.320–322 GC/MS after extrac-tive methylation allowed only detection of the sulfonamide part,32 so thatdifferentiaton was not possible. LC/MS is much better for screening andquantification of these drugs even in plasma.25
1.4.1.2.6 Barbiturates. As already mentioned in Section 1.4.1.1.8, barbi-turates have only weakly acidic properties; they can be detected in screeningand confirmation procedures for basic and neutral drugs1,223 as well as acidicdrugs.265 In order to improve the GC/MS sensitivity, derivatization byME,90,259,265 ethylation,260 or silylation9 is preferred. SPME was also applied.72
1.4.1.2.7 Designer Drug of the Pyrrolidinophenone Type. As alreadymentioned in Section 1.4.1.1.2, the new designer drugs alpha-pyrrolidi-nophenone derivatives like PPP, MPPP, MPHP, MOPPP, and MDPPP aremostly excreted as acidic metabolites.178–181 Common screening proceduresdid not cover such metabolites. Only mixed-mode SPE has proven to besuitable for the extraction even of these zwitterionic metabolites andshowed good extraction yields.181 Common trimethylsilylation leads to bestGC/MS sensitivity.
© 2004 by CRC Press LLC
1522_C01.fm Page 23 Tuesday, December 2, 2003 10:05 AM
1.4.1.2.8 Nonsteroidal Antiinflammatory Drugs (NSAIDs). Nonopiodanalgesics are among the most commonly consumed over-the-counter prep-arations all over the world. Besides acetylsalicylic acid, paracetamol, andpyrazole derivatives, so-called NSAIDs, are used against acute and chronicpain, inflammation, and fever. Altough NSAIDs are perceived to be safedrugs, they may lead to severe toxic effects in case of acute overdosage or incase of chronic abuse. They are also misused in doping of humans and horses.Therefore, they may be encountered in clinical and forensic toxicologicalanalysis, as well as in doping control. Analysis of such nonopioid analgesicshas been reviewed by Kraemer and Maurer.212
NSAIDs are classified in arylacetic acid derivatives like indomethacin ordiclofenac; arylpropionic acid derivatives like ibuprofen, naproxen, or keto-profen; or oxicames like piroxicam. All these drugs have acidic propertiesdue to (vinylogous) carboxyl groups. Many of the NSAIDs are chiral drugsbut most often marketed as racemates. It is known that the enantiomers havedifferent pharmacodynamic and pharmacokinetic properties. The anti-inflammatory activity of NSAIDs has been shown to be mainly evoked bythe S-enantiomers.323 However, this stereoselectivity of action is not manifestin vivo, due to the thus-far-unique unidirectional metabolic inversion of thechiral center from the inactive R(–)-isomers to the active S(+)-antipodes.324
Nevertheless, series of enantioselective determination procedures have beenpublished and reviewed by Davies325 and Bhushan and Joshi.326 SeveralGC/MS, LC, CE, or TLC procedures have been published in the last years forscreening, confirmation, and/or quantification. Derivatization of NSAIDsbefore GC is recommended to improve chromatographic properties and toavoid thermal decarboxylation in the injection port of the GC. Most often,ME after extraction is used,55,214,265,269 but extractive methylation has also beenapplied.69 Silylation as an alternative for ME was studied for 26 NSAIDs.267,268
The procedures of Laakkonen et al.265 and Gaillard36 allowed simultaneousdetection of other acidic drugs like barbiturates. Simultaneous determinationof 14 NSAIDs in plasma has been described using LC/MS.327
1.4.2 General Screening Procedures for Simultaneous Detection of Several Drug Classes in Urine by GC/MS
In so-called general unknown cases, comprehensive screening proceduresare needed which cover as many drugs or poisons as possible. Only a fewreally comprehensive procedures have been published, mainly for urinalysis.As already mentioned, analytical quality criteria of the parent compoundare of minor value if the concentrations of the metabolites are much higherin urine than those of the parent drug and if the metabolites are detectedby the procedure. The procedure should be sufficiently sensitive to detecttherapeutic concentrations at least over a 12 to 24 h period after ingestion.
© 2004 by CRC Press LLC
1522_C01.fm Page 24 Tuesday, December 2, 2003 10:05 AM
Papers on the detection time of drugs of abuse in urine have recently beenreviewed.121 Three typical STA procedures have been published for urinalysis:one for the detection of doping-relevant stimulants, beta-blockers, beta-agonists, and narcotics after enzymatic hydrolysis, SPE, and combined TMSand TFA derivatization;2 one for the detection of most of the basic andneutral drugs in urine after acid hydrolysis and LLE and AC,1,57,172 recentlymodified and improved for newer drugs of interest;58,61,62,126,139,166 and onefor acidic drugs, poisons, and/or their metabolites in urine after extractivemethylation.65–69
1.4.2.1 General Screening Procedure for Drug Classes Relevant in Doping after Enzymatic Hydrolysis, SPE, and Combined TMS and TFA Derivatization
A screening procedure was published for the detection of doping relevantstimulants, beta-blockers, beta-agonists, and narcotics after enzymatichydrolysis, SPE, and combined TMS and TFA derivatization.2 The time-consuming enzymatic cleavage of conjugates is acceptable for doping analysissince results do not have to be available as fast as in emergency toxicology.The authors did not focus their procedure on the detection of the metabolites,even if they could be detected in most cases for a longer time and moresensitively than their parent compounds. The chemical properties of theanalytes allowed use of SPE with acceptable recoveries. However, the largedifferences from batch to batch should be kept in mind.70 The combinedTMS and TFA derivatization provided very good GC properties, butunderivatized samples cannot be analyzed on the same GC/MS apparatuswithout changing the column.
This screening procedure, which is limited to some doping-relevantdrugs, is also based on full scan GC/MS and mass chromatography for doc-umentation of the absence of the corresponding drug. Such exclusion pro-cedure is suitable for doping analysis since the prevalence for positives is lowin contrast to clinical toxicology where the prevalence is high and wheremany more drugs must be detected or excluded.
1.4.2.2 General Screening for Most of the Basic and Neutral Drug Classes in Urine after Acid Hydrolysis, LLE, and AC
A screening method for detection of most of the basic and neutral drugs inurine after acid hydrolysis, LLE, and AC, has been developed, improved upon,and extended during the last few years. Cleavage of conjugates was necessarybefore extraction since part of the drugs and/or their metabolites wereexcreted into urine as conjugates. For studies on toxicological detection, rapidacid hydrolysis was performed to save time, which is relevant, e.g., in emer-
© 2004 by CRC Press LLC
1522_C01.fm Page 25 Tuesday, December 2, 2003 10:05 AM
gency toxicology. However, some compounds were destroyed or altered dur-ing acid hydrolysis.57,59,328 Therefore, the standard procedure63 had to bemodified. Before extraction, half of the native urine volume was added tothe hydrolyzed part. The extraction solvent used has proved to be very effi-cient in extracting compounds with very different chemical properties frombiomatrices, so that it has been used for a STA procedure for basic and neutralanalytes.32,91,92,172,319 AC has proved to be very suitable for robust derivatiza-tion in order to improve the GC properties and thereby the detection limitsof thousands of drugs and their metabolites.32 The use of microwave irradi-ation reduced the incubation time from 30 to 5 min59,329 so that derivatizationshould no longer be renounced due to time consumption.
This comprehensive full scan GC/MS screening procedure allows, withinone run, the simultaneous screening and confirmation of the following cat-egories of drugs: amphetamines,130–132 designer drugs,60,61,139,166,172,174 barbitu-rates and other sedative–hypnotics,223 benzodiazepines,219 opiates, opioidsand other potent analgesics,199,207 anticonvulsants,218 antidepressants,58,235
phenothiazine and butyrophenone neuroleptics,236,330 nonopioid analge-sics,213,214 antihistamines,224,237–239 antiparkinsonian drugs,240 beta-blockers,244
antiarrhythmics,251,331 diphenol laxatives,254 and, finally, herbal drugs likeatropine, scopolamine,32 lauroscholtzin, or protopine.62 In addition, series offurther compounds can be detected93 if they are present in the extract andtheir mass spectra are contained in the used reference libraries.92,94–96
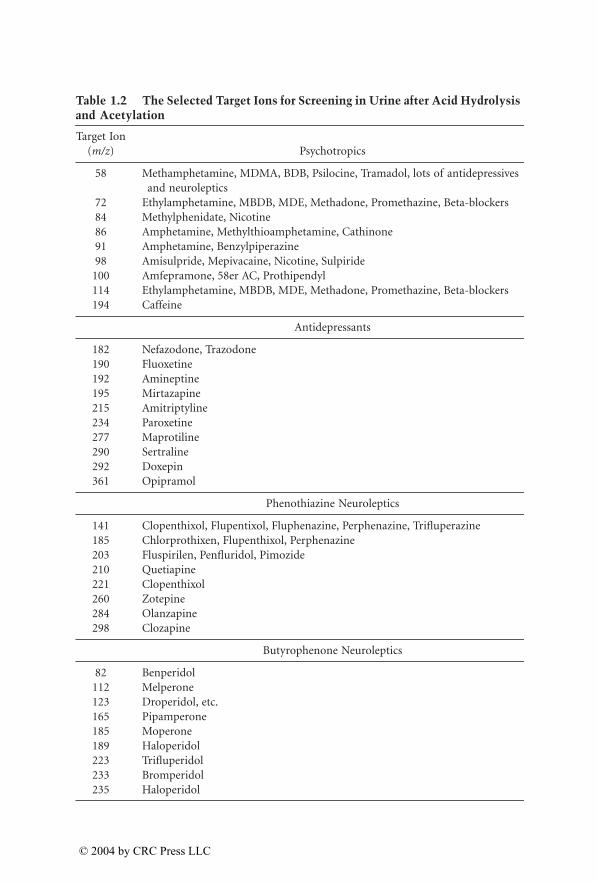
Eight to ten ions per category were individually selected from the massspectra of the corresponding drugs and their metabolites identified inauthentic urine samples. Table 1.2 summarizes these target ions, which havebeen updated and optimized. Generations of mass chromatograms can bestarted by clicking the corresponding pull-down menu which executes theuser-defined macros.91 The procedure is illustrated in Figure 1.7 to Figure1.16. In Figure 1.7, mass chromatograms are depicted corresponding to frag-ment ions typical for opioids, indicating the peaks 5 to 9. Figure 1.8 to Figure1.12 show the unknown mass spectra underlying peaks 5 to 9 (upper part,each), the reference spectra (middle part, each), and the structures and thehit lists found by library search in Reference 92 (lower part, each). As alreadydiscussed for the plasma screening, besides the opioids oxycodone and dihy-drocodeine, a compound not belonging to the monitored drug class is indi-cated and could be identified as the muscle relaxant carisoprodol. Figure 1.13shows mass chromatograms generated from the same data file, correspondingto fragment ions typical for nonopioid analgesics. Besides the already knowncompounds underlying the peaks 6, 7, and 9, peak 10 appears, which couldbe identified as acetaminophen (paracetamol [INN], Figure 1.14). Thisexample illustrates again that the selective mass chromatograms provide onlya more or less selective screening and only the comparison of the peak
© 2004 by CRC Press LLC
1522_C01.fm Page 26 Tuesday, December 2, 2003 10:05 AM
Table 1.2 The Selected Target Ions for Screening in Urine after Acid Hydrolysis and Acetylation
Target Ion(m/z) Psychotropics
58 Methamphetamine, MDMA, BDB, Psilocine, Tramadol, lots of antidepressives and neuroleptics
72 Ethylamphetamine, MBDB, MDE, Methadone, Promethazine, Beta-blockers 84 Methylphenidate, Nicotine 86 Amphetamine, Methylthioamphetamine, Cathinone 91 Amphetamine, Benzylpiperazine 98 Amisulpride, Mepivacaine, Nicotine, Sulpiride
100 Amfepramone, 58er AC, Prothipendyl 114 Ethylamphetamine, MBDB, MDE, Methadone, Promethazine, Beta-blockers194 Caffeine
Antidepressants
182 Nefazodone, Trazodone 190 Fluoxetine 192 Amineptine 195 Mirtazapine 215 Amitriptyline 234 Paroxetine277 Maprotiline290 Sertraline292 Doxepin 361 Opipramol
Phenothiazine Neuroleptics
141 Clopenthixol, Flupentixol, Fluphenazine, Perphenazine, Trifluperazine 185 Chlorprothixen, Flupenthixol, Perphenazine 203 Fluspirilen, Penfluridol, Pimozide 210 Quetiapine 221 Clopenthixol 260 Zotepine284 Olanzapine 298 Clozapine
Butyrophenone Neuroleptics
82 Benperidol 112 Melperone 123 Droperidol, etc.165 Pipamperone 185 Moperone189 Haloperidol 223 Trifluperidol 233 Bromperidol 235 Haloperidol
© 2004 by CRC Press LLC
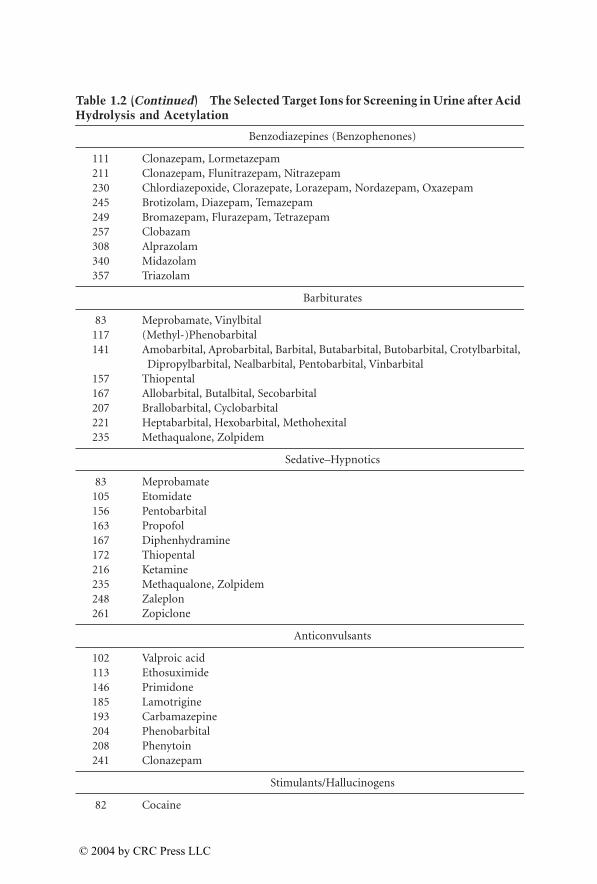
1522_C01.fm Page 27 Tuesday, December 2, 2003 10:05 AM
Benzodiazepines (Benzophenones)
111 Clonazepam, Lormetazepam 211 Clonazepam, Flunitrazepam, Nitrazepam 230 Chlordiazepoxide, Clorazepate, Lorazepam, Nordazepam, Oxazepam 245 Brotizolam, Diazepam, Temazepam 249 Bromazepam, Flurazepam, Tetrazepam 257 Clobazam 308 Alprazolam 340 Midazolam 357 Triazolam
Barbiturates
83 Meprobamate, Vinylbital 117 (Methyl-)Phenobarbital 141 Amobarbital, Aprobarbital, Barbital, Butabarbital, Butobarbital, Crotylbarbital,
Dipropylbarbital, Nealbarbital, Pentobarbital, Vinbarbital157 Thiopental 167 Allobarbital, Butalbital, Secobarbital 207 Brallobarbital, Cyclobarbital 221 Heptabarbital, Hexobarbital, Methohexital 235 Methaqualone, Zolpidem
Sedative–Hypnotics
83 Meprobamate105 Etomidate156 Pentobarbital 163 Propofol 167 Diphenhydramine 172 Thiopental 216 Ketamine235 Methaqualone, Zolpidem 248 Zaleplon261 Zopiclone
Anticonvulsants
102 Valproic acid 113 Ethosuximide146 Primidone 185 Lamotrigine193 Carbamazepine 204 Phenobarbital 208 Phenytoin 241 Clonazepam
Stimulants/Hallucinogens
82 Cocaine
Table 1.2 (Continued) The Selected Target Ions for Screening in Urine after Acid Hydrolysis and Acetylation
© 2004 by CRC Press LLC
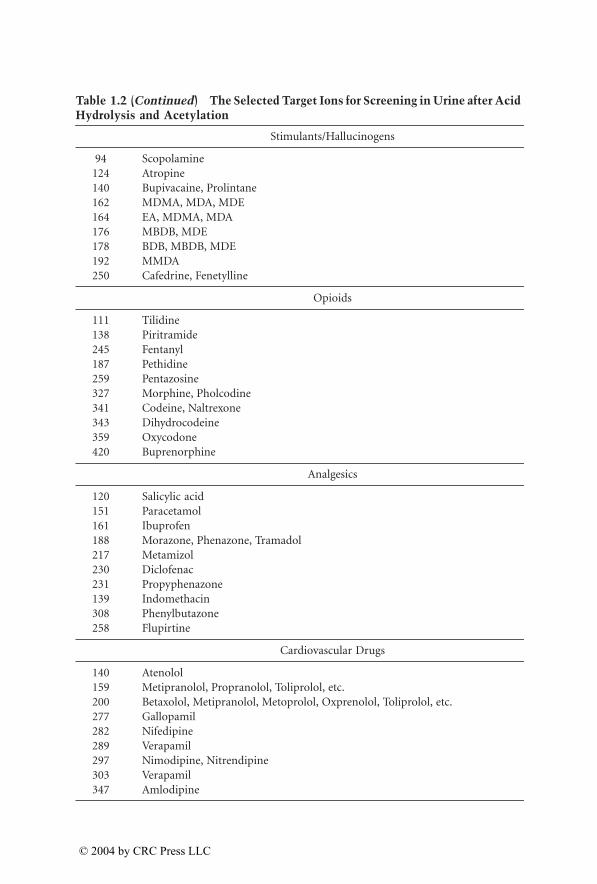
1522_C01.fm Page 28 Tuesday, December 2, 2003 10:05 AM
Stimulants/Hallucinogens
94 Scopolamine 124 Atropine140 Bupivacaine, Prolintane162 MDMA, MDA, MDE 164 EA, MDMA, MDA 176 MBDB, MDE 178 BDB, MBDB, MDE 192 MMDA 250 Cafedrine, Fenetylline
Opioids
111 Tilidine 138 Piritramide 245 Fentanyl 187 Pethidine 259 Pentazosine 327 Morphine, Pholcodine 341 Codeine, Naltrexone 343 Dihydrocodeine 359 Oxycodone 420 Buprenorphine
Analgesics
120 Salicylic acid 151 Paracetamol 161 Ibuprofen 188 Morazone, Phenazone, Tramadol 217 Metamizol 230 Diclofenac231 Propyphenazone 139 Indomethacin308 Phenylbutazone 258 Flupirtine
Cardiovascular Drugs
140 Atenolol 159 Metipranolol, Propranolol, Toliprolol, etc.200 Betaxolol, Metipranolol, Metoprolol, Oxprenolol, Toliprolol, etc.277 Gallopamil 282 Nifedipine 289 Verapamil 297 Nimodipine, Nitrendipine 303 Verapamil 347 Amlodipine
Table 1.2 (Continued) The Selected Target Ions for Screening in Urine after Acid Hydrolysis and Acetylation
© 2004 by CRC Press LLC
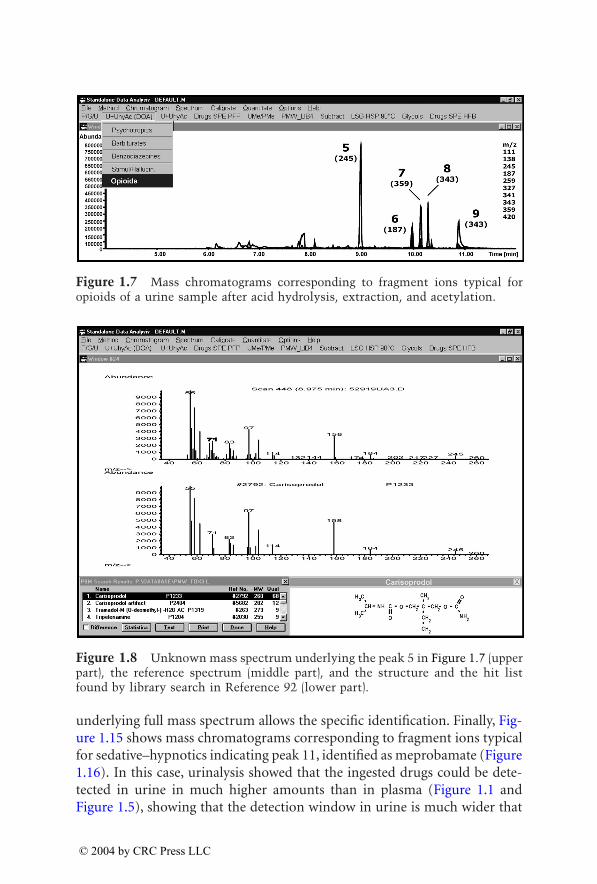
1522_C01.fm Page 29 Tuesday, December 2, 2003 10:05 AM
underlying full mass spectrum allows the specific identification. Finally, Fig-ure 1.15 shows mass chromatograms corresponding to fragment ions typicalfor sedative–hypnotics indicating peak 11, identified as meprobamate (Figure1.16). In this case, urinalysis showed that the ingested drugs could be dete-tected in urine in much higher amounts than in plasma (Figure 1.1 andFigure 1.5), showing that the detection window in urine is much wider that
Figure 1.7 Mass chromatograms corresponding to fragment ions typical foropioids of a urine sample after acid hydrolysis, extraction, and acetylation.
Figure 1.8 Unknown mass spectrum underlying the peak 5 in Figure 1.7 (upperpart), the reference spectrum (middle part), and the structure and the hit listfound by library search in Reference 92 (lower part).
© 2004 by CRC Press LLC
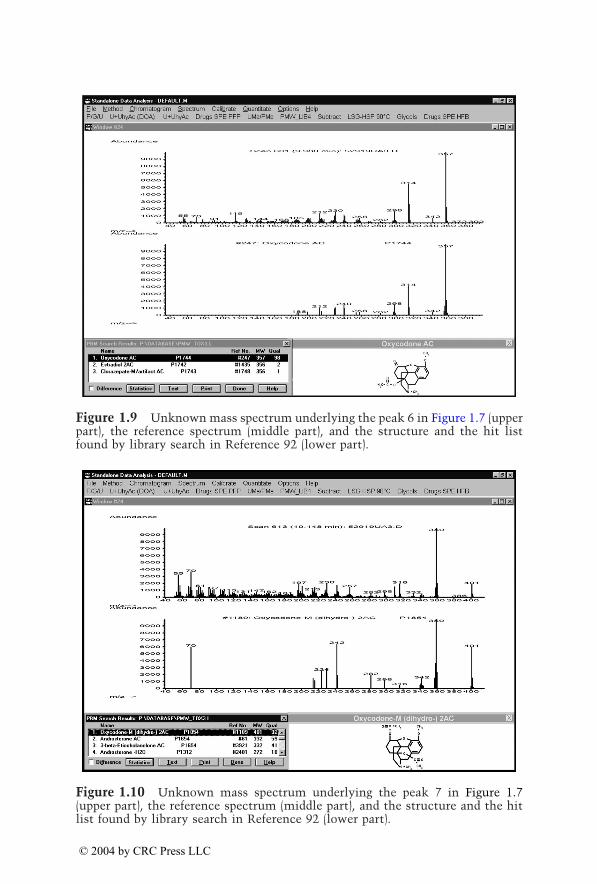
1522_C01.fm Page 30 Tuesday, December 2, 2003 10:05 AM
Figure 1.9 Unknown mass spectrum underlying the peak 6 in Figure 1.7 (upperpart), the reference spectrum (middle part), and the structure and the hit listfound by library search in Reference 92 (lower part).
Figure 1.10 Unknown mass spectrum underlying the peak 7 in Figure 1.7(upper part), the reference spectrum (middle part), and the structure and the hitlist found by library search in Reference 92 (lower part).
© 2004 by CRC Press LLC
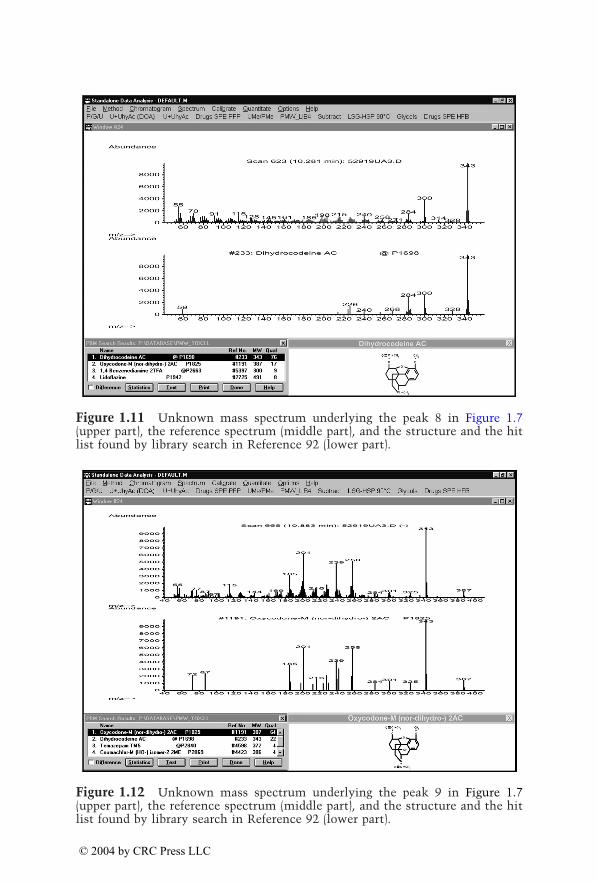
1522_C01.fm Page 31 Tuesday, December 2, 2003 10:05 AM
Figure 1.11 Unknown mass spectrum underlying the peak 8 in Figure 1.7(upper part), the reference spectrum (middle part), and the structure and the hitlist found by library search in Reference 92 (lower part).
Figure 1.12 Unknown mass spectrum underlying the peak 9 in Figure 1.7(upper part), the reference spectrum (middle part), and the structure and the hitlist found by library search in Reference 92 (lower part).
© 2004 by CRC Press LLC
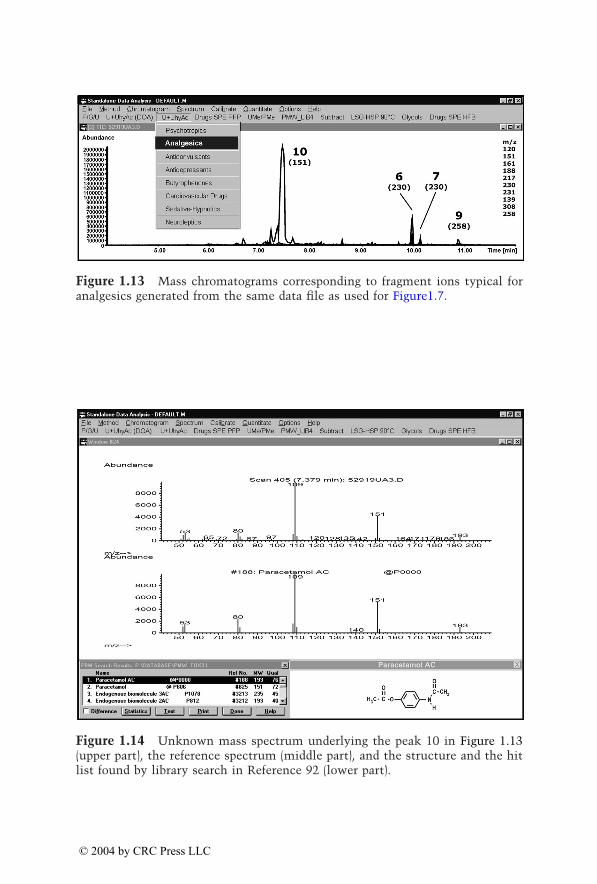
1522_C01.fm Page 32 Tuesday, December 2, 2003 10:05 AM
Figure 1.13 Mass chromatograms corresponding to fragment ions typical foranalgesics generated from the same data file as used for Figure1.7.
Figure 1.14 Unknown mass spectrum underlying the peak 10 in Figure 1.13(upper part), the reference spectrum (middle part), and the structure and the hitlist found by library search in Reference 92 (lower part).
© 2004 by CRC Press LLC
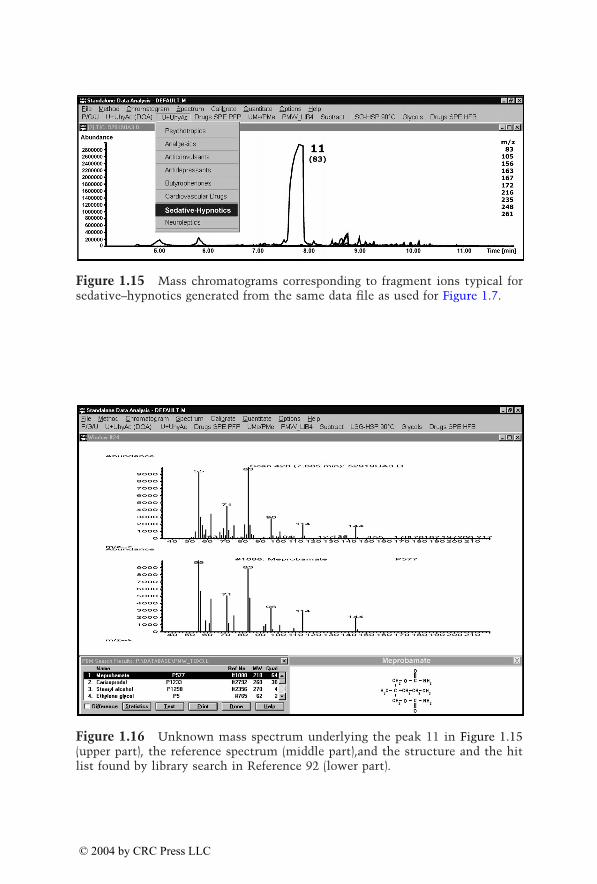
1522_C01.fm Page 33 Tuesday, December 2, 2003 10:05 AM
Figure 1.15 Mass chromatograms corresponding to fragment ions typical forsedative–hypnotics generated from the same data file as used for Figure 1.7.
Figure 1.16 Unknown mass spectrum underlying the peak 11 in Figure 1.15(upper part), the reference spectrum (middle part),and the structure and the hitlist found by library search in Reference 92 (lower part).
© 2004 by CRC Press LLC
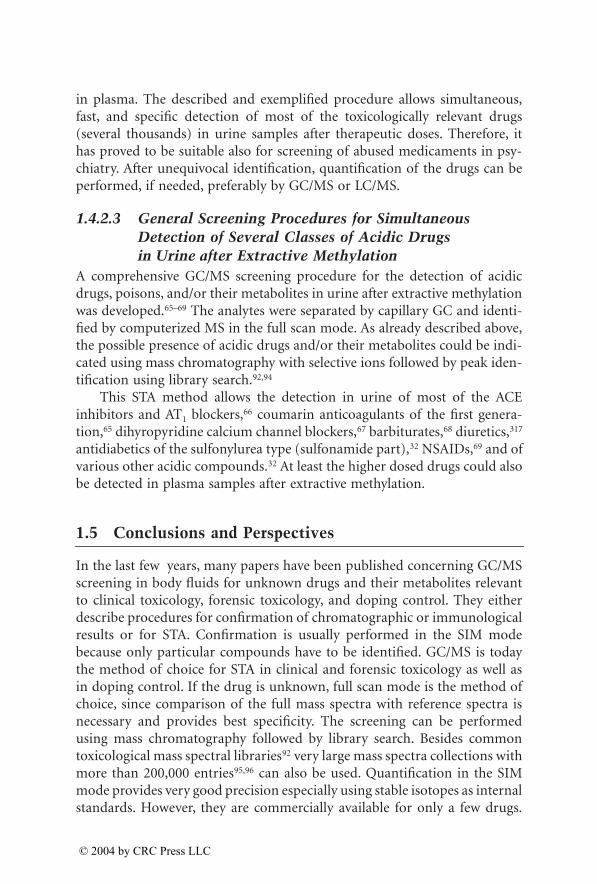
1522_C01.fm Page 34 Tuesday, December 2, 2003 10:05 AM
in plasma. The described and exemplified procedure allows simultaneous,fast, and specific detection of most of the toxicologically relevant drugs(several thousands) in urine samples after therapeutic doses. Therefore, ithas proved to be suitable also for screening of abused medicaments in psy-chiatry. After unequivocal identification, quantification of the drugs can beperformed, if needed, preferably by GC/MS or LC/MS.
1.4.2.3 General Screening Procedures for Simultaneous Detection of Several Classes of Acidic Drugs in Urine after Extractive Methylation
A comprehensive GC/MS screening procedure for the detection of acidicdrugs, poisons, and/or their metabolites in urine after extractive methylationwas developed.65–69 The analytes were separated by capillary GC and identi-fied by computerized MS in the full scan mode. As already described above,the possible presence of acidic drugs and/or their metabolites could be indi-cated using mass chromatography with selective ions followed by peak iden-tification using library search.92,94
This STA method allows the detection in urine of most of the ACEinhibitors and AT1 blockers,66 coumarin anticoagulants of the first genera-tion,65 dihyropyridine calcium channel blockers,67 barbiturates,68 diuretics,317
antidiabetics of the sulfonylurea type (sulfonamide part),32 NSAIDs,69 and ofvarious other acidic compounds.32 At least the higher dosed drugs could alsobe detected in plasma samples after extractive methylation.
1.5 Conclusions and Perspectives
In the last few years, many papers have been published concerning GC/MSscreening in body fluids for unknown drugs and their metabolites relevantto clinical toxicology, forensic toxicology, and doping control. They eitherdescribe procedures for confirmation of chromatographic or immunologicalresults or for STA. Confirmation is usually performed in the SIM modebecause only particular compounds have to be identified. GC/MS is todaythe method of choice for STA in clinical and forensic toxicology as well asin doping control. If the drug is unknown, full scan mode is the method ofchoice, since comparison of the full mass spectra with reference spectra isnecessary and provides best specificity. The screening can be performedusing mass chromatography followed by library search. Besides commontoxicological mass spectral libraries92 very large mass spectra collections withmore than 200,000 entries95,96 can also be used. Quantification in the SIMmode provides very good precision especially using stable isotopes as internalstandards. However, they are commercially available for only a few drugs.
© 2004 by CRC Press LLC
1522_C01.fm Page 35 Tuesday, December 2, 2003 10:05 AM
Such quantification procedures must be fully validated according to inter-national guidelines.47
Finally, LC/MS has shown to be an ideal supplement, especially for morepolar, unstable, or low-dosed drugs.
Acknowledgments
The author would like to thank his coworkers Thomas Kraemer, CarstenKratzsch, Frank T. Peters, Dietmar Springer, Roland F. Staack, and Armin A.Weber for their support.
References
1. Maurer, H.H., Systematic toxicological analysis of drugs and their metabolitesby gas chromatography-mass spectrometry [review], J. Chromatogr., 580, 3,1992.
2. Solans, A., Carnicero, M., de-la-Torre, R., and Segura, J., Comprehensivescreening procedure for detection of stimulants, narcotics, adrenergic drugs,and their metabolites in human urine, J. Anal. Toxicol., 19, 104, 1995.
3. Simpson, D., Braithwaite, R.A., Jarvie, D.R., Stewart, M.J., Walker, S., Watson,I.W., and Widdop, B., Screening for drugs of abuse (II): Cannabinoids, lyser-gic acid diethylamide, buprenorphine, methadone, barbiturates, benzodiaz-epines and other drugs, Ann. Clin. Biochem., 34 (Pt 5), 460, 1997.
4. Lehrer, M., The role of gas chromatography/mass spectrometry. Instrumentaltechniques in forensic urine drug testing. Looking all around: honeybees usedifferent cues in different eye regions, Clin. Lab. Med., 18, 631, 1998.
5. Kraemer, T. and Maurer, H.H., Determination of amphetamine, metham-phetamine and amphetamine-derived designer drugs or medicaments inblood and urine [review], J. Chromatogr. B, 713, 163, 1998.
6. Moeller, M.R., Steinmeyer, S., and Kraemer, T., Determination of drugs ofabuse in blood [review], J. Chromatogr. B, 713, 91, 1998.
7. Kidwell, D.A., Holland, J.C., and Athanaselis, S., Testing for drugs of abusein saliva and sweat [review], J. Chromatogr. B, 713, 111, 1998.
8. Sachs, H. and Kintz, P., Testing for drugs in hair. Critical review of chromato-graphic procedures since 1992 [review], J. Chromatogr. B, 713, 147, 1998.
9. Polettini, A., Groppi, A., Vignali, C., and Montagna, M., Fully-automatedsystematic toxicological analysis of drugs, poisons, and metabolites in wholeblood, urine, and plasma by gas chromatography-full scan mass spectrome-try, J. Chromatogr. B, 713, 265, 1998.
10. Kintz, P. and Samyn, N., Determination of “Ecstasy” components in alterna-tive biological specimens [review], J. Chromatogr. B, 733, 137, 1999.
© 2004 by CRC Press LLC
1522_C01.fm Page 36 Tuesday, December 2, 2003 10:05 AM
11. Polettini, A., Systematic toxicological analysis of drugs and poisons in bio-samples by hyphenated chromatographic and spectroscopic techniques[review], J. Chromatogr. B, 733, 47, 1999.
12. Huestis, M., Oyler, J.M., Cone, E., Wstadik, A.T., Schoendorfer, D., andJoseph, R.E., Sweat testing for cocaine, codeine and metabolites by gas chro-matography-mass spectrometry [review], J. Chromatogr. B, 733, 247, 1999.
13. Gaillard, Y. and Pepin, G., Testing hair for pharmaceuticals [review], J. Chro-matogr. B, 733, 231, 1999.
14. Staub, C., Chromatographic procedures for determination of cannabinoids inbiological samples, with special attention to blood and alternative matrices likehair, saliva, sweat and meconium [review], J. Chromatogr. B, 733, 119, 1999.
15. Nakahara, Y., Hair analysis for abused and therapeutic drugs [review],J. Chromatogr. B, 733, 161, 1999.
16. Maurer, H.H., Systematic toxicological analysis procedures for acidic drugsand/or metabolites relevant to clinical and forensic toxicology or dopingcontrol [review], J. Chromatogr. B, 733, 3, 1999.
17. Maurer, H.H., Screening procedures for simultaneous detection of severaldrug classes used in the high throughput toxicological analysis and dopingcontrol [review], Comb. Chem. High Throughput Screen., 3, 461, 2000.
18. Maurer, H.H., Applications of GC-MS in Clinical and Forensic Toxicologyand Doping Control, in Current Practice of GC-MS, Niessen, W.M.A., Ed.,Marcel Dekker, New York, 2001, 355.
19. Kintz, P. and Samyn, N., Use of alternative specimens drugs of abuse in salivaand doping agents in hair [review], Ther. Drug Monit., 24, 239, 2002.
20. Maurer, H.H., The role of gas chromatography-mass spectrometry with neg-ative ion chemical ionization (GC-MS-NCI) in clinical and forensic toxicology,doping control and biomonitoring [review], Ther. Drug Monit., 24, 247, 2002.
21. Moeller, M.R. and Kraemer, T., Drugs of abuse monitoring in blood forcontrol of driving under the influence of drugs [review], Ther. Drug Monit.,24, 210, 2002.
22. Kratzsch, C., Weber, A.A., Peters, F.T., Kraemer, T., and Maurer, H.H., Screen-ing, library-assisted identification and validated quantification of fifteen neu-roleptics and three of their metabolites in plasma by l iquidchromatography/mass spectrometry with atmospheric pressure chemicalionization, J. Mass Spectrom., 38, 283, 2003.
23. Maurer, H.H., Kraemer, T., Kratzsch, C., Paul, L.D., Peters, F.T., Springer, D.,Staack, R.F., and Weber, A.A., Systematic toxicological analysis by GC-MSand LC-MS, in Proceedings of the Symposium Toxicological Analysis and Cer-tainty of Results, Leipzig, October 1 and 2, 2001, Kleemann, W.J. and Teske,J., Eds., Schmidt-Roemhild Verlag, Leipzig, 2002.
© 2004 by CRC Press LLC
1522_C01.fm Page 37 Tuesday, December 2, 2003 10:05 AM
24. Maurer, H.H., Kraemer, T., Kratzsch, C., Peters, F.T., and Weber, A.A., Neg-ative ion chemical ionization gas chromatography-mass spectrometry (NICI-GC-MS) and atmospheric pressure chemical ionization liquid chromatogra-phy-mass spectrometry (APCI-LC-MS) of low-dosed and/or polar drugs inplasma, Ther. Drug Monit., 24, 117, 2002.
25. Maurer, H.H., Kratzsch, C., Kraemer, T., Peters, F.T., and Weber, A.A., Screen-ing, library-assisted identification and validated quantification of oral antidi-abetics of the sulfonylurea-type in plasma by atmospheric pressure chemicalionization liquid chromatography-mass spectrometry (APCI-LC-MS),J. Chromatogr. B, 773, 63, 2002.
26. Saint-Marcoux, F., Lachatre, G., and Marquet, P., Evaluation of an improvedgeneral unknown screening procedure using liquid chromatography-electro-spray-mass spectrometry by comparison with gas chromatography and high-performance liquid-chromatography — diode array detection, J. Am. Soc.Mass Spectrom., 14, 14, 2003.
27. Marquet, P., Is LC-MS suitable for a comprehensive screening of drugs andpoisons in clinical toxicology?, Ther. Drug Monit., 24, 125, 2002.
28. Marquet, P., Progress of LC-MS in clinical and forensic toxicology [review],Ther. Drug Monit., 24, 255, 2002.
29. Rittner, M., Pragst, F., Bork, W.R., and Neumann, J., Screening method forseventy psychoactive drugs or drug metabolites in serum based on high-performance liquid chromatography-electrospray ionization mass spectrom-etry, J. Anal. Toxicol., 25, 115, 2001.
30. Gergov, M., Robson, J.N., Ojanpera, I., Heinonen, O.P., and Vuori, E., Simul-taneous screening and quantitation of 18 antihistamine drugs in blood byliquid chromatography ionspray tandem mass spectrometry, Forensic Sci. Int.,121, 108, 2001.
31. Bogusz, M.J., LC/MS in forensic toxicology, in Advances in Forensic Applicationsof Mass Spectrometry, Yinon, J., Ed., Chapter 2, this volume.
32. Pfleger, K., Maurer, H.H., and Weber, A., Mass Spectral and GC Data of Drugs,Poisons, Pesticides, Pollutants and their Metabolites, part 4, Wiley-VCH, Wein-heim, 2000.
33. Drummer, O.H., Kotsos, A., and McIntyre, I.M., A class-independent drugscreen in forensic toxicology using a photodiode array detector, J. Anal.Toxicol., 17, 225, 1993.
34. Balikova, M., Application of HPLC with photodiode array detection for sys-tematic toxicological analyses of drug groups, Sb. Lek., 95, 339, 1994.
35. Bogusz, M., Hyphenated liquid chromatographic techniques in forensic tox-icology [review], J. Chromatogr. B, 733, 65, 1999.
© 2004 by CRC Press LLC
1522_C01.fm Page 38 Tuesday, December 2, 2003 10:05 AM
36. Gaillard, Y. and Pepin, G., Screening and identification of drugs in human hairby high-performance liquid chromatography-photodiode-array UV detectionand gas chromatography-mass spectrometry after solid-phase extraction. Apowerful tool in forensic medicine, J. Chromatogr. A, 762, 251, 1997.
37. Gaillard, Y. and Pepin, G., Use of high-performance liquid chromatographywith photodiode-array UV detection for the creation of a 600-compoundlibrary. Application to forensic toxicology, J. Chromatogr. A, 763, 149, 1997.
38. Elliott, S.P. and Hale, K.A., Applications of an HPLC-DAD drug-screeningsystem based on retention indices and UV spectra, J. Anal. Toxicol., 22, 279,1998.
39. Drummer, O.H., Methods for the measurement of benzodiazepines in bio-logical samples [review], J. Chromatogr. B, 713, 201, 1998.
40. Valli, A., Polettini, A., Papa, P., and Montagna, M., Comprehensive drugscreening by integrated use of gas chromatography/mass spectrometry andRemedi HS, Ther. Drug Monit., 23, 287, 2001.
41. Maurer, H.H., Liquid chromatography-mass spectrometry in forensic andclinical toxicology [review], J. Chromatogr. B, 713, 3, 1998.
42. Van Bocxlaer, J.F., Clauwaert, K.M., Lambert, W.E., Deforce, D.L., Van denEeckhout, E.G., and de-Leenheer, A.P., Liquid chromatography-mass spec-trometry in forensic toxicology [review], Mass Spectrom. Rev., 19, 165, 2000.
43. Bogusz, M.J., Liquid chromatography-mass spectrometry as a routinemethod in forensic sciences: a proof of maturity, J. Chromatogr. B Biomed.Sci. Appl., 748, 3, 2000.
44. Peters, F.T., Kraemer, T., and Maurer, H.H., Drug testing in blood: vali-dated negative-ion chemical ionization gas chromatographic-mass spec-trometric assay for determination of amphetamine and methamphetamineenantiomers and its application to toxicology cases, Clin. Chem., 48, 1472,2002.
45. Peters, F.T., Schaefer, S., Staack, R.F., Kraemer, T., and Maurer, H.H.,Screening for and validated quantification of amphetamines as well as ofamphetamine- and piperazine-derived designer drugs in human bloodplasma by gas chromatography/mass spectrometry, J. Mass Spectrom., 38,659, 2003.
46. Maurer, H.H., Kratzsch, C., Weber, A.A., Peters, F.T., and Kraemer, T., Vali-dated assay for quantification of oxcarbazepine and its active dihydro metab-olite 10-hydroxy carbazepine in plasma by atmospheric pressure chemicalionization liquid chromatography/mass spectrometry, J. Mass Spectrom., 37,687, 2002.
47. Peters, F.T. and Maurer, H.H., Bioanalytical method validation and its impli-cations for forensic and clinical toxicology — A review [review], Accred. Qual.Assur., 7, 441, 2002.
© 2004 by CRC Press LLC

1522_C01.fm Page 39 Tuesday, December 2, 2003 10:05 AM
48. Polettini, A., A simple automated procedure for the detection and identifica-tion of peaks in gas chromatography — continuous scan mass spectrometry.Application to systematic toxicological analysis of drugs in whole humanblood, J. Anal. Toxicol., 20, 579, 1996.
49. Pfleger, K., Maurer, H.H., and Weber, A., Mass Spectral and GC Data of Drugs,Poisons, Pesticides, Pollutants and their Metabolites, VCH, Weinheim, Ger-many, 1992.
50. Takeda, A., Tanaka, H., Shinohara, T., and Ohtake, I., Systematic analysis ofacid, neutral and basic drugs in horse plasma by combination of solid-phaseextraction, non-aqueous partitioning and gas chromatography-mass spec-trometry, J. Chromatogr. B Biomed. Sci. Appl., 758, 235, 2001.
51. Drummer, O.H. and Gerostamoulos, J., Postmortem drug analysis: analyticaland toxicological aspects, Ther. Drug Monit., 24, 199, 2002.
52. Villain, M., Cirimele, V., and Kintz, P., Substance abuse in sports: detectionof doping agents in hair by mass spectrometry, in Advances in Forensic Appli-cations of Mass Spectrometry, Yinon, J., Ed., Chapter 3, this volume.
53. Moore, C., Negrusz, A., and Lewis, D., Determination of drugs of abuse inmeconium [review], J. Chromatogr. B, 713, 137, 1998.
54. Engelhart, D.A., Lavins, E.S., and Sutheimer, C.A., Detection of drugs of abusein nails, J. Anal. Toxicol., 22, 314, 1998.
55. Gonzalez, G., Ventura, R., Smith, A.K., de-la-Torre, R., and Segura, J., Detec-tion of non-steroidal anti-inflammatory drugs in equine plasma and urineby gas chromatography-mass spectrometry, J. Chromatogr. A, 719, 251, 1996.
56. Spahn, L.H. and Benet, L.Z., Acyl glucuronides revisited: is the glucuronida-tion process a toxification as well as a detoxification mechanism?, Drug Metab.Rev., 24, 5, 1992.
57. Maurer, H.H., Methods for GC-MS, in Mass Spectral and GC Data of Drugs,Poisons, Pesticides, Pollutants and their Metabolites, Part 4, Pfleger, K., Maurer,H.H., and Weber, A., Eds., Wiley-VCH, Weinheim, Germany, 2000, 3.
58. Bickeboeller-Friedrich, J. and Maurer, H.H., Screening for detection of newantidepressants, neuroleptics, hypnotics, and their metabolites in urine by GC-MS developed using rat liver microsomes, Ther. Drug Monit., 23, 61, 2001.
59. Maurer, H.H. and Bickeboeller-Friedrich, J., Screening procedure for detec-tion of antidepressants of the selective serotonin reuptake inhibitor type andtheir metabolites in urine as part of a modified systematic toxicological anal-ysis procedure using gas chromatography-mass spectrometry, J. Anal. Toxicol.,24, 340, 2000.
60. Staack, R.F., Fritschi, G., and Maurer, H.H., Studies on the metabolism andthe toxicological analysis of the new piperazine-like designer drug N-ben-zylpiperazine (BZP, A2) using gas chromatography-mass spectrometry (GC-MS), J. Chromatogr. B, 773, 35, 2002.
© 2004 by CRC Press LLC
1522_C01.fm Page 40 Tuesday, December 2, 2003 10:05 AM
61. Staack, R.F., Fehn, J., and Maurer, H.H., New designer drug para-meth-oxymethamphetamine (PMMA): studies on its metabolism and toxicologicaldetection in urine using gas chromatography-mass spectrometry, J. Chro-matogr. B, 789, 27, 2003.
62. Paul, L.D. and Maurer, H.H., Studies on the metabolism and toxicologicaldetection of the Eschscholtzia californica alkaloids californine and protopinein urine using gas chromatography-mass spectrometry, J. Chromatogr. B, 789,43, 2003.
63. Maurer, H.H., Methods for GC-MS, in Mass Spectral and GC Data of Drugs,Poisons, Pesticides, Pollutants and their Metabolites, Pfleger, K., Maurer, H.H.,and Weber, A., Eds., VCH, Weinheim, Germany, 1992, 3.
64. Toennes, S.W. and Maurer, H.H., Efficient cleavage of urinary conjugates ofdrugs or poisons in analytical toxicology using purified and immobilized b-glucuronidase and arylsulfatase packed in columns, Clin. Chem., 45, 2173,1999.
65. Maurer, H.H. and Arlt, J.W., Detection of 4-hydroxycoumarin anticoagulantsand their metabolites in urine as part of a systematic toxicological analysisprocedure for acidic drugs and poisons by gas chromatography-mass spec-trometry after extractive methylation., J. Chromatogr. B, 714, 181, 1998.
66. Maurer, H.H., Kraemer, T., and Arlt, J.W., Screening for the detection ofangiotensin-converting enzyme inhibitors, their metabolites, and AT II recep-tor antagonists, Ther. Drug Monit., 20, 706, 1998.
67. Maurer, H.H. and Arlt, J.W., Screening procedure for detection of dihydro-pyridine calcium channel blocker metabolites in urine as part of a systematictoxicological analysis procedure for acidics by gas chromatography-massspectrometry (GC-MS) after extractive methylation, J. Anal. Toxicol., 23, 73,1999.
68. Maurer, H.H., Tauvel, F.X., and Kraemer, T., Detection of non-steroidal anti-inflammatory drugs (NSAIDs), barbiturates and their metabolites in urineas part of a systematic toxicological analysis (STA) procedure for acidic drugsand poisons by GC-MS, in Proceedings of the 38th International TIAFT Meet-ing in Helsinki, Rasanen, I., Ed., TIAFT, Helsinki, 2001, 316.
69. Maurer, H.H., Tauvel, F.X., and Kraemer, T., Screening procedure for detec-tion of non-steroidal antiinflammatory drugs (NSAIDs) and their metabo-lites in urine as part of a systematic toxicological analysis (STA) procedurefor acidic drugs and poisons by gas chromatography-mass spectrometry (GC-MS) after extractive methylation, J. Anal. Toxicol., 25, 237, 2001.
70. Bogusz, M.J., Maier, R.D., Schiwy, B.K., and Kohls, U., Applicability of variousbrands of mixed-phase extraction columns for opiate extraction from bloodand serum., J. Chromatogr. B, 683, 177, 1996.
© 2004 by CRC Press LLC
1522_C01.fm Page 41 Tuesday, December 2, 2003 10:05 AM
71. Reubsaet, K.J., Ragnar, N.H., Hemmersbach, P., and Rasmussen, K.E., Deter-mination of benzodiazepines in human urine and plasma with solvent mod-ified solid phase micro extraction and gas chromatography; rationalisationof method development using experimental design strategies, J. Pharm.Biomed. Anal., 18, 667, 1998.
72. Hall, B.J. and Brodbelt, J.S., Determination of barbiturates by solid-phasemicroextraction (SPME) and ion trap gas chromatography-mass spectrom-etry., J. Chromatogr. A, 777, 275, 1997.
73. Ulrich, S., Kruggel, S., Weigmann, H., and Hiemke, C., Fishing for a drug:solid-phase microextraction for the assay of clozapine in human plasma,J. Chromatogr. B Biomed. Sci. Appl., 731, 231, 1999.
74. Koester, C.J., Andresen, B.D., and Grant, P.M., Optimum methamphetamineprofiling with sample preparation by solid-phase microextraction, J. ForensicSci., 47, 1002, 2002.
75. Musshoff, F., Junker, H.P., Lachenmeier, D.W., Kroener, L., and Madea, B.,Fully automated determination of amphetamines and synthetic designerdrugs in hair samples using headspace solid-phase microextraction and gaschromatography-mass spectrometry, J. Chromatogr. Sci., 40, 359, 2002.
76. Musshoff, F., Junker, H.P., Lachenmeier, D.W., Kroener, L., and Madea, B.,Fully automated determination of cannabinoids in hair samples using head-space solid-phase microextraction and gas chromatography-mass spectrom-etry, J. Anal. Toxicol., 26, 554, 2002.
77. Fucci, N., De Giovanni, N., Chiarotti, M., and Scarlata, S., SPME-GC analysisof THC in saliva samples collected with “EPITOPE” device, Forensic Sci. Int.,119, 318, 2001.
78. Liu, J., Hara, K., Kashimura, S., Kashiwagi, M., and Kageura, M., New methodof derivatization and headspace solid-phase microextraction for gas chro-matographic-mass spectrometric analysis of amphetamines in hair, J. Chro-matogr. B Biomed. Sci. Appl., 758, 95, 2001.
79. Okajima, K., Namera, A., Yashiki, M., Tsukue, I., and Kojima, T., Highlysensitive analysis of methamphetamine and amphetamine in human wholeblood using headspace solid-phase microextraction and gas chromatography-mass spectrometry, Forensic Sci. Int., 116, 15, 2001.
80. Jurado, C., Gimenez, M.P., Soriano, T., Menendez, M., and Repetto, M., Rapidanalysis of amphetamine, methamphetamine, MDA, and MDMA in urineusing solid-phase microextraction, direct on-fiber derivatization, and analysisby GC-MS, J. Anal. Toxicol., 24, 11, 2000.
81. Sporkert, F. and Pragst, F., Use of headspace solid-phase microextraction (HS-SPME) in hair analysis for organic compounds, Forensic Sci. Int., 107, 129,2000.
© 2004 by CRC Press LLC
1522_C01.fm Page 42 Tuesday, December 2, 2003 10:05 AM
82. Battu, C., Marquet, P., Fauconnet, A.L., Lacassie, E., and Lachatre, G., Screen-ing procedure for 21 amphetamine-related compounds in urine using solid-phase microextraction and gas chromatography-mass spectrometry, J. Chro-matogr. Sci., 36, 1, 1998.
83. Lisi, A.M., Kazlauskas, R., and Trout, G.J., Gas chromatographic-mass spec-trometric quantitation of urinary buprenorphine and norbuprenorphine afterderivatization by direct extractive alkylation., J. Chromatogr. B, 692, 67, 1997.
84. Lisi, A.M., Kazlauskas, R., and Trout, G.J., Diuretic screening in human urineby gas chromatography-mass spectrometry: use of a macroreticular acryliccopolymer for the efficient removal of the coextracted phase-transfer reagentafter derivatization by direct extractive alkylation., J. Chromatogr., 581, 57, 1992.
85. Segura, J., Ventura, R., and Jurado, C., Derivatization procedures for gaschromatographic-mass spectrometric determination of xenobiotics in bio-logical samples, with special attention to drugs of abuse and doping agents[review], J. Chromatogr. B, 713, 61, 1998.
86. Schutz, H., Gotta, J.C., Erdmann, F., Risse, M., and Weiler, G., Simultaneousscreening and detection of drugs in small blood samples and bloodstains,Forensic Sci. Int., 126, 191, 2002.
87. Weinmann, W., Renz, M., Vogt, S., and Pollak, S., Automated solid-phaseextraction and two-step derivatisation for simultaneous analysis of basic illicitdrugs in serum by GC/MS, Int. J. Legal Med., 113, 229, 2000.
88. Staerk, U. and Kulpmann, W.R., High-temperature solid-phase microextrac-tion procedure for the detection of drugs by gas chromatography-mass spec-trometry, J. Chromatogr. B Biomed. Sci. Appl., 745, 399, 2000.
89. Inoue, H., Maeno, Y., Iwasa, M., Matoba, R., and Nagao, M., Screening anddetermination of benzodiazepines in whole blood using solid-phase extractionand gas chromatography/mass spectrometry, Forensic Sci. Int., 113, 367, 2000.
90. Lillsunde, P., Michelson, L., Forsstrom, T., Korte, T., Schultz, E., Ariniemi,K., Portman, M., Sihvonen, M.L., and Seppala, T., Comprehensive drugscreening in blood for detecting abused drugs or drugs potentially hazardousfor traffic safety., Forensic Sci. Int., 77, 191, 1996.
91. Maurer, H.H., Toxicological analysis of drugs and poisons by GC-MS, Spec-troscopy Europe, 6, 21, 1994.
92. Pfleger, K., Maurer, H.H., and Weber, A., Mass Spectral Library of Drugs,Poisons, Pesticides, Pollutants and their Metabolites, Agilent Technologies, PaloAlto, CA, 2000.
93. Maurer, H.H., Kraemer, T., Kratzsch, C., Paul, L.D., Peters, F.T., Springer, D.,Staack, R.F., and Weber, A.A., What is the appropriate analytical strategy foreffective management of intoxicated patients?, in Proceedings of the 39th Inter-national TIAFT Meeting in Prague, 2001, Balikova, M. and Navakova, E., Eds.,Charles University, Prague, 2002, 61.
© 2004 by CRC Press LLC
1522_C01.fm Page 43 Tuesday, December 2, 2003 10:05 AM
94. Pfleger, K., Maurer, H.H., and Weber, A., Mass Spectral Library of Drugs,Poisons, Pesticides, Pollutants and their Metabolites, Agilent Technologies, PaloAlto, CA, 2003, in preparation.
95. NIST, EPA, and NIH, Mass Spectral Database, National Institute of Standardsand Technology, Gaithersburg, MD, 1998.
96. McLafferty, F.W. and Stauffer, D.B., Registry of Mass Spectral Data, 7th ed.,John Wiley & Sons, New York, 2001.
97. Pragst, F., Herzler, M., Herre, S., Erxleben, B.T., and Rothe, M., UV Spektraof Toxic Compounds, Helm-Verlag, Heppenheim, Germany, 2001.
98. Drummer, O.H., Chromatographic screening techniques in systematic toxi-cological analysis [review], J. Chromatogr. B, 733, 27, 1999.
99. Lai, C.K., Lee, T., Au, K.M., and Chan, A.Y., Uniform solid-phase extractionprocedure for toxicological drug screening in serum and urine by HPLC withphotodiode-array detection, Clin. Chem., 43, 312, 1997.
100. Lambert, W.E., Van Bocxlaer, J.F., and de-Leenheer, A.P., Potential of high-performance liquid chromatography with photodiode array detection inforensic toxicology, J. Chromatogr. B, 689, 45, 1997.
101. Koves, E.M., Use of high-performance liquid chromatography-diode arraydetection in forensic toxicology, J. Chromatogr. A, 692, 103, 1995.
102. Lambert, W.E., Meyer, E., and de-Leenheer, A.P., Systematic toxicologicalanalysis of basic drugs by gradient elution of an alumina-based HPLC packingmaterial under alkaline conditions, J. Anal. Toxicol., 19, 73, 1995.
103. Maier, R.D. and Bogusz, M., Identification power of a standardized HPLC-DAD system for systematic toxicological analysis, J. Anal. Toxicol., 19, 79, 1995.
104. Tracqui, A., Kintz, P., and Mangin, P., Systematic toxicological analysis usingHPLC/DAD, J. Forensic Sci., 40, 254, 1995.
105. Kratzsch, C., Weber, A.A., Kraemer, T., and Maurer, H.H., Validated high-throughput assay for the determination of risperidone and its 9-hydroxymetabolite in plasma by atmospheric pressure chemical ionization liquidchromatography-mass spectrometry (APCI-LC-MS), in Proceedings of theXIIth GTFCh Symposium in Mosbach, Pragst, F. and Aderjan, R., Eds., Helm-Verlag, Heppenheim, Germany, 2001, 76.
106. Rivier, L., Robustness evaluation for automatic identification of generalunknown by reference ESI mass spectra comparison in LC-MS, in AbstractBook of the 39th International TIAFT Meeting in Prague, 2001, Balikova, M.and Navakova, E., Eds., Charles University, Prague, 2002, 71.
107. Weinmann, W., Stoertzel, M., Vogt, S., and Wendt, J., Tune compounds forelectrospray ionisation/in-source collision-induced dissociation with massspectral library searching, J Chromatogr. A, 926, 199, 2001.
© 2004 by CRC Press LLC
1522_C01.fm Page 44 Tuesday, December 2, 2003 10:05 AM
108. Bogusz, M.J., Maier, R.D., Kruger, K.D., Webb, K.S., Romeril, J., and Miller, M.L.,Poor reproducibility of in-source collisional atmospheric pressure ionizationmass spectra of toxicologically relevant drugs, J. Chromatogr. A, 844, 409, 1999.
109. Maurer, H.H., Schmitt, C.J., Weber, A.A., and Kraemer, T., Validated electro-spray LC-MS assay for determination of the mushroom toxins alpha- andbeta-amanitin in urine after immunoaffinity extraction, J. Chromatogr. B,748, 125, 2000.
110. Schramm, W., Smith, R.H., Craig, P.A., and Kidwell, D.A., Drugs of abuse insaliva: a review, J. Anal. Toxicol., 16, 1, 1992.
111. Cone, E.J., Presley, L., Lehrer, M., Seiter, W., Smith, M., Kardos, K.W., Fritch,D., Salamone, S., and Niedbala, R.S., Oral fluid testing for drugs of abuse:positive prevalence rates by Intercept immunoassay screening and GC-MS-MSconfirmation and suggested cutoff concentrations, J. Anal. Toxicol., 26, 541, 2002.
112. Jones, J., Tomlinson, K., and Moore, C., The simultaneous determination ofcodeine, morphine, hydrocodone, hydromorphone, 6-acetylmorphine, andoxycodone in hair and oral fluid, J. Anal. Toxicol., 26, 171, 2002.
113. Katikaneni, L.D., Salle, F.R., and Hulsey, T.C., Neonatal hair analysis forbenzoylecgonine: a sensitive and semiquantitative biological marker forchronic gestational cocaine exposure, Biol. Neonate, 81, 29, 2002.
114. Samyn, N., de Boeck, G., Cirimele, V., Verstraete, A., and Kintz, P., Detectionof flunitrazepam and 7-aminoflunitrazepam in oral fluid after controlledadministration of rohypnol, J. Anal. Toxicol., 26, 211, 2002.
115. Samyn, N., de Boeck, G., and Verstraete, A.G., The use of oral fluid and sweatwipes for the detection of drugs of abuse in drivers, J. Forensic Sci., 47, 1380, 2002.
116. Auwarter, V., Sporkert, F., Hartwig, S., Pragst, F., Vater, H., and Diefenbacher,A., Fatty acid ethyl esters in hair as markers of alcohol consumption. Seg-mental hair analysis of alcoholics, social drinkers, and teetotalers, Clin. Chem.,47, 2114, 2001.
117. Kronstrand, R., Andersson, M.C., Ahlner, J., and Larson, G., Incorporationof selegiline metabolites into hair after oral selegiline intake, J. Anal. Toxicol.,25, 594, 2001.
118. Lester, B.M., ElSohly, M., Wright, L.L., Smeriglio, V.L., Verter, J., Bauer, C.R.,Shankaran, S., Bada, H.S., Walls, H.H., Huestis, M.A., Finnegan, L.P., andMaza, P.L., The maternal lifestyle study: drug use by meconium toxicologyand maternal self-report, Pediatrics, 107, 309, 2001.
119. Paterson, S., McLachlan-Troup, N., Cordero, R., Dohnal, M., and Carman,S., Qualitative screening for drugs of abuse in hair using GC-MS, J. Anal.Toxicol., 25, 203, 2001.
120. Pragst, F., Auwaerter, V., Sporkert, F., and Spiegel, K., Analysis of fatty acid ethylesters in hair as possible markers of chronically elevated alcohol consumptionby headspace solid-phase microextraction (HS-SPME) and gas chromatogra-phy-mass spectrometry (GC-MS), Forensic Sci. Int., 121, 76, 2001.
© 2004 by CRC Press LLC
1522_C01.fm Page 45 Tuesday, December 2, 2003 10:05 AM
121. Vandevenne, M., Vandenbussche, H., and Verstraete, A., Detection time ofdrugs of abuse in urine, Acta Clin. Belg., 55, 323, 2000.
122. Jimenez, C., Ventura, R., and Segura, J., Validation of qualitative chromato-graphic methods: strategy in antidoping control laboratories, J. Chromatogr.B Analyt. Technol. Biomed. Life Sci., 767, 341, 2002.
123. Goldberger, B.A. and Cone, E.J., Confirmatory tests for drugs in the work-place by gas chromatography-mass spectrometry, J. Chromatogr. A, 674, 73,1994.
124. Casari, C. and Andrews, A.R., Application of solvent microextraction to theanalysis of amphetamines and phencyclidine in urine, Forensic Sci. Int., 120,165, 2001.
125. Kraemer, T., Roditis, S.K., Peters, F.T., and Maurer, H.H., Amphetamineconcentrations in human urine following single-dose administration of thecalcium antagonist prenylamine — studies using FPIA and GC-MS, J. Anal.Toxicol., 27, 68, 2003.
126. Kraemer, T., Wennig, R., and Maurer, H.H., The antispasmodic mebeverineleads to positive amphetamine results with the fluorescence polarizationimmuno assay (FPIA) — studies on the toxicological detection in urine byGC-MS and FPIA, J. Anal. Toxicol., 25, 1, 2001.
127. Kraemer, T., Theis, G.A., Weber, A.A., and Maurer, H.H., Studies on themetabolism and toxicological detection of the amphetamine-like anorecticfenproporex in human urine by gas chromatography-mass spectrometry andfluorescence polarization immunoassay (FPIA), J. Chromatogr. B, 738, 107,2000.
128. Kraemer, T., Bickeboeller-Friedrich, J., and Maurer, H.H., On the metabolismof the amphetamine-derived antispasmodic drug mebeverine: gas chroma-tography-mass spectrometry studies on rat liver microsomes and on humanurine, Drug Metab. Dispos., 28, 339, 2000.
129. Musshoff, F. and Kraemer, T., Identification of famprofazone ingestion, Int.J. Legal Med., 111, 305, 1998.
130. Kraemer, T., Vernaleken, I., and Maurer, H.H., Studies on the metabolismand toxicological detection of the amphetamine-like anorectic mefenorex inhuman urine by gas chromatography-mass spectrometry and fluorescencepolarization immunoassay, J. Chromatogr. B, 702, 93, 1997.
131. Maurer, H.H., Kraemer, T., Ledvinka, O., Schmitt, C.J., and Weber, A.A., Gaschromatography-mass spectrometry (GC-MS) and liquid chromatography-mass spectrometry (LC-MS) in toxicological analysis. Studies on the detec-tion of clobenzorex and its metabolites within a systematic toxicologicalanalysis procedure by GC-MS and by immunoassay and studies on the detec-tion of alpha- and beta-amanitin in urine by atmospheric pressure ionizationelectrospray LC-MS, J. Chromatogr. B, 689, 81, 1997.
© 2004 by CRC Press LLC
1522_C01.fm Page 46 Tuesday, December 2, 2003 10:05 AM
132. Maurer, H.H. and Kraemer, T., Toxicological detection of selegiline and itsmetabolites in urine using fluorescence polarization immunoassay (FPIA)and gas chromatography-mass spectrometry (GC-MS) and differentiation byenantioselective GC-MS of the intake of selegiline from abuse of metham-phetamine or amphetamine, Arch. Toxicol., 66, 675, 1992.
133. Kraemer, T. and Maurer, H.H., Toxicokinetics of amphetamines: metabolismand toxicokinetic data of designer drugs, of amphetamine, methamphetamineand their N-alkyl derivatives [review], Ther. Drug Monit., 24, 277, 2002.
134. Musshoff, F., Illegal or legitimate use? Precursor compounds to amphetamineand methamphetamine [review], Drug Metab. Rev., 32, 15, 2000.
135. Hegadoren, K.M., Baker, G.B., and Bourin, M., 3,4-methylenedioxy ana-logues of amphetamine: defining the risks to humans, Neurosci. Biobehav.Rev., 23, 539, 1999.
136. Nichols, D.E., Differences between the mechanism of action of MDMA,MBDB, and the classic hallucinogens. Identification of a new therapeuticclass: entactogens, J. Psychoactive Drugs, 18, 305, 1986.
137. Jones, A.L. and Simpson, K.J., Review article: mechanisms and managementof hepatotoxicity in ecstasy (MDMA) and amphetamine intoxications, Ali-ment. Pharmacol. Ther., 13, 129, 1999.
138. Walubo, A. and Seger, D., Fatal multi-organ failure after suicidal overdosewith MDMA, “ecstasy”: case report and review of the literature, Hum. Exp.Toxicol., 18, 119, 1999.
139. Maurer, H.H., Bickeboeller-Friedrich, J., Kraemer, T., and Peters, F.T., Toxi-cokinetics and analytical toxicology of amphetamine-derived designer drugs(“Ecstasy”), Toxicol. Lett., 112, 133, 2000.
140. Carvalho, M., Carvalho, F., and Bastos, M.L., Is hyperthermia the triggeringfactor for hepatotoxicity induced by 3,4-methylenedioxymethamphetamine(ecstasy)? An in vitro study using freshly isolated mouse hepatocytes, Arch.Toxicol., 74, 789, 2001.
141. Garbino, J., Henry, J.A., Mentha, G., and Romand, J.A., Ecstasy ingestion andfulminant hepatic failure: liver transplantation to be considered as a lasttherapeutic option, Vet. Hum. Toxicol., 43, 99, 2001.
142. Ricaurte, G.A., McCann, U.D., Szabo, Z., and Scheffel, U., Toxicodynamicsand long-term toxicity of the recreational drug, 3,4-methylenedioxymetham-phetamine (MDMA, “Ecstasy”), Toxicol. Lett., 112, 143, 2000.
143. Rochester, J.A. and Kirchner, J.T., Ecstasy (3,4-methylenedioxymethamphet-amine): history, neurochemistry, and toxicology, J. Am. Board. Fam. Pract.,12, 137, 1999.
144. Bai, F., Lau, S.S., and Monks, T.J., Glutathione and N-acetylcysteine conju-gates of alpha-methyldopamine produce serotonergic neurotoxicity: possiblerole in methylenedioxyamphetamine-mediated neurotoxicity, Chem. Res.Toxicol., 12, 1150, 1999.
© 2004 by CRC Press LLC
1522_C01.fm Page 47 Tuesday, December 2, 2003 10:05 AM
145. Colado, M.I., Granados, R., O’Shea, E., Esteban, B., and Green, A.R., Theacute effect in rats of 3,4-methylenedioxyethamphetamine (MDEA, “eve”) onbody temperature and long term degeneration of 5-HT neurones in brain: acomparison with MDMA (“ecstasy”), Pharmacol. Toxicol., 84, 261, 1999.
146. Morland, J., Toxicity of drug abuse — amphetamine designer drugs (ecstasy):mental effects and consequences of single dose use, Toxicol. Lett., 112–113,147, 2000.
147. Curran, H.V., Is MDMA (“Ecstasy”) neurotoxic in humans? An overview ofevidence and of methodological problems in research, Neuropsychobiology,42, 34, 2000.
148. Chang, L., Grob, C.S., Ernst, T., Itti, L., Mishkin, F.S., Jose-Melchor, R., andPoland, R.E., Effect of ecstasy [3,4-methylenedioxymethamphetamine(MDMA)] on cerebral blood flow: a co-registered SPECT and MRI study,Psychiatry Res., 98, 15, 2000.
149. Ernst, T., Chang, L., Leonido-Yee, M., and Speck, O., Evidence for long-termneurotoxicity associated with methamphetamine abuse: A 1H MRS study,Neurology, 54, 1344, 2000.
150. Hervias, I., Lasheras, B., and Aguirre, N., 2-Deoxy-D-glucose prevents andnicotinamide potentiates 3,4-methylenedioxymethamphetamine-inducedserotonin neurotoxicity, J. Neurochem., 75, 982, 2000.
151. Kish, S.J., Furukawa, Y., Ang, L., Vorce, S.P., and Kalasinsky, K.S., Striatalserotonin is depleted in brain of a human MDMA (Ecstasy) user, Neurology,55, 294, 2000.
152. Ricaurte, G.A., Yuan, J., and McCann, U.D., (+/-)3,4-methylenedioxy-methamphetamine (“Ecstasy”)-induced serotonin neurotoxicity: studies inanimals, Neuropsychobiology, 42, 5, 2000.
153. Bai, F., Jones, D.C., Lau, S.S., and Monks, T.J., Serotonergic neurotoxicity of3,4-(+/-)-methylenedioxyamphetamine and 3,4-(+/-)-methylen-dioxymethamphetamine (“Ecstasy”) is potentiated by inhibition of gamma-glutamyl transpeptidase, Chem. Res. Toxicol., 14, 863, 2001.
154. Buchert, R., Obrocki, J., Thomasius, R., Vaterlein, O., Petersen, K., Jenicke,L., Bohuslavizki, K.H., and Clausen, M., Long-term effects of “ecstasy” abuseon the human brain studied by FDG PET, Nucl. Med. Commun., 22, 889, 2001.
155. Cadet, J.L., Thiriet, N., and Subramanian, J., Involvement of free radicals inMDMA-induced neurotoxicity in mice, Ann. Med. Interne (Paris), 152 Suppl.3, 57, 2001.
156. Nixdorf, W.L., Burrows, K.B., Gudelsky, G.A., and Yamamoto, B.K., Enhance-ment of 3,4-methylenedioxymethamphetamine neurotoxicity by the energyinhibitor malonate, J. Neurochem., 77, 647, 2001.
157. Moeller, M.R. and Hartung, M., Ecstasy and related substances — serumlevels in impaired drivers [letter; comment], J. Anal. Toxicol., 21, 591, 1997.
© 2004 by CRC Press LLC
1522_C01.fm Page 48 Tuesday, December 2, 2003 10:05 AM
158. Taylor, E.H., Oertli, E.H., Wolfgang, J.W., and Mueller, E., Accuracy of five on-site immunoassay drugs-of-abuse testing devices, J. Anal. Toxicol., 23, 119, 1999.
159. Iwersen-Bergmann, S. and Schmoldt, A., Direct semiquantitative screeningof drugs of abuse in serum and whole blood by means of CEDIA DAU urineimmunoassays, J. Anal. Toxicol., 23, 247, 1999.
160. Scholer, A., Nicht-instrumentelle Immunoassays in der Suchtmittelanalytik(Drogenanalytik), Toxichem. Krimtech., 66, 27, 1999.
161. Lekskulchai, V. and Mokkhavesa, C., Evaluation of Roche Abuscreen ONLINEamphetamine immunoassay for screening of new amphetamine analogues,J. Anal. Toxicol., 25, 471, 2001.
162. Zhao, H., Brenneisen, R., Scholer, A., McNally, A.J., ElSohly, M.A., Murphy,T.P., and Salamone, S.J., Profiles of urine samples taken from Ecstasy usersat Rave parties: analysis by immunoassays, HPLC, and GC-MS, J. Anal. Tox-icol., 25, 258, 2001.
163. Wikstroem, M., Holmgren, P., and Ahlner, J., N-Benzylpiperazine, a “new”drug of abuse in Sweden, in Rasanen, I., Ed., Abstract book, 38th Int. TIAFTMeeting, Helsinki, 2000, 88.
164. Balmelli, C., Kupferschmidt, H., Rentsch, K., and Schneemann, M., Fatalbrain edema after ingestion of ecstasy and benzylpiperazine, Dtsch. Med.Wochenschr, 126, 809, 2001.
165. de Boer, D., Bosman, I.J., Hidvegi, E., Manzoni, C., Benko, A.A., dos, R.L.,and Maes, R.A., Piperazine-like compounds: a new group of designer drugs-of-abuse on the European market, Forensic Sci. Int., 121, 47, 2001.
166. Staack, R.F., Fritschi, G., and Maurer, H.H., GC-MS studies on the metabo-lism and on the toxicological analysis of the new piperazine-like designerdrugs BZP, MDBP, TFMPP, mCPP, MeOPP, in Proceedings of the 39th Inter-national TIAFT Meeting in Prague, 2001, Balikova, M. and Navakova, E., Eds.,Charles University, Prague, 2002, 115.
167. Staack, R.F., Fritschi, G., and Maurer, H.H., Studies on the metabolism andthe toxicological analysis of the new piperazine-like designer drugs BZP andTFMPP using GC-MS, in Proceedings of the XIIth GTFCh Symposium inMosbach, Pragst, F. and Aderjan, R., Eds., Helm-Verlag, Heppenheim, Ger-many, 2001, 149.
168. Shulgin, A., #142 PEA; Phenethylamine, in Pihkal, A Chemical Love Story,Dan Joy, Ed., Transform Press, Berkley, CA, 1991, 815.
169. Bye, C., Munro, F.A., Peck, A.W., and Young, P.A., A comparison of the effectsof 1-benzylpiperazine and dexamphetamine on human performance tests,Eur. J. Clin. Pharmacol., 6, 163, 1973.
170. Tekes, K., Tothfalusi, L., Malomvolgyi, B., Herman, F., and Magyar, K., Studieson the biochemical mode of action of EGYT-475, a new antidepressant, Pol.J. Pharmacol. Pharm., 39, 203, 1987.
© 2004 by CRC Press LLC
1522_C01.fm Page 49 Tuesday, December 2, 2003 10:05 AM
171. Maurer, H.H. and Kraemer, T., Amphetamine-derived designer drugs: metab-olism and screening procedures [review], J. Lab. Med., 26, 37, 2002.
172. Maurer, H.H., On the metabolism and the toxicological analysis of methyl-enedioxyphenylalkylamine designer drugs by gas chromatography-massspectrometry, Ther. Drug Monit., 18, 465, 1996.
173. Hensley, D. and Cody, J.T., Simultaneous determination of amphetamine,methamphetamine, methylenedioxyamphetamine (MDA), methylene-dioxymethamphetamine (MDMA), and methylenedioxyethylamphetamine(MDEA) enantiomers by GC-MS, J. Anal. Toxicol., 23, 518, 1999.
174. Ensslin, H.K., Kovar, K.A., and Maurer, H.H., Toxicological detection of thedesigner drug 3,4-methylenedioxyethylamphetamine (MDE, “Eve”) and itsmetabolites in urine by gas chromatography-mass spectrometry and fluores-cence polarization immunoassay, J. Chromatogr. B, 683, 189, 1996.
175. Helmlin, H.J., Bracher, K., Bourquin, D., Vonlanthen, D., and Brenneisen, R.,Analysis of 3,4-methylenedioxymethamphetamine (MDMA) and its metab-olites in plasma and urine by HPLC-DAD and GC-MS [see comments],J. Anal. Toxicol., 20, 432, 1996.
176. Centini, F., Masti, A., and Comparini, I.B., Quantitative and qualitative anal-ysis of MDMA, MDEA, MA and amphetamine in urine by headspace/solidphase micro-extraction and GC/MS, Forensic Sci. Int., 83, 161, 1996.
177. Roesner, P., Junge, T., Fritschi, G., Klein, B., Thielert, K., and Kozlowski, M.,Neue synthetische Drogen: Piperazin-, Procyclidin- und alpha-Aminopro-piophenonderivate, Toxichem. Krimtech., 66, 81, 1999.
178. Springer, D., Peters, F.T., Fritschi, G., and Maurer, H.H., Studies on themetabolism of the new pyrrolidino-propiophenone designer drugs PPPand MOPPP, in Proceedings of the XIIth GTFCh Symposium in Mosbach,Pragst, F. and Aderjan, R., Eds., Helm-Verlag, Heppenheim, Germany,2001, 156.
179. Springer, D., Peters, F.T., Fritschi, G., and Maurer, H.H., Studies on themetabolism of the new pyrrolidino-propiophenone designer drugs MPPPand MDPPP, in Proceedings of the 39th International TIAFT Meeting in Prague,2001, Balikova, M. and Navakova, E., Eds., Charles University, Prague, 2002,122.
180. Springer, D., Peters, F.T., Fritschi, G., and Maurer, H.H., Studies on themetabolism and toxicological detection of the new designer drug 4¢-methyl-alpha-pyrrolidinopropiophenone (MPPP) in urine using gas chromatogra-phy-mass spectrometry, J. Chromatogr. B, 773, 25, 2002.
181. Springer, D., Peters, F.T., Fritschi, G., and Maurer, H.H., New designer drug4¢-methyl-alpha-pyrrolidinohexanophenone (MPHP): Studies on its metab-olism and toxicological detection in urine using gas chromatography-massspectrometry, J. Chromatogr. B, 789, 79, 2003.
© 2004 by CRC Press LLC
1522_C01.fm Page 50 Tuesday, December 2, 2003 10:05 AM
182. Martinez, M., Mercado, O., Santamaria, A., Galvan, S., Vazquez, M., Bucio,V., Hall, C., Hernandez, R., Hurtazo, A., Pego, E., Rodriguez, F., Salvatierra,R., Sosa, A., and Rios, C., The action of amfepramone on neurochemical andbehavioral markers in rats, Proc. West. Pharmacol. Soc., 41, 125, 1998.
183. Glennon, R.A., Yousif, M., Naiman, N., and Kalix, P., Methcathinone: a newand potent amphetamine-like agent, Pharmacol. Biochem. Behav., 26, 547,1987.
184. Kalix, P. and Glennon, R.A., Further evidence for an amphetamine-like mech-anism of action of the alkaloid cathinone, Biochem. Pharmacol., 35, 3015, 1986.
185. Bryant, S.G., Guernsey, B.G., and Ingrim, N.B., Review of bupropion, Clin.Pharm., 2, 525, 1983.
186. Springer, D., Peters, F.T., Fritschi, G., and Maurer, H.H., GC-MS studies onthe metabolism and toxicological analysis of the new pyrrolidino-hexanophe-none designer drug 4¢-methyl-alpha-pyrrolidinohexanophenone (MPHP), inProceedings of the 40th International TIAFT Meeting in Paris, Marquet, P., Ed.,TIAFT, Strasbourg, France, 2003.
187. Springer, D., Paul, L.D., Staack, R.F., Kraemer, T., and Maurer, H.H., Identi-fication of the cytochrome P450 enzymes involved in the metabolism of 4¢-methyl-pyrrolidinopropiophenone (MPPP), a novel scheduled designerdrug, in human liver microsomes, Drug Metab. Dispos., 31, 979, 2003.
188. Springer, D., Fritschi, G., and Maurer, H.H., Metabolism and toxicologicaldetection of the new designer drug 4¢-methoxy-alpha-pyrrolidinopropiophe-none (MOPPP) studied in urine using gas chromatography-mass spectrom-etry, J. Chromatogr. B, submitted, 2003.
189. de Kanel, J., Vickery, W.E., Waldner, B., Monahan, R.M., and Diamond, F.X.,Automated extraction of lysergic acid diethylamide (LSD) and N-demethyl-LSD from blood, serum, plasma, and urine samples using the ZymarkRapidTrace with LC/MS/MS confirmation, J. Forensic Sci., 43, 622, 1998.
190. Hoja, H., Marquet, P., Verneuil, B., Lotfi, H., Dupuy, J.L., and Lachatre, G.,Determination of LSD and N-demethyl-LSD in urine by liquid chromatog-raphy coupled to electrospray ionization mass spectrometry, J. Chromatogr.B, 692, 329, 1997.
191. Cai, J. and Henion, J., Elucidation of LSD in vitro metabolism by liquidchromatography and capillary electrophoresis coupled with tandem massspectrometry, J. Anal. Toxicol., 20, 27, 1996.
192. Stout, P.R., Horn, C.K., and Klette, K.-L., Solid-phase extraction and GC-MSanalysis of THC-COOH method optimized for a high-throughput forensicdrug-testing laboratory, J. Anal. Toxicol., 25, 550, 2001.
193. ElSohly, M.A., deWit, H., Wachtel, S.R., Feng, S., and Murphy, T.P., Delta 9-tetrahydrocannabivarin as a marker for the ingestion of marijuana versusMarinol: results of a clinical study, J. Anal. Toxicol., 25, 565, 2001.
© 2004 by CRC Press LLC
1522_C01.fm Page 51 Tuesday, December 2, 2003 10:05 AM
194. Broussard, L.A., Presley, L.C., Tanous, M., and Queen, C., Improved gaschromatography-mass spectrometry method for simultaneous identificationand quantification of opiates in urine as propionyl and oxime derivatives,Clin. Chem, 47, 127, 2001.
195. O’Neal, C.L. and Poklis, A., The detection of acetylcodeine and 6-acetylmor-phine in opiate positive urines, Forensic Sci. Int., 95, 1, 1998.
196. Galloway, J.H., Ashford, M., Marsh, I.D., Holden, M., and Forrest, A.R.,A method for the confirmation and identification of drugs of misuse in urineusing solid phase extraction and gas-liquid chromatography with mass spec-trometry, J. Clin. Pathol., 51, 326, 1998.
197. Smith, M.L., Hughes, R.O., Levine, B., Dickerson, S., Darwin, W.D., andCone, E.J., Forensic drug testing for opiates. VI. Urine testing for hydromor-phone, hydrocodone, oxymorphone, and oxycodone with commercial opiateimmunoassays and gas chromatography-mass spectrometry, J. Anal. Toxicol.,19, 18, 1995.
198. Maurer, H.H. and Fritz, C.F., Metabolism of pholcodine in man, Arzneim. -Forsch., 40, 564, 1990.
199. Maurer, H.H. and Fritz, C.F., Toxicological detection of pholcodine and itsmetabolites in urine and hair using radio immunoassay, fluorescence polar-isation immunoassay, enzyme immunoassay and gas chromatography-massspectrometry, Int. J. Legal Med., 104, 43, 1990.
200. Meadway, C., George, S., and Braithwaite, R., Interpretation of GC-MS opiateresults in the presence of pholcodine, Forensic Sci. Int., 127, 131, 2002.
201. Cone, E.J. and Preston, K.J., Toxicological aspects of heroin substitutiontreatment [review], Ther. Drug Monit., 24, 193, 2002.
202. Kuhlman, J.J., Magluilo, J., Cone, E.J., and Levine, B., Simultaneous assay ofbuprenorphine and norbuprenorphine by negative chemical ionization tan-dem mass spectrometry, J. Anal. Toxicol., 20, 229, 1996.
203. Vincent, F., Bessard, J., Vacheron, J., Mallaret, M., and Bessard, G., Determi-nation of buprenorphine and norbuprenorphine in urine and hair by gaschromatography-mass spectrometry, J. Anal. Toxicol., 23, 270, 1999.
204. Tracqui, A., Kintz, P., and Mangin, P., HPLC/MS determination of buprenor-phine and norbuprenorphine in biological fluids and hair samples, J. ForensicSci., 42, 111, 1997.
205. Hoja, H., Marquet, P., Verneuil, B., Lotfi, H., Dupuy, J.L., and Lachatre, G.,Determination of buprenorphine and norbuprenorphine in whole blood byliquid chromatography-mass spectrometry, J. Anal. Toxicol., 21, 160, 1997.
206. Polettini, A. and Huestis, M.A., Simultaneous determination of buprenor-phine, norbuprenorphine, and buprenorphine-glucuronide in plasma by liq-uid chromatography-tandem mass spectrometry, J. Chromatogr. B Biomed.Sci. Appl., 754, 447, 2001.
© 2004 by CRC Press LLC
1522_C01.fm Page 52 Tuesday, December 2, 2003 10:05 AM
207. Maurer, H. and Pfleger, K., Screening procedure for the detection of opioids,other potent analgesics and their metabolites in urine using a computerizedgas chromatographic-mass spectrometric technique, Fresenius Z. Anal.Chem., 317, 42, 1984.
208. Smith, M.L., Shimomura, E.T., Summers, J., Paul, B.D., Jenkins, A.J., Darwin,W.D., and Cone, E.J., Urinary excretion profiles for total morphine, freemorphine, and 6-acetylmorphine following smoked and intravenous heroin,J. Anal. Toxicol., 25, 504, 2001.
209. Broussard, L.A., Presley, L.C., Pittman, T., Clouette, R., and Wimbish, G.H.,Simultaneous identification and quantitation of codeine, morphine, hydro-codone, and hydromorphone in urine as trimethylsilyl and oxime derivativesby gas chromatography-mass spectrometry, Clin. Chem., 43, 1029, 1997.
210. Smith, M.L., Hughes, R.O., Levine, B., Dickerson, S., Darwin, W.D., andCone, E.J., Forensic drug testing for opiates. VI. Urine testing for hydromor-phone, hydrocodone, oxymorphone, and oxycodone with commercial opiateimmunoassays and gas chromatography-mass spectrometry, J. Anal. Toxicol.,19, 18, 1995.
211. Dawson, M., Fryirs, B., Kelly, T., Keegan, J., and Mather, L.E., A rapid andsensitive high-performance liquid chromatography-electrospray ionization-triple quadrupole mass spectrometry method for the quantitation of oxy-codone in human plasma, J. Chromatogr. Sci., 40, 40, 2002.
212. Kraemer, T. and Maurer, H.H., Forensic toxicology: non-opioid analgesics,in Handbook of Analytical Separation Sciences: Forensic Sciences, Bogusz, M.,Ed., Elsevier Science, Amsterdam, 2000, 259.
213. Maurer, H. and Pfleger, K., Screening procedure for detecting anti-inflam-matory analgesics and their metabolites in urine, Fresenius Z. Anal. Chem.,314, 586, 1983.
214. Maurer, H.H., Kraemer, T., and Weber, A., Toxicological detection of ibupro-fen and its metabolites in urine using gas chromatography-mass spectrometry(GC-MS), Pharmazie, 49, 148, 1994.
215. Tomson, T. and Johannessen, S.I., Therapeutic monitoring of the new anti-epileptic drugs [Review], Eur. J. Clin. Pharmacol., 55, 697, 2000.
216. Behnke, C.E. and Reddy, M.N., Determination of felbamate concentration inpediatric samples by high-performance liquid chromatography, Ther. DrugMonit., 19, 301, 1997.
217. Dasgupta, A. and Hart, A.P., Lamotrigine analysis in plasma by gas chroma-tography-mass spectrometry after conversion to a tert-butyldimethylsilylderivative., J. Chromatogr. B, 693, 101, 1997.
218. Maurer, H.H., Detection of anticonvulsants and their metabolites in urinewithin a “general unknown” analysis procedure using computerized gas chro-matography-mass spectrometry, Arch. Toxicol., 64, 554, 1990.
© 2004 by CRC Press LLC
1522_C01.fm Page 53 Tuesday, December 2, 2003 10:05 AM
219. Maurer, H. and Pfleger, K., Identification and differentiation of benzodiaz-epines and their metabolites in urine by computerized gas chromatography-mass spectrometry, J. Chromatogr., 422, 85, 1987.
220. Augsburger, M., Rivier, L., and Mangin, P., Comparison of different immu-noassays and GC-MS screening of benzodiazepines, J. Pharm. Biomed. Anal.,7, 681, 1998.
221. Cardenas, S., Gallego, M., and Valcarcel, M., Gas chromatographic-mass spec-trometric confirmation of selected benzophenones from benzodiazepines inhuman urine following automatic screening, J. Chromatogr. A, 823, 389, 1998.
222. Black, D.A., Clark, G.D., Haver, V.M., Garbin, J.A., and Saxon, A.J., Analysisof urinary benzodiazepines using solid-phase extraction and gas chromatog-raphy-mass spectrometry [see comments], J. Anal. Toxicol., 18, 185, 1994.
223. Maurer, H.H., Identification and differentiation of barbiturates, other seda-tive–hypnotics and their metabolites in urine integrated in a general screeningprocedure using computerized gas chromatography–mass spectrometry,J. Chromatogr., 530, 307, 1990.
224. Maurer, H. and Pfleger, K., Screening procedure for the detection of alkano-lamine antihistamines and their metabolites in urine using computerized gaschromatography-mass spectrometry, J. Chromatogr., 428, 43, 1988.
225. Geldmacher-von Malinckrodt, M., Heijst, A.V., and Koeppel, C., QualitativerNachweis von Giften — Farbreaktionen — Chlorierte Kohlenwasserstoffe, inEinfache toxikologische Laboratoriumsuntersuchungen bei akuten Vergiftungen,Gibitz, H.J. and Schütz, H., Eds., VCH, Weinheim, Germany, 1995, 168.
226. Gaulier, J.M., Merle, G., Lacassie, E., Courtiade, B., Haglund, P., Marquet, P.,and Lachatre, G., Fatal intoxications with chloral hydrate, J. Forensic Sci., 46,1507, 2001.
227. Deinl, I., Mahr, G., and von Meyer, L., Determination of flunitrazepam andits main metabolites in serum and urine by HPLC after mixed-mode solid-phase extraction., J. Anal. Toxicol., 22, 197, 1998.
228. Koppen, B., Dalgaard, L., and Christensen, J.M., Determination of trichloro-ethylene metabolites in rat liver homogenate using headspace gas chroma-tography., J. Chromatogr., 442, 325, 1988.
229. Kraemer, T. and Maurer, H.H., Forensic toxicology: sedatives and hypnotics,in Handbook of Analytical Separation Sciences: Forensic Sciences, Bogusz, M.,Ed., Elsevier Science, Amsterdam, 2000, 197.
230. Baumann, P., Pharmacokinetic-pharmacodynamic relationship of the selec-tive serotonin reuptake inhibitors, Clin. Pharmacokinet., 31, 444, 1996.
231. Richelson, E., Pharmacokinetic interactions of antidepressants, J. Clin. Psy-chiatry, 59 Suppl 10, 22, 1998.
232. Mitchell, P.B., Therapeutic drug monitoring of psychotropic medications, Br.J. Clin. Pharmacol., 49, 303, 2000.
© 2004 by CRC Press LLC
1522_C01.fm Page 54 Tuesday, December 2, 2003 10:05 AM
233. Eap, C.B., Bouchoux, G., Amey, M., Cochard, N., Savary, L., and Baumann,P., Simultaneous determination of human plasma levels of citalopram, par-oxetine, sertraline, and their metabolites by gas chromatography-mass spec-trometry, J. Chromatogr. Sci., 36, 365, 1998.
234. Eap, C.B. and Baumann, P., Analytical methods for the quantitative determi-nation of selective serotonin reuptake inhibitors for therapeutic drug moni-toring purposes in patients, J. Chromatogr. B, 686, 51, 1996.
235. Maurer, H. and Pfleger, K., Screening procedure for detection of antidepres-sants and their metabolites in urine using a computerized gas chromato-graphic-mass spectrometric technique, J. Chromatogr., 305, 309, 1984.
236. Maurer, H. and Pfleger, K., Screening procedure for detection of phenothi-azine and analogous neuroleptics and their metabolites in urine using acomputerized gas chromatographic-mass spectrometric technique, J. Chro-matogr., 306, 125, 1984.
237. Maurer, H. and Pfleger, K., Identification of phenothiazine antihistaminesand their metabolites in urine, Arch. Toxicol., 62, 185, 1988.
238. Maurer, H. and Pfleger, K., Toxicological detection of ethylenediamine andpiperazine antihistamines and their metabolites in urine by computerized gaschromatography-mass spectrometry, Fresenius Z. Anal. Chem., 331, 744, 1988.
239. Maurer, H. and Pfleger, K., Identification and differentiation of alkylamineantihistamines and their metabolites in urine by computerized gas chroma-tography-mass spectrometry., J. Chromatogr., 430, 31, 1988.
240. Maurer, H. and Pfleger, K., Screening procedure for the detection of antipar-kinsonian drugs and their metabolites in urine using a computerized gaschromatographic-mass spectrometric technique, Fresenius Z. Anal. Chem.,321, 363, 1985.
241. Romberg, R.W., Needleman, S.B., Snyder, J.J., and Greedan, A., Methamphet-amine and amphetamine derived from the metabolism of selegiline, J. Foren-sic Sci., 40, 1100, 1995.
242. Hemmersbach, P. and de-la-Torre, R., Stimulants, narcotics and beta-block-ers: 25 years of development in analytical techniques for doping control.,J. Chromatogr. B, 687, 221, 1996.
243. Siren, H., Saarinen, M., Hainari, S., Lukkari, P., and Riekkola, M.L., Screeningof beta-blockers in human serum by ion-pair chromatography and theiridentification as methyl or acetyl derivatives by gas chromatography-massspectrometry, J. Chromatogr., 632, 215, 1993.
244. Maurer, H. and Pfleger, K., Identification and differentiation of beta-blockersand their metabolites in urine by computerized gas chromatography-massspectrometry, J. Chromatogr., 382, 147, 1986.
245. Chi, H., Fang, H.J., Xu, Y.Q., Duan, H.J., Zhou, T.H., and Wu, Y., Study onthe doping control method for the detection of narcotic analgesics and beta-blockers., Yao Hsueh Hsueh Pao., 26, 688, 1991.
© 2004 by CRC Press LLC
1522_C01.fm Page 55 Tuesday, December 2, 2003 10:05 AM
246. Lho, D.S., Hong, J.K., Paek, H.K., Lee, J.A., and Park, J., Determination ofphenolalkylamines, narcotic analgesics, and beta-blockers by gas chromatog-raphy/mass spectrometry., J. Anal. Toxicol., 14, 77, 1990.
247. Delbeke, F.T., Debackere, M., Desmet, N., and Maertens, F., Qualitative gaschromatographic and gas chromatographic-mass spectrometric screening forbeta-blockers in urine after solid-phase extraction using Extrelut-1 columns,J. Chromatogr., 426, 194, 1988.
248. Leloux, M.S., de Jong, E.G., and Maes, R.A., Improved screening method forbeta-blockers in urine using solid-phase extraction and capillary gas chro-matography-mass spectrometry, J. Chromatogr., 488, 357, 1989.
249. Black, S.B., Stenhouse, A.M., and Hansson, R.C., Solid-phase extraction andderivatisation methods for beta-blockers in human post mortem wholeblood, urine and equine urine, J. Chromatogr. B Biomed. Appl., 685, 67, 1996.
250. Amendola, L., Molaioni, F., and Botre, F., Detection of beta-blockers inhuman urine by GC-MS-MS-EI: perspectives for the antidoping control,J. Pharm. Biomed. Anal., 23, 211, 2000.
251. Maurer, H.H., Identification of antiarrhythmic drugs and their metabolitesin urine, Arch.Toxicol., 64, 218, 1990.
252. Baker, E.H. and Sandle, G.I., Complications of laxative abuse, Annu. Rev.Med., 47, 127, 1996.
253. Turner, J., Batik, M., Palmer, L.J., Forbes, D., and McDermott, B.M., Detectionand importance of laxative use in adolescents with anorexia nervosa, J. Am.Acad. Child Adolesc. Psychiatry, 39, 378, 2000.
254. Maurer, H.H., Toxicological detection of the laxatives bisacodyl, picosulfate,phenolphthalein and their metabolites in urine integrated in a “general-unknown” analysis procedure using gas chromatography-mass spectrometry,Fresenius J. Anal. Chem., 337, 144, 1990.
255. Kudo, K., Miyazaki, C., Kadoya, R., Imamura, T., Jitsufuchi, N., and Ikeda,N., Laxative poisoning: toxicological analysis of bisacodyl and its metabolitein urine, serum, and stool, J. Anal. Toxicol., 22, 274, 1998.
256. Maurer, H.H. and Kraemer, T., Rapid detection of anthraquinone laxativesin urine using high-performance thin-layer chromatography, Bull. Soc. Sci.Med. Grand-Duche Lux., 127 Suppl, 476, 1990.
257. Perkins, S.L. and Livesey, J.F., A rapid high-performance thin-layer chromato-graphic urine screen for laxative abuse, Clin. Biochem., 26, 179, 1993.
258. Stolk, L.M. and Hoogtanders, K., Detection of laxative abuse by urine analysiswith HPLC and diode array detection, Pharm. World Sci., 21, 40, 1999.
259. Liu, R.H., McKeehan, A.M., Edwards, C., Foster, G., Bensley, W.D., Langner,J.G., and Walia, A.S., Improved gas chromatography/mass spectrometry anal-ysis of barbiturates in urine using centrifuge-based solid-phase extraction,methylation, with d5-pentobarbital as internal standard., J. Forensic Sci., 39,1504, 1994.
© 2004 by CRC Press LLC
1522_C01.fm Page 56 Tuesday, December 2, 2003 10:05 AM
260. Meatherall, R., GC/MS confirmation of barbiturates in blood and urine,J. Forensic Sci., 42, 1160, 1997.
261. Pocci, R., Dixit, V., and Dixit, V.M., Solid-phase extraction and GC/MS con-firmation of barbiturates from human urine, J. Anal. Toxicol., 16, 45, 1992.
262. Namera, A., Yashiki, M., Okada, K., Iwasaki, Y., Ohtani, M., and Kojima, T.,Automated preparation and analysis of barbiturates in human urine usingthe combined system of PrepStation and gas chromatography-mass spec-trometry, J. Chromatogr. B, 706, 253, 1998.
263. Kojima, T., Taniguchi, T., Yashiki, M., Miyazaki, T., Iwasaki, Y., Mikami, T.,and Ohtani, M., A rapid method for detecting barbiturates in serum usingEI-SIM., Int. J. Legal Med., 107, 21, 1994.
264. Joern, W.A., Unexpected volatility of barbiturate derivatives: an extractivealkylation procedure for barbiturates and benzoylecgonine [letter], J. Anal.Toxicol., 18, 423, 1994.
265. Laakkonen, U.M., Leinonen, A., and Savonen, L., Screening of non-steroidalanti-inflammatory drugs, barbiturates and methyl xanthines in equine urineby gas chromatography-mass spectrometry, Analyst, 119, 2695, 1994.
266. Rivier, L., Grunauer, C., and Saugy, M., Direct extractive methylation andautomatic GC-MS screening and identification of drugs of abuse and othercompounds of potential abuse in sport, in Mueller, R.K., Ed., Proc. 31st Int.TIAFT Meeting, Molinapress, Leipzig, 1994, 419.
267. Kim, K.R., Shim, W.H., Shin, Y.J., Park, J., Myung, S., and Hong, J., Capillarygas chromatography of acidic non-steroidal antiinflammatory drugs as tert-butyldimethylsilyl derivatives, J. Chromatogr., 641, 319, 1993.
268. Kim, K.R. and Yoon, H.R., Rapid screening for acidic non-steroidal anti-inflammatory drugs in urine by gas chromatography–mass spectrometry inthe selected-ion monitoring mode, J. Chromatogr. B, 682, 55, 1996.
269. Cardenas, S., Gallego, M., Valcarcel, M., Ventura, R., and Segura, J., A partiallyautomated pretreatment module for routine analyses for seventeen non-steroid antiinflammatory drugs in race horses using gas chromatogra-phy/mass spectrometry, Anal. Chem., 68, 118, 1996.
270. Leis, H.J., Fauler, G., Raspotnig, G., and Windischhofer, W., An improvedmethod for the measurement of the angiotensin-converting enzyme inhibitorlisinopril in human plasma by stable isotope dilution gas chromatogra-phy/negative ion chemical ionization mass spectrometry, Rapid. Commun.Mass. Spectrom., 13, 650, 1999.
271. Franklin, M.E., Addison, R.S., Baker, P.V., and Hooper, W.D., Improved ana-lytical procedure for the measurement of captopril in human plasma by gaschromatography–mass spectrometry and its application to pharmacokineticstudies, J. Chromatogr. B, 705, 47, 1998.
© 2004 by CRC Press LLC
1522_C01.fm Page 57 Tuesday, December 2, 2003 10:05 AM
272. Hammes, W., Hammes, B., Buchsler, U., Paar, F., and Bokens, H., Simulta-neous determination of moexipril and moexiprilat, its active metabolite, inhuman plasma by gas chromatography-negative-ion chemical ionizationmass spectrometry, J. Chromatogr. B, 670, 81, 1995.
273. Shioya, H., Shimojo, M., and Kawahara, Y., Determination of enalapril andits active metabolite enalaprilat in plasma and urine by gas chromatogra-phy–mass spectrometry, Biomed. Chromatogr., 6, 59, 1992.
274. Goto, N., Kamata, T., and Ikegami, K., Trace analysis of quinapril and itsactive metabolite, quinaprilat, in human plasma and urine by gas chroma-tography-negative-ion chemical ionization mass spectrometry, J. Chro-matogr., 578, 195, 1992.
275. Leis, H.J., Fauler, G., Raspotnig, G., and Windischhofer, W., Quantitativedetermination of the angiotensin-converting enzyme inhibitor lisinopril inhuman plasma by stable isotope dilution gas chromatography/negative ionchemical ionization mass spectrometry, Rapid. Commun. Mass. Spectrom.,12, 1591, 1998.
276. Lotfi, H., Dreyfuss, M.F., Marquet, P., Debord, J., Merle, L., and Lachatre, G.,A screening procedure for the determination of 13 oral anticoagulants androdenticides, J. Anal. Toxicol., 20, 93, 1996.
277. Chalermchaikit, T., Felice, L.J., and Murphy, M.J., Simultaneous determina-tion of eight anticoagulant rodenticides in blood serum and liver, J. Anal.Toxicol., 17, 56, 1993.
278. Rengel, I. and Friedrich, A., Detection of anticoagulant rodenticides (4-hydroxycoumarins) by thin-layer chromatography and reversed-phase high-performance liquid chromatography with fluorescence detection, Vet. Res.Commun., 17, 421, 1993.
279. Jones, A., HPLC determination of anticoagulant rodenticide residues in ani-mal livers, Bull. Environ. Contam. Toxicol., 56, 8, 1996.
280. Kuijpers, E.A., den Hartigh, J., Savelkoul, T.J., and de Wolff, F.A., A methodfor the simultaneous identification and quantitation of five superwarfarinrodenticides in human serum, J. Anal. Toxicol., 19, 557, 1995.
281. Berny, P.J., Buronfosse, T., and Lorgue, G., Anticoagulant poisoning in ani-mals: a simple new high- performance thin-layer chromatographic (HPTLC)method for the simultaneous determination of eight anticoagulant rodenti-cides in liver samples, J. Anal. Toxicol., 19, 576, 1995.
282. Meyer, H., Scherling, D., and Karl, W., Nitrendipine: identification and syn-thesis of main metabolites, Arzneim. -Forsch., 33, 1528, 1983.
283. Meyer, H., Wehinger, E., Bossert, F., and Scherling, D., Nimodipine: synthesisand metabolic pathway, Arzneim. -Forsch., 33, 106, 1983.
284. Scherling, D., Buhner, K., Krause, H.P., Karl, W., and Wunsche, C., Biotransfor-mation of nimodipine in rat, dog, and monkey, Arzneim. -Forsch., 41, 392, 1991.
© 2004 by CRC Press LLC
1522_C01.fm Page 58 Tuesday, December 2, 2003 10:05 AM
285. Scherling, D., Karl, W., Ahr, G., Ahr, H.J., and Wehinger, E., Pharmacokineticsof nisoldipine. III. Biotransformation of nisoldipine in rat, dog, monkey, andman, Arzneim. -Forsch., 38, 1105, 1988.
286. Scherling, D., Karl, W., Ahr, H.J., Kern, A., and Siefert, H.M., Biotransforma-tion of nitrendipine in rat, dog, and mouse, Arzneim. -Forsch., 41, 1009, 1991.
287. Scherling, D., Karl, W., Radtke, M., Ahr, H.J., and Siefert, H.M., Biotransfor-mation of nifedipine in rat and dog, Arzneim. -Forsch., 42, 1292, 1992.
288. Kann, J., Krol, G.J., Raemsch, K.D., Burkholder, D.E., and Levitt, M.J.,Bioequivalence and metabolism of nitrendipine administered orally tohealthy volunteers, J. Cardiovasc. Pharmacol., 6 Suppl 7, S968, 1984.
289. Beresford, A.P., Macrae, P.V., Alker, D., and Kobylecki, R.J., Biotransformationof amlodipine. Identification and synthesis of metabolites found in rat, dogand human urine/confirmation of structures by gas chromatography–massspectrometry and liquid chromatography–mass spectrometry, Arzneim. -For-sch., 39, 201, 1989.
290. Beresford, A.P., Macrae, P.V., and Stopher, D.A., Metabolism of amlodipinein the rat and the dog: a species difference, Xenobiotica, 18, 169, 1988.
291. Beresford, A.P., Macrae, P.V., Stopher, D.A., and Wood, B.A., Analysis ofamlodipine in human plasma by gas chromatography, J. Chromatogr., 420,178, 1987.
292. Beresford, A.P., McGibney, D., Humphrey, M.J., Macrae, P.V., and Stopher, D.A.,Metabolism and kinetics of amlodipine in man, Xenobiotica, 18, 245, 1988.
293. Stopher, D.A., Beresford, A.P., Macrae, P.V., and Humphrey, M.J., The metab-olism and pharmacokinetics of amlodipine in humans and animals, J. Car-diovasc. Pharmacol., 12 Suppl 7, S55, 1988.
294. Baarnhielm, C., Backman, A., Hoffmann, K.J., and Weidolf, L., Biotransfor-mation of felodipine in liver microsomes from rat, dog, and man, Drug Metab.Dispos., 14, 613, 1986.
295. Raemsch, K.D. and Sommer, J., Pharmacokinetics and metabolism of nife-dipine, Hypertension, 5, II18, 1983.
296. Abernethy, D.R. and Schwartz, J.B., Pharmacokinetics of calcium antagonistsunder development, Clinical Pharmacokinetics, 15, 1, 1988.
297. Jean, C. and Laplanche, R., Assay of isradipine and of its major metabolitesin biological fluids by capillary gas chromatography and chemical ionizationmass spectrometry, J. Chromatogr., 428, 61, 1988.
298. Tokuma, Y., Fujiwara, T., and Noguchi, H., Determination of nilvadipine inhuman plasma by capillary column gas chromatography-negative-ion chem-ical-ionization mass spectrometry, J. Chromatogr., 345, 51, 1985.
299. Dru, J.D., Hsieh, J.Y., Matuszewski, B.K., and Dobrinska, M.R., Determina-tion of felodipine, its enantiomers, and a pyridine metabolite in humanplasma by capillary gas chromatography with mass spectrometric detection,J. Chromatogr. B, 666, 259, 1995.
© 2004 by CRC Press LLC
1522_C01.fm Page 59 Tuesday, December 2, 2003 10:05 AM
300. Tokuma, Y., Fujiwara, T., and Noguchi, H., Combined capillary column gaschromatography/electron capture negative ion chemical ionization massspectrometry of dihydropyridine calcium antagonists, Biomed. Environ. MassSpectrom., 13, 251, 1986.
301. Rosseel, M.T., Bogaert, M.G., and Huyghens, L., Determination of the cal-cium antagonist nimodipine in plasma by capillary gas chromatography andnitrogen detection, J. Chromatogr., 533, 224, 1990.
302. Van Harten, J., Lodewijks, M.T., Guyt Scholten, J.W., Van Brummelen, P., andBreimer, D.D., Gas chromatographic determination of nisoldipine and oneof its metabolites in plasma, J. Chromatogr., 423, 327, 1987.
303. Soons, P.A. and Breimer, D.D., Gas chromatographic analysis of nitrendipineand its pyridine metabolite in human plasma, J. Chromatogr., 428, 362, 1988.
304. Krol, G.J., Noe, A.J., Yeh, S.C., and Raemsch, K.D., Gas and liquid chromato-graphic analyses of nimodipine calcium antagonist in blood plasma andcerebrospinal fluid, J. Chromatogr., 305, 105, 1984.
305. Josefsson, M., Zackrisson, A.L., and Norlander, B., Sensitive high-perfor-mance liquid chromatographic analysis of amlodipine in human plasma withamperometric detection and a single-step solid-phase sample preparation,J. Chromatogr. B, 672, 310, 1995.
306. Shimooka, K., Sawada, Y., and Tatematsu, H., Analysis of amlodipine in serumby a sensitive high-performance liquid chromatographic method with amper-ometric detection, J. Pharm. Biomed. Anal., 7, 1267, 1989.
307. Boutagy, J., Rumble, F., and Dunagan, F., Determination of isradipine andthe oxidative pyridine metabolite in human plasma by high-performanceliquid chromatography, J. Chromatogr., 487, 483, 1989.
308. Uno, T., Ohkubo, T., and Sugawara, K., Enantioselective high-performanceliquid chromatographic determination of nicardipine in human plasma,J. Chromatogr. B, 698, 181, 1997.
309. Muck, W.M., Enantiospecific determination of nimodipine in human plasmaby liquid chromatography-tandem mass spectrometry, J. Chromatogr. A, 712,45, 1995.
310. Yasuda, T., Tanaka, M., and Iba, K., Quantitative determination of amlodipinein serum by liquid chromatography with atmospheric pressure chemicalionization tandem mass spectrometry, J. Mass Spectrom., 31, 879, 1996.
311. Tokuma, Y. and Noguchi, H., Stereoselective pharmacokinetics of dihydro-pyridine calcium antagonists, J. Chromatogr. A, 694, 181, 1995.
312. Ventura, R. and Segura, J., Detection of diuretic agents in doping control,J. Chromatogr. B, 687, 127, 1996.
313. Deventer, K., Delbeke, F.T., Roels, K., and Van Eenoo, P., Screening for 18diuretics and probenecid in doping analysis by liquid chromatography-tan-dem mass spectrometry, Biomed. Chromatogr., 16, 529, 2002.
© 2004 by CRC Press LLC
1522_C01.fm Page 60 Tuesday, December 2, 2003 10:05 AM
314. Thieme, D., Grosse, J., Lang, R., Mueller, R.K., and Wahl, A., Screening,confirmation and quantification of diuretics in urine for doping controlanalysis by high-performance liquid chromatography–atmospheric pressureionisation tandem mass spectrometry, J. Chromatogr. B Biomed. Sci. Appl.,757, 49, 2001.
315. Garbis, S.D., Hanley, L., and Kalita, S., Detection of thiazide-based diureticsin equine urine by liquid chromatography–mass spectrometry, J. AOAC. Int.,81, 948, 1998.
316. Ventura, R., Fraisse, D., Becchi, M., Paisse, O., and Segura, J., Approach tothe analysis of diuretics and masking agents by high-performance liquidchromatography-mass spectrometry in doping control, J. Chromatogr., 562,723, 1991.
317. Lisi, A.M., Trout, G.J., and Kazlauskas, R., Screening for diuretics in humanurine by gas chromatography-mass spectrometry with derivatisation by directextractive alkylation., J. Chromatogr., 563, 257, 1991.
318. Carreras, D., Imaz, C., Navajas, R., Garcia, M.A., Rodriguez, C., Rodriguez,A.F., and Cortes, R., Comparison of derivatization procedures for the deter-mination of diuretics in urine by gas chromatography-mass spectrometry,J. Chromatogr. A, 683, 195, 1994.
319. Maurer, H.H., Arlt, J.W., Kraemer, T., Schmitt, C.J., and Weber, A.A., Ana-lytical development for low molecular weight xenobiotic compounds, Arch.Toxicol., 19 Suppl., 189, 1997.
320. Lehr, K.H. and Damm, P., Simultaneous determination of the sulphonylureaglimepiride and its metabolites in human serum and urine by high-perfor-mance liquid chromatography after pre-column derivatization, J. Chro-matogr., 526, 497, 1990.
321. Huupponen, R., Ojala, K.P., Rouru, J., and Koulu, M., Determination ofmetformin in plasma by high-performance liquid chromatography, J. Chro-matogr., 583, 270, 1992.
322. Valdes Santurio, J.R. and Gonzalez Porto, E., Determination of glibenclamidein human plasma by solid-phase extraction and high-performance liquidchromatography, J. Chromatogr. B, 682, 364, 1996.
323. Caldwell, J., Hutt, A.J., and Fournel-Gigleux, S., The metabolic chiral inver-sion and dispositional enantioselectivity of the 2-arylpropionic acids andtheir biological consequences., Biochem. Pharmacol., 37, 105, 1988.
324. Careri, M., Manini, P., and Mori, G., Fast separation of phenolic acids innormal-phase partition chromatography, Anal. Proc., 32, 129, 1995.
325. Davies, N.M., Methods of analysis of chiral non-steroidal anti-inflammatorydrugs, J. Chromatogr. B, 691, 229, 1997.
326. Bhushan, R. and Joshi, S., TLC separation of antihistamines on silica gel platesimpregnated with transition metal ions, J. Planar Chromatogr. — Mod. TLC,9, 70, 1996.
© 2004 by CRC Press LLC
1522_C01.fm Page 61 Tuesday, December 2, 2003 10:05 AM
327. De-Kanel, J., Vickery, W.E., and Diamond, F.X., Simultaneous analysis of 14non-steroidal anti-inflammatory drugs in human serum by electrospray ion-ization-tandem mass spectrometry without chromatography, J. Am. Soc. MassSpectrom., 9, 255, 1998.
328. Maurer, H.H., Formation of Artifacts, in Mass Spectral and GC Data of Drugs,Poisons, Pesticides, Pollutants and Their Metabolites, Pfleger, K., Maurer, H.H.,and Weber, A., Eds., VCH Verlag, Weinheim, Germany, 1992, 21.
329. Kraemer, T., Weber, A.A., and Maurer, H.H., Improvement of sample prep-aration for the STA — Acceleration of acid hydrolysis and derivatizationprocedures by microwave irradiation, in Proceedings of the Xth GTFCh Sym-posium in Mosbach, Pragst, F., Ed., Helm-Verlag, Heppenheim, Germany,1997, 200.
330. Maurer, H. and Pfleger, K., Screening procedure for detecting butyrophenoneand bisfluorophenyl neuroleptics in urine using a computerized gas chro-matographic-mass spectrometric technique, J. Chromatogr., 272, 75, 1983.
331. Maurer, H. and Pfleger, K., Toxicological detection of ajmaline, prajmalineand their metabolites in urine integrated in a “general-unknown” analysisprocedure using gas chromatography-mass spectrometry, Fresenius Z. Anal.Chem., 330, 459, 1988.
© 2004 by CRC Press LLC
2
LiquidChromatography/Mass Spectrometry in Forensic Toxicology
MACIEJ J. BOGUSZ
Contents
2.1 Introduction2.2 Methodical Considerations Relevant to Forensic Analysis
2.2.1 Separation Issues 2.2.1.1 Sample Pretreatment Methods and
Matrix Suppression 2.2.1.2 Composition of the Mobile Phase and Type
of Column2.2.2 Detection Issues
2.2.2.1 Choice of Ionization Source2.2.2.2 Choice of Mass Analyzer (Q vs. QQQ vs. IT
vs. qTOF) 2.3 LC/MS Analysis of Illicit Drugs
2.3.1 Opiate Agonists 2.3.1.1 Analysis of Street Drugs2.3.1.2 Analysis of Biological Fluids
2.3.2 Amphetamine and Ecstasy 2.3.2.1 Analysis of Biological Fluids2.3.2.2 Analysis of Alternative Samples
2.3.3 Cocaine2.3.3.1 Analysis of Biological Fluids2.3.3.2 Analysis of Alternative Samples2.3.3.3 Prenatal Exposure to Cocaine
2.3.4 Cannabis2.3.4.1 Analysis of Street Drugs2.3.4.2 Analysis of Biological Fluids
2.3.5 Hallucinogens 2.3.5.1 LSD2.3.5.2 Other Hallucinogens
1522_C02.fm Page 63 Wednesday, November 12, 2003 9:36 AM
© 2004 by CRC Press LLC
2.3.6 LC/MS of Multiple Drugs of Abuse2.4 LC/MS Analysis of Therapeutic Drugs of Forensic Relevance
2.4.1 Incapacitating Drugs2.4.1.1 Benzodiazepines2.4.1.2 Ketamine
2.4.2 Antidiabetic Drugs2.4.2.1 Oral Antidiabetic Drugs2.4.2.2 Insulin
2.4.3 Muscle Relaxants2.4.4 Antidepressant and Antipsychotic Drugs2.4.5 Other Therapeutic Compounds of Forensic Relevance
2.5 LC/MS Analysis of Natural Compounds of Forensic Relevance2.6 Screening LC/MS Procedures in Forensic Toxicology
2.6.1 Group Screening for Pharmacologically RelatedSubstances
2.6.2 General Undirected Screening2.6.2.1 Undirected Screening Using LC/MS
Procedures2.6.2.2 Undirected Screening using LC/MS/MS
Procedures (QQQ, qTOF, and qIT)2.7 Perspectives and Future TrendsReferences
2.1 Introduction
Toxicology may be generally defined as a scientific search for a causal rela-tionship between exposure to a given compound and observed biologicaleffect. Analytical toxicology provides all the technically refined tools indis-pensable for detection of toxic compounds or — in other words — for theassessment of the exposure. These tools, as well as the whole analyticalstrategy, may be different in various toxicological disciplines. In forensictoxicology, only those methods may be successfully applied which combineefficient separation of the relevant compound from the biological matrixwith the most specific detection. LC/MS fulfils the requirements of forensictoxicological analysis due to high selectivity, possibility of detection of activemetabolites, and efficient screening in unclear death cases. For this reason,also, due to gradual introduction of low-cost LC/MS instruments, this tech-nique is now finding an increasingly important place in forensic toxicolog-ical laboratories.
LC/MS underwent major evolution in the last decade. From an expen-sive, difficult, and not always reliable hyphenated technique, it changed to
1522_C02.fm Page 64 Wednesday, November 12, 2003 9:36 AM
© 2004 by CRC Press LLC
a robust analytical tool, applicable in almost all analytical situations. Thiswas caused by the introduction of atmospheric pressure ionization (API)sources. The advent of API/LC/MS converted all earlier LC/MS interfaceslike thermospray and particle beam ionization of fast atom bombardmentto obsolete techniques.
The statement of Krull and Cohen may illustrate the dimension ofthis change:
There are at least two fundamental views on the future role of MSin biotechnology HPLC. Is the mass spectrometer an expensivesophisticated LC detector? Or, is the chromatograph an expensivesample-preparation device for a mass spectrometer? One of thenewer developments in LC/MS is that this distinction will ceaseto be important in the future.
1
The change of the status of LC/MS from hyphenated method to routineanalytical tool attracted a new generation of users, who are taking thehyphenation for granted and treat a LC/MS instrument as a single unit.Similar evolution was observed for GC/MS in the past. Technical andmethodical progress in LC/MS in the last few years was reviewed in severalbooks and publications.
2–4
Special reviews were devoted to application ofLC/MS in forensic toxicology.
5–9
2.2 Methodical Considerations Relevant to
Forensic Analysis
Recent years have seen some publications on the general aspects of LC/MSthat are of relevance for forensic toxicological analysis. These studies con-cerned the quality of the sample and its influence on the chromatographicsignal, optimization of chromatographic analysis, application of various ion-ization sources, and various mass analyzers in toxicology.
2.2.1 Separation Issues
2.2.1.1 Sample Pretreatment Methods and Matrix Suppression
It is common knowledge that poor sample preparation procedure may ruinany detection, even under the application of most modern and sophisticatedtechniques. This is valid also for LC/MS. It should be noted that in the earlierphase of application some authors tried to apply LC/MS/MS in a flow-injection mode, i.e., the extracts of serum or urine were directly injected intoAPI/MS without chromatographic separation. This procedure was checked
1522_C02.fm Page 65 Wednesday, November 12, 2003 9:36 AM
© 2004 by CRC Press LLC
only for a limited number of drugs (morphine, codeine, amphetamine, andbenzoylecgonine) and potentially interfering compounds. Additionally, thematrix effects were not recognized.
10
Müller et al.
11
studied the effect of coextracted serum matrix on the signalof test substances — codeine (as a positive ion) and glafenine (as a negativeion). Severe ion suppression was observed for both ionization methods afterthe injection of serum matrix originating from protein precipitation and SPE.Less suppression was observed in the case of solvent extraction, while thecombination of protein precipitation with SPE caused no suppression. Theauthors stated that the suppression effects were caused by polar, nonretainedmatrix components appearing on the beginning of the chromatogram.
Zhou et al.
12
carried out a systematic study on the relation of matrixsuppression to the extraction methods, chromatographic conditions, andconcentration of analytes. In this study, blank serum matrix samples wereinjected into the HPLC column with the postcolumn infusion of four testcompounds at three concentration levels. The areas of suppression werelocated along the whole chromatogram. On the solvent front, salt and otherpolar unretained species were present. Other endogenous compounds wereeluted later, sometimes in very high concentrations, causing severe ion sup-pression which was independent of the analyte concentration.
Avery compared the ion suppression effects caused by extracts of humanand animal (rat, dog, monkey, rabbit, and guinea pig) plasma.
13
Theresponses for analyte and internal standard were measured in isocratic andgradient elution, using APCI and ionspray ionization sources. It was statedthat each species showed different suppression. Therefore, the validationshould be performed with samples originating from the same species.
Tang et al.
14
studied matrix effects in postcolumn-infusion experiments.Extracted blanks were injected while the ion transitions of the infused ana-lytes were monitored. Both suppression and enhancement of ionization wasobserved. These phenomena were compensated by changing the ionizationenergy, ionization source (ACPI instead of ESI), sample pretreatmentmethod, or by including matrix ions in acquisition methods.
Bansal and Liang introduced two novel terms to assess the matrix effectin an LC/MS/MS assay. Matrix factor (MF) is calculated from the ratio ofpeak area of pure analyte to the peak area of the analyte injected togetherwith blank matrix. Extraction uniformity (EU) is the ratio of the extractionefficiency of analyte to that of internal standard. If the EU was close to 1, itwas possible to perform the validation for the same matrix from differentspecies.
15
Some authors applied column switching as a method to minimizethe influence of matrix compounds. Sun et al.
16
applied protein precipitationin a 96-well format as a sample pretreatment method for the determinationof nicotine and cotinine in plasma with LC/MS/MS. In order to avoid matrix
1522_C02.fm Page 66 Wednesday, November 12, 2003 9:36 AM
© 2004 by CRC Press LLC
ion suppression from late-eluting components, a dual-column switching sys-tem was applied and the analysis time was shortened to 2.5 min. Columnswitching after homogenization and protein precipitation was applied fordetermination of various drugs (benzodiazepines, felodipine, nitrendipine,nicardipine) in animal tissues to study drug distribution. The drugs wereseparated on short (2.1
¥
10 mm) columns and analyzed with ESI orACPI/MS/MS.
17
From all above-mentioned studies, two general conclusions may bedrawn: the extracts should be of high quality, and the chromatographicseparation should not be neglected or sacrificed. LC/MS is not the panaceathat will replace the optimal sample pretreatment and separation.
2.2.1.2 Composition of the Mobile Phase and Type of Column
The composition of the mobile phase may greatly affect the sensitivity ofLC/MS analysis. Temesi and Law
18
studied the influence of mobile phaseon electrospray response in ESI/MS, using 35 various acidic, neutral, andbasic drugs as test substances. Methanol and ACN were used as organicmodifiers, and ammonium acetate, ammonium formate, and TFA were usedas electrolytes. Generally, in the positive ionization mode, methanol gavestronger signals than ACN. Electrospray response decreased with increasingconcentration of ammonium acetate/formate. Very large quantitative indi-vidual differences between drugs were observed. The authors concludedthat a thorough optimization of all eluent parameters is essential for singleanalyte analysis.
According to Naidong et al.,
19
reversed-phase chromatography, althoughwidely used, is less compatible with MS/MS detection than normal-phasechromatography. This is particularly true for highly polar compounds, whichare hardly retained on reversed-phase columns, even on the mobile phasecontaining mostly water. A low percentage of organic phase modifier affectsthe sensitivity due to nonoptimal spraying conditions. Conversely, normal-phase columns are used with a mobile phase containing high percentage oforganic solvent, assuring better dispersing and evaporation of electrospraydroplets. That was demonstrated in series of comparative experiments withnicotine, cotinine, and albuterol, analyzed with LC/ESI/MS/MS after separa-tion on C18 and silica columns. The mobile phase for a reversed-phasecolumn contained 10% acetonitrile, and for a normal-phase column, 70%acetonitrile. The sensitivity observed after normal-phase separation was dis-tinctly higher due to the longer retention times of polar analytes and theseparation from matrix compounds causing ion suppression. A similarapproach was used by the same group of authors for the analysis of morphineand its glucuronides in serum,
20,21
for fentanyl,
22
and for hydrocodone/hydro-morphone.
23
The combination of straight-phase short (50
¥
3 mm) column
1522_C02.fm Page 67 Wednesday, November 12, 2003 9:36 AM
© 2004 by CRC Press LLC
and high flow rate (4 ml/min) allowed achieving ultrafast analysis (below 1min) of nonpolar and polar analytes like morphine and its glucuronides andmidazolam and its hydroxylated metabolites with LC/MS/MS.
24
Recently,Naidong et al.
25
eliminated evaporation and reconstitution steps in 96-wellSPE. This was possible due to application of straight-phase LC/MS/MS, wherethe eluting solvent was compatible for injection into mobile phase containinghigh percentage of organic solvent. Such an approach allowed processing abatch of 96 samples (containing, e.g., fentanyl, omeprazole, or pseudoephe-drine) in 1 h.
Zweigenbaum et al.
26
demonstrated the feasibility of rapid sample prep-aration and fast analysis by LC/ESI/MS/MS. As model drugs, six benzodiaz-epine derivatives were used. The drugs were extracted from plasma using 96-well plates and separated on C18 column (15 mm
¥
2.1 mm, particle size 3
m
m) in less than 30 sec. As a result, 1152 samples could be analyzed in lessthan 12 h. Cheng et al.
27
studied the possibility of the rapid LC/MS/MSanalysis of a mixture of various compounds. Amitriptyline, ibuprofen,lidocaine, naproxen, and prednisolone were used as model drugs. Fromtheoretical considerations, a column capable of ultrafast liquid chromatog-raphy should provide a good peak capacity at a short gradient run time andhigh flow rate. The study was done on XTerra MS C18 columns 20 mm
¥
2.1 mm, 2.5
m
m, 30 mm
¥
2.1 mm, 3.5
m
m, and 50 mm
¥
2.1 mm, 5.0
m
m.The drugs were eluted in acetonitrile–acid or acetonitrile–base gradient. Thegradient duration time (5 to 100% ACN) was 0.7 to 1.7 min, and the flowrate was 1.5 ml/min. MS/MS and UV detection was applied. In these condi-tions the drug mixture was separated in less than 1 min. The study of elec-trospray response at different pH values showed that one of the drugsexamined (lidocaine) did not follow the rules of electrospray theory. Theauthors stated that the optimization for particular drugs should be donechecking different solvents, buffer types, and pH values since the best resultsare sometimes achieved outside the expected range.
2.2.2 Detection Issues
2.2.2.1 Choice of Ionization Source
In the scientific literature, a general trend could be observed regarding theuse of electrospray ionization in toxicological analysis. Most probably, this iscaused by an overwhelming use of this source in the LC/MS of large mole-cules. However, the choice of ESI or APCI may be of relevance for particularsubstances. As a rule, the response of ESI for very polar substances is higherthan that of APCI. On the other hand, less polar compounds, including amajority of parent drugs, need an active ionization mode for better detect-ability. It is therefore a good practice to try both ionization sources in the
1522_C02.fm Page 68 Wednesday, November 12, 2003 9:36 AM
© 2004 by CRC Press LLC
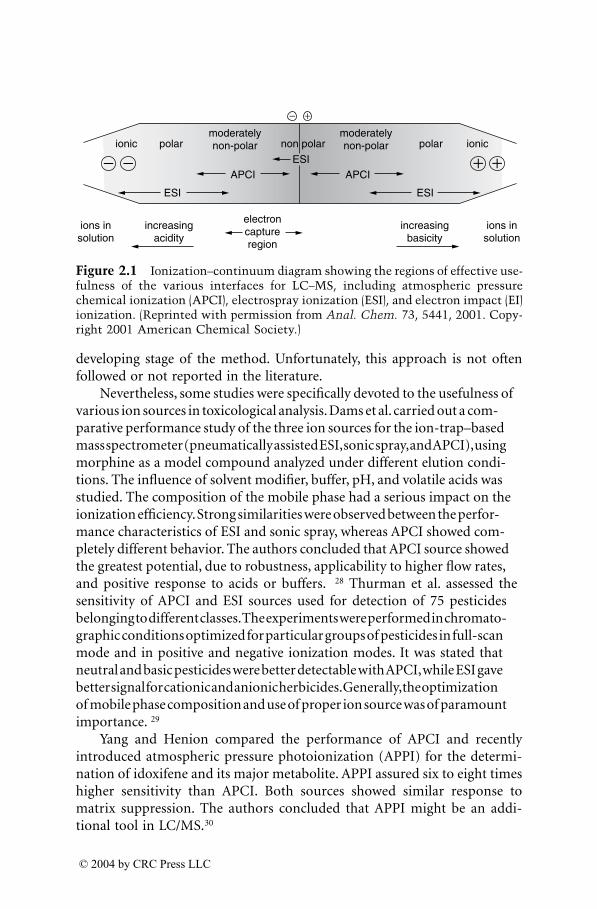
developing stage of the method. Unfortunately, this approach is not oftenfollowed or not reported in the literature.
Nevertheless, some studies were specifically devoted to the usefulness ofvarious ion sources in toxicological analysis. Dams et al. carried out a com-parative performance study of the three ion sources for the ion-trap–basedmass spectrometer (pneumatically assisted ESI, sonic spray, and APCI), usingmorphine as a model compound analyzed under different elution condi-tions. The influence of solvent modifier, buffer, pH, and volatile acids wasstudied. The composition of the mobile phase had a serious impact on theionization efficiency. Strong similarities were observed between the perfor-mance characteristics of ESI and sonic spray, whereas APCI showed com-pletely different behavior. The authors concluded that APCI source showedthe greatest potential, due to robustness, applicability to higher flow rates,and positive response to acids or buffers.
28
Thurman et al. assessed thesensitivity of APCI and ESI sources used for detection of 75 pesticidesbelonging to different classes. The experiments were performed in chromato-graphic conditions optimized for particular groups of pesticides in full-scanmode and in positive and negative ionization modes. It was stated thatneutral and basic pesticides were better detectable with APCI, while ESI gavebetter signal for cationic and anionic herbicides. Generally, the optimizationof mobile phase composition and use of proper ion source was of paramountimportance.
29
Yang and Henion compared the performance of APCI and recentlyintroduced atmospheric pressure photoionization (APPI) for the determi-nation of idoxifene and its major metabolite. APPI assured six to eight timeshigher sensitivity than APCI. Both sources showed similar response tomatrix suppression. The authors concluded that APPI might be an addi-tional tool in LC/MS.
30
Figure 2.1
Ionization–continuum diagram showing the regions of effective use-fulness of the various interfaces for LC–MS, including atmospheric pressurechemical ionization (APCI), electrospray ionization (ESI), and electron impact (EI)ionization. (Reprinted with permission from
Anal. Chem.
73, 5441, 2001. Copy-right 2001 American Chemical Society.)
−
− − + +
+
ions insolution
ions insolution
increasingacidity
increasingbasicity
electroncaptureregion
ionic polar polar ionic
ESI ESI
APCI APCI
ESI
non polarmoderatelynon-polar
moderatelynon-polar
1522_C02.fm Page 69 Wednesday, November 12, 2003 9:36 AM
© 2004 by CRC Press LLC
New possibilities of LC/APCI/MS were demonstrated by the group ofBlair.
31
APCI corona discharge generated low-energy electrons from thenitrogen sheath gas, which ionized suitable analytes through electron capture.This technique has been named electron capture APCI-MS and was appliedto the analysis of pentafluorobenzyl derivatives of various drugs and biomol-ecules like steroids, prostaglandins, thromboxane, and amino acids. Thesensitivity of electron capture APCI was 25- to 100-fold higher than negativeion APCI for underivatized compounds.
2.2.2.2 Choice of Mass Analyzer (Q vs. QQQ vs. ITvs. qTOF)
It goes without saying that the use of tandem mass spectrometry instead ofsingle stage quadrupole gives obvious advantages concerning specificity andsensitivity. The main obstacle of LC/MS/MS is the price. However, in the lastfew years some manufacturers launched lower-cost bench-top tandem instru-ments that may be widely applicable in forensic toxicological laboratories.
Some research groups performed comparative studies concerning vari-ous mass analyzers applied in LC/MS. Clauwaert et al.
32
applied theLC/ESI/qTOF/MS for quantitative measurements of MDMA and its metab-olite MDA in body fluids. The LOQ was 1
m
g/l and the linear dynamic rangeextended over four decades. It was concluded that this technique achievesthe linear dynamic range for LC/ESI/MS/MS. Zhang and Henion
33
comparedthe applicability of LC/ESI/qTOF/MS and LC/ESI/MS/MS for quantitativeanalysis of idoxifene in human plasma. The drug and its deuterated analogas an internal standard was isolated from plasma using a semiautomated 96-well hexane extraction and separated on a 30 mm
¥
2 mm CN column. Thiscolumn could separate target compound from the matrix, which was notpossible with the ODS column. For the TOF/MS instrument, an exact massof the protonated quasi-molecular ion was measured (
m/z
524.1441), whereasa MS/MS instrument was applied in SRM mode, using
m/z
524.2 as a parention and
m/z
97.9 as a product ion. The comparison showed that theLC/MS/MS technique was about ten times more sensitive than LC/qTOF/MS(the LOQs for idoxifene were 0.5
m
g/l and 5
m
g/l, respectively). Both methodsshowed satisfactory dynamic range. In conclusion, the authors stated thatLC/qTOF/MS might be used to complement LC/MS/MS in certain cases.Comparison between an ion trap and single-stage quadrupole mass spec-trometer was done for GC/MS by Vorce et al.
34
The authors compared thesensitivity, precision, and stability of ion ratios obtained for both mass ana-lyzers, using urine extracts spiked with amphetamine, methamphetamine,THC-carboxylic acid, phencyclidine, morphine, codeine, 6-monoacetylmor-phine, and benzoylecgonine on five concentration levels for each drug. Thesensitivity of the ion trap used in the full-scale mode was comparable to
1522_C02.fm Page 70 Wednesday, November 12, 2003 9:36 AM
© 2004 by CRC Press LLC
quadrupole, working in the selected ion monitoring mode. The advantageof the ion trap was that it provided a full spectra of substances. The ion ratioswere slightly more precise for quadrupole. These data may be also useful forthe assessment of ion trap LC/MS.
2.3 LC/MS Analysis of Illicit Drugs
2.3.1 Opiate Agonists
2.3.1.1 Analysis of Street Drugs
Dams et al.
35
applied sonic spray LC/MS (ion trap) for profiling of streetheroin samples. Chromatographic separation was performed on monolithicsilica column (chromolith performance 100
¥
4.6 mm) in gradient elutionin acetonitrile–water at a flow of 5 ml/min. A postcolumn split of 1/20 wasapplied; the analysis time was 5 min. The protonated molecular ions ofseven constituents of street heroin (morphine, codeine, 6-MAM, heroin,acetylcodeine, papaverine, noscapine, and levallorphan, used as internalstandard) were monitored. The limits of SSI/MS detection ranged from 0.25to 1 ng on-column.
2.3.1.2 Analysis of Biological Fluids
The advent of LC/MS brought very important progress in determination ofopiates and its metabolites in biological fluids. The most important opiateagonist — heroin — is very rapidly deacetylated to 6-monoacetylmorphineand consecutively to morphine. Morphine in turn is demethylated to nor-morphine. Both active heroin metabolites — morphine and normorphine —are then glucuronidated to 3- and 6-glucuronides. A similar process appliesto all natural and semi-synthetic opiates.
36
LC/MS is the only analytical tech-nique which allows specific detection of parent opiates and all polar metab-olites without derivatization and without acidic or enzymatic cleavage.
Zuccaro et al.
37
developed an LC/ESI/MS method for the simultaneousdetermination of heroin, 6-MAM, morphine, M3G, and M6G in serum. Thedrugs were extracted with SPE C
2
cartridges and separated on a straight-phase silica column in a methanol–ACN–formic acid mobile phase. Theauthors used a silica column in order to separate all substances in one rununder isocratic conditions. The LOD for heroin was 0.5
m
g/l, for 6-MAM, 4
m
g/l. The method was applied for a pharmacokinetic study on heroin-treatedmice. Bogusz et al.
38
used atmospheric pressure chemical ionizationLC/APCI/MS for a determination of heroin metabolites (6-MAM, morphine,M3G, and M6G) in blood, cerebrospinal fluid, vitreous humor, and urine ofheroin victims. The drugs were extracted with C18 cartridges; the LOD for6-MAM was 0.5
m
g/l. Low molar ratios of M3G/morphine and M6G/mor-
1522_C02.fm Page 71 Wednesday, November 12, 2003 9:36 AM
© 2004 by CRC Press LLC
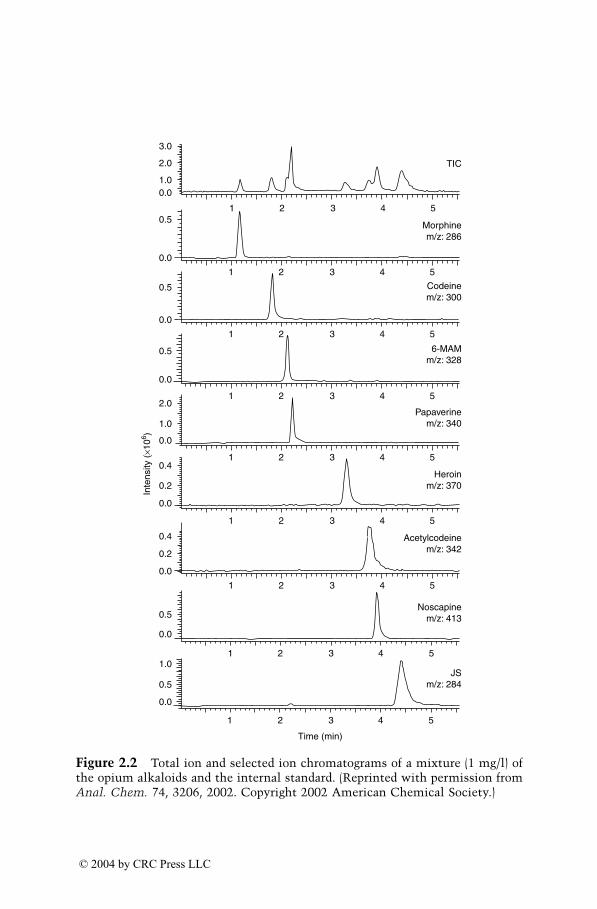
Figure 2.2
Total ion and selected ion chromatograms of a mixture (1 mg/l) ofthe opium alkaloids and the internal standard. (Reprinted with permission from
Anal. Chem.
74, 3206, 2002. Copyright 2002 American Chemical Society.)
1
0.0
2 3
Time (min)
JSm/z: 284
Noscapinem/z: 413
Acetylcodeinem/z: 342
Heroinm/z: 370
Papaverinem/z: 340
6-MAMm/z: 328
Codeinem/z: 300
Morphinem/z: 286
TIC
4 5
1 2 3 4 5
1 2 3 4 5
1 2 3 4 5
1 2 3 4 5
1 2 3 4 5
1 2 3 4 5
1 2 3 4 5
1 2 3 4 5
0.5
1.0
0.0
0.5
0.0
0.2
0.4
0.0
0.2
0.4
Inte
nsity
(×1
06 )
0.0
1.0
2.0
0.0
0.5
0.0
0.5
0.0
0.5
0.01.0
2.0
3.0
1522_C02.fm Page 72 Wednesday, November 12, 2003 9:36 AM
© 2004 by CRC Press LLC
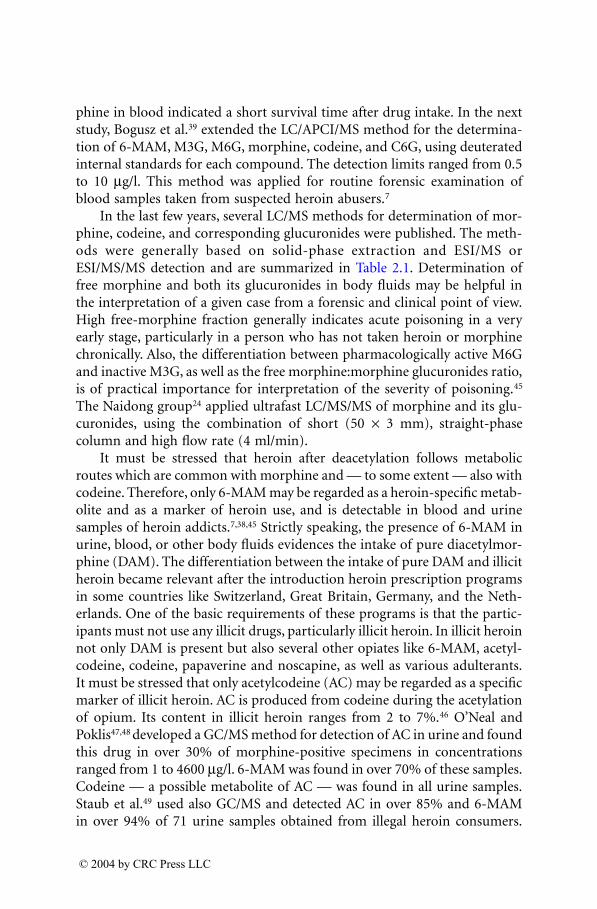
phine in blood indicated a short survival time after drug intake. In the nextstudy, Bogusz et al.
39
extended the LC/APCI/MS method for the determina-tion of 6-MAM, M3G, M6G, morphine, codeine, and C6G, using deuteratedinternal standards for each compound. The detection limits ranged from 0.5to 10
m
g/l. This method was applied for routine forensic examination ofblood samples taken from suspected heroin abusers.
7
In the last few years, several LC/MS methods for determination of mor-phine, codeine, and corresponding glucuronides were published. The meth-ods were generally based on solid-phase extraction and ESI/MS orESI/MS/MS detection and are summarized in Table 2.1. Determination offree morphine and both its glucuronides in body fluids may be helpful inthe interpretation of a given case from a forensic and clinical point of view.High free-morphine fraction generally indicates acute poisoning in a veryearly stage, particularly in a person who has not taken heroin or morphinechronically. Also, the differentiation between pharmacologically active M6Gand inactive M3G, as well as the free morphine:morphine glucuronides ratio,is of practical importance for interpretation of the severity of poisoning.
45
The Naidong group
24
applied ultrafast LC/MS/MS of morphine and its glu-curonides, using the combination of short (50
¥
3 mm), straight-phasecolumn and high flow rate (4 ml/min).
It must be stressed that heroin after deacetylation follows metabolicroutes which are common with morphine and — to some extent — also withcodeine. Therefore, only 6-MAM may be regarded as a heroin-specific metab-olite and as a marker of heroin use, and is detectable in blood and urinesamples of heroin addicts.
7,38,45
Strictly speaking, the presence of 6-MAM inurine, blood, or other body fluids evidences the intake of pure diacetylmor-phine (DAM). The differentiation between the intake of pure DAM and illicitheroin became relevant after the introduction heroin prescription programsin some countries like Switzerland, Great Britain, Germany, and the Neth-erlands. One of the basic requirements of these programs is that the partic-ipants must not use any illicit drugs, particularly illicit heroin. In illicit heroinnot only DAM is present but also several other opiates like 6-MAM, acetyl-codeine, codeine, papaverine and noscapine, as well as various adulterants.It must be stressed that only acetylcodeine (AC) may be regarded as a specificmarker of illicit heroin. AC is produced from codeine during the acetylationof opium. Its content in illicit heroin ranges from 2 to 7%.
46
O’Neal andPoklis
47,48
developed a GC/MS method for detection of AC in urine and foundthis drug in over 30% of morphine-positive specimens in concentrationsranged from 1 to 4600
m
g/l. 6-MAM was found in over 70% of these samples.Codeine — a possible metabolite of AC — was found in all urine samples.Staub et al.
49
used also GC/MS and detected AC in over 85% and 6-MAMin over 94% of 71 urine samples obtained from illegal heroin consumers.
1522_C02.fm Page 73 Wednesday, November 12, 2003 9:36 AM
© 2004 by CRC Press LLC
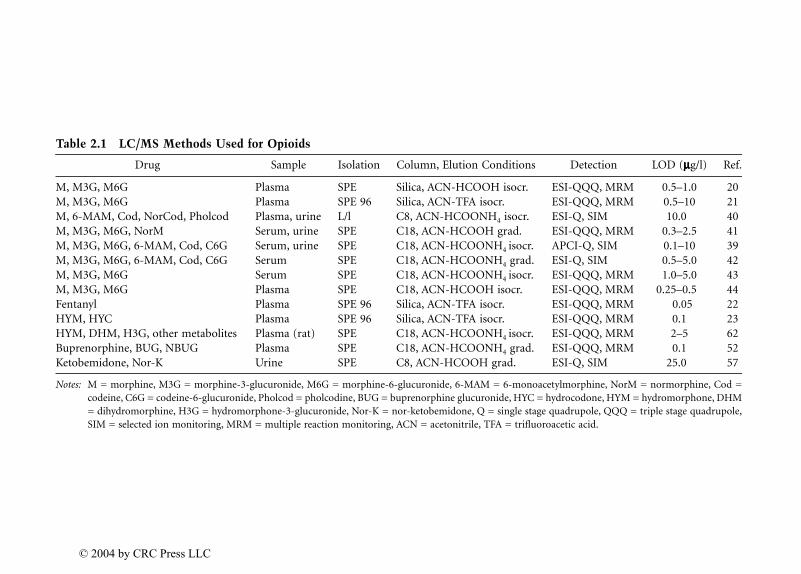
Table 2.1
LC/MS Methods Used for Opioids
Drug Sample Isolation Column, Elution Conditions Detection LOD (
mmmm
g/l) Ref.
M, M3G, M6G Plasma SPE Silica, ACN-HCOOH isocr. ESI-QQQ, MRM 0.5–1.0 20M, M3G, M6G Plasma SPE 96 Silica, ACN-TFA isocr. ESI-QQQ, MRM 0.5–10 21M, 6-MAM, Cod, NorCod, Pholcod Plasma, urine L/l C8, ACN-HCOONH
4
isocr. ESI-Q, SIM 10.0 40M, M3G, M6G, NorM Serum, urine SPE C18, ACN-HCOOH grad. ESI-QQQ, MRM 0.3–2.5 41M, M3G, M6G, 6-MAM, Cod, C6G Serum, urine SPE C18, ACN-HCOONH
4
isocr. APCI-Q, SIM 0.1–10 39M, M3G, M6G, 6-MAM, Cod, C6G Serum SPE C18, ACN-HCOONH
4
grad. ESI-Q, SIM 0.5–5.0 42M, M3G, M6G Serum SPE C18, ACN-HCOONH
4
isocr. ESI-QQQ, MRM 1.0–5.0 43M, M3G, M6G Plasma SPE C18, ACN-HCOOH isocr. ESI-QQQ, MRM 0.25–0.5 44Fentanyl Plasma SPE 96 Silica, ACN-TFA isocr. ESI-QQQ, MRM 0.05 22HYM, HYC Plasma SPE 96 Silica, ACN-TFA isocr. ESI-QQQ, MRM 0.1 23HYM, DHM, H3G, other metabolites Plasma (rat) SPE C18, ACN-HCOONH
4
isocr. ESI-QQQ, MRM 2–5 62Buprenorphine, BUG, NBUG Plasma SPE C18, ACN-HCOONH
4
grad. ESI-QQQ, MRM 0.1 52Ketobemidone, Nor-K Urine SPE C8, ACN-HCOOH grad. ESI-Q, SIM 25.0 57
Notes:
M = morphine, M3G = morphine-3-glucuronide, M6G = morphine-6-glucuronide, 6-MAM = 6-monoacetylmorphine, NorM = normorphine, Cod =codeine, C6G = codeine-6-glucuronide, Pholcod = pholcodine, BUG = buprenorphine glucuronide, HYC = hydrocodone, HYM = hydromorphone, DHM= dihydromorphine, H3G = hydromorphone-3-glucuronide, Nor-K = nor-ketobemidone, Q = single stage quadrupole, QQQ = triple stage quadrupole,SIM = selected ion monitoring, MRM = multiple reaction monitoring, ACN = acetonitrile, TFA = trifluoroacetic acid.
1522_C02.fm
Page 74 Wednesday, N
ovember 12, 2003 9:36 A
M
© 2004 by CRC Press LLC
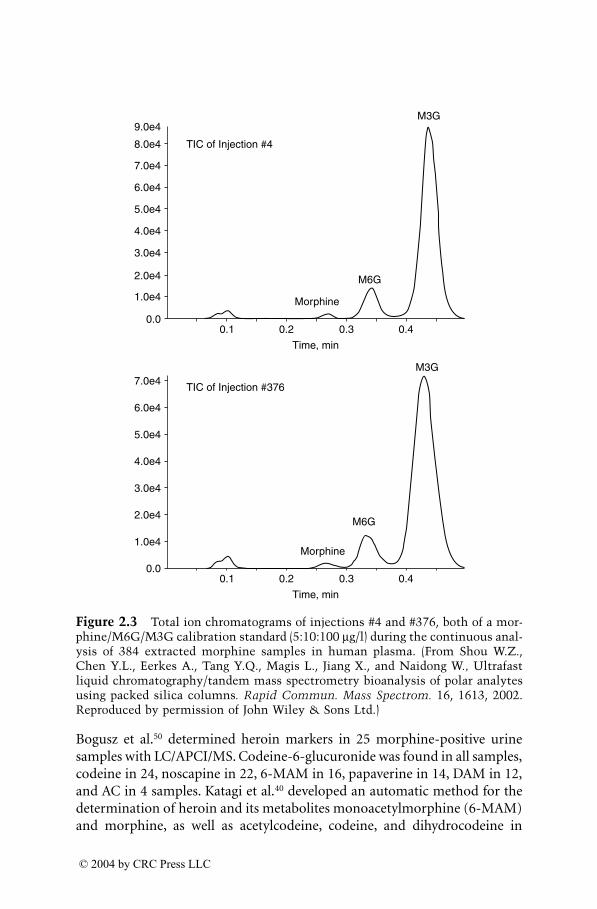
Bogusz et al.
50
determined heroin markers in 25 morphine-positive urinesamples with LC/APCI/MS. Codeine-6-glucuronide was found in all samples,codeine in 24, noscapine in 22, 6-MAM in 16, papaverine in 14, DAM in 12,and AC in 4 samples. Katagi et al.
40
developed an automatic method for thedetermination of heroin and its metabolites monoacetylmorphine (6-MAM)and morphine, as well as acetylcodeine, codeine, and dihydrocodeine in
Figure 2.3
Total ion chromatograms of injections #4 and #376, both of a mor-phine/M6G/M3G calibration standard (5:10:100
m
g/l) during the continuous anal-ysis of 384 extracted morphine samples in human plasma. (From Shou W.Z.,Chen Y.L., Eerkes A., Tang Y.Q., Magis L., Jiang X., and Naidong W
.,
Ultrafastliquid chromatography/tandem mass spectrometry bioanalysis of polar analytesusing packed silica columns
. Rapid Commun. Mass Spectrom.
16, 1613, 2002.Reproduced by permission of John Wiley & Sons Ltd.)
7.0e4
0.0
6.0e4
5.0e4
4.0e4
3.0e4
2.0e4
1.0e4
0.0
Morphine
Morphine
M6G
M6G
M3G
M3G
TIC of Injection #4
TIC of Injection #376
0.1 0.2 0.3
Time, min
0.4
0.1 0.2 0.3
Time, min
0.4
1.0e4
2.0e4
3.0e4
4.0e4
5.0e4
6.0e4
7.0e4
8.0e4
9.0e4
1522_C02.fm Page 75 Wednesday, November 12, 2003 9:36 AM
© 2004 by CRC Press LLC
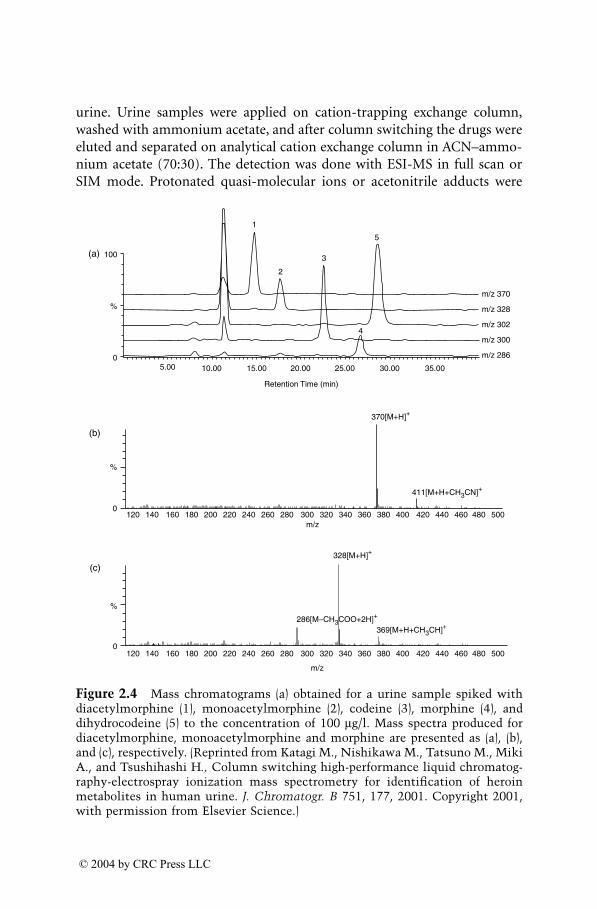
urine. Urine samples were applied on cation-trapping exchange column,washed with ammonium acetate, and after column switching the drugs wereeluted and separated on analytical cation exchange column in ACN–ammo-nium acetate (70:30). The detection was done with ESI-MS in full scan orSIM mode. Protonated quasi-molecular ions or acetonitrile adducts were
Figure 2.4
Mass chromatograms (a) obtained for a urine sample spiked withdiacetylmorphine (1), monoacetylmorphine (2), codeine (3), morphine (4), anddihydrocodeine (5) to the concentration of 100
m
g/l. Mass spectra produced fordiacetylmorphine, monoacetylmorphine and morphine are presented as (a), (b),and (c), respectively. (Reprinted from Katagi M., Nishikawa M., Tatsuno M., MikiA., and Tsushihashi H
.,
Column switching high-performance liquid chromatog-raphy-electrospray ionization mass spectrometry for identification of heroinmetabolites in human urine.
J. Chromatogr. B
751, 177, 2001. Copyright 2001,with permission from Elsevier Science.)
0
%
100(a)
1
2
3
5
4
m/z 370
m/z 328
m/z 302
m/z 300
m/z 286
5.00 10.00 15.00
Retention Time (min)
20.00 25.00 30.00 35.00
%
0
(b)
370[M+H]+
411[M+H+CH3CN]+
m/z120 140 160 180 200 220 240 260 280 300 320 340 360 380 400 420 440 460 480 500
%
0
(c)
m/z
328[M+H]+
286[M−CH3COO+2H]+
369[M+H+CH3CH]+
120 140 160 180 200 220 240 260 280 300 320 340 360 380 400 420 440 460 480 500
1522_C02.fm Page 76 Wednesday, November 12, 2003 9:36 AM
© 2004 by CRC Press LLC
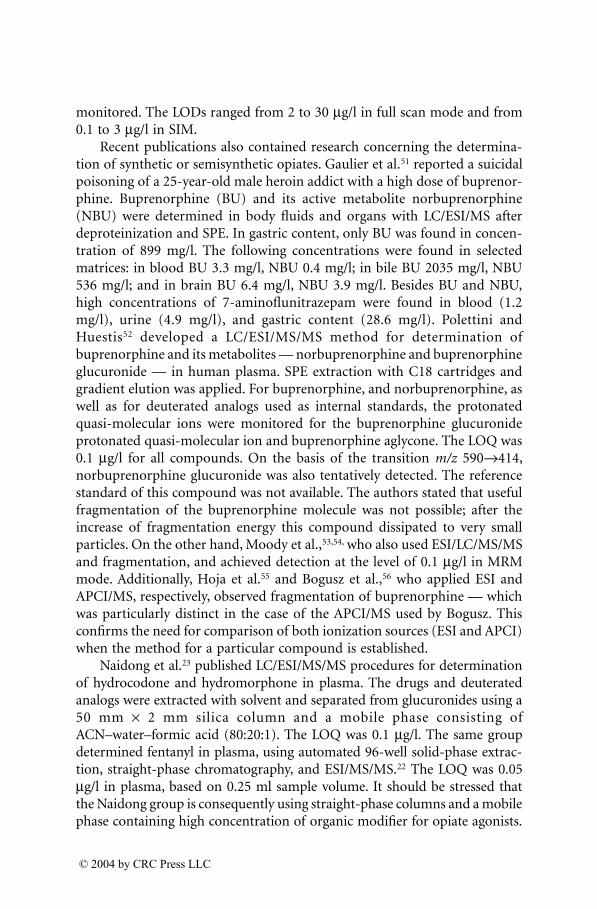
monitored. The LODs ranged from 2 to 30
m
g/l in full scan mode and from0.1 to 3
m
g/l in SIM.Recent publications also contained research concerning the determina-
tion of synthetic or semisynthetic opiates. Gaulier et al.
51
reported a suicidalpoisoning of a 25-year-old male heroin addict with a high dose of buprenor-phine. Buprenorphine (BU) and its active metabolite norbuprenorphine(NBU) were determined in body fluids and organs with LC/ESI/MS afterdeproteinization and SPE. In gastric content, only BU was found in concen-tration of 899 mg/l. The following concentrations were found in selectedmatrices: in blood BU 3.3 mg/l, NBU 0.4 mg/l; in bile BU 2035 mg/l, NBU536 mg/l; and in brain BU 6.4 mg/l, NBU 3.9 mg/l. Besides BU and NBU,high concentrations of 7-aminoflunitrazepam were found in blood (1.2mg/l), urine (4.9 mg/l), and gastric content (28.6 mg/l). Polettini andHuestis
52
developed a LC/ESI/MS/MS method for determination ofbuprenorphine and its metabolites — norbuprenorphine and buprenorphineglucuronide — in human plasma. SPE extraction with C18 cartridges andgradient elution was applied. For buprenorphine, and norbuprenorphine, aswell as for deuterated analogs used as internal standards, the protonatedquasi-molecular ions were monitored for the buprenorphine glucuronideprotonated quasi-molecular ion and buprenorphine aglycone. The LOQ was0.1
m
g/l for all compounds. On the basis of the transition
m/z
590
Æ
414,norbuprenorphine glucuronide was also tentatively detected. The referencestandard of this compound was not available. The authors stated that usefulfragmentation of the buprenorphine molecule was not possible; after theincrease of fragmentation energy this compound dissipated to very smallparticles. On the other hand, Moody et al.,
53,54,
who also used ESI/LC/MS/MSand fragmentation, and achieved detection at the level of 0.1
m
g/l in MRMmode. Additionally, Hoja et al.
55
and Bogusz et al.,
56
who applied ESI andAPCI/MS, respectively, observed fragmentation of buprenorphine — whichwas particularly distinct in the case of the APCI/MS used by Bogusz. Thisconfirms the need for comparison of both ionization sources (ESI and APCI)when the method for a particular compound is established.
Naidong et al.
23
published LC/ESI/MS/MS procedures for determinationof hydrocodone and hydromorphone in plasma. The drugs and deuteratedanalogs were extracted with solvent and separated from glucuronides using a50 mm
¥
2 mm silica column and a mobile phase consisting ofACN–water–formic acid (80:20:1). The LOQ was 0.1
m
g/l. The same groupdetermined fentanyl in plasma, using automated 96-well solid-phase extrac-tion, straight-phase chromatography, and ESI/MS/MS.
22
The LOQ was 0.05
m
g/l in plasma, based on 0.25 ml sample volume. It should be stressed thatthe Naidong group is consequently using straight-phase columns and a mobilephase containing high concentration of organic modifier for opiate agonists.
1522_C02.fm Page 77 Wednesday, November 12, 2003 9:36 AM
© 2004 by CRC Press LLC
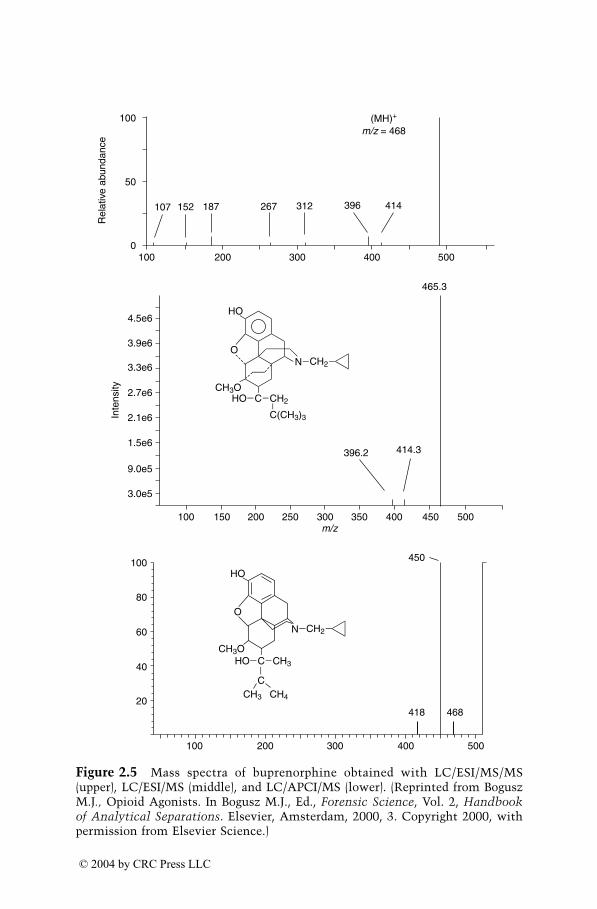
Figure 2.5
Mass spectra of buprenorphine obtained with LC/ESI/MS/MS(upper), LC/ESI/MS (middle), and LC/APCI/MS (lower). (Reprinted from BoguszM.J
.,
Opioid Agonists. In Bogusz M.J., Ed.,
Forensic Science
, Vol. 2,
Handbookof Analytical Separations
. Elsevier, Amsterdam, 2000, 3. Copyright 2000, withpermission from Elsevier Science.)
1000
4.5e6
3.9e6
3.3e6
2.7e6
2.1e6
1.5e6
9.0e5
3.0e5
100
80
60
40
20
100 200 300 400
418
450
468
500
100 150 200 250 300m/z
396.2 414.3
465.3
350 400 450 500
50
107
Rel
ativ
e ab
unda
nce
Inte
nsity
152 187 267
(MH)+
m/z = 468
312 396 414
100
200 300 400 500
ON CH2
N CH2
HO
CH3OHO C CH2
C(CH3)3
O
CH4CH3
HO
CH3OHO
C
C CH3
1522_C02.fm Page 78 Wednesday, November 12, 2003 9:36 AM
© 2004 by CRC Press LLC
Ketobemidone is a synthetic opioid agonist and narcotic analgesic whichis frequently abused, particularly in Scandinavian countries. Breindahl etal.
57
developed an LC/ESI/MS method for the determination of ketobemi-done and its demethylated metabolite in urine. Mixed-bed SPE cartridgeswere used for isolation with a recovery of over 90%. Protonated quasi-molecular ions for both substances as well as three fragments for ketobemi-done were monitored. The LOD was 25
m
g/l. Sunstrom et al.
58
appliedESI/MS/MS for determination of ketobemidone, and its five phase I metab-olites, as well as glucuronides of ketobemidone and norketobemidone inhuman urine. The same group used ESI/qTOF/MS besides LC/MS/MS forthe determination of the glucuronides of ketobemidone, nor-, andhydroxymethoxyketobemidone in urine.
59
The accuracy of the mass mea-surement was better than 2 ppm.
The enantiomers of tramadol and its active metabolite
O
-desmethyltra-madol were determined with LC/APCI/MS-MS.
60
The substances were iso-lated from plasma with automated SPE and separated on a Chiralpak ADcolumn in isohexane–ethanol–diethylamine (97:3:0.1) mobile phase. Thetransitions of protonated quasi-molecular ions of drugs and internal standard(ethyltramadol) to the same ion
m/z
58 were monitored. Also, other tramadolmetabolites could be detected. Juzwin et al.
61
determined tramadol
N
-oxideand its major metabolites in the plasma of experimental animals, usingLC/ESI/MS/MS. The LOQ was 6
m
g/l and the method was applied for pre-clinical studies.
Methadone is a synthetic opioid of very long elimination half-life (15 to55 h) which is used mainly as a heroin substitute in the treatment of heroinaddicts. Methadone is metabolized to inactive 2-ethylidene-1,5-dimethyl-3,3-diphenylpyrrolidine (EDDP) and, to a lesser extent, to 2-ethyl-5-methyl-3,3-diphenyl-1-pyrroline (EMDP). All these compounds contain a chiralcenter, and the enantiomers could be separated. This is of pharmacologicalrelevance since (
R
)-(–)-methadone (levomethadone) is 25 to 50 times morepotent than the (
S
)-(+)-methadone. Commercial methadone preparationsmay contain the racemic form or levomethadone. Kintz et al.
63
published thefirst ESI/LC/MS method for enantioselective separation of methadone andEDDP in hair, using deuterated analogs of all compounds for quantitation.The results showed that the (
R
)-(–)-methadone is preferably deposited inhuman hair. Ortelli et al.
64
applied LC/MS for enantioselective determinationof methadone in saliva and serum. The method was applied for the analysisof samples taken from heroin addicts participating in methadone mainte-nance program. Disposition of methadone after nasal, intravenous, and oralapplication to volunteers was measured by LC/MS.
65
The parent drug andEDDP were measured in blood, showing high bioavailability of methadoneby the nasal route.
1522_C02.fm Page 79 Wednesday, November 12, 2003 9:36 AM
© 2004 by CRC Press LLC
2.3.2 Amphetamine and Ecstasy
Amphetamine and methamphetamine are powerful stimulants used for over100 years. Some of their methylenedioxy analogs like methylene-dioxymethamphetamine (MDMA), methylenedioxyethylamphetamine(MDEA) or methylenedioxyamphetamine (MDA) were already synthesizedin 1914 and tested in treatment of psychiatric disorders. In contrast toamphetamine, MDMA did not become widely abused until the late 1970s.This drug is known under the names “Ecstasy,” “XTC,” and “Adam.” Para-doxically, the widespread abuse of psychoactive phenethylamines was prop-agated by eminent pharmacologist Alexander Shulgin who, in his book
Pihkal
,
A Chemical Love Story
,
66
published procedures for synthesizing 179various drugs of this group. Also, the information concerning recommendeddosages and expected symptoms was given. The book is freely available andcertainly helped to proliferate psychoactive phenethylamines in the society.Amphetamine derivatives are usually manufactured as tablets and distributedillegally in discotheques. These drugs, besides stimulating action, may alterthermoregulation, and they caused a growing number of death cases, mainlydue to heat stroke at rave parties.
67–69
It must be stressed that the recreationaluse of Ecstasy is very often associated with consumption of other psychotro-pic drugs or alcohol. A review of 81 Ecstasy-related death cases in England,as well as examination of urine samples taken from 64 attendees of raveparties, revealed that in the majority of cases, MDMA was present in com-bination with amphetamine, methamphetamine, other designer amphet-amines, or opiates.
69,70
This suggests that the majority of the ravers are multi-drug users. A similar observation was also made by Bogusz.
7
2.3.2.1 Analysis of Biological Fluids
Bogusz et al. compared the sensitivity of UV/DAD and APCI/MS detectionfor amphetamines. Amphetamine, methamphetamine, MDMA, MDA, andMDEA, as well as eight other phenethylamines, were extracted with etherfrom serum and urine, derivatized with phenylisothiocyanate and subjectedto HPLC with APCI/MS or UV/DAD detection. LC/APCI/MS assured about10 times higher detection than UV with LODs ranged from 1 to 5
m
g/l.
71
Inthe next study of the same group,
72
the derivatization, as well as diode arraydetection, was abandoned. Fourteen amphetamines and related compoundswere isolated from biofluids with SPE cartridges and subjected toLC/APCI/MS examination in SIM mode. Again, the limit of detectionranged from 1 to 5
m
g/l. This method was applied in routine casework.
47
Kataoka et al.
73
applied SPME for isolation of amphetamine, methamphet-amine, MDMA, MDEA, and MDA from urine. The drugs were desorbed bymobile-phase flow and detected with ESI/MS (SIM), with a LOD below1
m
g/l urine.
1522_C02.fm Page 80 Wednesday, November 12, 2003 9:36 AM
© 2004 by CRC Press LLC
Clauwaert et al.
32
applied the LC/ESI/TOF/MS for quantitative measure-ments of MDMA and its metabolite MDA in whole blood, serum, vitreoushumor, and urine. The LOQ was 1
m
g/l and the linear dynamic rangeextended over four decades. It was concluded that this technique achievesthe linear dynamic range for LC/ESI/MS/MS. The same group determinedMDMA, MDEA, and MDA in whole blood, urine, and vitreous humor ofrabbits using HPLC with fluorometric and tandem mass spectrometric detec-tion. The LOD for fluorometric detection was 0.8
m
g/l in blood and 2
m
g/lin urine. Very good correlation between both methods was found. The meth-ods were used for a thanatochemical distribution study in rabbits.
74
Paramethoxyamphetamine (PMA) is a new designer amphetamine ofrelatively high toxicity. Mortier et al.
75
described the method for determina-tion of PMA together with amphetamine, MDMA, MDEA, and MDA inbiological fluids. Solvent extraction followed by sonic spray LC/MS(IT) wasapplied. The matrix suppression was measured and was negligible for humanurine and liver or kidney.
Several therapeutic drugs act as amphetamine/methamphetamine pre-cursors, and it is important to differentiate between the administration ofthese drugs and illicit preparations. LC/MS has been applied for these pur-poses. Benzphetamine (BMA) and its metabolites benzylamphetamine,hydroxybenzphetamine, hydroxybenzylamphetamine, methamphetamine,and amphetamine were isolated from urine with SPE, separated on an alka-line mobile phase and detected with ESI/MS (SIM). The LODs were from0.3 to 10
m
g/l urine.
76
This method allowed discrimination of the ingestionof BMA, amphetamine, and methamphetamine. Dimethylamphetamine andits metabolites dimethylamine-
N
-oxide, methamphetamine, and amphet-amine were determined in urine by ESI/LC/MS (SIM) after isolation withSPE. LODs were 5 to 50
m
g/l urine.
77
Selegiline, an inhibitor of monoamine oxidase-B used in the treatmentof Parkinson’s disease, is metabolized to methamphetamine and amphet-amine. Katagi et al.
78
determined this drug as well as the specific metabolitesselegiline-
N
-oxide, methamphetamine, and amphetamine in human urine.All compounds were isolated from urine using SPE C18 cartridges, separatedon a cation exchange column and subjected to ESI/MS detection in full scanacquisition mode. In urine samples collected from selegiline patients, onlymetabolites were detected. The method may serve for differentiation betweenselegiline and methamphetamine intake. The excretion of selegiline-
N
-oxideafter selegiline administration in volunteers was studied with ESI/LC/MS.
79
2.3.2.2 Analysis of Alternative Samples
Wood et al.
80
applied LC/ESI/MS/MS for determination of amphetamines(amphetamine, methamphetamine, MDMA, MDA, MDEA, and ephedrine)
1522_C02.fm Page 81 Wednesday, November 12, 2003 9:36 AM
© 2004 by CRC Press LLC
in saliva. Collected saliva (50
m
l) was diluted with a 200
m
l methanolicsolution of an internal standard mixture (deuterated analogs) and centri-fuged. Supernatant was subjected to HPLC in an ACN–ammonium acetatemobile phase on a C18 column. The drugs were detected using transitionsof protonated quasi-molecular ions in optimized conditions. The LOQs were1 to 5
m
g/l. This method was used further for determination of designeramphetamines in oral fluid, sweat wipe, and plasma after controlled admin-istration of MDMA and in real life conditions (after ingestion of Ecstasytablets at a party). Toxicokinetic data were gathered, indicating very highintra- and interindividual variability of saliva results. In sweat, very lowconcentrations of MDMA were detected in the first 5 h after drug intake.
81
Stanaszek et al.
82
applied LC/APCI/MS for determination of amphetamines,as well as other drugs of abuse, in hair.
2.3.3 Cocaine
Cocaine may be administered in different ways — by smoking, intranasal(“snorting”), oral, or intravenous route. This drug is converted in the humanbody into a multitude of active and nonactive metabolites, mostly of highpolarity. These metabolites are amenable to GC/MS analysis only afterderivatization.
83
2.3.3.1 Analysis of Biological Fluids
The advent of LC/MS brought substantial progress in liquid chromatographicdetection of cocaine metabolites, which may be found without any derivati-zation with this technique. Sosnoff et al. detected BZE in dried blood spotswith tandem LC/MS.
84
A LOD of 2
m
g/l was achieved from a 12-
m
l sample.This technique was used for epidemiological screening in a study involvingnewborns. Singh et al.
85
applied acetonitrile precipitation for isolation ofcocaine and metabolites from plasma. The drugs were determined withLC/APCI/MS/MS. The LOQ was 2
m
g/l for cocaine, benzoylecgonine, andnorcocaine, and 5
m
g/l for ecgonine methyl ester. The procedure has beenapplied for pharmacokinetic study in rats. In a study of Jeanville et al. a fast-gradient ESI/LC/MS/MS was applied for automated urinalysis. Urine sampleswere only filtered and transferred into a 96-well plate before injection. Totalanalysis time was 2 min. However, the issue of possible matrix interferencewas not addressed.
86
In the next paper of Jeanville et al.,
87
centrifuged urinesamples were injected into LC/MS/MS system equipped with an on-lineextraction unit. Total analysis time was below 4 min. The LODs for EME,BZE, and cocaine were 0.5, 2, and 0.5
m
g/l, respectively. The same researchgroup studied the applicability of LC/ESI/qTOF for direct determination of
1522_C02.fm Page 82 Wednesday, November 12, 2003 9:36 AM
© 2004 by CRC Press LLC
cocaine and ecgonine methyl ester in rat plasma.
88
Similar performance asfor the triple-quadrupole instrument was observed.
Skopp et al. carried out the study on the stability of cocaine and metab-olites (benzoylecgonine, ecgonine methyl ester, and ecgonine) at differenttemperatures using LC/ESI/MS/MS.
89,90
The drugs were isolated from humanplasma by SPE and separated on a narrow-bore C8 column. For each com-pound, one product ion originating from the protonated quasi-molecularion was monitored. Only ecgonine appeared to be stable at room tempera-ture. The conversion of cocaine to final metabolite ecgonine was stoichio-metric. A validated LC/APCI/MS/MS procedure for cocaine andbenzoylecgonine in human plasma was published by Lin et al.
91
The transi-tions
m/z
304
Æ
182 and 290
Æ
168 were monitored for cocaine and ben-zoylecgonine, respectively. The LOQ was 2.5
m
g/l for both compounds.Table 2.2 presents liquid chromatographic methods published recently
for amphetamines and cocaine analysis.
2.3.3.2 Analysis of Alternative Samples
Clauwaert et al.
92
determined cocaine, benzoylecgonine, and cocaethylene inhair samples. Hair samples were hydrolyzed with HCL and extracted withConfirm HCX cartridges. The extracts were subjected to LC/ESI/MS andHPLC with fluorescence detection. The procedure was applied in 29 forensicdrug overdose cases and close agreement for results obtained from bothdetection methods was observed.
2.3.3.3 Prenatal Exposure to Cocaine
The analysis of cocaine and its metabolites in meconium, placenta, or amni-otic fluid may give a valuable indication of prenatal exposure to this drug.Xia et al.
93
established a LC/ESI/MS/MS method for the determination ofcocaine and 12 metabolites in meconium. The method was tested on 22 drug-positive meconium samples. In 21 cases the presence of at least 8 metaboliteswas stated. Ecgonine appeared to be the most sensitive marker of cocaineexposure. The same method was applied in the study on distribution ofcocaine and metabolites in blood, amniotic fluid, placental, and fetal tissuesof pregnant rats after intravenous cocaine administration.
94
2.3.4 Cannabis
2.3.4.1 Analysis of Street Drugs
Particle beam ionization (PBI) LC/MS was applied for separation and iden-tification of cannabinoids (THC, cannabinol, cannabidiol, acidic cannab-inoids) in hashish samples.
95
Quantitative data were not given. Since PBIinterface has been largely abandoned, this paper is rather of historical value.
1522_C02.fm Page 83 Wednesday, November 12, 2003 9:36 AM
© 2004 by CRC Press LLC
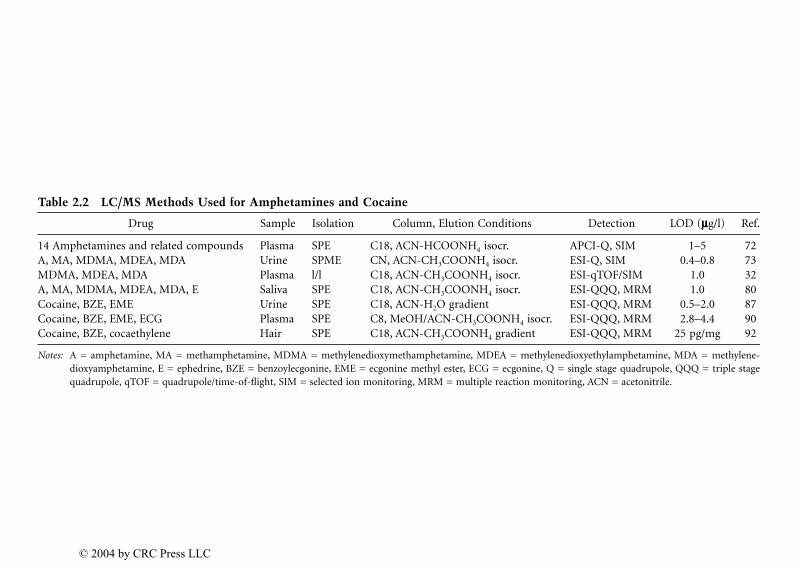
Table 2.2
LC/MS Methods Used for Amphetamines and Cocaine
Drug Sample Isolation Column, Elution Conditions Detection LOD (
mmmm
g/l) Ref.
14 Amphetamines and related compounds Plasma SPE C18, ACN-HCOONH
4
isocr. APCI-Q, SIM 1–5 72A, MA, MDMA, MDEA, MDA Urine SPME CN, ACN-CH
3
COONH4 isocr. ESI-Q, SIM 0.4–0.8 73MDMA, MDEA, MDA Plasma l/l C18, ACN-CH3COONH4 isocr. ESI-qTOF/SIM 1.0 32A, MA, MDMA, MDEA, MDA, E Saliva SPE C18, ACN-CH3COONH4 isocr. ESI-QQQ, MRM 1.0 80Cocaine, BZE, EME Urine SPE C18, ACN-H2O gradient ESI-QQQ, MRM 0.5–2.0 87Cocaine, BZE, EME, ECG Plasma SPE C8, MeOH/ACN-CH3COONH4 isocr. ESI-QQQ, MRM 2.8–4.4 90Cocaine, BZE, cocaethylene Hair SPE C18, ACN-CH3COONH4 gradient ESI-QQQ, MRM 25 pg/mg 92
Notes: A = amphetamine, MA = methamphetamine, MDMA = methylenedioxymethamphetamine, MDEA = methylenedioxyethylamphetamine, MDA = methylene-dioxyamphetamine, E = ephedrine, BZE = benzoylecgonine, EME = ecgonine methyl ester, ECG = ecgonine, Q = single stage quadrupole, QQQ = triple stagequadrupole, qTOF = quadrupole/time-of-flight, SIM = selected ion monitoring, MRM = multiple reaction monitoring, ACN = acetonitrile.
1522_C02.fm
Page 84 Wednesday, N
ovember 12, 2003 9:36 A
M
© 2004 by CRC Press LLC
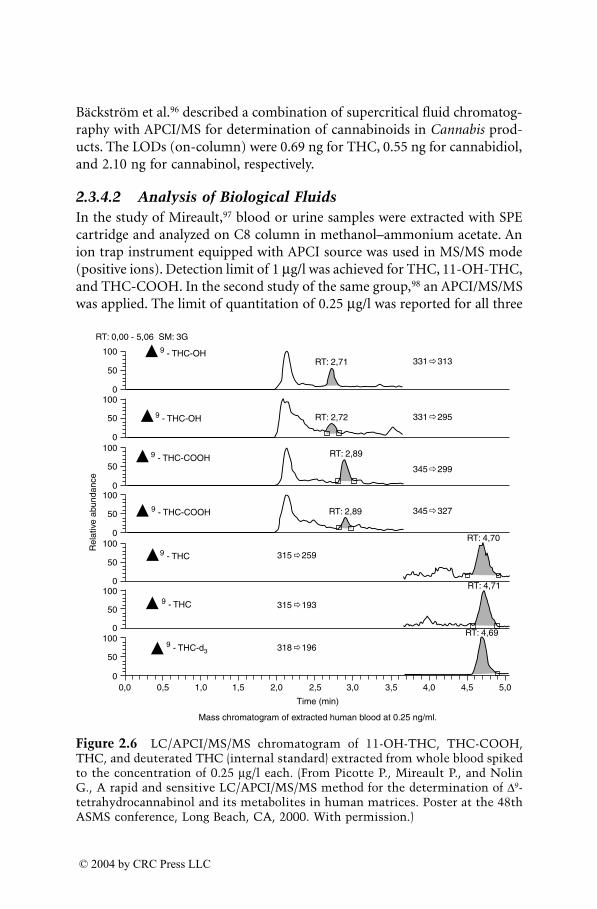
Bäckström et al.96 described a combination of supercritical fluid chromatog-raphy with APCI/MS for determination of cannabinoids in Cannabis prod-ucts. The LODs (on-column) were 0.69 ng for THC, 0.55 ng for cannabidiol,and 2.10 ng for cannabinol, respectively.
2.3.4.2 Analysis of Biological FluidsIn the study of Mireault,97 blood or urine samples were extracted with SPEcartridge and analyzed on C8 column in methanol–ammonium acetate. Anion trap instrument equipped with APCI source was used in MS/MS mode(positive ions). Detection limit of 1 mg/l was achieved for THC, 11-OH-THC,and THC-COOH. In the second study of the same group,98 an APCI/MS/MSwas applied. The limit of quantitation of 0.25 mg/l was reported for all three
Figure 2.6 LC/APCI/MS/MS chromatogram of 11-OH-THC, THC-COOH,THC, and deuterated THC (internal standard) extracted from whole blood spikedto the concentration of 0.25 mg/l each. (From Picotte P., Mireault P., and NolinG., A rapid and sensitive LC/APCI/MS/MS method for the determination of D9-tetrahydrocannabinol and its metabolites in human matrices. Poster at the 48thASMS conference, Long Beach, CA, 2000. With permission.)
0,00
50
1000
50
100
Rel
ativ
e ab
unda
nce
0
50
1000
50
1000
50
1000
50
1000
50
100RT: 2,71
RT: 2,72
RT: 2,89
RT: 2,89
RT: 4,70
RT: 4,71
RT: 4,69
RT: 0,00 - 5,06 SM: 3G
0,5 1,0 1,5 2,0
9 - THC-d3
9 - THC
9 - THC
9 - THC-COOH
9 - THC-COOH
9 - THC-OH
9 - THC-OH
Time (min)
Mass chromatogram of extracted human blood at 0.25 ng/ml.
2,5 3,0 3,5 4,0 4,5 5,0
318 196
315 193
315 259
345 327
345 299
331 295
331 313
1522_C02.fm Page 85 Wednesday, November 12, 2003 9:36 AM
© 2004 by CRC Press LLC
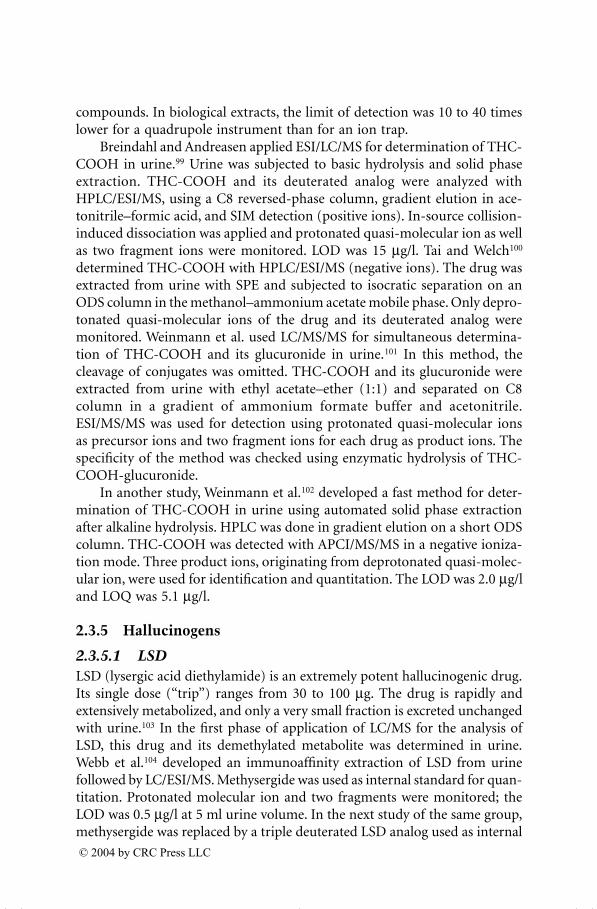
compounds. In biological extracts, the limit of detection was 10 to 40 timeslower for a quadrupole instrument than for an ion trap.
Breindahl and Andreasen applied ESI/LC/MS for determination of THC-COOH in urine.
99
Urine was subjected to basic hydrolysis and solid phaseextraction. THC-COOH and its deuterated analog were analyzed withHPLC/ESI/MS, using a C8 reversed-phase column, gradient elution in ace-tonitrile–formic acid, and SIM detection (positive ions). In-source collision-induced dissociation was applied and protonated quasi-molecular ion as wellas two fragment ions were monitored. LOD was 15
m
g/l. Tai and Welch
100
determined THC-COOH with HPLC/ESI/MS (negative ions). The drug wasextracted from urine with SPE and subjected to isocratic separation on anODS column in the methanol–ammonium acetate mobile phase. Only depro-tonated quasi-molecular ions of the drug and its deuterated analog weremonitored. Weinmann et al. used LC/MS/MS for simultaneous determina-tion of THC-COOH and its glucuronide in urine.
101
In this method, thecleavage of conjugates was omitted. THC-COOH and its glucuronide wereextracted from urine with ethyl acetate–ether (1:1) and separated on C8column in a gradient of ammonium formate buffer and acetonitrile.ESI/MS/MS was used for detection using protonated quasi-molecular ionsas precursor ions and two fragment ions for each drug as product ions. Thespecificity of the method was checked using enzymatic hydrolysis of THC-COOH-glucuronide.
In another study, Weinmann et al.
102
developed a fast method for deter-mination of THC-COOH in urine using automated solid phase extractionafter alkaline hydrolysis. HPLC was done in gradient elution on a short ODScolumn. THC-COOH was detected with APCI/MS/MS in a negative ioniza-tion mode. Three product ions, originating from deprotonated quasi-molec-ular ion, were used for identification and quantitation. The LOD was 2.0
m
g/land LOQ was 5.1
m
g/l.
2.3.5 Hallucinogens
2.3.5.1 LSD
LSD (lysergic acid diethylamide) is an extremely potent hallucinogenic drug.Its single dose (“trip”) ranges from 30 to 100
m
g. The drug is rapidly andextensively metabolized, and only a very small fraction is excreted unchangedwith urine.
103
In the first phase of application of LC/MS for the analysis ofLSD, this drug and its demethylated metabolite was determined in urine.Webb et al.
104
developed an immunoaffinity extraction of LSD from urinefollowed by LC/ESI/MS. Methysergide was used as internal standard for quan-titation. Protonated molecular ion and two fragments were monitored; theLOD was 0.5
m
g/l at 5 ml urine volume. In the next study of the same group,methysergide was replaced by a triple deuterated LSD analog used as internal
1522_C02.fm Page 86 Thursday, November 13, 2003 9:24 AM
© 2004 by CRC Press LLC
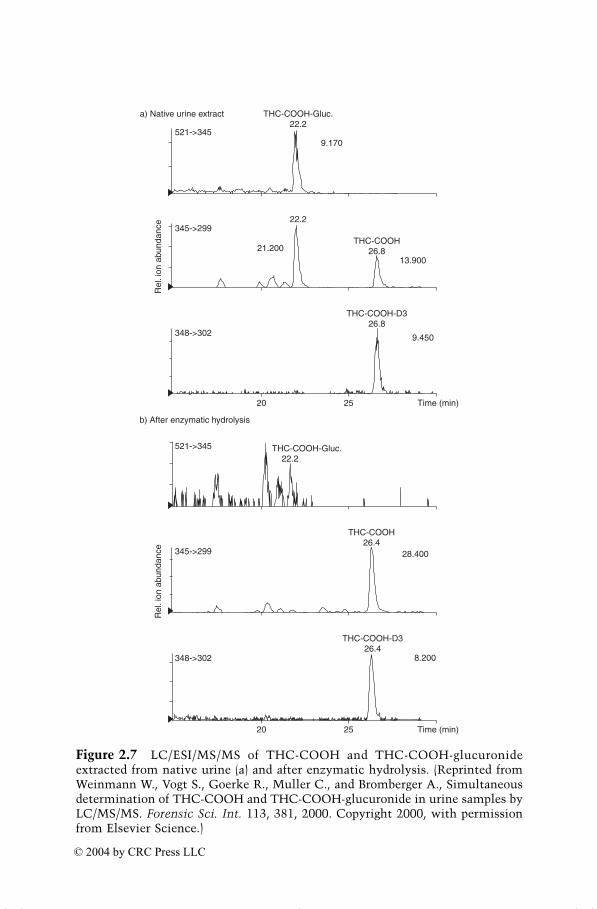
Figure 2.7
LC/ESI/MS/MS of THC-COOH and THC-COOH-glucuronideextracted from native urine (a) and after enzymatic hydrolysis. (Reprinted fromWeinmann W., Vogt S., Goerke R., Muller C., and Bromberger A., Simultaneousdetermination of THC-COOH and THC-COOH-glucuronide in urine samples byLC/MS/MS.
Forensic Sci. Int.
113, 381, 2000. Copyright 2000, with permissionfrom Elsevier Science.)
20
348->302
THC-COOH-D326.4
8.200
25 Time (min)
345->29922.2
13.90021.200
THC-COOH26.8
Rel
. ion
abu
ndan
ce
348->302 9.450
THC-COOH-D326.8
20 25 Time (min)
521->345 THC-COOH-Gluc. 22.2
b) After enzymatic hydrolysis
345->299
THC-COOH26.4
28.400
Rel
. ion
abu
ndan
ce
521->3459.170
THC-COOH-Gluc.22.2
a) Native urine extract
1522_C02.fm Page 87 Thursday, November 13, 2003 9:24 AM
© 2004 by CRC Press LLC
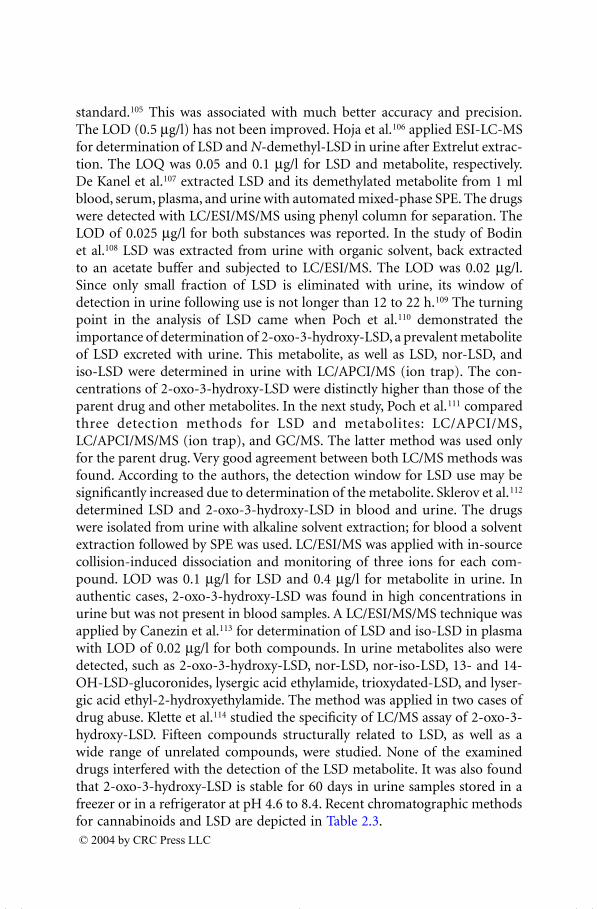
standard.
105
This was associated with much better accuracy and precision.The LOD (0.5
m
g/l) has not been improved. Hoja et al.
106
applied ESI-LC-MSfor determination of LSD and
N
-demethyl-LSD in urine after Extrelut extrac-tion. The LOQ was 0.05 and 0.1
m
g/l for LSD and metabolite, respectively.De Kanel et al.
107
extracted LSD and its demethylated metabolite from 1 mlblood, serum, plasma, and urine with automated mixed-phase SPE. The drugswere detected with LC/ESI/MS/MS using phenyl column for separation. TheLOD of 0.025
m
g/l for both substances was reported. In the study of Bodinet al.
108
LSD was extracted from urine with organic solvent, back extractedto an acetate buffer and subjected to LC/ESI/MS. The LOD was 0.02
m
g/l.Since only small fraction of LSD is eliminated with urine, its window ofdetection in urine following use is not longer than 12 to 22 h.
109
The turningpoint in the analysis of LSD came when Poch et al.
110
demonstrated theimportance of determination of 2-oxo-3-hydroxy-LSD, a prevalent metaboliteof LSD excreted with urine. This metabolite, as well as LSD, nor-LSD, andiso-LSD were determined in urine with LC/APCI/MS (ion trap). The con-centrations of 2-oxo-3-hydroxy-LSD were distinctly higher than those of theparent drug and other metabolites. In the next study, Poch et al.
111
comparedthree detection methods for LSD and metabolites: LC/APCI/MS,LC/APCI/MS/MS (ion trap), and GC/MS. The latter method was used onlyfor the parent drug. Very good agreement between both LC/MS methods wasfound. According to the authors, the detection window for LSD use may besignificantly increased due to determination of the metabolite. Sklerov et al.
112
determined LSD and 2-oxo-3-hydroxy-LSD in blood and urine. The drugswere isolated from urine with alkaline solvent extraction; for blood a solventextraction followed by SPE was used. LC/ESI/MS was applied with in-sourcecollision-induced dissociation and monitoring of three ions for each com-pound. LOD was 0.1
m
g/l for LSD and 0.4
m
g/l for metabolite in urine. Inauthentic cases, 2-oxo-3-hydroxy-LSD was found in high concentrations inurine but was not present in blood samples. A LC/ESI/MS/MS technique wasapplied by Canezin et al.
113
for determination of LSD and iso-LSD in plasmawith LOD of 0.02
m
g/l for both compounds. In urine metabolites also weredetected, such as 2-oxo-3-hydroxy-LSD, nor-LSD, nor-iso-LSD, 13- and 14-OH-LSD-glucoronides, lysergic acid ethylamide, trioxydated-LSD, and lyser-gic acid ethyl-2-hydroxyethylamide. The method was applied in two cases ofdrug abuse. Klette et al.
114
studied the specificity of LC/MS assay of 2-oxo-3-hydroxy-LSD. Fifteen compounds structurally related to LSD, as well as awide range of unrelated compounds, were studied. None of the examineddrugs interfered with the detection of the LSD metabolite. It was also foundthat 2-oxo-3-hydroxy-LSD is stable for 60 days in urine samples stored in afreezer or in a refrigerator at pH 4.6 to 8.4. Recent chromatographic methodsfor cannabinoids and LSD are depicted in Table 2.3.
1522_C02.fm Page 88 Thursday, November 13, 2003 9:24 AM
© 2004 by CRC Press LLC
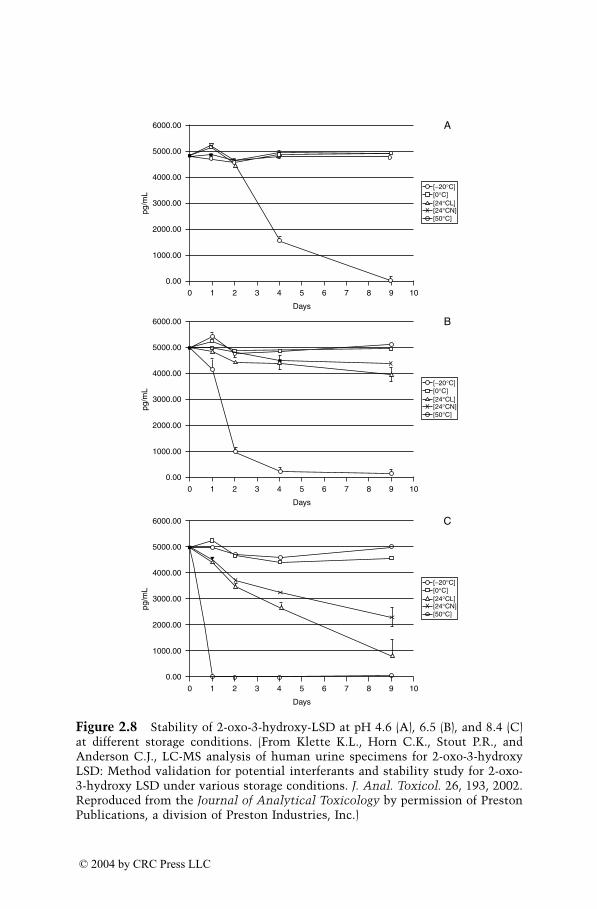
Figure 2.8 Stability of 2-oxo-3-hydroxy-LSD at pH 4.6 (A), 6.5 (B), and 8.4 (C)at different storage conditions. (From Klette K.L., Horn C.K., Stout P.R., andAnderson C.J., LC-MS analysis of human urine specimens for 2-oxo-3-hydroxyLSD: Method validation for potential interferants and stability study for 2-oxo-3-hydroxy LSD under various storage conditions. J. Anal. Toxicol. 26, 193, 2002.Reproduced from the Journal of Analytical Toxicology by permission of PrestonPublications, a division of Preston Industries, Inc.)
X
[−20°C][0°C][24°CL][24°CN][50°C]
X
X
X
6000.00
5000.00
4000.00
3000.00
2000.00
1000.00
0.00
0 1 2 3 4 5 6 7 8 9 10
pg/m
L
B
Days
[−20°C][0°C][24°CL][24°CN][50°C]
X
6000.00
5000.00
4000.00
3000.00
2000.00
1000.00
0.00
0 1 2 3 4 5 6 7 8 9 10
pg/m
L
A
Days
X [−20°C][0°C][24°CL][24°CN][50°C]
X
6000.00
5000.00
4000.00
3000.00
2000.00
1000.00
0.00
0 1 2 3 4 5 6 7 8 9 10
pg/m
L
C
Days
1522_C02.fm Page 89 Wednesday, November 12, 2003 9:36 AM
© 2004 by CRC Press LLC
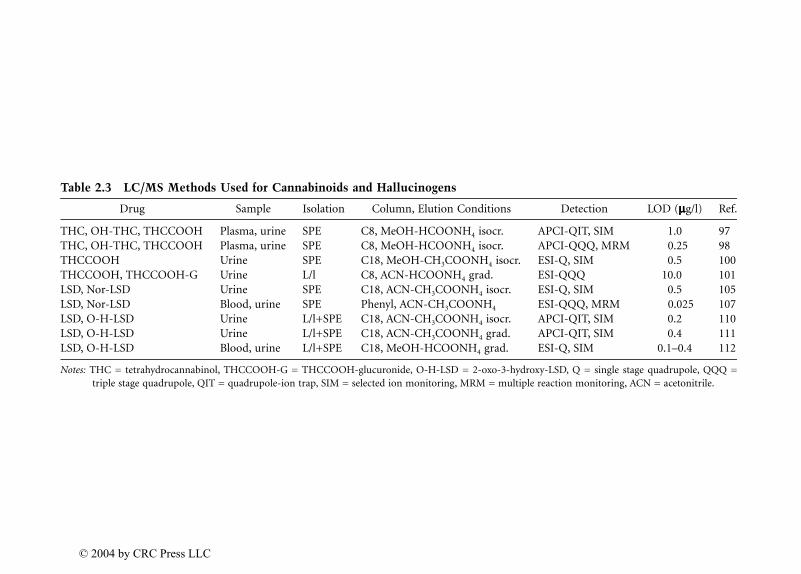
Table 2.3 LC/MS Methods Used for Cannabinoids and Hallucinogens
Drug Sample Isolation Column, Elution Conditions Detection LOD (mmmmg/l) Ref.
THC, OH-THC, THCCOOH Plasma, urine SPE C8, MeOH-HCOONH4 isocr. APCI-QIT, SIM 1.0 97THC, OH-THC, THCCOOH Plasma, urine SPE C8, MeOH-HCOONH4 isocr. APCI-QQQ, MRM 0.25 98THCCOOH Urine SPE C18, MeOH-CH3COONH4 isocr. ESI-Q, SIM 0.5 100THCCOOH, THCCOOH-G Urine L/l C8, ACN-HCOONH4 grad. ESI-QQQ 10.0 101LSD, Nor-LSD Urine SPE C18, ACN-CH3COONH4 isocr. ESI-Q, SIM 0.5 105LSD, Nor-LSD Blood, urine SPE Phenyl, ACN-CH3COONH4 ESI-QQQ, MRM 0.025 107LSD, O-H-LSD Urine L/l+SPE C18, ACN-CH3COONH4 isocr. APCI-QIT, SIM 0.2 110LSD, O-H-LSD Urine L/l+SPE C18, ACN-CH3COONH4 grad. APCI-QIT, SIM 0.4 111LSD, O-H-LSD Blood, urine L/l+SPE C18, MeOH-HCOONH4 grad. ESI-Q, SIM 0.1–0.4 112
Notes: THC = tetrahydrocannabinol, THCCOOH-G = THCCOOH-glucuronide, O-H-LSD = 2-oxo-3-hydroxy-LSD, Q = single stage quadrupole, QQQ =triple stage quadrupole, QIT = quadrupole-ion trap, SIM = selected ion monitoring, MRM = multiple reaction monitoring, ACN = acetonitrile.
1522_C02.fm
Page 90 Wednesday, N
ovember 12, 2003 9:36 A
M
© 2004 by CRC Press LLC
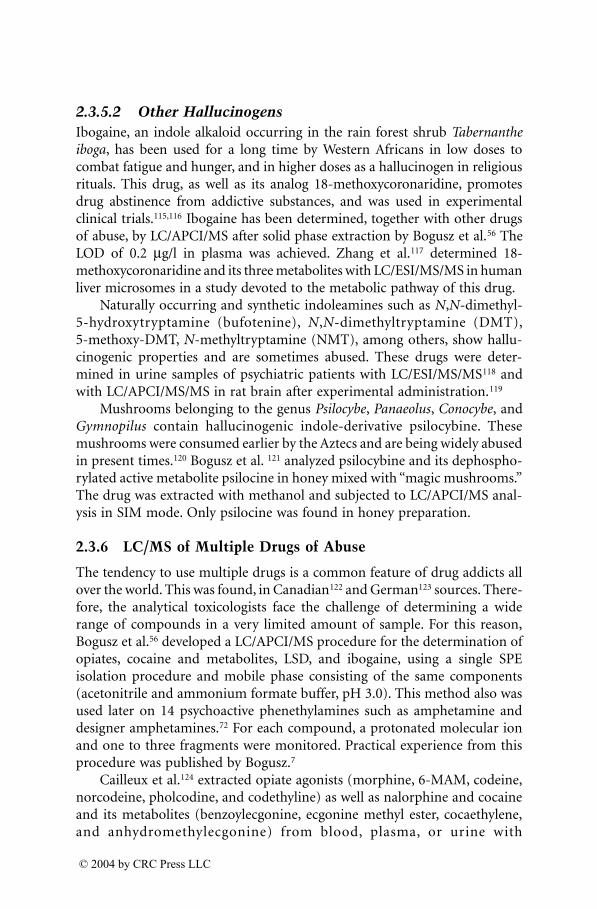
2.3.5.2 Other HallucinogensIbogaine, an indole alkaloid occurring in the rain forest shrub Tabernantheiboga, has been used for a long time by Western Africans in low doses tocombat fatigue and hunger, and in higher doses as a hallucinogen in religiousrituals. This drug, as well as its analog 18-methoxycoronaridine, promotesdrug abstinence from addictive substances, and was used in experimentalclinical trials.115,116 Ibogaine has been determined, together with other drugsof abuse, by LC/APCI/MS after solid phase extraction by Bogusz et al.56 TheLOD of 0.2 mg/l in plasma was achieved. Zhang et al.117 determined 18-methoxycoronaridine and its three metabolites with LC/ESI/MS/MS in humanliver microsomes in a study devoted to the metabolic pathway of this drug.
Naturally occurring and synthetic indoleamines such as N,N-dimethyl-5-hydroxytryptamine (bufotenine), N,N-dimethyltryptamine (DMT),5-methoxy-DMT, N-methyltryptamine (NMT), among others, show hallu-cinogenic properties and are sometimes abused. These drugs were deter-mined in urine samples of psychiatric patients with LC/ESI/MS/MS118 andwith LC/APCI/MS/MS in rat brain after experimental administration.119
Mushrooms belonging to the genus Psilocybe, Panaeolus, Conocybe, andGymnopilus contain hallucinogenic indole-derivative psilocybine. Thesemushrooms were consumed earlier by the Aztecs and are being widely abusedin present times.120 Bogusz et al. 121 analyzed psilocybine and its dephospho-rylated active metabolite psilocine in honey mixed with “magic mushrooms.”The drug was extracted with methanol and subjected to LC/APCI/MS anal-ysis in SIM mode. Only psilocine was found in honey preparation.
2.3.6 LC/MS of Multiple Drugs of Abuse
The tendency to use multiple drugs is a common feature of drug addicts allover the world. This was found, in Canadian122 and German123 sources. There-fore, the analytical toxicologists face the challenge of determining a widerange of compounds in a very limited amount of sample. For this reason,Bogusz et al.56 developed a LC/APCI/MS procedure for the determination ofopiates, cocaine and metabolites, LSD, and ibogaine, using a single SPEisolation procedure and mobile phase consisting of the same components(acetonitrile and ammonium formate buffer, pH 3.0). This method also wasused later on 14 psychoactive phenethylamines such as amphetamine anddesigner amphetamines.72 For each compound, a protonated molecular ionand one to three fragments were monitored. Practical experience from thisprocedure was published by Bogusz.7
Cailleux et al.124 extracted opiate agonists (morphine, 6-MAM, codeine,norcodeine, pholcodine, and codethyline) as well as nalorphine and cocaineand its metabolites (benzoylecgonine, ecgonine methyl ester, cocaethylene,and anhydromethylecgonine) from blood, plasma, or urine with
1522_C02.fm Page 91 Wednesday, November 12, 2003 9:36 AM
© 2004 by CRC Press LLC
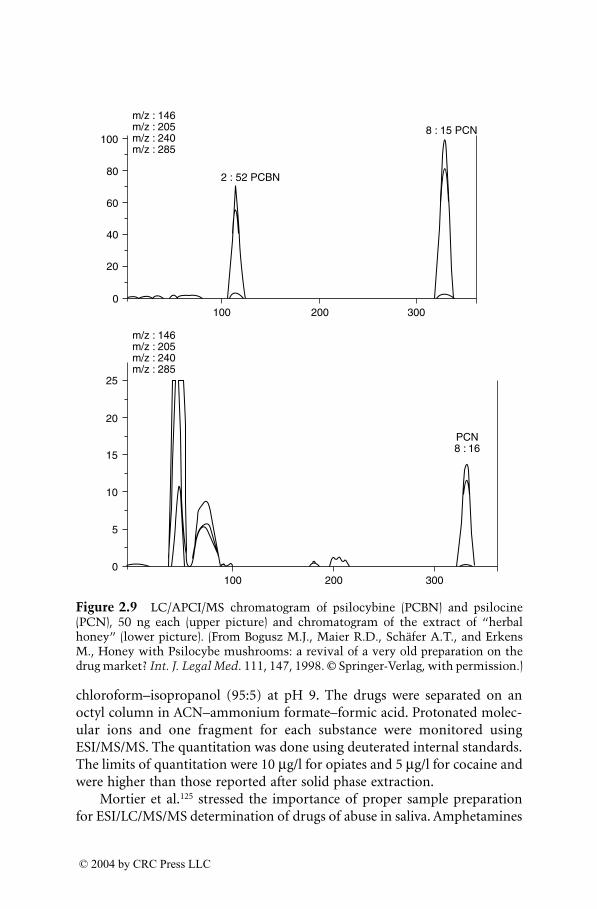
chloroform–isopropanol (95:5) at pH 9. The drugs were separated on anoctyl column in ACN–ammonium formate–formic acid. Protonated molec-ular ions and one fragment for each substance were monitored usingESI/MS/MS. The quantitation was done using deuterated internal standards.The limits of quantitation were 10 mg/l for opiates and 5 mg/l for cocaine andwere higher than those reported after solid phase extraction.
Mortier et al.125 stressed the importance of proper sample preparationfor ESI/LC/MS/MS determination of drugs of abuse in saliva. Amphetamines
Figure 2.9 LC/APCI/MS chromatogram of psilocybine (PCBN) and psilocine(PCN), 50 ng each (upper picture) and chromatogram of the extract of “herbalhoney” (lower picture). (From Bogusz M.J., Maier R.D., Schäfer A.T., and ErkensM., Honey with Psilocybe mushrooms: a revival of a very old preparation on thedrug market? Int. J. Legal Med. 111, 147, 1998. © Springer-Verlag, with permission.)
m/z : 146m/z : 205m/z : 240m/z : 285
25
20
15
10
5
0100 200 300
PCN8 : 16
m/z : 146m/z : 205m/z : 240m/z : 285
100
80
60
40
20
0100 200 300
8 : 15 PCN
2 : 52 PCBN
1522_C02.fm Page 92 Wednesday, November 12, 2003 9:36 AM
© 2004 by CRC Press LLC
(amphetamine, methamphetamine, MDMA, MDEA, and MDA), and opiates(morphine, codeine, 6-MAM), as well as cocaine and benzoylecgonine wereisolated from spiked saliva with three protein precipitation procedures. Ineach case, serious ionization suppression was observed. The author warnedthat during the use of a highly selective method like LC/MS/MS in an MRMmode, the influence of the matrix may go unnoticed and he postulated theuse of optimized sample preparation methods. The same Belgian group126
established a LC/ESI/qTOF/MS method for the determination of variousdrugs of abuse: opiates (morphine and codeine), and amphetamines(amphetamine, methamphetamine, MDMA, MDEA, and MDA) as well ascocaine and benzoylecgonine in oral fluid. For a mixed-mode SPE, 200 ml ofsample was used. The drugs were separated in a methanol–ammonium for-mate gradient on a narrow-bore phenyl column. The recoveries varied from52 to 99%; the LOQ was 2 mg/l for all compounds. The method was appliedfor real samples obtained from car drivers suspected of drug use.
2.4 LC/MS Analysis of Therapeutic Drugs of Forensic Relevance
2.4.1 Incapacitating Drugs
Some drugs may be used as a chemical weapon to render a victim defenseless,usually in the cases of forced sexual abuse. These compounds are known as“date rape drugs.” The drugs belonging to this category cause fast loss ofconsciousness after a low dose. The victims often develop amnesia and arenot able to give a reliable report of the attacks. All groups of drugs used forincapacitating purposes were presented in a recent monograph.127 The mostimportant drugs used for incapacitation are flunitrazepam and other benzo-diazepines, usually used together with alcoholic beverages, gamma-hydroxy-butyrate (GHB), and related products; and hallucinogens and opioids.
2.4.1.1 BenzodiazepinesFlunitrazepam, a potent hypnotic drug, is of particular toxicological impor-tance due to its high toxicity in combination with ethyl alcohol and subse-quent misuse in drug-facilitated sexual assaults. Since flunitrazepam quicklydisappears from the blood, simultaneous determination of its active metab-olites, particularly of the prevalent 7-aminoflunitrazepam, is very important.Contrary to GC/MS, LC/MS allowed determination of polar metabolites offlunitrazepam without derivatization. Bogusz et al.128 developed aLC/APCI/MS method for determination of flunitrazepam and its metabolites7-aminoflunitrazepam, N-desmethylflunitrazepam, and 3-OH-fluni-
1522_C02.fm Page 93 Wednesday, November 12, 2003 9:36 AM
© 2004 by CRC Press LLC
trazepam in blood or plasma. The comparison of ionization response showedthat APCI gave a signal 7 to 30 times stronger than ESI for all compoundsexcept 7-aminoflunitrazepam. After solid-phase extraction on C18 car-tridges, the drugs were separated on a C18 column in ACN–ammoniumformate buffer (pH 3.0) and detected with APCI/MS. For each compound,a protonated quasi-molecular ion was monitored. The LODs ranged from0.2 to 1 mg/l. This method has been applied in routine toxicological case-work.7 LeBeau et al. determined flunitrazepam, 7-aminoflunitrazepam, andN-desmethylflunitrazepam in blood and urine after SPE in a mixed-phasecartridge.129 A LC/ESI/MS/MS (ion trap) procedure was applied. Protonatedquasi-molecular ions of drugs involved were monitored and the identity wasconfirmed by fragmentation. The LODs in blood were from 0.5 to 1 mg/l. Anion trap LC/ESI/MS/MS was also used for determination of flunitrazepamin serum by Darius et al.130 The drug was extracted with tertiary butylmethylether and separated on C18 column in ACN–water mobile phase. Productions of flunitrazepam and internal standard (clonazepam) were monitored.The LOD was 0.2 mg/l. Unfortunately, the metabolites, particularly 7-ami-noflunitrazepam, were not determined. Yuan et al. described an automatedin-tube solid-phase microextraction combined with LC/ESI/MS for determi-nation of diazepam, nordiazepam, temazepam, oxazepam, 7-aminofluni-trazepam, and N-desmethylflunitrazepam in serum and urine.131
Flunitrazepam itself was not included in this study. The isolation techniqueused allowed solvent-free, automatic extraction in 15 min for each consecu-tive sample. The extraction procedure was optimized, using six variousextraction capillaries and various extraction conditions. The drugs weredetected with LC/ESI/MS (full scan m/z 100 to 400) and SIM. The LODs of0.02 to 2 mg/l were achieved. Two drawbacks of the procedure are relativelylow recovery in serum (below 50%) and peak broadening caused by auto-matic desorption. A LC/APCI/MS/MS (ion trap) procedure was applied fordetermination of flunitrazepam, 7-aminoflunitrazepam and N-desmeth-ylflunitrazepam in plasma after SPE on Oasis MCX cartridges by Kollroseret al.132 The analytical recoveries were above 90% for all compounds; thelimits of detection were 0.25 to 2 mg/l.
Midazolam is a short-acting benzodiazepine used for induction of anes-thesia that may also be abused as an incapacitating agent. This drug and itsactive hydroxylated metabolite were extracted from serum with ether–isopro-panol (98:2) at alkaline pH and separated on ODS column (Nucleosil C18,150 ¥ 1 mm). The drugs were determined with ESI/LC/MS in SIM mode.Protonated quasi-molecular ions and fragments of both compounds weremonitored. The LOQ for both compounds was 0.5 mg/l.133 In another study,midazolam and hydroxymidazolam, as well as triazolam and hydroxytriaz-olam used as internal standards, were extracted from plasma with Oasis HLB
1522_C02.fm Page 94 Wednesday, November 12, 2003 9:36 AM
© 2004 by CRC Press LLC
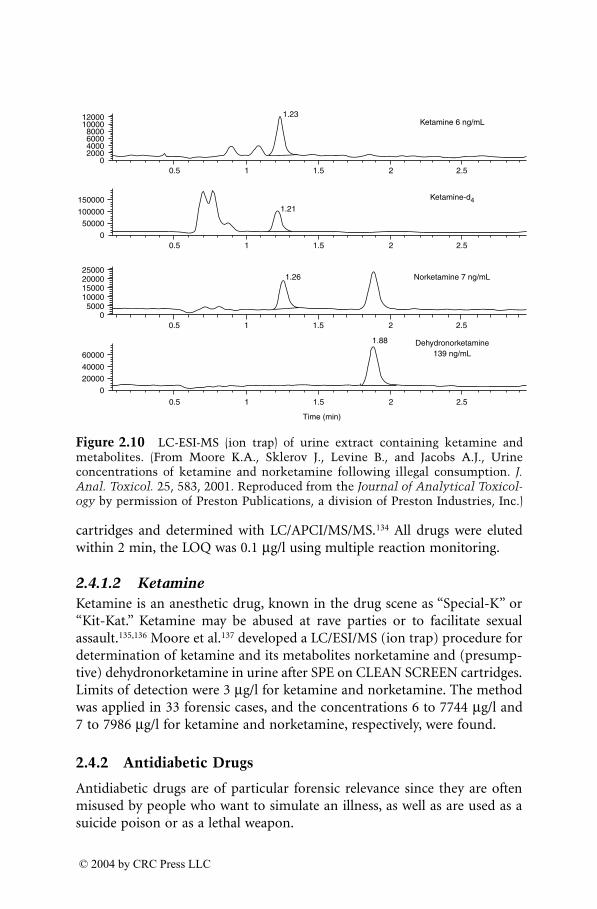
cartridges and determined with LC/APCI/MS/MS.134 All drugs were elutedwithin 2 min, the LOQ was 0.1 mg/l using multiple reaction monitoring.
2.4.1.2 KetamineKetamine is an anesthetic drug, known in the drug scene as “Special-K” or“Kit-Kat.” Ketamine may be abused at rave parties or to facilitate sexualassault.135,136 Moore et al.137 developed a LC/ESI/MS (ion trap) procedure fordetermination of ketamine and its metabolites norketamine and (presump-tive) dehydronorketamine in urine after SPE on CLEAN SCREEN cartridges.Limits of detection were 3 mg/l for ketamine and norketamine. The methodwas applied in 33 forensic cases, and the concentrations 6 to 7744 mg/l and7 to 7986 mg/l for ketamine and norketamine, respectively, were found.
2.4.2 Antidiabetic Drugs
Antidiabetic drugs are of particular forensic relevance since they are oftenmisused by people who want to simulate an illness, as well as are used as asuicide poison or as a lethal weapon.
Figure 2.10 LC-ESI-MS (ion trap) of urine extract containing ketamine andmetabolites. (From Moore K.A., Sklerov J., Levine B., and Jacobs A.J., Urineconcentrations of ketamine and norketamine following illegal consumption. J.Anal. Toxicol. 25, 583, 2001. Reproduced from the Journal of Analytical Toxicol-ogy by permission of Preston Publications, a division of Preston Industries, Inc.)
12000100008000600040002000
00.5 1 1.5 2 2.5
Ketamine 6 ng/mL1.23
150000
100000
50000
00.5 1 1.5 2 2.5
Ketamine-d41.21
60000
40000
20000
0
0.5 1 1.5 2 2.5
Dehydronorketamine139 ng/mL
Time (min)
1.88
250002000015000100005000
00.5 1 1.5 2 2.5
Norketamine 7 ng/mL1.26
1522_C02.fm Page 95 Wednesday, November 12, 2003 9:36 AM
© 2004 by CRC Press LLC
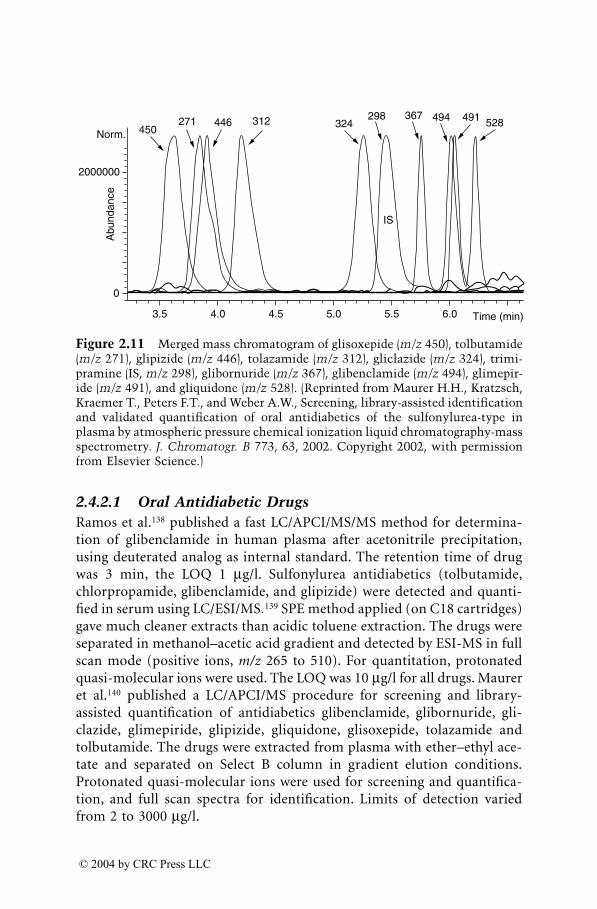
2.4.2.1 Oral Antidiabetic DrugsRamos et al.138 published a fast LC/APCI/MS/MS method for determina-tion of glibenclamide in human plasma after acetonitrile precipitation,using deuterated analog as internal standard. The retention time of drugwas 3 min, the LOQ 1 mg/l. Sulfonylurea antidiabetics (tolbutamide,chlorpropamide, glibenclamide, and glipizide) were detected and quanti-fied in serum using LC/ESI/MS.139 SPE method applied (on C18 cartridges)gave much cleaner extracts than acidic toluene extraction. The drugs wereseparated in methanol–acetic acid gradient and detected by ESI-MS in fullscan mode (positive ions, m/z 265 to 510). For quantitation, protonatedquasi-molecular ions were used. The LOQ was 10 mg/l for all drugs. Maureret al.140 published a LC/APCI/MS procedure for screening and library-assisted quantification of antidiabetics glibenclamide, glibornuride, gli-clazide, glimepiride, glipizide, gliquidone, glisoxepide, tolazamide andtolbutamide. The drugs were extracted from plasma with ether–ethyl ace-tate and separated on Select B column in gradient elution conditions.Protonated quasi-molecular ions were used for screening and quantifica-tion, and full scan spectra for identification. Limits of detection variedfrom 2 to 3000 mg/l.
Figure 2.11 Merged mass chromatogram of glisoxepide (m/z 450), tolbutamide(m/z 271), glipizide (m/z 446), tolazamide (m/z 312), gliclazide (m/z 324), trimi-pramine (IS, m/z 298), glibornuride (m/z 367), glibenclamide (m/z 494), glimepir-ide (m/z 491), and gliquidone (m/z 528). (Reprinted from Maurer H.H., Kratzsch,Kraemer T., Peters F.T., and Weber A.W., Screening, library-assisted identificationand validated quantification of oral antidiabetics of the sulfonylurea-type inplasma by atmospheric pressure chemical ionization liquid chromatography-massspectrometry. J. Chromatogr. B 773, 63, 2002. Copyright 2002, with permissionfrom Elsevier Science.)
Norm.
2000000
Abu
ndan
ce
0
3.5 4.0 4.5 5.0 5.5 6.0 Time (min)
IS
450271 446 312 324
298 367 494 491 528
1522_C02.fm Page 96 Wednesday, November 12, 2003 9:36 AM
© 2004 by CRC Press LLC
2.4.2.2 InsulinIdentification, detection, and quantitation of insulin in blood are very impor-tant in forensic toxicology. The presence of bovine or porcine insulin in theblood of a nondiabetic person may serve as evidence of poisoning. Sinceinsulin and C-peptide are released from proinsulin, the determination ofboth products may be of relevance. Very high level of human insulin withoutelevation of the C-peptide indicates exogenous administration. When bothinsulin and C-peptide are present in high concentrations, the presence ofpancreatic tumor or administration of insulin-releasing drugs, like sulfonyl-ureas, is possible. The first LC/MS method for insulin was published byStocklin et al.141 Insulin and its deuterated analog were isolated by immu-noaffinity chromatography and solid-phase extraction. The LOD of 3 pmol/l(about 17 ng/l) was reported. The method was used for hemolyzed post-mortem forensic blood samples, for which immunoassays gave inconsistentresults. A straightforward LC/ESI/MS method for determination of human,bovine, and porcine insulin, as well as C-peptide, was published by Darbyet al.142 The drugs were isolated from acidified plasma with C18 SPE car-tridges, separated on a 150 ¥ 2.1 mm C18 column and detected with ESI/MS(ion trap). Multiply charged molecular ions (M + 3H)+3 and (M + 4H)+4
were monitored. Both ions were selected for quantitation since the intensityratio was variable between runs. The LOQ was 0.4 mg/l for insulin and 0.1mg/l for C-peptide; the comparison with radioimmunoassay showed fullagreement of values. The stability of insulin from blood stored in variousconditions was studied. Zhu et al.143 developed a LC/ESI/MS/MS assay forthe quantitation of human insulin, its analog, and the catabolites in plasma.The compounds were isolated through precipitation, followed by SPE. Thequantitation range was 1 to 500 mg/l.
2.4.3 Muscle Relaxants
Muscle relaxants usually belong to classes of quaternary ammonium com-pounds of high polarity and low thermal stability. Therefore, liquid chroma-tography is a method of choice for their separation.
Farenc et al. applied LC-ESI-MS for the determination of rocuronium(a neuromuscular blocking agent used widely during general anesthesia) inthe plasma of patients. The drug and internal standard (verapamil) wereextracted from plasma with dichloromethane and separated on an ODScolumn in ACN–0.1% TFA (gradient elution). Protonated quasi-molecularions for both compounds were monitored. The LOQ was 25 mg/l.144 Ballardet al.145 developed a LC/qTOF/MS/MS method for determination of pancu-ronium, vecuronium, tubocurarine, rocuronium, and succinylcholine inpostmortem tissues. These drugs were isolated using a combination of solvent
1522_C02.fm Page 97 Wednesday, November 12, 2003 9:36 AM
© 2004 by CRC Press LLC
extraction followed by an ion pairing SPE on C18 cartridges. Detection wasbased on an exact mass measurement of product ions. The method has beenapplied in cases of murder involving serial killers of medical profession.Kerskes et al.146 performed a systematic study on detectability of pancuro-nium, rocuronium, vecuronium, gallamine, suxametonium, mivacurium,and atracurium in biological fluids using LC/ESI/MS (ion trap) after solid-phase extraction. The method was successfully applied in toxicological emer-gency case and after therapeutic administration of drugs.
2.4.4 Antidepressant and Antipsychotic Drugs
LC/MS has been frequently applied in the last few years for determinationof antidepressants. Several authors determined multiple drugs in one LC/MSprocedure. Kumazawa et al.147 applied solid-phase microextraction followedby LC/ESI/MS/MS for the determination of eleven phenothiazine derivativesfrom whole blood and urine. The extraction efficiencies were studied andranged from 0.0002 to 0.12% for blood and from 2.6 to 39.8% for urine,respectively. The sensitivity in selected reaction monitoring mode wasdescribed as satisfactory. The LC/ESI/qTOF technique was used by Zhang etal.148 for the determination of doxepin, desipramine, imipramine, amitrip-tyline, and trimipramine in human plasma. The separation time was 18 sec,using a C18 15 ¥ 2.1 mm column and flow rate of 1.4 ml/min. The analyzerallowed an accurate mass determination; the LOD was 5 mg/l. Kollroser andSchober149 developed a LC/APCI/MS/MS (ion trap) method for rapid deter-mination of amitriptyline, nortriptyline, doxepin, dosulepin, dibenzepin,opipramol, and melitracen in human plasma. Plasma samples were onlydiluted with 0.1% formic acid and subjected to on-line extraction with anOasis extraction column. The samples were then forwarded to a C18 analyt-ical column by valve switching. LC/ESI/MS and LC/MS/MS were applied forthe detection of antidepressants and neuroleptics in the hair of psychiatricpatients. The drugs (maprotiline, pipamperone, and citalopram) wereextracted from powdered hair with methanol and purified with SPE. Massspectra library search was performed for ESI/CID and MS/MS spectra.150
Also, McClean et al.151 used LC/ESI/MS/MS (ion trap) for determination ofantipsychotic drugs (chlorpromazine, trifluoperazine, flupenthixol, risperi-done, and trimipramine in hair subjected to alkaline hydrolysis and solventextraction.
LC/MS has been frequently applied for selected antipsychotic drugs andtheir metabolites.
Hoskins et al.152 described a method for the determination of monoamineoxidase inhibitor moclobemide and its two metabolites in human plasma.The drugs were isolated with Bond Elut C18 SPE cartridges at alkaline pHand separated on a Nova-Pak phenyl column. Protonated quasi-molecular
1522_C02.fm Page 98 Wednesday, November 12, 2003 9:36 AM
© 2004 by CRC Press LLC
ions of all drugs and the internal standard were monitored by ESI/MS. TheLODs were 1 to 5 mg/l, LOQ was 10 mg/l. LC/MS methods for fluoxetine andits metabolite were frequently published. A fast ESI/LC/MS/MS method fordetermination of fluoxetine and norfluoxetine was developed by Sutherlandet al.153 The drugs and internal standard (doxepin) were extracted fromplasma with hexane–isoamylalcohol (98:2) and the aqueous phase was frozenand discarded. The organic phase was back-extracted with 2% formic acid;the aqueous phase was frozen and, after discarding of the hexane layer,thawed, and injected into LC/MS. The total chromatographic run time was2.6 min. The transition of protonated quasi-molecular ions of drugs to prod-uct ions was monitored. The LOQ was 0.15 mg/l for both compounds. In aprocedure published by Shen et al.,154 fluoxetine was extracted with solventin 96-well plates and enantiomers of the drug were separated on a vancomy-cin column. The detection was done with an APCI/MS/MS in MRM mode.The limit of quantitation was 2 mg/l. Li et al.155 published a highly sensitiveLC/ESI/MS/MS procedure for the determination of fluoxetine and norfluox-etine in human plasma. The drugs were extracted from plasma with solventand separated within 5 min. The LOD of 0.1 mg/l was reported at a samplesize of 0.2 ml.
Olanzapine, a thienobenzodiazepine, is an antipsychotic agent usedbroadly for the acute treatment and maintenance of schizophrenia. Due tothe concentration-related response and toxicity, therapeutic monitoring ofthis drug is indicated. Berna et al.156,157 published two procedures for LC-ESI/APCI-MS-MS determination of olanzapine in plasma. The drug wasextracted with SPE cartridges or with organic solvent mixture in single or96-well format. The LOQ was 0.25 mg/l. Bogusz et al.158 applied LC/APCI/MSfor determination of olanzapine in serum. SPE extraction on C18 cartridgeswas applied. The LOQ was 1 mg/l. In full-scan LC/MS a postulated olanzap-ine-10-N-glucuronide was found in urine. Aravagiri and Marder159 appliedLC/ESI/MS/MS for therapeutic drug monitoring of clozapine, clozapine-N-oxide, and norclozapine in the serum of schizophrenic patients. The drugswere isolated with solvent extraction and separated on ODS column. Thetransitions of protonated quasi-molecular ions to single fragments weremonitored. An LOQ of 1 mg/l for all substances was reported. The sameauthors used LC/ESI/MS/MS for the determination of risperidone and9-hydroxyrisperidone in plasma.160 Solvent extraction and separation on aphenyl-hexyl column was applied. The LOQ was 0.1 mg/l. Venlafaxine, aphenethylamine antidepressant, as well as its O-desmethylated metabolitewere determined in postmortem blood and tissues in 12 cases of fatal ven-lafaxine poisoning.161 The drug was extracted with butyl chloride and deter-mined by LC/ESI/MS in a positive ionization mode. In all cases, various otherpsychotropic drugs and alcohol were also detected.
1522_C02.fm Page 99 Wednesday, November 12, 2003 9:36 AM
© 2004 by CRC Press LLC
2.4.5 Other Therapeutic Compounds of Forensic Relevance
Methylphenidate is a central stimulant with a history of abuse which is usedfor the treatment of narcolepsy. The drug has two chiral centers and ismarketed as a racemic mixture, whereas d-threo-methylphenidate is pharma-cologically more active than the l-isomer. Ramos et al.162 described anLC/APCI/MS/MS procedure for determination of methylphenidate enanti-omers in plasma. A vancomycin-based Chirobiotic V column was used forseparation. The LOQ was 87 ng/l. In the next study, Ramos et al.163 developedan LC/APCI/MS/MS method for the determination of racemic methylpheni-date. Alkaline cyclohexane extraction in a 96-well plate format was utilized.The drug was separated on C18 column using switching valve, diverting firstpart of eluent to waste. Total run time was 3 min, a LOQ of 50 ng/l plasmawas reported.
Scopolamine and the internal standard atropine were extracted from 0.2ml serum with Oasis HLB cartridges in an automated procedure.164 The drugswere separated on a C18 column in gradient elution on a mobile phaseconsisting of ACN, ammonium acetate, and formic acid. The detection wasdone with ESI/MS/MS (positive ions). Protonated quasi-molecular ions ofscopolamine and atropine were used as parent ions and two product ions foreach drug were monitored. The method was applied for pharmacokineticstudies with a LOQ of 20 ng/l serum.
Nicotine and its seven metabolites were determined in urine byLC/ESI/MS/MS after enzymatic hydrolysis and solvent extraction. For quan-titation, deuterated or 13C-labeled analogs were used for each compound.The LODs ranged from 5 to 38 ng/l. The most dominant metabolite wasidentified as 3-OH-cotinine.165
Sildenafil became an extremely popular drug and at least 100 milliontablets have been prescribed worldwide. It may cause not only several adverseeffects166 but also life-threatening cardiac failure. Weinmann et al.167 describedpostmortem detection and identification of sildenafil (Viagra) and its metab-olites by LC/ESI/MS and LC/ESI/MS/MS. The drug and three metaboliteswere isolated from the urine and organs of a highly putrefied body of an 80-year-old man who died due to coronary sclerosis. Analytical results werecompared with experimental data obtained from a volunteer who ingested25 mg sildenafil. French authors168 used LC/ESI/MS for the determination ofsildenafil and verapamil in blood, organs, and hair of a 43-year-old man whowas found dead after sexual relations with a prostitute. The deceased had ahistory of cardiovascular disease and erectile dysfunction. Sildenafil may bealso used as a doping substance for racehorses due to its protective actionagainst exercise-induced pulmonary hemorrhage. Rudy et al.169 presented anLC/ESI/MS/MS method for identification of sildenafil and metabolites inequine plasma and urine. A liquid/liquid-alkaline extraction was applied,
1522_C02.fm Page 100 Wednesday, November 12, 2003 9:36 AM
© 2004 by CRC Press LLC
followed by separation on a CN-column and qTOF detection. Product ionsin the range of m/z 100 to 500 from four parent ions, corresponding tosildenafil and its three metabolites, were monitored.
2.5 LC/MS Analysis of Natural Compounds of Forensic Relevance
Digitalis glycosides: digoxin, digitoxin, deslanoside, digoxigenin, and digi-toxigenin were determined with ESI/LC/MS/MS.170 The drugs were extractedfrom whole blood or urine by SPE using Oasis HLB cartridges at alkalinepH. Chromatographic separation was performed on ODS column inACN–ammonium formate gradient. An abundant ammonia adduct (M +NH4)+ and much less abundant protonated quasi-molecular ion (M + H)+
were observed in ESI. In APCI, the substances dissipated to many fragments.Time-scheduled selected reaction monitoring was applied, using (M +NH4)+ ions as precursor ions and one fragment for each compound as aproduct ion. The recovery ranged from 11 to 64%; the LODs were from0.05 to 1 mg/l. The method was applied for therapeutic drug monitoring ofcardiac glycosides.
Lacassie et al.171 reported a case of a 36-year-old female who ingested aconcoction of foxglove leaves (Digitalis purpurea) and was admitted to anemergency unit some hours later. She developed sinus bradycardia, abdominalpain, nausea, and vomiting. After five days of treatment she was dischargedwithout symptoms. The cardiac glycosides acetyldigitoxin, convallatoxin, desl-anoside, digitoxigenin, digitoxin, digoxin, gitaloxin, gitoxin, latanoside C,methyldigoxin, oleandrin, proscilardin, and strophantidin in blood and urinesamples of the patient were determined with LC/ESI/MS. The drugs wereextracted with an organic solvent mixture after acetonitrile precipitation andseparated on an ODS column in a gradient of ACN–ammonium formate pH3.0. For each analyte the protonated quasi-molecular ion (M + H)+ and oneor two fragment ions were monitored. The recovery was 67.8 to 98.6%, andthe limit of detection 1 to 10 mg/l. This sensitivity was adequate for acutepoisoning cases but not for therapeutic drug monitoring. Glycoside levels inblood were monitored from 8 to 100 h after intoxication. In a case reportedby Gaillard and Pepin, veratridine and cevadine (toxins present in Veratrumalbum) were identified and quantitated in the blood of two persons found ina mountain lake. In their stomachs, seeds of Veratrum were identified.LC/ESI/MS was used. Measured blood concentrations were 0.17 and 0.40 mg/lfor veratridine and 0.32 and 0.48 mg/l for cevadine.172
Oleander (Nerium oleander L.) is an evergreen, widely distributed shrub,which contains cardenolides — toxic cardiac glycosides such as oleandrin,
1522_C02.fm Page 101 Wednesday, November 12, 2003 9:36 AM
© 2004 by CRC Press LLC
oleandrigenin, and others. Preparations of oleander are used for cancer treat-ment. Oleandrin, odoroside, neritaloside, and the aglycone oleandrigenin,present in the extract of Nerium oleander (Anvirzel), were analyzed withqTOF/MS. CID mass spectra were obtained with mass accuracy greater than5 ppm. LOD for oleandrin was 20 pg injected. The method was applied forthe determination of oleander glycosides in human plasma after intramus-cular injection of Anvirzel.173 A 45-year-old female took Nerium oleander forsuicidal purposes, showing nausea, vomiting, cardiovascular shock, and sinusbradycardia. Oleandrin was measured in plasma at 1.1 mg/l and was alsoidentified in urine using ESI/LC/MS.174 Arao et al.175 applied SSI/LC/MS/MS(ion trap) for determination of oleandrin, oleandrigenin, and desacetylole-andrin in the heart, blood, and cerebrospinal fluid in the case of a fatalsuicidal poisoning of a 49-year-old woman who learned about oleandertoxicity on TV. Only oleandrin was found in concentrations of 9.8 and 10.1mg/l in her heart, blood, and cerebrospinal fluid, respectively.
Capsaicinoids — capsaicin, dihydrocapsaicin, and nonivamide — occurnaturally in red pepper (Capsicum annuum). Due to its extremely irritativeproperties, pepper spray is used in self-defense weapons, which are alsoapplied in criminal acts. Reilly et al. developed a LC/ESI/MS/MS procedurefor the determination of capsaicin, dihydrocapsaicin, and nonivamide in self-defense weapons176 and in blood and tissue of experimental animals.177 TheLOQ in the latter procedure was 1 mg/l.
Ricin is a toxic protein (mol. wt. over 60,000 Da) present in the seeds ofcastor beans (Ricinus communis L). This compound has a history of murder-ous application and appeared in terrorist handbooks. Darby et al.178 analyzedricin and its marker ricinine in acetone extract of castor bean and in trypsinhydrolysates. LC/UV, ESI/LC/MS, and MALDI/TOF/MS were applied. Thelast technique gave the best results, both for intact ricin molecule and fordigested peptide fragments.
Colchicine, an alkaloid present in flowers of the autumn crocus (Colchi-cum autumnale) has been used for centuries for the treatment of gout. Dueto its toxicity, several fatal cases were reported.179 Tracqui et al.180 extractedcolchicine from blood, plasma, or urine with dichlormethane at pH 8 anddetermined with LC/ESI/MS in full scan and SIM mode. The LOD in SIMmode was 0.6 mg/l. Jones et al.181 detected colchicine in the biofluids andorgans of a 73-year-old man who died 18 h after receiving a 1 mg intravenousdose of colchicine. He was treated with oral colchicine in previous days.Dichloromethane extraction, followed by LC/ESI/MS, was applied. The con-centrations found were 50 mg/l in cardiac blood, 575 mg/l in liver, and 12,000mg/l in bile.
Maurer et al.182 determined a- and b-amanitine in the urine of patientsintoxicated with Amanita mushrooms. The toxins were isolated with immu-
1522_C02.fm Page 102 Wednesday, November 12, 2003 9:36 AM
© 2004 by CRC Press LLC
noaffinity extraction columns and determined with LC-ESI-MS, with a LODof 2.5 mg/l.
2.6 Screening LC/MS Procedures in Forensic Toxicology
The application of HPLC as a tool of general unknown analysis is relativelynew and is still in the developmental stage. Generally, two approaches weretaken: the use of HPLC with diode array detection (HPLC/DAD) or LC/MS.HPLC/DAD has a high identification potential due to the combination ofretention parameter and UV spectrum as identification parameters. Severaldatabases comprising more than one thousand substances were established.The review of these databases was done by Bogusz.5 The establishing of auniversally applicable HPLC database was hindered by poor interlaboratoryreproducibility of retention time values for the same drugs analyzed in nom-inally identical conditions in different laboratories. This problem was solvedby introduction of retention index scale, using alkyl aryl ketones183 or1-nitroalkanes.184 In a further development, 1-nitroalkanes were replaced byacidic and basic standard drugs with known retention index values. Thisapproach assured very good interlaboratory comparison of results.185,186
Beside retention index scaling, relative retention times are used forHPLC/DAD libraries. Such a system, based on two reference compounds, iscommercially available as REMEDi (Bio-Rad Labs, Hercules, CA). This sys-tem comprises automatic extraction of a urine sample, on-line separation,detection, and identification with a library comprising over 800 drugs. Thedatabase can be expanded according to need.
The use of LC/MS for toxicological screening was from the beginning anextremely attractive possibility since this technique possesses a much broaderdetection spectrum than GC-MS and is much more sensitive than HPLC-DAD. However, the establishing of a generally applicable LC/MS library,similar to GC/MS databases, is hindered by large interlaboratory variabilityin mass spectra. In the study done in three laboratories, mass spectra ofidentical substances, analyzed on the same instruments in nominally identicalconditions, showed large differences in the degree of fragmentation.187 Onthe other hand, controlled changes in composition of the mobile phase, i.e.,in the percentage of organic modifier or in the molarity of ammoniumformate buffer, did not have any relevant influence on mass spectra. ExistingLC/MS screening procedures may be divided into two groups: those com-prising substances belonging to similar pharmacological classes or used forsimilar applications (e.g., pesticides) and those applicable for an undirectedsearch, i.e., for a “general unknown” screening. In the first case, the task ismuch easier, since the number of substances is limited, and the sample
1522_C02.fm Page 103 Wednesday, November 12, 2003 9:36 AM
© 2004 by CRC Press LLC
preparation is more effective due to similar chemical features of the com-pounds involved.
2.6.1 Group Screening for Pharmacologically Related Substances
Finnish authors188 described an automated LC/ESI/MS/MS screening/confir-mation method for 16 beta-blocking agents in urine samples. The drugs weretentatively identified on the base of retention time and (M + H)+ value. Forconfirmation, any qualified compounds were automatically subjected to frag-mentation. The product ions were compared with the library data. The limitsof identification ranged from 0.02 to 1.2 mg/l.
The same group developed a LC/ESI/MS/MS procedure for screeningand quantitation of 18 antihistamine drugs in blood.189 Since the drugsbelong to acidic and basic compounds, two solvent extractions were per-formed at pH 3 and 11, and the extracts were combined. The chromatographywas done in 5 min in an acetonitrile–ammonium acetate gradient. For pre-liminary identification, protonated quasi-molecular ion, the most intensivefragment, and retention time of each peak were used. The confirmation wasdone in second run, using the whole product ion spectrum. The limits ofidentification for each drug were below the lowest therapeutic concentration.
Rittner et al.190 established a library of mass spectra of 70 various psy-choactive drugs and metabolites with LC-ESI-MS. In the preliminary study,the efficiency of various solid-phase extraction methods and various HPLCcolumns was tested. The best results were obtained with C18 SPE cartridgesand C18 columns. Chromatographic separation was performed inACN–water–methanol–formic acid gradient. Mass spectra of drugs wererecorded at two levels of fragmentation energy in full scan mode (m/z 100to 650, positive ions). For many drugs, sodium, potassium, and ACN adductswere observed. The usefulness of the screening procedure was checked on140 serum samples taken from road traffic offenders. In 9.8% of the casesvarious drugs, mostly benzodiazepines, were detected.
Thieme et al.191 established a method for screening and quantitation of32 diuretic compounds and their metabolites in urine. The method wasdeveloped for doping control and was based on LC/ESI/MS/MS. The drugswere extracted from urine using XAD columns and separated on C8 columnsin gradient of ACN–ammonium acetate. The library of mass spectra wasdeveloped using positive or negative ionization and optimized fragmentationconditions for particular compounds. Since diuretics may belong to acidicand basic drugs, the authors recommended two subsequent chromatographicruns (in positive and negative mode) in the screening procedure. This wassuperior to the polarity switching in one run.
Lacassie et al.192 published a procedure for the determination of 61 pes-ticides of various classes (organophosphates, carbamates, organochlorines,
1522_C02.fm Page 104 Wednesday, November 12, 2003 9:36 AM
© 2004 by CRC Press LLC
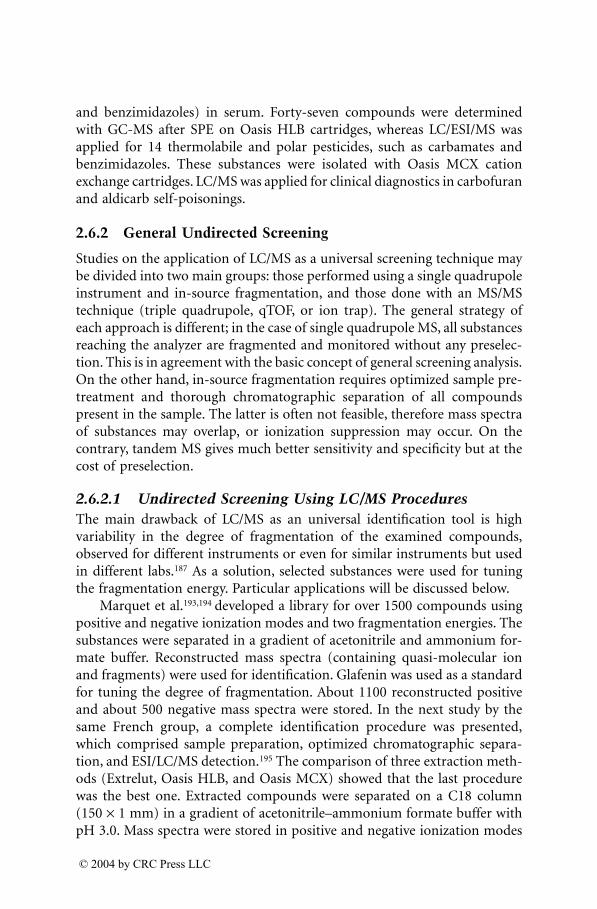
and benzimidazoles) in serum. Forty-seven compounds were determinedwith GC-MS after SPE on Oasis HLB cartridges, whereas LC/ESI/MS wasapplied for 14 thermolabile and polar pesticides, such as carbamates andbenzimidazoles. These substances were isolated with Oasis MCX cationexchange cartridges. LC/MS was applied for clinical diagnostics in carbofuranand aldicarb self-poisonings.
2.6.2 General Undirected Screening
Studies on the application of LC/MS as a universal screening technique maybe divided into two main groups: those performed using a single quadrupoleinstrument and in-source fragmentation, and those done with an MS/MStechnique (triple quadrupole, qTOF, or ion trap). The general strategy ofeach approach is different; in the case of single quadrupole MS, all substancesreaching the analyzer are fragmented and monitored without any preselec-tion. This is in agreement with the basic concept of general screening analysis.On the other hand, in-source fragmentation requires optimized sample pre-treatment and thorough chromatographic separation of all compoundspresent in the sample. The latter is often not feasible, therefore mass spectraof substances may overlap, or ionization suppression may occur. On thecontrary, tandem MS gives much better sensitivity and specificity but at thecost of preselection.
2.6.2.1 Undirected Screening Using LC/MS ProceduresThe main drawback of LC/MS as an universal identification tool is highvariability in the degree of fragmentation of the examined compounds,observed for different instruments or even for similar instruments but usedin different labs.187 As a solution, selected substances were used for tuningthe fragmentation energy. Particular applications will be discussed below.
Marquet et al.193,194 developed a library for over 1500 compounds usingpositive and negative ionization modes and two fragmentation energies. Thesubstances were separated in a gradient of acetonitrile and ammonium for-mate buffer. Reconstructed mass spectra (containing quasi-molecular ionand fragments) were used for identification. Glafenin was used as a standardfor tuning the degree of fragmentation. About 1100 reconstructed positiveand about 500 negative mass spectra were stored. In the next study by thesame French group, a complete identification procedure was presented,which comprised sample preparation, optimized chromatographic separa-tion, and ESI/LC/MS detection.195 The comparison of three extraction meth-ods (Extrelut, Oasis HLB, and Oasis MCX) showed that the last procedurewas the best one. Extracted compounds were separated on a C18 column(150 ¥ 1 mm) in a gradient of acetonitrile–ammonium formate buffer withpH 3.0. Mass spectra were stored in positive and negative ionization modes
1522_C02.fm Page 105 Wednesday, November 12, 2003 9:36 AM
© 2004 by CRC Press LLC
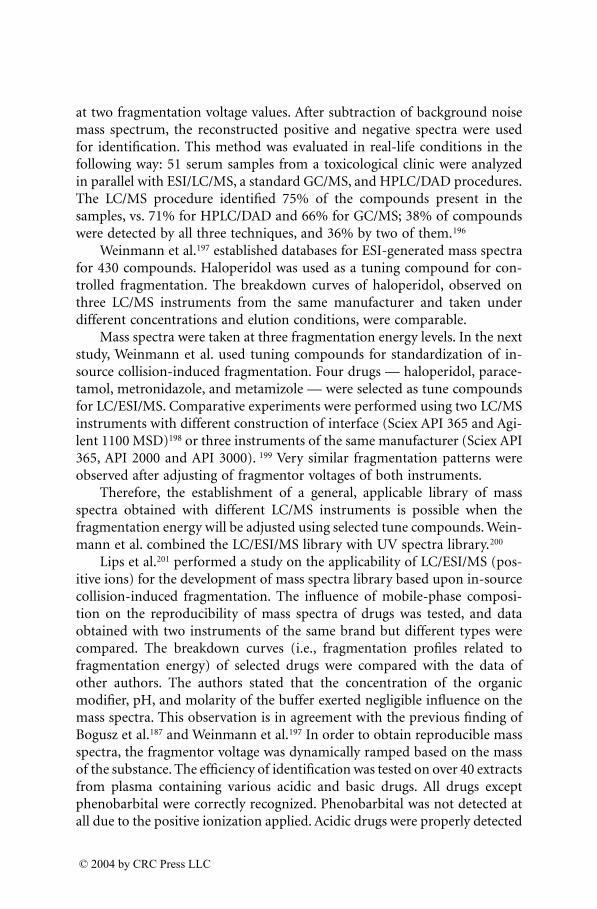
at two fragmentation voltage values. After subtraction of background noisemass spectrum, the reconstructed positive and negative spectra were usedfor identification. This method was evaluated in real-life conditions in thefollowing way: 51 serum samples from a toxicological clinic were analyzedin parallel with ESI/LC/MS, a standard GC/MS, and HPLC/DAD procedures.The LC/MS procedure identified 75% of the compounds present in thesamples, vs. 71% for HPLC/DAD and 66% for GC/MS; 38% of compoundswere detected by all three techniques, and 36% by two of them.196
Weinmann et al.197 established databases for ESI-generated mass spectrafor 430 compounds. Haloperidol was used as a tuning compound for con-trolled fragmentation. The breakdown curves of haloperidol, observed onthree LC/MS instruments from the same manufacturer and taken underdifferent concentrations and elution conditions, were comparable.
Mass spectra were taken at three fragmentation energy levels. In the nextstudy, Weinmann et al. used tuning compounds for standardization of in-source collision-induced fragmentation. Four drugs — haloperidol, parace-tamol, metronidazole, and metamizole — were selected as tune compoundsfor LC/ESI/MS. Comparative experiments were performed using two LC/MSinstruments with different construction of interface (Sciex API 365 and Agi-lent 1100 MSD)198 or three instruments of the same manufacturer (Sciex API365, API 2000 and API 3000). 199 Very similar fragmentation patterns wereobserved after adjusting of fragmentor voltages of both instruments.
Therefore, the establishment of a general, applicable library of massspectra obtained with different LC/MS instruments is possible when thefragmentation energy will be adjusted using selected tune compounds. Wein-mann et al. combined the LC/ESI/MS library with UV spectra library.200
Lips et al.201 performed a study on the applicability of LC/ESI/MS (pos-itive ions) for the development of mass spectra library based upon in-sourcecollision-induced fragmentation. The influence of mobile-phase composi-tion on the reproducibility of mass spectra of drugs was tested, and dataobtained with two instruments of the same brand but different types werecompared. The breakdown curves (i.e., fragmentation profiles related tofragmentation energy) of selected drugs were compared with the data ofother authors. The authors stated that the concentration of the organicmodifier, pH, and molarity of the buffer exerted negligible influence on themass spectra. This observation is in agreement with the previous finding ofBogusz et al.187 and Weinmann et al.197 In order to obtain reproducible massspectra, the fragmentor voltage was dynamically ramped based on the massof the substance. The efficiency of identification was tested on over 40 extractsfrom plasma containing various acidic and basic drugs. All drugs exceptphenobarbital were correctly recognized. Phenobarbital was not detected atall due to the positive ionization applied. Acidic drugs were properly detected
1522_C02.fm Page 106 Wednesday, November 12, 2003 9:36 AM
© 2004 by CRC Press LLC
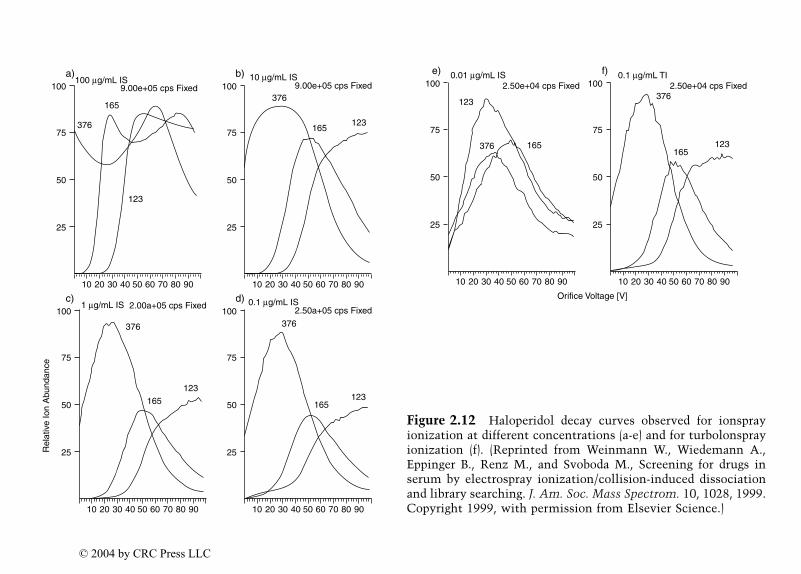
Figure 2.12 Haloperidol decay curves observed for ionsprayionization at different concentrations (a-e) and for turbolonsprayionization (f). (Reprinted from Weinmann W., Wiedemann A.,Eppinger B., Renz M., and Svoboda M., Screening for drugs inserum by electrospray ionization/collision-induced dissociationand library searching. J. Am. Soc. Mass Spectrom. 10, 1028, 1999.Copyright 1999, with permission from Elsevier Science.)
Rel
ativ
e Io
n A
bund
ance
376
165
123
100
75
50
25
10 20 30 40 50 60 70 80 90
c)1 µg/mL IS 2.00a+05 cps Fixed
376
165123
100
75
50
25
10 20 30 40 50 60 70 80 90
d) 0.1 µg/mL IS2.50a+05 cps Fixed
376
165
123
100
75
50
25
10 20 30 40 50 60 70 80 90
a)100 µg/mL IS
9.00e+05 cps Fixed376
165123
100
75
50
25
10 20 30 40 50 60 70 80 90
b) 10 µg/mL IS9.00e+05 cps Fixed
123
376 165
100
75
50
25
10 20 30 40 50 60 70 80 90
e) 0.01 µg/mL IS
376
165123
100
75
50
25
10 20 30 40 50 60 70 80 90
f) 0.1 µg/mL TI
Orifice Voltage [V]
2.50e+04 cps Fixed 2.50e+04 cps Fixed
1522_C02.fm
Page 107 Wednesday, N
ovember 12, 2003 9:36 A
M
© 2004 by CRC Press LLC
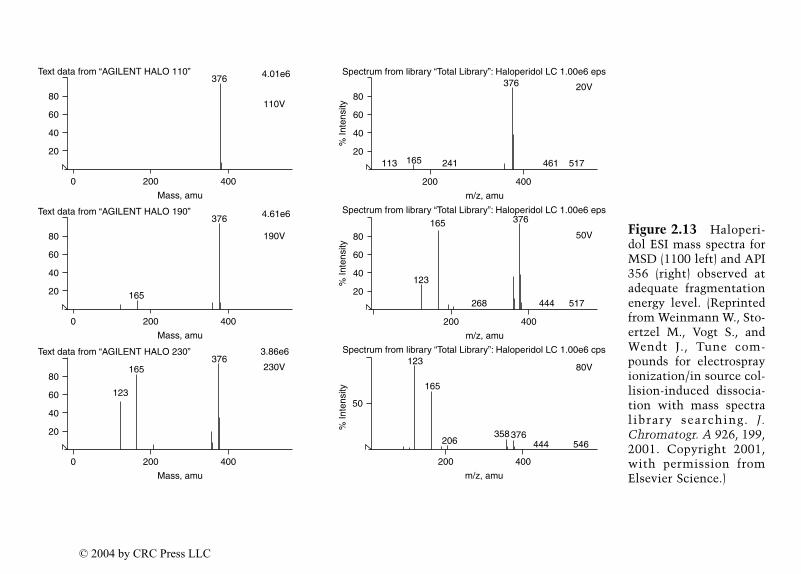
Figure 2.13 Haloperi-dol ESI mass spectra forMSD (1100 left) and API356 (right) observed atadequate fragmentationenergy level. (Reprintedfrom Weinmann W., Sto-ertzel M., Vogt S., andWendt J., Tune com-pounds for electrosprayionization/in source col-lision-induced dissocia-tion with mass spectralibrary searching. J .Chromatogr. A 926, 199,2001. Copyright 2001,with permission fromElsevier Science.)
80
60
40
20
Text data from “AGILENT HALO 230”
0 200 400
Mass, amu
230V
123
165376
3.86e6
80
60
40
20
Text data from “AGILENT HALO 190”
0 200 400
Mass, amu
190V
165
376 4.61e6
80
60
40
20
Text data from “AGILENT HALO 110”
0 200 400
Mass, amu
110V
376 4.01e6
50
Spectrum from library “Total Library”: Haloperidol LC 1.00e6 cps
200 400
m/z, amu
80V123
165
376358206 444 546
% In
tens
ity
80
60
40
20
Spectrum from library “Total Library”: Haloperidol LC 1.00e6 eps
200 400
m/z, amu
50V
123
268 444 517
165 376
% In
tens
ity
80
60
40
20
Spectrum from library “Total Library”: Haloperidol LC 1.00e6 eps
200 400
m/z, amu
20V
241165 461 517
376
% In
tens
ity
113
1522_C02.fm
Page 108 Wednesday, N
ovember 12, 2003 9:36 A
M
© 2004 by CRC Press LLC
in experiments performed in negative ionization mode. Between the twoinstruments used, better matching results were obtained through the lattermode which was also used for library data collection.
Gergov et al.202 presented a very straightforward approach for the appli-cation of LC/ESI/MS/TOF in toxicological screening. The features of TOF/MSwere utilized, i.e., high mass accuracy and high sensitivity over the full spec-trum. On this base a library was established containing 433 toxicologicallyrelevant compounds (parent drugs and their metabolites), expanded simplyby the calculation of their monoisotopic masses. The mass range for com-pounds included in the library extended from 105 to 734 Da. This librarywas used for the identification of drugs in urine extracts, using gradientelution in an ACN–ammonium acetate buffer at pH 3.2. The retention dataof drugs were stored but not used for identification in this study. The resultsof LC/MS/TOF screening were in concordance with the results of GC andTLC screening, run in parallel. According to the authors, the method is verypromising and allows screening for compounds with known formula evenwithout reference compounds. This is of practical value, particularly formetabolites, due to the frequent lack of available reference standards. Thescreening for metabolites using LC/ESI/MS/TOF was done by the same groupin consecutive study.203 Ten previously analyzed autopsy urine samples weresubjected to LC/ESI/MS/TOF and the results were compared with the libraryof theoretical masses of metabolites. Several metabolites of drugs (amitrip-tyline, methadone, etc.) were identified.
2.6.2.2 Undirected Screening using LC/MS/MS Procedures (QQQ, qTOF, and qIT)
An intralaboratory reproducibility of mass spectra obtained with similar ordifferent instruments is of primary relevance for the establishment and useof mass spectra libraries. Weinmann, Gergov, and Goerner204 compared massspectra obtained with two identical (Sciex API 365) and one different (SciexAPI 2000) LC/MS/MS in three laboratories. Methadone, benzoylecgonine,and diazepam were used as test substances. Product ion spectra of proto-nated quasi-molecular ions of more than 400 compounds were similar forall laboratories. Also, in-source CID spectra showed good similarity withthe product ion spectra. The last point is very important because in the firststep of LC/MS screening, the in-source generated mass spectra are collectedand eventually confirmed in MS/MS analysis. Gergov et al.205 presented aLC/ESI/MS/MS screening procedure for 238 therapeutic and illicit drugsextracted from blood with organic solvents at acidic and basic pH. Only apositive ionization mode was applied. For each compound, the transitionfrom protonated quasi-molecular ion to one most intense or most specificfragment was monitored. Also, retention time and peak area were used for
1522_C02.fm Page 109 Wednesday, November 12, 2003 9:36 AM
© 2004 by CRC Press LLC
identification. The method was applied in forensic casework. Dams et al.206
developed a LC/APCI/MS/MS (ion trap) screening method for selecteddrugs of abuse (opiate agonists, cocaine, and metabolites) in plasma, saliva,and urine. The samples were only subjected to acetonitrile precipitationbefore analysis. No ion suppression was observed for the compoundsinvolved. In the study of Nordgren and Beck,207 urine samples were 1:10diluted with water and directly injected into LC/APCI/MS/MS. A smalllibrary of 24 drugs of abuse was established. The procedure was applied inroutine casework; among 529 analyzed samples, in 32 cases various drugswere found, mainly psychoactive phenethylamines. Direct analysis of urinewas applied also by Fitzgerald et al., 208 who modified REMEDi HPLC ana-lyzer for use with ion trap MS. A small library of 17 drugs belonging todifferent classes was established. Urine samples were extracted on-line asfor HPLC/DAD analysis.
2.7 Perspectives and Future Trends
Existing needs and observed trends of development allow predicting the mainpathways of progress in LC/MS applied for forensic toxicology. This progressmay be divided into following categories:
• Sample preparation for LC/MS: The problems caused by coelutingmatrix compounds (ionization suppression, spectra overlapping)have been well recognized. Therefore, more stress will be put on thedevelopment of fast and efficient isolation techniques.
• HPLC separation: A trend to shortening of analysis time will be ob-served, similar to that in clinical toxicology. This may be achievedeither through introduction of columns assuring faster and moreefficient separation (short, fine-grain or monolithic columns),through application of fast elution (fast gradient, high percentage oforganic solvent in mobile phase, high flow rate), or by flow switchingof eluent flow during separation process.
• Application area: LC/MS will cover practically the whole spectrum ofcompounds of toxicological relevance. The use of LC/MS as a toolfor general screening procedures will be common, and the librariesof mass spectra will be available with any purchased instrument. Mostprobable will be combined use of in-source CID for preliminaryscreening with consecutive MS/MS confirmation.
• Technical aspects: Detection part of LC/MS, i.e., the mass spectrometeritself, will became smaller without compromising the quality. Bench-top, tandem mass spectrometers at affordable prices already have
1522_C02.fm Page 110 Wednesday, November 12, 2003 9:36 AM
© 2004 by CRC Press LLC
appeared on the market and their use will definitely spread in forensictoxicological laboratories.
References
1. Krull I.S. and Cohen S.A. Analytical chemistry and biotechnology. LC-GCInt. 11, 139–140, 1998.
2. Willoughby R., Sheehan E., and Mitrovich S. A Global View on LC/MS. GlobalView, Pittsburgh, PA, 1998.
3. Niessen W.M.A. Advances in instrumentation in liquid chromatography-mass spectrometry and related liquid-introduction techniques. J. Chromatogr.A 794, 407, 1998.
4. Niessen W.M.A. State-of-the-art in liquid chromatography-mass spectrome-try. J. Chromatogr. A 856, 179, 1999.
5. Bogusz M.J. Hyphenated liquid chromatographic techniques in forensic tox-icology. J. Chromatogr. B 733, 65, 1999.
6. Marquet P. and Lachatre G. Liquid chromatography-mass spectrometry:potential in forensic and clinical toxicology. J. Chromatogr. B 733, 93, 1999.
7. Bogusz M.J. Liquid chromatography-mass spectrometry as a routine methodin forensic science: a proof of maturity. J. Chromatogr. B 748, 3, 2000.
8. Marquet P. Progress of liquid chromatography–mass spectrometry in clinicaland forensic toxicology. Ther. Drug Monit. 24, 255, 2002.
9. Van Bocxlaer J.F., Clauwaert K.M., Lambert W.E., Deforce D.L., Van denEeckhout E.G., and De Leenheer A.P. Liquid chromatography-mass spec-trometry in forensic toxicology. Mass Spectrom. Rev. 19, 165, 2002.
10. Weinmann W. and Svoboda M. Fast screening for drugs of abuse by solidphase extraction combined with flow-injection ionspray tandem mass spec-trometry. J. Anal. Toxicol. 22, 319, 1998.
11. Müller C., Schäfer P., Störtzel M., Vogt S., and Weinmann W. Ion suppressioneffects in liquid chromatography-electrospray-ionisation transport-regioncollision induced dissociation mass spectrometry with different serum extrac-tion methods for systematic toxicological analysis with mass spectra libraries.J. Chromatogr. B 773, 47, 2002.
12. Zhou S., Larson M.L., Naidong W., and Jiang X. Characterization of matrixsuppression effect in quantitative LC/MS-MS analysis of biological samples.Poster on the 50th ASMS Conference on Mass Spectrometry and AlliedTopics, Orlando, FL, 2002.
13. Avery M.J. Ion suppression issue in the LC/MS analysis of analytes isolatedfrom human and animal matrices. Poster on the 50th ASMS Conference onMass Spectrometry and Allied Topics, Orlando, FL, 2002.
1522_C02.fm Page 111 Wednesday, November 12, 2003 9:36 AM
© 2004 by CRC Press LLC
14. Tang Y.Q., Coopersmith B.I., Beato B.D., and Naidong W. Strategies fordealing with matrix effects and interferences in bioanalytical LC/MS-MS.Poster on the 50th ASMS Conference on Mass Spectrometry and AlliedTopics, Orlando, FL, 2002.
15. Bansal S. and Liang Z. Matrix factor and extraction uniformity: novel quan-titative tools for assessing matrix effects in LC/MS-MS during assay valida-tions. Poster on the 50th ASMS Conference on Mass Spectrometry and AlliedTopics, Orlando, FL, 2002.
16. Sun W., Coe R., Loin P., and Lee J.W. Matrix suppression resolved using fastdual-column LC/MS-MS in the bioanalysis of nicotine/cotinine in humanheparinized plasma. Poster on the 50th ASMS Conference on Mass Spectrom-etry and Allied Topics, Orlando, FL, 2002.
17. Heinig K. and Bucheli F. Application of column switching liquid chromatog-raphy-tandem mass spectrometry for the determination of pharmaceuticalcompounds in tissue samples. J. Chromatogr. B 25, 9, 2002.
18. Temesi D. and Law B. The effect of LC eluent composition on MS responsesusing electrospray ionization. LC-GC Int. 12, 175, 1999.
19. Naidong W., Shou W., Chen Y.L., and Jiang X. Novel liquid chromatographic-tandem mass spectrometric method using silica columns and aqueous-organic mobile phases for quantitative analysis of polar analytes in biologicalfluids. J. Chromatogr. B 754, 387, 2001.
20. Naidong W., Lee J.W., Jiang X., Wehlin M., Hulse J.D., and Lin P.P. Simulta-neous assay of morphine, morphine-3-glucuronide, and morphine-6-glucu-ronide in human plasma using normal-phase liquid chromatography-tandemmass spectrometry with a silica column and an aqueous organic mobilephase. J. Chromatogr. B 735, 255, 1999.
21. Shou W.Z., Pelzer M., Addison T., Jiang X., and Naidong W. An automatic 96-well solid phase extraction and liquid chromatography-tandem mass spectrom-etry method for the analysis of morphine, morphine-3-glucuronide and mor-phine-6-glucuronide in human plasma. J. Pharm. Biomed. Anal. 27, 143, 2002.
22. Shou W.Z., Jiang X., Beato B.D., and Naidong W. A highly automated 96-well solid phase extraction and liquid chromatography/tandem mass spec-trometry method for the determination of fentanyl in human plasma. RapidCommun. Mass Spectrom. 15, 466, 2001.
23. Chen Y.L., Hanson G.D., Jiang X., and Naidong W. Simultaneous determi-nation of hydrocodone and hydromorphone in human plasma by liquidchromatography with tandem mass spectrometric detection. J. Chromatogr.B 769, 55, 2002.
24. Shou W.Z., Chen Y.L., Eerkes A., Tang Y.Q., Magis L., Jiang X., and NaidongW. Ultrafast liquid chromatography/tandem mass spectrometry bioanalysisof polar analytes using packed silica columns. Rapid Commun. Mass Spectrom.16, 1613, 2002.
1522_C02.fm Page 112 Wednesday, November 12, 2003 9:36 AM
© 2004 by CRC Press LLC
25. Naidong W., Shou W.Z., Addison T., Maleki S., and Jiang X. Liquid chroma-tography/tandem mass spectrometric bioanalysis using normal-phase col-umns with aqueous/organic mobile phases — a novel approach of eliminatingevaporation and reconstitution steps in 96-well SPE. Rapid Commun. MassSpectrom. 16, 1965, 2002.
26. Zweigenbaum J., Heinig K., Steinborner S., Wachs T., and Henion J. Highthroughput bioanalytical LC/MS/MS determination of benzodiazepines: 1000samples per 12 hours. Anal. Chem. 71, 2294, 1999.
27. Cheng Y.F., Lu Z., and Neue U. Ultrafast liquid chromatography/ultravioletand liquid chromatography/tandem mass spectrometric analysis. Rapid Com-mun. Mass Spectrom. 15, 141, 2001.
28. Dams R., Benijts T., Gunther W., Lambert W., and De Leenheer A. Influenceof the eluent composition on the ionization efficiency for morphine of pneu-matically assisted electrospray, atmospheric pressure chemical ionization andsonic spray. Rapid Commun. Mass Spectrom. 16, 1072, 2002.
29. Thurman E.M., Ferrer I., and Barcelo D. Choosing between atmosphericpressure chemical ionization and electrospray ionization interfaces for theHPLC/MS analysis of pesticides. Anal. Chem. 73, 5441, 2001.
30. Yang C. and Henion J. Atmospheric pressure photoionization liquid chro-matographic-mass spectrometric determination of idoxifene and its metab-olites in human plasma. J. Chromatogr. A 970, 155, 2002.
31. Singh G., Gutierrez A., Xu K., and Blair I.A. Liquid chromatography/electroncapture atmospheric pressure chemical ionization/mass spectrometry: anal-ysis of pentafluorobenzyl derivatives of biomolecules and drugs in the atto-mole range. Anal. Chem. 72, 3007, 2000.
32. Clauwaert K.M., Van Bocxlaer J.F., Major H.J., Claereboudt J.A., LambertW.E., Van den Eeckhout E.M., Van Peteghem C.H., and De Leenheer A.P.Investigation of the quantitative properties of the quadrupole orthogonalacceleration time-of-flight mass spectrometer with electrospray ionizationusing 3,4-methyylenedioxymethamphetamine. Rapid Commun. Mass Spec-trom. 13, 1540, 1999.
33. Zhang H. and Henion J. Comparison between liquid chromatography-time-of-flight mass spectrometry and selected reaction monitoring liquid chroma-tography-mass spectrometry for quantitative determination of idoxifene inhuman plasma. J. Chromatogr. B 757, 151, 2001.
34. Vorce S.P., Sklerov J.H., and Kalasinsky K.S. Assessment of the ion-trap massspectrometer for routine qualitative and quantitative analysis of drugs ofabuse extracted from urine. J. Anal. Toxicol. 24, 595, 2000.
35. Dams R., Benijst T., Gunther W., Lambert W., and De Leenheer A. Sonicspray ionization technology: performance study and application to a LC/MSanalysis on a monolithic silica column for heroin impurity profiling. Anal.Chem. 74, 3206, 2002.
1522_C02.fm Page 113 Wednesday, November 12, 2003 9:36 AM
© 2004 by CRC Press LLC
36. Bogusz M.J. Opioid agonists. In Bogusz M.J., Ed., Forensic Science, Vol. 2,Handbook of Analytical Separations. Elsevier, Amsterdam, 2000, 3.
37. Zuccaro P., Ricciarello R., Pichini S., Altieri R.I., Pellegrini M., and D’AszenzoG. Simultaneous determination of heroin, 6-monoacetylmorphine, mor-phine, and its glucuronides by liquid chromatography-atmospheric pressureionspray-mass spectrometry. J. Anal. Toxicol. 21, 268, 1997.
38. Bogusz M.J., Maier R.D., and Driessen S. Morphine, morphine-3-glucu-ronide, morphine-6-glucuronide and 6-monoacetylmorphine determined bymeans of atmospheric pressure chemical ionization-mass spectrometry-liq-uid chromatography in body fluids of heroin victims. J. Anal. Toxicol. 21, 346,1997.
39. Bogusz M.J., Maier R.D., Erkens M., and Driessen S. Determination of mor-phine and its 3-and 6-glucuronide, codeine, codeine-6-glucuronide and 6-monoacetylmorphine in body fluids by liquid chromatography-atmosphericpressure chemical ionization mass spectrometry. J. Chromatogr. B 703, 115,1997.
40. Katagi M., Nishikawa M., Tatsuno M., Miki A., and Tsushihashi H. Columnswitching high-performance liquid chromatography-electrospray ionizationmass spectrometry for identification of heroin metabolites in human urine.J. Chromatogr. B 751, 177, 2001.
41. Schanzle G., Li S., Mikus G., and Hofmann U. Rapid, highly sensitive methodfor the determination of morphine and its metabolites in body fluids by liquidchromatography-mass spectrometry. J. Chromatogr. B 721, 65, 1999.
42. Dienes-Nagy A., Rivier L., Giroud G., Augsburger M., and Mangin P. Methodfor quantification of morphine and its 3- and 6-glucuronides, codeine,codeine glucuronide, and 6-monoacetylmorphine in human blood by liquidchromatography-electrospray mass spectrometry for routine analysis inforensic toxicology. J. Chromatogr. A 854, 109, 1999.
43. Blanchet M., Bru G., Guerret M., Bromet-Petit M., and Bromet N. Routinedetermination of morphine, morphine 3-b-D-glucuronide and morphine 6b-D-glucuronide in human serum by liquid chromatography coupled to elec-trospray mass spectrometry. J.Chromatogr. A 854, 03, 1999.
44. Slawson M.H., Crouch D.J., Andrenyak D.M., Rollins D.E., Lu J.K., and BaileyP.L. Determination of morphine, morphine-3-glucuronide, and morphine-6-glucuronide in plasma after intravenous and intratecal morphine admin-istration using HPLC with electrospray ionization and tandem mass spec-trometry. J. Anal. Toxicol. 23, 116, 1999.
45. Bogusz M.J. LC/MS as a tool for case interpretation in forensic toxicology.49th ASMS Conference on Mass Spectrometry and Allied Topics, Chicago,May 27–31, 2001.
46. Huizer, H. Analytical studies on illicit heroin. Ph.D. thesis, Technical Univer-sity Delft, The Netherlands, 1988.
1522_C02.fm Page 114 Wednesday, November 12, 2003 9:36 AM
© 2004 by CRC Press LLC
47. O’Neal C.L. and Poklis A. Simultaneous determination of acetylcodeine,monoacetylmorphine and other opiates in urine by GC-MS. J. Anal. Toxicol.21, 427, 1997.
48. O’Neal C.L. and Poklis A. The detection of acetylcodeine and 6-acetylmor-phine in opiate-positive urines. Forensic Sci. Int. 95, 1, 1998.
49. Staub C., Marset M., Mino A., and Mangin P. Detection of acetylcodeine inurine as an indicator of illicit heroin use: method validation and results of apilot study. Clin. Chem. 47, 301, 2001.
50. Bogusz M.J., Maier R.D., Erkens M., and Kohls U. Detection of non-prescrip-tion heroin markers in urine with liquid chromatography-atmospheric pres-sure chemical ionization mass spectrometry. J. Anal. Toxicol. 25, 431, 2001.
51. Gaulier J.M., Marquet P., Lacassie E., Dupuy J.L., and Lachatre G. Fatalintoxication following self-administration of a massive dose of buprenor-phine. J. Forensic Sci. 45, 226, 2000.
52. Polettini A. and Huestis M.A. Simultaneous determination of buprenorphine,norbuprenorphine, and buprenorphine-glucuronide in plasma by liquidchromatography-tandem mass spectrometry. J. Chromatogr. B 754, 447, 2001.
53. Moody D.E., Laycock J.D., Spanbauer A.C., Crouch D.J., Foltz R.L., Josephs J.L.,and Bickel W.K. Determination of buprenorphine in human plasma by gaschromatography-positive ion chemical ionization mass spectrometry and liq-uid chromatography-tandem mass spectrometry. J. Anal. Toxicol. 21, 406, 1997.
54. Moody D.E., Slawson M.H., Strain E.C., Laycock J.D., Spanbauer A.C., andFoltz R.L. A liquid chromatographic-electrospray ionization tandem massspectrometric method for determination of buprenorphine, its metabolitenorbuprenorphine, and a coformulant, naloxone, that is suitable for in vivoand in vitro metabolism studies. Anal. Biochem. 306, 31, 2002.
55. Hoja H., Marquet P., Verneuil B., Lofti H., Dupuy J.L, and Lachatre G. Deter-mination of buprenorphine and norbuprenorphine in whole blood by liquidchromatography-mass spectrometry. J. Anal. Toxicol. 21, 160, 1997.
56. Bogusz M.J., Maier R.D., Kruger K.D., and Kohls U. Determination of com-mon drugs of abuse in body fluid using one isolation procedure and liquidchromatography-atmospheric pressure chemical ionization mass spectrom-etry. J. Anal. Toxicol. 22, 549, 1998.
57. Breindahl T. and Andreasen K. Validation of urine drug-of-abuse testing forketobemidone using thin-layer chromatography and liquid chromatography-electrospray mass spectrometry. J. Chromatogr. B 736, 103, 1999.
58. Sundstrom I., Bondesson U., and Hedeland M. Identification of phase I andphase II metabolites of ketobemidone in patient urine using liquid chromatog-raphy-electrospray tandem mass spectrometry. J. Chromatogr. B 763, 121, 2001.
59. Sundstrom I., Hedeland M., Bondesson U., and Andren P.E. Identification ofglucuronide conjugates of ketobemidone and its phase I metabolites inhuman urine utilizing accurate mass and tandem time-of-flight mass spec-trometry. J. Mass Spectrom. 37, 14, 2002.
1522_C02.fm Page 115 Wednesday, November 12, 2003 9:36 AM
© 2004 by CRC Press LLC
60. Ceccato A., Vanderbist F., Pabst J.Y., and Streel B. Automated determination oftramadol enantiomers in human plasma using solid-phase extraction in com-bination with chiral liquid chromatography. J. Chromatogr. B 748, 65, 2000.
61. Juzwin S.J, Wang D.C., Anderson N.J., and Wong F.A. The determination ofRWJ-38705 (tramadol-N-oxide) and its metabolites in preclinical pharma-cokinetic studies using LC-MS/MS. J. Pharm. Biomed. Anal. 22, 469, 2000.
62. Zheng M., McErlane K.M., and Ong M.C. LC-MS-MS analysis of hydromor-phone and hydromorphone metabolites with application to a pharmacoki-netic study in the male Sprague-Dawley rat. Xenobiotica 32, 141, 2002.
63. Kintz P., Eser H.P., Tracqui A., Moeller M. Cirimele V., and Mangin P. Enan-tioselective separation of methadone and its main metabolite in human hairby liquid chromatography/ion spray-mass spectrometry. J. Forensic Sci. 42,291, 1997.
64. Ortelli D., Rudaz S., Chevalley A.F., Deglon J.J., Balant L., and Veuthey J.L.Enantioselective analysis of methadone in saliva by liquid chromatography-mass spectrometry. J. Chromatogr. A 871, 163, 2000.
65. Dale O., Hoffer C., Sheffels P., and Kharasch E.D. Disposition of nasal, intra-venous, and oral methadone in healthy volunteers. Clin.Pharmacol.Ther. 72,536, 2002.
66. Shulgin A. and Shulgin A. Pihkal, A Chemical Love Story, 1st ed. TransformPress, Berkeley, CA, 1995.
67. Henry A.S., Jeffrys K.J., and Dawling S. Toxicity and deaths from 3,4-meth-ylenedioxymethamphetamine (“ecstasy”). Lancet 340, 384, 1992.
68. Lora-Tamayo A., Tena T., and Rodriguez A. Amphetamine derivative relateddeaths. Forensic Sci. Int. 85:149, 1997.
69. Schifano F., Oyefeso A., Webb L., Corkery J., and Ghodse A.H. Review ofdeaths related to taking ecstasy, England and Wales, 1997–2000. Brit. Med. J.326, 80, 2003.
70. Zhao H., Brenneisen R., Scholer A., McNally A.J., ElSohly M.A., Murphy T.P.,and Salamone S.J. Profiles of urine samples taken from ecstasy users at raveparties: analysis by immunoassays. J. Anal. Toxicol. 25, 258, 2001.
71. Bogusz M.J., Kala M., and Maier R.D. Determination of phenylisothiocyanatederivatives of amphetamine and its analogues in biological fluids by HPLC-APCI-MD or DAD. J. Anal. Toxicol. 21, 59, 1997.
72. Bogusz M.J., Kruger K.D., and Maier R.D. Analysis of underivatized amphet-amines and related phenethylamines with high-performance liquid chroma-tography-atmospheric pressure chemical ionization mass spectrometry. J.Anal. Toxicol. 24, 77, 2000.
73. Kataoka H., Lord H.L., and Pawliszyn J., Simple and rapid determination ofamphetamine, methamphetamine, and their methylenedioxy derivatives inurine by automated in-tube solid-phase microextraction coupled with liquidchromatography-electrospray ionization mass spectrometry. J. Anal. Toxicol.24, 257, 2000.
1522_C02.fm Page 116 Wednesday, November 12, 2003 9:36 AM
© 2004 by CRC Press LLC
74. Clauwaert K.M., VanBocxlaer J.F., De Letter E.A., Van Calenbergh S., LambertW.E., and De Leenheer A.P. Determination of the designer drugs 3,4-meth-ylenedioxymethamphetamine, 3,4-methylenedioxyethylamphetamine, and3,4-methylenedioxyamphetamine in whole blood and fluorescence detectionin whole blood, serum, vitreous humor, and urine. Clin. Chem. 46, 1968, 2000.
75. Mortier K.A., Dams R., Lambert W.E., De Letter E., Van Calenbergh S., andDe Leenheer A.P. Determination of paramethoxyamphetamine and otheramphetamine-related designer drugs by liquid chromatography/sonic spraymass spectrometry. Rapid Comm. Mass Spectrom. 16, 865, 2002.
76. Sato M., Mitsui T., and Nagase H. Analysis of benzphetamine and its metab-olites in rat urine by liquid chromatography-electrospray ionization massspectrometry. J. Chromatogr. B 751, 277, 2001.
77. Katagi M., Tatsuno M., Miki A., Nishikawa M., and Tsushihashi H. Discrim-ination of dimethylamphetamine and methamphetamine use: simultaneousdetermination of dimethylamphetamine-N-oxide and other metabolites inurine by high-performance liquid chromatography-electrospray ionizationmass spectrometry. J. Anal. Toxicol. 24, 354, 2000.
78. Katagi M., Tatsuno M., Miki A., Nishikawa M., Nakajima K., and TsushihashiH. Simultaneous determination of selegiline-N-oxide, a new indicator forselegiline administration, and other metabolites in urine by high performanceliquid chromatography-electrospray ionization mass spectrometry. J. Chro-matogr. B 759, 125, 2001.
79. Katagi M., Tatsuno M., Tsutsumi H., Miki A., Kamata T., Nishioka H., Naka-jima K., Nishiwaka M., and Tsushihashi H. Urinary excretion of selegiline-N-oxide, a new indicator for selegiline administration in man. Xenobiotica32, 823, 2002.
80. Wood M., De Boeck D., Samyn N., Cooper D., and Morris M. Developmentof a rapid and sensitive method for the quantitation of amphetamines inhuman saliva. Poster presented on 49th ASMS Conference, Chicago, 2001.
81. Samyn N., De Boeck G., Wood M., Lamers C.T., De Waard D., BrookhuisK.A., Verstraete A.G., and Riedel W.J. Plasma, oral fluid and sweat wipe ecstasyconcentrations in controlled and real life conditions. Forensic Sci. Int. 128,90, 2002.
82. Stanaszek R., Piekoszewski W., Karakiewicz B., and Kozielec T. Correlationbetween self-reported drug use and the results of hair analysis in detoxifica-tion and methadone treatment patients. Przegl. Lek. 59, 347, 2002.
83. Jufer R.A., Darwin W.D., and Cone E.J. Current methods for the separationand analysis of cocaine analytes. In Bogusz M.J., Ed., Forensic Science, Vol. 2,Handbook of Analytical Separations. Elsevier, Amsterdam, 2000, 67.
84. Sosnoff C.S., Ann Q., Bernert J.T., Jr., Powell M.K., Miller B.B., HendersonL.O., Hannon W.H., and Sampson E.J. Analysis of benzoylecgonine in driedblood spots by liquid chromatography-atmospheric pressure chemical ion-ization mass spectrometry. J. Anal. Toxicol. 20, 179, 1996.
1522_C02.fm Page 117 Wednesday, November 12, 2003 9:36 AM
© 2004 by CRC Press LLC
85. Singh G., Arora V., Fenn P.T., Mets B., and Blair I.A. A validated stable isotopedilution liquid chromatography tandem mass spectrometry assay for the traceanalysis of cocaine and its major metabolites in plasma. Anal. Chem. 71, 2021,1999.
86. Jeanville P.M., Estape E.S., Needham S.R., and Cole M.J. Rapid confirma-tion/quantitation of cocaine and benzoylecgonine in urine utilizing highperformance liquid chromatography and tandem mass spectrometry. J. Am.Soc. Mass Spectrom. 11, 257, 2000.
87. Jeanville P.M., Estape E.S., Torres-Negron I., and Marti A. Rapid confirma-tion/quantitation of ecgonine methyl ester, benzoylecgonine, and cocaineusing on-line extraction coupled with fast HPLC and tandem mass spectrom-etry. J. Anal. Toxicol. 25, 69, 2001.
88. Jeanville P.M., Woods J.H., Baird T.J., and Estape E.S. Direct determinationof ecgonine methyl ester and cocaine in rat plasma, utilizing on-line sampleextraction coupled with rapid chromatography/quadrupole orthogonal accel-eration time-of-flight detection. J. Pharm. Biomed. Anal. 23, 987, 2000.
89. Skopp G., Klingmann A., Potsch L., and Mattern R. In vitro stability ofcocaine in whole blood and plasma including ecgonine as a target analyte.Ther. Drug Monit. 23, 174, 2001.
90. Klingmann A., Skopp G., and Aderjan R. Analysis of cocaine, benzoylecgo-nine, ecgonine methyl ester, and ecgonine by high pressure liquid chroma-tography-API mass spectrometry and application to a short-termdegradation study of cocaine in plasma. J. Anal. Toxicol. 25, 425, 2001.
91. Lin S.N., Moody D.E., Bigelow G.E., and Foltz R.E. A validated liquid chro-matographic-atmospheric pressure chemical ionization tandem-mass spec-trometry method for quantitation of cocaine and benzoylecgonine in humanplasma. J. Anal. Toxicol. 25, 497, 2001.
92. Clauwaert K.M., Van Bocxlaer J.F., Labmert W.E., Van den Eeckhout E., LemiereF., Esmans E.L., and De Leenheer A.P. Narrow-bore HPLC in combination withfluorescence and electrospray mass spectrometric detection for the analysis ofcocaine and metabolites in human hair. Anal. Chem. 70, 2336, 1998.
93. Xia Y., Wang P., Bartlett M.G., Solomon H.M., and Busch K.L. An LC-MS-MS method for the comprehensive analysis of cocaine and cocaine metabo-lites in meconium. Anal. Chem. 15, 764, 2000.
94. Srinivasan K., Wang P.P., Eley A.T., White C.A., and Bartlett M.G. Liquidchromatography-tandem mass spectrometry analysis of cocaine and itsmetabolites from blood, amniotic fluid, placenta; and fetal tissues: study ofthe metabolism and distribution of cocaine in pregnant rats. J. Chromatogr.B 745, 287, 2000.
95. Rustichelli C., Ferioli V., Vezzalini F., Rossi M.C., and Gamberini G. Simul-taneous separation and identification of hashish constituents by coupledliquid chromatography-mass spectrometry (HPLC-MS). Chromatographia43, 129, 1996.
1522_C02.fm Page 118 Wednesday, November 12, 2003 9:36 AM
© 2004 by CRC Press LLC
96. Bäckström B., Cole M.D., Carrott M.J., Jones D.C., Davidson G., and Cole-man K. A preliminary study on the analysis of Cannabis by supercritical fluidchromatography with atmospheric pressure chemical ionization mass spec-troscopic detection. Sci. Just. 37, 91, 1997.
97. Mireault P. Analysis of D9-tetrahydrocannabinol and its two major metabo-lites by APCI-LC/MS. Poster at the 46th ASMS conference, Orlando, FL, 1998.
98. Picotte P., Mireault P., and Nolin G. A rapid and sensitive LC/APCI/MS/MSmethod for the determination of D9-tetrahydrocannabinol and its metabolitesin human matrices. Poster at the 48th ASMS conference, Long Beach, CA, 2000.
99. Breindahl T. and Andreasen K. Determination of 11-nor-delta9-tetrahydro-cannabinol-9-carboxylic acid in urine using high-performance liquid chro-matography and electrospray ionization mass spectrometry. J. Chromatogr.B 732, 155, 1999.
100. Tai S.S. and Welch M.J. Determination of 11-nor-delta9-tetrahydrocanna-binol-9-carboxylic acid in a urine-based standard reference material by iso-tope-dilution liquid chromatography-mass spectrometry with electrosprayionization. J. Anal. Toxicol. 24, 385, 2000.
101. Weinmann W., Vogt S., Goerke R., Muller C., and Bromberger A. Simulta-neous determination of THC-COOH and THC-COOH-glucuronide in urinesamples by LC/MS/MS. Forensic Sci. Int. 113, 381, 2000.
102. Weinmann W., Goerner M., Vogt S., Goerke R., and Pollak S. Fast confirma-tion of 11-nor-9-carboxy-D9-tetrahydrocannabinol (THC-COOH) in urineby LC/MS/MS using negative atmospheric pressure chemical ionization(APCI). Forensic Sci. Int. 121, 103, 2001.
103. Siddik Z.H., Barnes R.D., Dring L.G., Smith R.L., and Williams R.T. The fateof lysergic acid di[14C] ethylamide in rat, guinea pig and rhesus monkey andof [14C] iso-LSD in rat. Biochem. Pharmacol. 28, 3093, 1979.
104. Webb K.S., Baker P.B., Cassells N.P., Francis J.M., Johnston D.E., LancasterS.L., Minty P.S., Reed G.D., and White S.A. The analysis of lysergide (LSD):the development of novel enzyme immunoassay and immunoaffinity extrac-tion procedures with an HPLC-MS confirmation procedure. J. Forensic Sci.41, 938, 1996.
105. White S.A., Kidd A.S., and Webb K.S. The determination of lysergide (LSD)in urine by high-performance liquid chromatography-isotope dilution massspectrometry (IDMS), J. Forensic Sci. 44, 375, 1999.
106. Hoja H., Marquet P., Verneuil B., Lofti H., Dupuy J.L., and Lachatre G.Determination of LSD and N-demethyl-LSD in urine by liquid chromatog-raphy coupled to electrospray ionization mass spectrometry. J. Chromatogr.B 692, 329, 1997.
107. de Kanel J., Vickery W.E., Waldner B., Monahan R.M., and Diamond F.X.Automated extraction of lysergic acid diethylamide (LSD) and N-demethyl-LSD from blood, serum, plasma, and urine samples using the ZymarkRapidTrace with LC/MS/MS confirmation. J. Forensic Sci. 43, 622, 1998.
1522_C02.fm Page 119 Wednesday, November 12, 2003 9:36 AM
© 2004 by CRC Press LLC
108. Bodin K. and Svensson J.O. Determination of LSD in urine with liquidchromatography-mass spectrometry. Ther. Drug Monit. 23, 389, 2001.
109. Nelson C.C. and Foltz R.L. Chromatographic and mass spectrometric meth-ods for determination of lysergic acid diethylamide (LSD) and metabolitesin body fluids. J. Chromatogr. 580, 97, 1992.
110. Poch G.K., Klette K.L., Hallare D.A., Manglicmot M.G., Czarny R.J.,McWhorter L.K., and Anderson C.J. The detection of metabolites of LSD inhuman urine specimens: 2-oxo-3-hydroxy-LSD, a prevalent metabolite ofLSD. J. Chromatogr. 724, 23, 1999.
111. Poch G.K., Klette K.L., and Anderson C.J. The quantitation of 2-oxo-3-hydroxy LSD in human urine specimens, a metabolite of LSD: comparativeanalysis using liquid chromatography-selected ion monitoring mass spec-trometry and liquid chromatography-ion trap mass spectrometry. J. Anal.Toxicol. 24, 170, 2000.
112. Sklerov J.H., Magluilo J., Shannon K.K., and Smith M.L. Liquid chromatog-raphy-electrospray ionization mass spectrometry for the detection of lyser-gide and a major metabolite, 2-oxo-3-hydroxy LSD, in urine and blood. J.Anal. Toxicol. 24, 543, 2000.
113. Canezin J., Cailleux A., Turcant A., Le Bouil A., Harry P., and Allain P.Determination of LSD and its metabolites in human biological fluids by high-performance liquid chromatography with electrospray tandem mass spec-trometry. J. Chromatogr. B 765, 12, 2001.
114. Klette K.L., Horn C.K., Stout P.R., and Anderson C.J. LC-MS analysis ofhuman urine specimens for 2-oxo-3-hydroxy LSD: method validation forpotential interferants and stability study for 2-oxo-3-hydroxy LSD undervarious storage conditions. J. Anal. Toxicol. 26, 193, 2002.
115. Mash D.C., Kovera C.A., Pablo J., Tynale R.F., Evin F.D., Williams E.C.,Singleton E.G., and Mayor M. Ibogaine complex pharmacokinetics, concernsfor safety, and preliminary efficacy measures. Ann. N.Y. Acad. Sci. 914, 394,2000.
116. Glick S.D., Maisonneuve I.M., and Szumlinski K.K. 18-methoxycoronaridine(18-MC) and ibogaine: comparison of antiaddictive efficacy, toxicity, andmechanism of action. Ann. N.Y. Acad. Sci. 914, 369, 2000.
117. Zhang W., Ramamoorthy Y., Tyndale R.F., Glick S.D., Maisonneuve I.M.,Kuehne M.E., and Sellers E.M. Metabolism of 18-methoxycoroaridine, anibogaine analog, to 18-hydroxycoronaridine by genetically variableCYP2C219. Drug Metab. Disp. 30, 663, 2002.
118. Forstrom T., Tuominen J., and Karkkainen J. Determination of potentiallyhallucinogenic N-dimetylated indoleamines in human urine by HPLC/ESI-MS-MS. Scand. J. Clin. Lab. Invest. 61, 547, 2001.
1522_C02.fm Page 120 Wednesday, November 12, 2003 9:36 AM
© 2004 by CRC Press LLC
119. Barker S.A., Littlefield-Chabaud M.A., and David C. Distribution of thehallucinogens N,N-diethyltryptamine and 5-methoxy-N,N-dimetryl-tryptamine in rat brain following intraperitoneal, injection: application of anew solid-phase extraction LC-APCI-MS-MS-isotope dilution method. J.Chromatogr. B 751, 376, 2001.
120. Brenneisen R. and Stalder A.B. Psilocybe. In Hagers Handbuch der Phar-mazeutischen Praxis, Vol. 6. Hansel R., Keller K., Romples H., and SchneiderG., Eds., Springer-Verlag, Berlin, 1994, 287.
121. Bogusz M.J., Maier R.D., Schäfer A.T., and Erkens M. Honey with Psilocybemushrooms: a revival of a very old preparation on the drug market? Int. J.Legal Med. 111, 147, 1998.
122. Peel H.W. and Jeffrey W.K. A report on the incidence of drugs and drivingin Canada. Can. Soc. Forensic Sc. Ji. 23, 75, 1990.
123. Schiwy-Bochat K.H., Bogusz M., Vega J.A., and Althoff H. Trends inoccurence of drugs of abuse in blood and urine of arrested drivers and drugtraffickers in the border region of Aachen. Forensic Sci. Int. 71, 33, 1995.
124. Cailleux A., Le Bouil A., Auger B., Bonsergent G., Turcant A., and Allain P.Determination of opiates and cocaine and its metabolites in biological fluidsby high performance liquid chromatography with elecrospray tandem massspectrometry. J. Anal. Toxicol. 23, 620, 1999.
125. Mortier K.A., Clauwaert K.M., Lambert W.E., Van Bocxlaer J.F., Van denEeckhout E.G., Van Peteghem C.H., and De Leenheer A.P. Pitfalls associatedwith liquid chromatography/electrospray tandem mass spectrometry inquantitative bioanalysis of drugs of abuse in saliva. Rapid Commun. MassSpectrom. 15, 1773, 2001.
126. Mortier K., Maudens K., Lambert W., Clauwaert K., Van Bocxlaer J., DeforceD., Van Peteghem C., and De Leenheer A. Simultaneous, quantitative deter-mination of opiates, amphetamines, cocaine and benzoylecgonine in oralfluid by liquid chromatography quadrupole time-of-flight mass spectrome-try. J. Chromatogr. B 779, 321, 2002.
127. LeBeau M.A. and Mozayani A., Eds., Drug-Facilitated Sexual Assault. Aca-demic Press, San Diego, CA, 2001.
128. Bogusz M.J., Maier R.D., Krüger K.D., and Früchtnicht W. Determination offlunitrazepam in blood by high-performance liquid chromatography-atmo-spheric pressure chemical ionization mass spectrometry. J. Chromatogr. B713, 361, 1998.
129. LeBeau M.A., Montgomery M.A., Wagner J.R., and Miller M.L. Analysis ofbiofluids for flunitrazepam and metabolites by electrospray liquid chroma-tography/mass spectrometry. J. Forensic Sci. 45, 1133, 2000.
1522_C02.fm Page 121 Wednesday, November 12, 2003 9:36 AM
© 2004 by CRC Press LLC
130. Darius J. and Banditt P. Validated method for the therapeutic drug monitor-ing of flunitrazepam in human serum using liquid chromatography-atmo-spheric pressure chemical ionization tandem mass spectrometry with a iontrap detector. J. Chromatogr. B 738, 437, 2000.
131. Yuan H., Mester Z., Lord H., and Pawliszyn J. Automated in-tube solid-phasemicroextraction coupled with liquid chromatography-electrospray ionizationmass spectrometry for the determination of selected benzodiazepines. J. Anal.Toxicol. 24, 718, 2000.
132. Kollroser M. and Schober C. Simultaneous analysis of flunitrazepam and itsmajor metabolites in human plasma by high performance liquid chromatog-raphy tandem mass spectrometry. J. Pharm. Biomed. Anal. 28, 1173, 2002.
133. Marquet P., Baudin O., Gaulier J.M., Lacassie E., Dupuy J.L, Francois B., andLachatre G. Sentitive and specific determination of midazolam and 1-hydroxymidazolam in human serum by liquid chromatography-electrospraymass spectrometry. J. Chromatogr. B 734, 137, 1999.
134. Ware M.L. and Hidy B.J. LC/MS/MS determination of midazolam and 1-hydroxymidazolam in human plasma. Poster at the 49th ASMS Conference,Chicago, 2001.
135. Smith K.M. Drugs used in acquaintance rape. J. Am. Pharm. Assoc. 39, 519,1999.
136. Gaulier J.M., Canal M., Pradeille J.L., Marquet P., and Lachatre G. New drugsat “rave parties”: ketamine and prolintane. Acta Clin. Belg. Suppl. 1, 41, 2002.
137. Moore K.A., Sklerov J., Levine B., and Jacobs A.J. Urine concentrations ofketamine and norketamine following illegal consumption. J. Anal. Toxicol.25, 583, 2001.
138. Ramos L., Bakhtiar R., and Tse F. Application of liquid chromatographyatmospheric pressure chemical ionization tandem mass spectrometry in thequantitative analysis of glyburide (glibenclamide) in human plasma. RapidCommun. Mass Spectrom. 13, 2439, 1999.
139. Magni F., Marazzini L., Pereira S., Monti L., and Galli Kienle M. Identificationof sulfonylureas in serum by electrospray mass spectrometry. Anal. Biochem.282, 136, 2000.
140. Maurer H.H., Kratzsch, Kraemer T., Peters F.T., and Weber A.W. Screening,library-assisted identification and validated quantification of oral antidiabet-ics of the sulfonylurea-type in plasma by atmospheric pressure chemicalionization liquid chromatography-mass spectrometry. J. Chromatogr. B 773,63, 2002.
141. Stocklin R., Vu L., Vadas L., Cerini F., Kippen A.D., Offord R.E., and Rose K.A stable isotope dilution assay for the in vivo determination of insulin levelsin humans by mass spectrometry. Diabetes 46, 44, 1997.
1522_C02.fm Page 122 Wednesday, November 12, 2003 9:36 AM
© 2004 by CRC Press LLC
142. Darby S.M., Miller M.L., Allen R.O., and LeBeau M. A mass spectrometricmethod for quantitation of intact insulin in blood samples. J. Anal. Toxicol.25, 8, 2001.
143. Zhu Y., Meyer D., Lem Z., and Chien B. Simultaneous quantitation of humaninsulin, its analogue, and their catabolites in plasma. Poster at the 49th ASMSConference, Chicago, 2001.
144. Farenc C., Enjalbal C., Sanchez P., Bressolle F., Audran M., Martinez J., andAubagnac J.L. Quantitative determination of rocuronium in human plasmaby liquid chromatography-electrospray ionization mass spectrometry. J.Chromatogr. A 910, 61, 2001.
145. Ballard K.D., Vickery W.E., Citrino R.D., Diamond F.X., and Rieders F. Anal-ysis of quarternary ammonium neuromuscular blocking agents in a forensicsetting using LC-MS/MS with internal standardization of a Q-TOF. Posterpresented at 49th ASMS Conference, Chicago, 2001.
146. Kerskes C.H., Lusthof K.J., Zweipfenning P.G., and Franke J.P. The detectionand identification of quaternary nitrogen muscle relaxants in biological fluidsand tissues by ion-trap LC-ESI-MS. J. Anal. Toxicol. 26, 29, 2002.
147. Kumazawa T., Seno H., Suzuki-Watanabe K., Hattori H., Ishii A., Sato K.,and Suzuki O. Determination of phenothiazines in human body fluids bysolid phase microextraction and liquid chromatography-tandem mass spec-trometry. J. Mass Spectrom. 35, 1091, 2000.
148. Zhang H., Heinig K., and Henion J. Atmospheric pressure ionization time-of-flight mass spectrometry coupled with fast liquid chromatography forquantitation and accurate mass measurement of five pharmaceutical drugsin human plasma. J. Mass Spectrom. 35, 423, 2000.
149. Kollroser M. and Schober C. Simultaneous determination of seven tricyclicantidepressant drugs in human plasma by direct-injection HPLC-APCI-MS-MS with an ion trap detector. Ther. Drug Monit. 24, 537, 2002.
150. Müller C., Vogt S., Goerke R., Kordon A., and Weinmann W. Identificationof selected psychopharmaceuticals and their metabolites in hair by LC/ESI-CID/MS and LC/MS/MS. Forensic Sci. Int. 113, 415, 2000.
151. McClean S., O’Kane E.J., and Smyth W.F. Electrospray ionization-mass spec-trometric characterization of selected anti-psychotic drugs and their detec-tion and determination in human hair samples by liquid chromatography-tandem mass spectrometry. J. Chromatogr. B 740, 141, 2000.
152. Hoskins J.M., Gross A.S., Shenfield G.M., and Rivory L.P. High-performanceliquid chromatography-electrospray ionization mass spectrometry methodfor the measurement of moclobemide and two metabolites in plasma. J.Chromatogr. B 754, 319, 2001.
1522_C02.fm Page 123 Wednesday, November 12, 2003 9:36 AM
© 2004 by CRC Press LLC
153. Sutherland F.C., Badenhorst D., de Jager A.D., Scanes T., Hundt H.K. SwartK.J., and Hundt A.F. Sensitive liquid chromatographic-tandem mass spectro-metric method for the determination of fluoxetine and its primary activemetabolite norfluoxetine in human plasma. J. Chromatogr. A 914, 45, 2001.
154. Shen Z., Wang S., and Bakhtiar R. Enantiomeric separation and quantifica-tion of fluoxetine (Prozac) in human plasma by liquid chromatography/tan-dem mass spectrometry using liquid-liquid extraction in 96-well plate format.Rapid Commun. Mass Spectrom. 16, 332, 2002.
155. Li C., Nan F., Shao Q., Liu P., Dai J., Zhen J., Yuan H., Xu F., Cui J., HuangB., Zhang M, and Yu C. Liquid chromatography/tandem mass spectrometryfor the determination of fluoxetine and its main active metabolite norfluox-etine in human plasma with deuterated fluoxetine as internal standard. RapidCommun. Mass Spectrom. 16, 1844, 2002.
156. Berna M., Shugert R, and Mullen J. Determination of olanzapine in humanplasma and serum by liquid chromatography/tandem mass spectrometry. J.Mass Spectrom. 33, 1003, 1998.
157. Berna M., Ackermann B., Ruterbories K., and Glass S. Determination ofolanzapine in human blood by liquid chromatography-tandem mass spec-trometry. J. Chromatogr. B 767, 163, 2002.
158. Bogusz M.J., Krüger K.D., Maier R.D., Erkwoh R., and Tuchtenhagen F.Monitoring of olanzapine in serum by liquid chromatography-atmosphericpressure chemical ionization mass spectrometry. J. Chromatogr. B 732, 257,1999.
159. Aravagiri M. and Marder S.R. Simultaneous determination of clozapine andits N-desmethyl and N-oxide metabolites in plasma by liquid chromatogra-phy/electrospray tandem mass spectrometry and its application to plasmalevel monitoring in schizophrenic patients. J. Pharm. Biomed. Anal. 26, 301,2001.
160. Aravagiri M. and Marder S.R. Simultaneous determination of risperidoneand 9-hydroxyrisperidone in plasma by liquid chromatography/electrospraytandem mass spectrometry. J. Mass Spectrom. 35, 718, 2000.
161. Goeringer K.E., McIntyre I.M., and Drummer O.H. Postmortem tissue con-centrations of venlafaxine. Forensic Sci. Int. 121, 70, 2001.
162. Ramos L., Bakhtiar R., Majumdar T., Hayes M., and Tse F. Liquid chroma-tography/atmospheric pressure chemical ionization tandem mass spectrom-etry enantiomeric separation of dl-threo-methylphenidate, (Ritalin‚) usinga macrocyclic antibiotic as the chiral selector. Rapid Commun. Mass Spectrom.13, 2054, 1999.
163. Ramos L., Bakhtiar R., and Tse F. Liquid-liquid extraction using 96-well plateformat in conjunction with liquid chromatography/tandem mass spectrom-etry for quantitative determination of methylphenidate (Ritalin‚) in humanplasma. Rapid Commun. Mass Spectrom. 14, 740, 2000.
1522_C02.fm Page 124 Wednesday, November 12, 2003 9:36 AM
© 2004 by CRC Press LLC
164. Oertel R., Richter K., Ebert U., and Kirch W. Determination of scopolaminein human serum and microdialysis samples by liquid chromatography-tan-dem mass spectrometry. J. Chromatogr. B 750, 12, 2001.
165. Xia Y., McGuffey J.E., Wang L., Sosnoff C.S., and Bernert J.T. Analysis of urinarynicotine metabolite profiles by LC atmospheric pressure ionization tandemmass spectrometry. Poster at the 49th ASMS Conference, Chicago, 2001.
166. Goldmeier D. and Lamba H. Prolonged erections produced by dihydroco-deine and sildenafil. Brit. Med. J. 324, 1555, 2002.
167. Weinmann W., Lehmann N., Miller C., Wiedmann A., and Svoboda M. Post-mortem detection and identification of sildenafil (Viagra) and its metabolitesby LC/MS and LC/MS/MS. Int. J. Legal Med. 114, 252, 2001.
168. Dumestre-Toulet V., Cirimele V., Ludes B., Beloousoff T., Gromb S., and KintzP. Last performance with sildenafil (Viagra). Poster at the 39th InternationalTIAFT Meeting, Prague, 2001.
169. Rudy J.A., Uboh C.E., Soma L., Birks E., Kahler M., Tsang D., Watson A., andTeleis D. Identification of sildenafil and metabolites in equine plasma and urineby LC-MS-MS. Poster presented at 49th ASMS Conference, Chicago, 2001.
170. Guan F., Ishii A., Seno H., Watanabe-Suzuki K., Kumazawa T., and SuzukiO. Identification and quantification of cardiac glycosides in blood and urinesample by HPLC/MS/MS. Anal. Chem. 71, 4034, 1999.
171. Lacassie E., Marquet P., Martin-Dupont S., Gaulier J.M., and Lachatre G. Anon-fatal case of intoxication with foxglove, documented by means of liquidchromatography-electrospray mass spectrometry. J. Forens. Sci. 45, 1154,2000.
172. Gaillard Y. and Pepin G. LC-EI-MS determination of veratridine and cevadinein two fatal cases of Veratrum album poisoning. J. Anal. Toxicol. 25, 485, 2001.
173. Wang X., Plomley J.B., Newman R.A., and Cisneros A. LC/MS/MS analysisof an oleander extract for cancer treatment. Anal. Chem. 72, 3547, 2000.
174. Tracqui A., Kintz P., Branche F., and Ludes B. Confirmation of oleanderpoisoning by HPLC/MS. Int. J. Legal Med. 111, 32, 1998.
175. Arao T., Fuke C., Takaesu H., Nakamoto M., Morinaga Y., and Miyazaki T.Simultaneous determination of cardenolides by sonic spray ionization liquidchromatography-ion trap mass spectrometry — a fatal case of oleander poi-soning. J. Anal. Toxicol. 26, 222, 2002.
176. Reilly C.A., Crouch D.J., Yost G.S., and Fatah A.A. Determination of capsaicin,dihydrocapsaicin, and nonivamide in self-defense weapons by liquid chro-matography-mass spectrometry and liquid chromatography-tandem massspectrometry. J. Chromatogr. A 912, 259, 2001.
177. Reilly C.A., Crouch D.J., Yost G.S., and Fatah A.A. Determination of capsaicin,nonivamide, and dihydrocapsaicin, in blood and tissue by liquid chromatog-raphy-tandem mass spectrometry. J. Anal. Toxicol. 26, 313, 2002.
1522_C02.fm Page 125 Wednesday, November 12, 2003 9:36 AM
© 2004 by CRC Press LLC
178. Darby S.M., Miller M.L., and Allen R.O. Forensic determination of ricin andthe alkaloid marker ricinine from castor bean extracts. J. Forensic Sci. 46,1033, 2001.
179. Baselt R.C. Disposition of Toxic Drugs and Chemicals in Man. Chemical Tox-icology Institute, Foster City, CA, 2000, p. 215.
180. Tracqui A., Kintz P., Ludes B., Rouge C., Douibi H., and Mangin P. High-performance liquid chromatography coupled to ion spray mass spectrometryfor the determination of colchicine at ppb levels in human biofluids. J. Chro-matogr. B 675, 235, 1996.
181. Jones G.R., Singer P.P., and Bannach B. Application of LC-MS analysis to acolchicine fatality. J. Anal. Toxicol. 26, 365, 2002.
182. Maurer H.H., Schmitt C.J., Weber A.A., and Kraemer T. Validated electrosprayliquid chromatographic-mass spectrometric assay for the determination ofthe mushroom toxins alpha- and beta-amanitin in urine after immunoaffinityextraction. J. Chromatogr. B 748, 125, 2000.
183. Smith R.M. Retention index scales used in high-performance liquid chroma-tography. In R.M. Smith, Ed., Retention and Selectivity in Liquid Chromatog-raphy, Journal of Chromatography Library, Vol. 57, Elsevier, Amsterdam, 1995,p. 93.
184. Bogusz M.J. Application of nitroalkanes and secondary retention index stan-dards for the identification of drugs, in R.M. Smith, Ed., Retention andSelectivity in Liquid Chromatography, Journal of Chromatography Library, Vol.57, Elsevier, Amsterdam, 1995, p. 171.
185. Bogusz M.J., Hill D.W., and Rehorek A. Comparability of RP-HPLC retentionindices of drugs in three databases. J. Liq. Chromatogr. 19, 1291, 1996.
186. Elliott S.P. and Hale K.A. Application of an HPLC-DAD drug screeningsystem based on retention indices and UV spectra. J. Anal. Toxicol. 22, 279,1998.
187. Bogusz M.J., Maier R.D., Krüger K.D., Webb K.S., Romeril J., and Miller M.L.Poor reproducibility of in-source collisional atmospheric pressure ionizationmass spectra of toxicologically relevant drugs. J. Chromatogr. B 844, 409, 1999.
188. Gergov M., Robson J.N., Duchoslav E., and Ojanpera I. Automated liquidchromatographic/tandem mass spectrometric method for screening beta-blocking drugs in urine. J. Mass Spectrom. 35, 912, 2000.
189. Gergov M., Robson J.N., Ojanpera I., Heinonen O.P., and Vuori E. Simulta-neous screening and quantitation of 18 antihistamine drugs in blood by liquidchromatography ionspray tandem mass spectrometry. Forensic Sci. Int. 121,108, 2001.
190. Rittner M., Pragst F., Bork W.R., and Neumann J. Screening method forseventy psychoactive drugs or drug metabolites in serum based on high-performance liquid chromatography-electrospray ionization mass spectrom-etry. J. Anal. Toxicol. 25, 112, 2001.
1522_C02.fm Page 126 Wednesday, November 12, 2003 9:36 AM
© 2004 by CRC Press LLC
191. Thieme D., Grosse J., Lang R., Müller R.K., and Wahl A. Screening, confir-mation and quantitation of diuretics in urine for doping control analysis byhigh-performance liquid chromatography-atmospheric pressure ionizationtandem mass spectrometry. J. Chromatogr. B 757, 49, 2001.
192. Lacassie E., Marquet P., Gaulier J.M., Dreyfuss M.F., and Lachatre G. Sensitiveand specific multiresidue methods for the determination of pesticides of var-ious classes in clinical and forensic toxicology. Forensic Sci. Int. 121, 116, 2001.
193. Marquet P., Dupuy J.L., and Lachaitre G. Development of a general unknownscreening procedure using liquid chromatography-ionspray-mass spectrom-etry. Poster at the 46th ASMS Conference, Orlando, FL, 1998.
194. Marquet P., Venisse N., Lacassie E., and Lachatre G., In-source CID massspectral libraries for the “general unknown” screening of drugs and toxicants.Analysis 28, 41, 2000.
195. Venisse N., Marquet P., Duchoslav E., Dupuy J.L., and Lachatre G. A generalunknown procedure for drugs and toxic compounds in serum using liquidchromatography-electrospray-single quadrupole mass spectrometry. J. Anal.Toxicol. 7, 7, 2003.
196. Saint-Marcoux F., Lachatre G., and Marquet P. Evaluation of an improvedgeneral unknown screening procedure using liquid chromatography-electro-spray mass spectrometry by comparison with gas chromatography and highperformance liquid chromatography-diode array detection. J. Am. Soc. MassSpectrom. 14, 14, 2003.
197. Weinmann W., Wiedemann A., Eppinger B., Renz M., and Svoboda M.Screening for drugs in serum by electrospray ionization/collision-induceddissociation and library searching. J. Am. Soc. Mass Spectrom. 10, 1028, 1999.
198. Weinmann W., Stoertzel M., Vogt S., and Wendt J. Tune compounds forelectrospray ionization/in source collision-induced dissociation with massspectra library searching. J. Chromatogr. A 926, 199, 2001.
199. Weinmann W., Stoertzel M., Vogt S., Svoboda M., and Wendt J. Tuningcompounds for electrospray ionization/in source collision-induced dissocia-tion and mass spectra library searching. J. Mass Spectrom. 36, 1013, 2001.
200. Mueller C., Schaefer P., Vogt S., and Weinmann W. Combining an ESI-CIDmass spectra and a UV-spectra library of drugs with an Access database forclinical and forensic-toxicological analysis. Poster at 50th ASMS Conference,Orlando, FL, 2002.
201. Lips A.G., Lameijer W., Fokkens R.H., and Nibbering N.M. Methodology forthe development of a drug library based upon collision-induced fragmenta-tion for the identification of toxicologically relevant drugs in plasma samples.J. Chromatogr. B 759, 191, 2001.
202. Gergov M., Boucher B., Ojanpera I., and Vuori E. Toxicological screening ofurine for drugs by liquid chromatography/time-of-flight mass spectrometrywith automated target library search based on elemental formulas. RapidCommun. Mass Spectrom. 15, 521, 2001.
1522_C02.fm Page 127 Wednesday, November 12, 2003 9:36 AM
© 2004 by CRC Press LLC
203. Pelander A., Ojanpera I., Gergov M., and Vuori E. Qualitative screeninganalysis of autopsy urine samples by improved LC/TOFMS method. Posterat the 40th TIAFT Meeting, Paris, 2002.
204. Weinmann W., Gergov M., and Goerner M. MS/MS-libraries with triplequadrupole-tandem mass spectrometers for drug identification and drugscreening. Analysis 28, 934, 2000.
205. Gergov M., Ojanpera I., and Vuori E. Simultaneous screening for 238 drugsin blood by liquid chromatography-ionspray/tandem mass spectrometry withmultiple action monitoring. J. Chromatogr. B, 795, 41, 2003.
206. Dams R., Murphy C.M., Choo R., Lambert W., and Huestis M. Developmentof a rugged and sensitive LC-APCI-MS/MS method combined with as sim-plified sample preparation for the comprehensive analysis of drugs of abuseof biological fluids. Poster at the 50th ASMS Conference, Orlando, FL, 2002.
207. Nordgren H. and Beck O. Use of LC-MS-MS for direct detection of drugs ofabuse in diluted urine. Poster at the 40th TIAFT Meeting, Paris, 2002.
208. Fitzgerald R.L., Rivera J.D., and Herold D.A. Broad spectrum drug identifi-cation directly from urine, using liquid chromatography-tandem mass spec-trometry. Clin. Chem. 45, 1224, 1999.
1522_C02.fm Page 128 Wednesday, November 12, 2003 9:36 AM
© 2004 by CRC Press LLC
3
Substance Abuse in Sports: Detection of Doping Agents in Hair by Mass Spectrometry
MARION VILLAINVINCENT CIRIMELE
PASCAL KINTZ
Contents
3.1 Introduction3.2 Procedures
3.2.1 Specimen Collection3.2.2 Decontamination Procedures
3.3 Analysis of Doping Agents3.3.1 Detection of Anabolic Steroids3.3.2 Detection of Corticosteroids3.3.3 Detection of
b
-Adrenergic Stimulants3.4 Discussion3.5 ConclusionsReferences
3.1 Introduction
It is generally accepted that chemical testing of biological fluids is the mostobjective means of diagnosis of drug use. The presence of a drug analyte ina biological specimen can be used as evidence of recent exposure. The stan-dard in drug testing is immunoassay screening, followed by gas chromato-graphic–mass spectrometric (GC/MS) confirmation conducted on a urinesample. More recently, a variety of body specimens other than urine, suchas saliva, sweat, meconium, or hair have been proposed to document drugexposure.
1522_C03.fm Page 129 Thursday, November 13, 2003 9:53 AM
© 2004 by CRC Press LLC
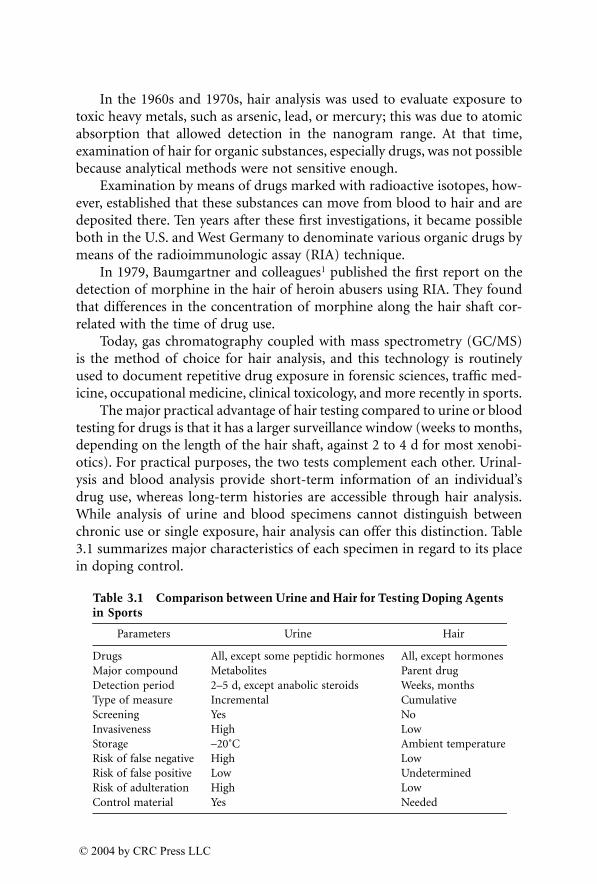
In the 1960s and 1970s, hair analysis was used to evaluate exposure totoxic heavy metals, such as arsenic, lead, or mercury; this was due to atomicabsorption that allowed detection in the nanogram range. At that time,examination of hair for organic substances, especially drugs, was not possiblebecause analytical methods were not sensitive enough.
Examination by means of drugs marked with radioactive isotopes, how-ever, established that these substances can move from blood to hair and aredeposited there. Ten years after these first investigations, it became possibleboth in the U.S. and West Germany to denominate various organic drugs bymeans of the radioimmunologic assay (RIA) technique.
In 1979, Baumgartner and colleagues
1
published the first report on thedetection of morphine in the hair of heroin abusers using RIA. They foundthat differences in the concentration of morphine along the hair shaft cor-related with the time of drug use.
Today, gas chromatography coupled with mass spectrometry (GC/MS)is the method of choice for hair analysis, and this technology is routinelyused to document repetitive drug exposure in forensic sciences, traffic med-icine, occupational medicine, clinical toxicology, and more recently in sports.
The major practical advantage of hair testing compared to urine or bloodtesting for drugs is that it has a larger surveillance window (weeks to months,depending on the length of the hair shaft, against 2 to 4 d for most xenobi-otics). For practical purposes, the two tests complement each other. Urinal-ysis and blood analysis provide short-term information of an individual’sdrug use, whereas long-term histories are accessible through hair analysis.While analysis of urine and blood specimens cannot distinguish betweenchronic use or single exposure, hair analysis can offer this distinction. Table3.1 summarizes major characteristics of each specimen in regard to its placein doping control.
Table 3.1 Comparison between Urine and Hair for Testing Doping Agents
in Sports
Parameters Urine Hair
Drugs All, except some peptidic hormones All, except hormonesMajor compound Metabolites Parent drugDetection period 2–5 d, except anabolic steroids Weeks, monthsType of measure Incremental CumulativeScreening Yes NoInvasiveness High LowStorage –20˚C Ambient temperatureRisk of false negative High LowRisk of false positive Low UndeterminedRisk of adulteration High LowControl material Yes Needed
1522_C03.fm Page 130 Thursday, November 13, 2003 9:53 AM
© 2004 by CRC Press LLC
It is generally proposed that drugs can enter into hair by two processes:adsorption from the external environment and incorporation into the grow-ing hair shaft from blood supplying the hair follicle. Drugs can enter the hairfrom exposure to chemicals in aerosols, smoke, or secretions from sweat andsebaceous glands. Sweat is known to contain drugs present in blood. Becausehair is very porous and can increase its weight up to 18% by absorbing liquids,drugs may be transfered easily to hair via sweat.
Drugs appear to be incorporated into the hair during at least three stages:from the blood during hair formation, from sweat and sebum, and fromexternal environment.
From various studies, it has been demonstrated that after the same dos-age, black hair incorporates much more of a drug than blond hair.
2,3
Thishas resulted in discussions about a possible racial bias of hair analysis and isstill under evaluation.
The possibility of racial bias due to differences in melanin concentrationsor in hair porosity is still under discussion. Melanins are responsible for thecolor of hair. Two types of melanin are present: eumelanin (with low sulfurcontent) and pheomelanin (with high sulfur content). Black and brown haircontain more eumelanin than red and blond hair. It appears that it is notsimply the concentration of drugs in blood that determines the concentrationin hair. Numerous factors may influence the incorporation of drugs into hair,such as the nature of the compounds (pKa, lipid solubility, and metabolismpattern) and variation in hair growth cycles. Until these mechanisms areelucidated, the quantitative results and extrapolation to the amount of drugintake from such a hair analysis should be considered with extreme caution.
4
3.2 Procedures
3.2.1 Specimen Collection
Collection procedures for hair analysis for drugs have not been standardized.In most published studies, the samples are obtained from random locationson the scalp. Hair is best collected from the area at the back of the head,called the
vertex posterior
. Compared with other areas of the head, this areahas less variability in the hair growth rate, the number of hairs in the growingphase is more constant, and the hair is less subject to age- and sex-relatedinfluences. Hair strands are cut as close as possible from the scalp, and thelocation root-tip must be mentioned. Storage is achieved at ambiant tem-perature in aluminium foil, an envelope, or a plastic tube. The sample sizevaries considerably among laboratories and depends on the drug to be ana-lyzed and the test methodology. For example, when nandrolone orbetamethasone is investigated, a 100 mg sample is recommended. Sample
1522_C03.fm Page 131 Thursday, November 13, 2003 9:53 AM
© 2004 by CRC Press LLC
sizes reported in the literature range from a single hair to 200 mg, cut asclose to the scalp as possible. When sectional analysis is performed, the hairis cut into segments of about 1, 2, or 3 cm, which corresponds to about 1,2, or 3 months’ growth.
3.2.2 Decontamination Procedures
Contaminants of hair would be a problem if they were drugs of abuse ortheir metabolites, or if they interfered with the analysis and interpretation ofthe test results. It is unlikely that people would intentionally or accidentallyapply anything to their hair that would contain a drug of abuse. The mostcrucial issue facing hair analysis is the avoidance of technical and evidentiaryfalse-positives. Technical false-positives are caused by errors in the collection,processing, and analysis of specimens, while evidentiary false-positives arecaused by passive exposure to the drug. Various approaches for preventingevidentiary false-positives due to external contamination of the hair speci-mens have been described.
Most but not all laboratories use a wash step; however, there is no con-sensus or uniformity in the washing procedures. Among the agents used inwashing are detergents such as Prell shampoo, surgical scrubbing solutions,surfactants such as 0.1% sodium dodecylsulfate, phosphate buffer, or organicsolvents such as acetone, diethyl ether, methanol, ethanol, dichloromethane,hexane, or pentane of various volumes for various contact times. Generally,a single washing step is realized; sometimes a second identical wash is per-formed. As opposed to crack, cannabis, or smoked heroin, decontaminationwhen testing for doping agents does not appear to be a critical need.
3.3 Analysis of Doping Agents
3.3.1 Detection of Anabolic Steroids
Athletes use both endogenous (testosterone, DHEA) or exogenous (nan-drolone, stanozolol, mesterolone, etc.) anabolic steroids because it has beenclaimed that they increase lean body mass, increase strength, increase aggres-siveness, and lead to a shorter recovery time between workouts.
The first data available for endogenous steroids in hair were given late in1995 by the German group of Scherer and Reinhardt,
5
who determined byGC/MS androstenediol (9 to 19 pg/mg), testosterone (13 to 24 pg/mg),androstenedione (5 to 15 pg/mg), DHEA (21 to 56 pg/mg), dihydrotestoster-one (2 to 8 pg/mg) and 17alpha-hydroxy-progesterone (1 to 7 pg/mg). Someyears later, Kintz et al.
6,7
established the physiological concentrations of bothtestosterone and DHEA with a distinction between the hair of male and
1522_C03.fm Page 132 Thursday, November 13, 2003 9:53 AM
© 2004 by CRC Press LLC
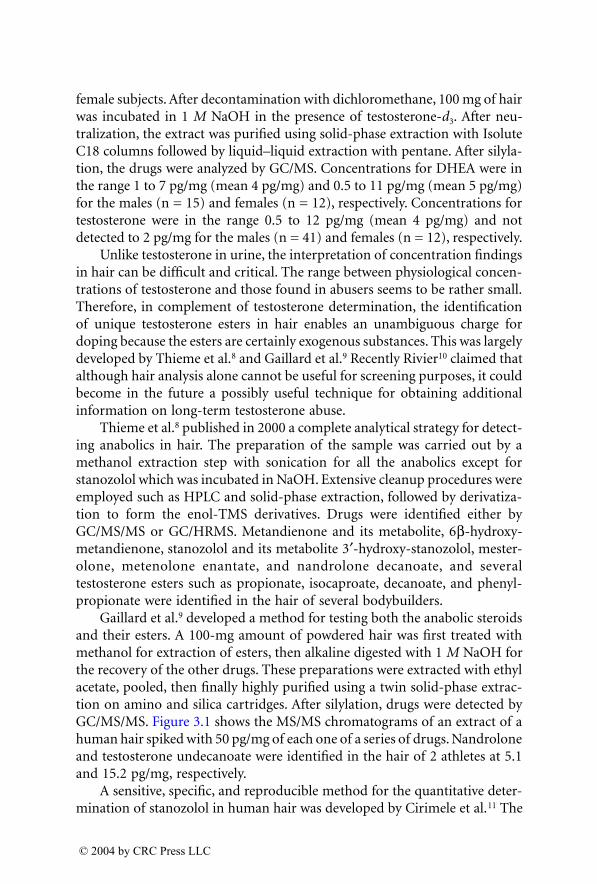
female subjects. After decontamination with dichloromethane, 100 mg of hairwas incubated in 1
M
NaOH in the presence of testosterone-
d
3
. After neu-tralization, the extract was purified using solid-phase extraction with IsoluteC18 columns followed by liquid–liquid extraction with pentane. After silyla-tion, the drugs were analyzed by GC/MS. Concentrations for DHEA were inthe range 1 to 7 pg/mg (mean 4 pg/mg) and 0.5 to 11 pg/mg (mean 5 pg/mg)for the males (n = 15) and females (n = 12), respectively. Concentrations fortestosterone were in the range 0.5 to 12 pg/mg (mean 4 pg/mg) and notdetected to 2 pg/mg for the males (n = 41) and females (n = 12), respectively.
Unlike testosterone in urine, the interpretation of concentration findingsin hair can be difficult and critical. The range between physiological concen-trations of testosterone and those found in abusers seems to be rather small.Therefore, in complement of testosterone determination, the identificationof unique testosterone esters in hair enables an unambiguous charge fordoping because the esters are certainly exogenous substances. This was largelydeveloped by Thieme et al.
8
and Gaillard et al.
9
Recently Rivier
10
claimed thatalthough hair analysis alone cannot be useful for screening purposes, it couldbecome in the future a possibly useful technique for obtaining additionalinformation on long-term testosterone abuse.
Thieme et al.
8
published in 2000 a complete analytical strategy for detect-ing anabolics in hair. The preparation of the sample was carried out by amethanol extraction step with sonication for all the anabolics except forstanozolol which was incubated in NaOH. Extensive cleanup procedures wereemployed such as HPLC and solid-phase extraction, followed by derivatiza-tion to form the enol-TMS derivatives. Drugs were identified either byGC/MS/MS or GC/HRMS. Metandienone and its metabolite, 6
b
-hydroxy-metandienone, stanozolol and its metabolite 3
¢
-hydroxy-stanozolol, mester-olone, metenolone enantate, and nandrolone decanoate, and severaltestosterone esters such as propionate, isocaproate, decanoate, and phenyl-propionate were identified in the hair of several bodybuilders.
Gaillard et al.
9
developed a method for testing both the anabolic steroidsand their esters. A 100-mg amount of powdered hair was first treated withmethanol for extraction of esters, then alkaline digested with 1
M
NaOH forthe recovery of the other drugs. These preparations were extracted with ethylacetate, pooled, then finally highly purified using a twin solid-phase extrac-tion on amino and silica cartridges. After silylation, drugs were detected byGC/MS/MS. Figure 3.1 shows the MS/MS chromatograms of an extract of ahuman hair spiked with 50 pg/mg of each one of a series of drugs. Nandroloneand testosterone undecanoate were identified in the hair of 2 athletes at 5.1and 15.2 pg/mg, respectively.
A sensitive, specific, and reproducible method for the quantitative deter-mination of stanozolol in human hair was developed by Cirimele et al.
11
The
1522_C03.fm Page 133 Thursday, November 13, 2003 9:53 AM
© 2004 by CRC Press LLC
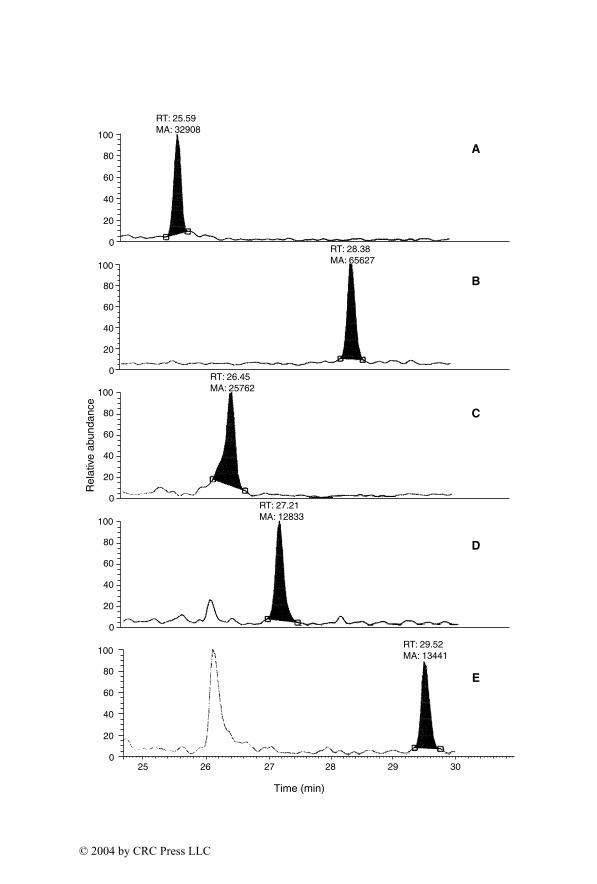
0
20
40
60
80
100
RT: 25.59MA: 32908
A
0
20
40
60
80
100
RT: 28.38MA: 65627
B
0
20
40
60
80
100
RT: 26.45MA: 25762
C
0
20
40
60
80
100RT: 29.52MA: 13441
E
Rel
ativ
e ab
unda
nce
0
20
40
60
80
100
RT: 27.21MA: 12833
D
25 26 28 29 30
Time (min)
27
1522_C03.fm Page 134 Thursday, November 13, 2003 9:53 AM
© 2004 by CRC Press LLC
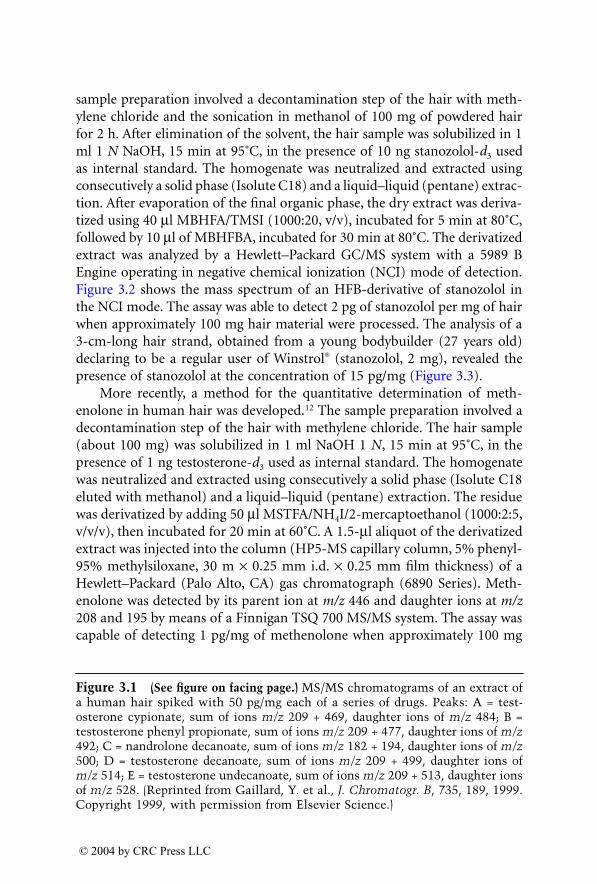
sample preparation involved a decontamination step of the hair with meth-ylene chloride and the sonication in methanol of 100 mg of powdered hairfor 2 h. After elimination of the solvent, the hair sample was solubilized in 1ml 1
N
NaOH, 15 min at 95˚C, in the presence of 10 ng stanozolol-
d
3
usedas internal standard. The homogenate was neutralized and extracted usingconsecutively a solid phase (Isolute C18) and a liquid–liquid (pentane) extrac-tion. After evaporation of the final organic phase, the dry extract was deriva-tized using 40
m
l MBHFA/TMSI (1000:20, v/v), incubated for 5 min at 80˚C,followed by 10
m
l of MBHFBA, incubated for 30 min at 80˚C. The derivatizedextract was analyzed by a Hewlett–Packard GC/MS system with a 5989 BEngine operating in negative chemical ionization (NCI) mode of detection.Figure 3.2 shows the mass spectrum of an HFB-derivative of stanozolol inthe NCI mode. The assay was able to detect 2 pg of stanozolol per mg of hairwhen approximately 100 mg hair material were processed. The analysis of a3-cm-long hair strand, obtained from a young bodybuilder (27 years old)declaring to be a regular user of Winstrol
®
(stanozolol, 2 mg), revealed thepresence of stanozolol at the concentration of 15 pg/mg (Figure 3.3).
More recently, a method for the quantitative determination of meth-enolone in human hair was developed.
12
The sample preparation involved adecontamination step of the hair with methylene chloride. The hair sample(about 100 mg) was solubilized in 1 ml NaOH 1
N
, 15 min at 95˚C, in thepresence of 1 ng testosterone-
d
3
used as internal standard. The homogenatewas neutralized and extracted using consecutively a solid phase (Isolute C18eluted with methanol) and a liquid–liquid (pentane) extraction. The residuewas derivatized by adding 50
m
l MSTFA/NH
4
I/2-mercaptoethanol (1000:2:5,v/v/v), then incubated for 20 min at 60˚C. A 1.5-
m
l aliquot of the derivatizedextract was injected into the column (HP5-MS capillary column, 5% phenyl-95% methylsiloxane, 30 m
¥
0.25 mm i.d.
¥
0.25 mm film thickness) of aHewlett–Packard (Palo Alto, CA) gas chromatograph (6890 Series). Meth-enolone was detected by its parent ion at
m/z
446 and daughter ions at
m/z
208 and 195 by means of a Finnigan TSQ 700 MS/MS system. The assay wascapable of detecting 1 pg/mg of methenolone when approximately 100 mg
Figure 3.1
(See figure on facing page.)
MS/MS chromatograms of an extract ofa human hair spiked with 50 pg/mg each of a series of drugs. Peaks: A = test-osterone cypionate, sum of ions
m/z
209 + 469, daughter ions of
m/z
484; B =testosterone phenyl propionate, sum of ions
m/z
209 + 477, daughter ions of
m/z
492; C = nandrolone decanoate, sum of ions
m/z
182 + 194, daughter ions of
m/z
500; D = testosterone decanoate, sum of ions
m/z
209 + 499, daughter ions of
m/z
514; E = testosterone undecanoate, sum of ions
m/z
209 + 513, daughter ionsof
m/z
528. (Reprinted from Gaillard, Y. et al.,
J. Chromatogr. B
, 735, 189, 1999.Copyright 1999, with permission from Elsevier Science.)
1522_C03.fm Page 135 Thursday, November 13, 2003 9:53 AM
© 2004 by CRC Press LLC
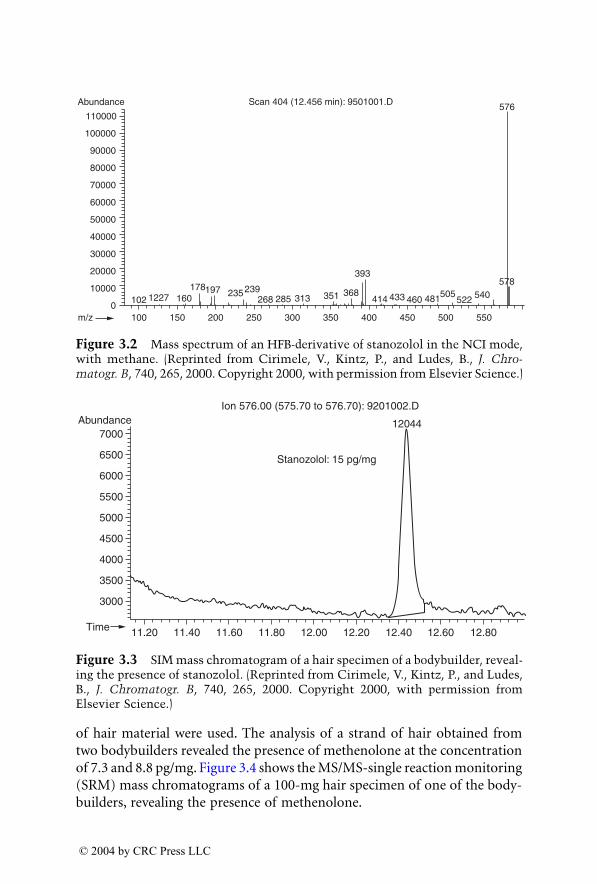
of hair material were used. The analysis of a strand of hair obtained fromtwo bodybuilders revealed the presence of methenolone at the concentrationof 7.3 and 8.8 pg/mg. Figure 3.4 shows the MS/MS-single reaction monitoring(SRM) mass chromatograms of a 100-mg hair specimen of one of the body-builders, revealing the presence of methenolone.
Figure 3.2
Mass spectrum of an HFB-derivative of stanozolol in the NCI mode,with methane. (Reprinted from Cirimele, V., Kintz, P., and Ludes, B.,
J. Chro-matogr. B
, 740, 265, 2000. Copyright 2000, with permission from Elsevier Science.)
Figure 3.3
SIM mass chromatogram of a hair specimen of a bodybuilder, reveal-ing the presence of stanozolol. (Reprinted from Cirimele, V., Kintz, P., and Ludes,B.,
J. Chromatogr. B
, 740, 265, 2000. Copyright 2000, with permission fromElsevier Science.)
Abundance
110000
100000
90000
80000
70000
60000
50000
40000
30000
20000
10000
m/z0
100 150 200 250 300 350 400 450 500 550
102 1227 160
578540522
505481460433414
393
368351313285268239235197178
576Scan 404 (12.456 min): 9501001.D
Stanozolol: 15 pg/mg
Ion 576.00 (575.70 to 576.70): 9201002.D
12044
Time
3000
3500
4000
4500
5000
5500
6000
6500
7000Abundance
11.20 11.40 11.60 11.80 12.00 12.20 12.40 12.60 12.80
1522_C03.fm Page 136 Thursday, November 13, 2003 9:53 AM
© 2004 by CRC Press LLC
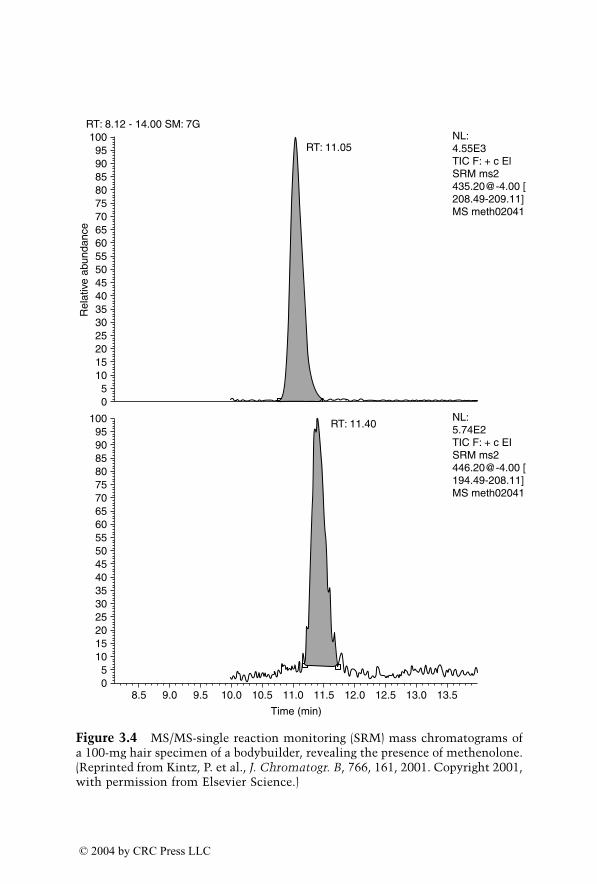
Figure 3.4
MS/MS-single reaction monitoring (SRM) mass chromatograms ofa 100-mg hair specimen of a bodybuilder, revealing the presence of methenolone.(Reprinted from Kintz, P. et al.,
J. Chromatogr. B
, 766, 161, 2001. Copyright 2001,with permission from Elsevier Science.)
8.5 9.0 9.5 10.0 10.5 11.0 11.5 12.0 12.5 13.0 13.5
Time (min)
RT: 11.40NL:5.74E2TIC F: + c EISRM [email protected] [194.49-208.11]MS meth02041
05
101520253035404550556065707580859095
100
RT: 11.05NL:4.55E3TIC F: + c ElSRM [email protected] [208.49-209.11]MS meth02041
05
101520253035404550556065707580859095
100
Rel
ativ
e ab
unda
nce
RT: 8.12 - 14.00 SM: 7G
1522_C03.fm Page 137 Thursday, November 13, 2003 9:53 AM
© 2004 by CRC Press LLC
Using quite the same method (except for the internal standard wherenandrolone-
d
3
was used), the same group developed a procedure to test fornandrolone, the most abused anabolic agent.
13
The limit of detection of theassay was 0.5 pg/mg. Nandrolone tested positive in the hair of 3 athletes atthe concentration of 1, 3.5 and 7.5 pg/mg.
Nandrolone is metabolized to norandrosterone and noretiocholanolone.Other 19-norsteroids, such as norandrostenedione or norandrostenediol,which are classified as anabolic androgenic steroids by the IOC, are availableover the counter or through the Internet and have the same metabolites asnandrolone. Although norandrostenediol and norandrostenedione arebanned by the IOC, there is a great need in forensic science and for a surveyof athletes to discriminate nandrolone from other 19-norsteroids. This isobviously not possible in urine, as the metabolites are common. Hair canidentify the exact nature of the parent compound (e.g., nandrolone, noran-drostenediol, or norandrostenedione, in case of positive urine for norandros-terone), as it has been accepted by the scientific community that the parentcompound is the major analyte that is incorporated in hair. Thus, hair anal-ysis would discriminate nandrolone abuse from over-the-counter prepara-tions containing 19-norsteroids. Recently, our laboratory was requested byan attorney to evaluate potential doping practices by an athlete. The 30-year-old subject tested positive for norandrosterone in urine at 230 ng/ml. Theanalysis was done in an accredited laboratory, but the athlete denied theresult. The analysis of a strand of hair obtained from the athlete revealed thepresence of 19-norandrostenedione at the concentration of 7 pg/mg,
14
mak-ing an unique distinction with nandrolone doping.
In 1999,
15
two male bodybuilders were arrested by French Customs inpossession of 2050 tablets and 251 ampules of various anabolic steroids. Itwas claimed that the steroids were for personal use and not for trafficking assuggested by the police. Hair from both males were positive for nandrolone(196 and 260 pg/mg), testosterone (46 and 71 pg/mg), and stanozolol (135and 156 pg/mg), clearly indicating steroids abuse.
In a series of 7 steroid abusers, Deng et al.
16
identified nandrolone (20pg/mg) and methyltestosterone (170 pg/mg).
More recently, Dumestre-Toulet et al.,
17
in a case of trafficking of dopingagents, identified by GC/MS nandrolone (1 to 7.5 pg/mg, n = 3), stanozolol(2 to 84 ng/mg, n = 4), methenolone (17 and 34 pg/mg), testosterone enan-thate (0.6 to 18.8 ng/mg, n = 5), and testosterone cypionate (3.3 and 4.8ng/mg) in the hair of bodybuilders.
As a full example, the procedure to test for endogenous anabolics in thislaboratory is described in detail.
The hair was decontaminated twice using 5 ml of methylene chloride for2 min at room temperature, and then was pulverized in a ball mill. A total
1522_C03.fm Page 138 Thursday, November 13, 2003 9:53 AM
© 2004 by CRC Press LLC
of 100 mg of decontaminated hair were incubated in 1 ml 1
N
NaOH, 15min at 95˚C, in presence of 1 ng of testosterone-
d
3
used as internal standard(IS). After cooling, the homogenate was neutralized with 1 ml 1
M
HCl, and2 ml of 0.2
M
phosphate buffer (pH 7.0) were added.The Isolute C18 columns were conditioned with 3 ml of methanol, fol-
lowed by 2 ml of deionized water. After sample addition, the columns werewashed twice with 1 ml of deionized water. After column drying, analyteelution occured with the addition of 3 aliquots of 0.5 ml of methanol. Theeluant was evaporated to dryness under nitrogen flow, and the residue recon-stitued in 1 ml of 0.2
M
phosphate buffer (pH 7.0). A further purificationstep was achieved by the addition of 100 mg of Na
2
CO
3
/NaHCO
3
(1:10, w/w)and 2 ml of pentane. After agitation and centrifugation, the organic phasewas removed and evaporated to dryness. The residue was derivatized byadding 50
m
l MSTFA/NH
4
I/2-mercaptoethanol (1000/2/5; v/v/v) and thenincubated for 20 min at 60˚C.
A 2-
m
l aliquot of the derivatized extract was injected into the column ofa Hewlett–Packard gas chromatograph (6890 Series). The flow of carrier gasthrough the column (HP5-MS capillary column, 5% phenyl-95% methylsil-oxane, 30 m
¥
0.25 mm i.d.
¥
0.25 mm film thickness) was 1 ml/min.The injector temperature was 270˚C and splitless injection was employed
with a split valve off-time of 1 min. The column oven temperature wasprogrammed to rise from an initial temperature of 150˚C, maintained for 1min, to 295˚C at 5˚C/min.
The detector was a Finnigan TSQ 700 operated in the electron impactmode and in selected reaction monitoring. The parent ions,
m/z
417, 432,432, 434, and 435 for DHEA, testosterone, epitestosterone, DHT, and the IS,respectively, were selected in the first quadrupole. The corresponding daugh-ter ions,
m/z
237 and 327, 196 and 209, 196 and 209, 143 and 195, and 209for DHEA, testosterone, epitestosterone, DHT, and the IS, respectively, wereselected in the third quadrupole after collision with argon at a cell pressureat 0.6 mTorr. The collision offset voltage was –8 V. The electron multiplierwas operated at 1900 V.
Results shown in Table 3.2 were obtained from about one hundred hairsamples.
Table 3.2 Compendium of Results for Endogenous
Anabolics in Hair
Compounds Mean (pg/mg) Mini (pg/mg) Maxi (pg/mg)
Testosterone 8.4 1.5 64.2Epitestosterone 2.4 0.5 17.6DHEA 16.9 0.8 94.2DHT 1.8 0.5 4.2
1522_C03.fm Page 139 Thursday, November 13, 2003 9:53 AM
© 2004 by CRC Press LLC
Figure 3.5 shows a chromatogram representative of an authentic hairspecimen with the corresponding concentrations: 2.5, 3.2, 10, and 0.6 pg/mgfor testosterone, epitestosterone, DHEA, and DHT, respectively.
3.3.2 Detection of Corticosteroids
Cortisone and hydrocortisone, naturally occuring hormones, influencemetabolism, inflammation, and electrolyte and water balance. Their syntheticderivatives are used in therapeutic medicine for their antiinflammatory andimmunosuppressive actions. They are used in certain sports to improve theperformances of the athletes (euphoria, motor activity).
Cirimele et al.
18
published in 1999 the first identification of such a drug,in this case, prednisone, in the hair of a subject treated for years. A 50-mghair specimen was incubated overnight in Sorensen buffer, then extracted bysolid-phase extraction using an Isolute C18 column. Prednisone was detectedby LC/MS at 1280 pg/mg. Using the same preparation technique, and cortisol-
d
3
as an internal standard, the same group published
19
several months latera screening procedure for 10 corticosteroids, with detection limits in the rangeof 30 to 170 pg/mg. Two applications were documented for prednisone andbeclomethasone, identified in hair at 140 and 230 pg/mg, respectively.
Using a 2 mm i.d. column, Cirimele et al.
20
demonstrated in 10 patientstreated with prednisone a low but not insignifiant correlation (R
2
= 0.578,
p
< 0.03) between the total amount of ingested drug and the measured con-centrations in hair. The procedure was sensitive enough to detect prednisonein the hair of patients treated with a low 5 mg/d dose.
Repetitive abuse of corticosteroids by athletes can be demonstrated bysegmental analysis along the hair shaft, in contrast to ponctual urinalysis. Asingle treatment of about 1 week will make positive a single 1-cm segment,while long-term abuse will lead to the identification of the corticoid(s) inseveral segments. For such an application, particularly in the case of longi-tudinal surveys of athletes, hair analysis appears as the solution of choice todocument doping practices. It has been demonstrated
21
that a single oraltherapeutic treatment with 4-mg/d betamethasone for 9 consecutive days isdetectable through hair analysis. The drug tested at a concentration of 4.7pg/mg in the corresponding hair segment, whereas no betamethasone couldbe identified in the distal hair strand. Extraction of the drug was classic fromthis group, however, to enhance sensitivity a MIC 15 CP Nucleosil C18, 150
¥
1 mm i.d. column was used.A confirmatory method was developed
22
for the quantitative determina-tion in hair of the most common corticosteroids used as doping agents byathletes. Drugs were extracted from 50 mg of powdered hair by methanolicextraction followed by a solid-phase extraction on a C18 column. Detectionwas performed with an electrospray ionization mass spectrometer in the
1522_C03.fm Page 140 Thursday, November 13, 2003 9:53 AM
© 2004 by CRC Press LLC
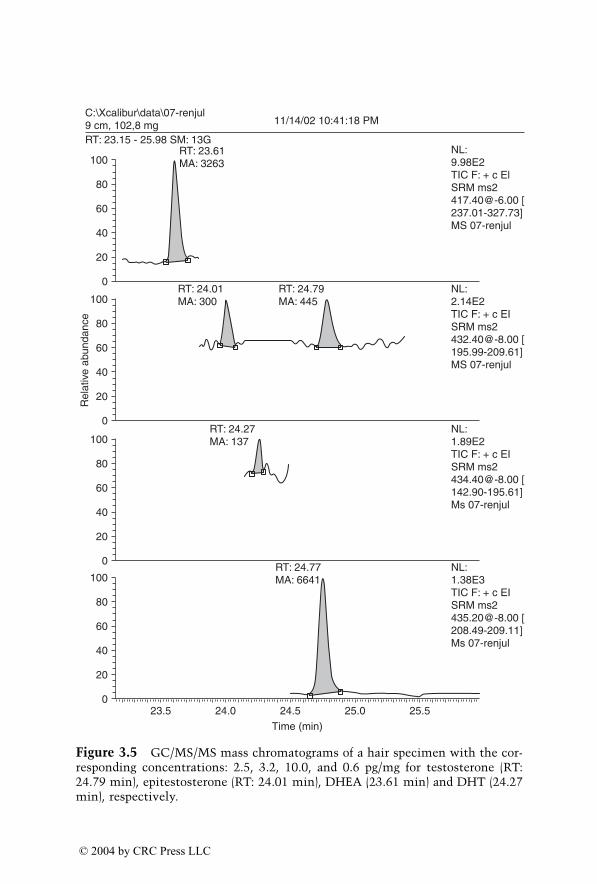
Figure 3.5
GC/MS/MS mass chromatograms of a hair specimen with the cor-responding concentrations: 2.5, 3.2, 10.0, and 0.6 pg/mg for testosterone (RT:24.79 min), epitestosterone (RT: 24.01 min), DHEA (23.61 min) and DHT (24.27min), respectively.
100
80
60
40
20
023.5 24.0 24.5 25.0 25.5
Time (min)
RT: 24.77MA: 6641
100
80
60
40
20
0
RT: 24.27MA: 137
100
80
60
40
20
0
RT: 24.01MA: 300
RT: 24.79MA: 445
100
80
60
40
20
0
RT: 23.61MA: 3263
NL:1.38E3TIC F: + c EISRM [email protected] [208.49-209.11]Ms 07-renjul
NL:1.89E2TIC F: + c EISRM [email protected] [142.90-195.61]Ms 07-renjul
NL:2.14E2TIC F: + c EISRM [email protected] [195.99-209.61]MS 07-renjul
NL:9.98E2TIC F: + c ElSRM [email protected] [237.01-327.73]MS 07-renjul
Rel
ativ
e ab
unda
nce
C:\Xcalibur\data\07-renjul9 cm, 102,8 mg 11/14/02 10:41:18 PM
RT: 23.15 - 25.98 SM: 13G
1522_C03.fm Page 141 Thursday, November 13, 2003 9:53 AM
© 2004 by CRC Press LLC
negative ion mode. The limits of sensitivity were about 100 pg/mg. Hair fromathletes revealed the presence of hydrocortisone acetate, methylprednisolone,triamcinolone acetonide, and dexa/betametasone at 430, 1350, 280, and 1310pg/mg, respectively. According to the authors, who tested in parallel thecorresponding urine specimens, the comparison of the results demonstratedonce again the dramatic complementary use of urinalysis and hair analysis.23
3.3.3 Detection of bbbb-Adrenergic Stimulants
Because of their sympatomimetic properties (stimulant effects) and theiractivity as anabolic agents at higher dosages, b2-agonists are banned. How-ever, salbutamol is permitted by inhalers only and must be declared inwriting prior to the competition. To date, only three studies have beenpublished in the literature for these drugs in human hair, two for clenbuteroland one for salbutamol, respectively. In their paper,24 Gleixner et al. identifiedclenbuterol after incubation in 1,4-dithiothreitol, NaOH, and tertiary butyl-methyl ether by enzyme immunoassay (EIA), with confirmation byHPLC/EIA. Clenbuterol accumulated in hair after 10 mg/d for 25 d at con-centrations ranging from 23 to 161 pg/mg, with relatively high concentra-tions in dark hair. The drug was also found in the hair from two bodybuildersat 50 and 92 pg/mg, respectively.
Machnik et al.25 tested clenbuterol in the hair of four females who hadtherapeutically taken the drug as a tocolyticum. Hair was incubated in 1 MKOH, and the drug extracted with tertiary butylmethyl ether, followed in somecases by immunoaffinity chromatography, then derivatizated with MSTFA-ammonium iodide-TMS ethanethiol. High-resolution mass spectrometry wasused to identify clenbuterol. Limit of detection was about 0.8 pg/mg. Thelevels of clenbuterol determined in hair ranged from 2 to 236 pg/mg.
A screening procedure was developed26 for simultaneous identificationsof b2-agonists and b-blockers. The procedure involved overnight incubationin 0.1 M HCl, followed by neutralization, solid-phase extraction with anIsolute C18 column, derivatization with trimethylboroxine/ethyl acetate, andGC/MS detection. Limits of detection were 2 pg/mg for both salbutamol andclenbuterol. In nine asthmatic patients, the salbutamol concentrations in hairwere in the range 27 to 192 pg/mg. In two asthma deaths, salbutamol con-centrations in hair were 210 and 87 pg/mg, respectively. Finally, the labora-tory identified salbutamol in the hair of a swimmer, which was positive inurine, at a level of 71 pg/mg. Figure 3.6 shows the mass chromatogram andthe electron ionization mass spectrum of the extracted hair specimen.
Most of the positive specimens are reported for salbutamol (46% of thetotal urines in 1999 for the IOC laboratory in France). However, as this drugis permitted for specific therapeutic purposes, together with a medical pre-scription, it appears very easy to evade the test, and almost all cases are
1522_C03.fm Page 142 Thursday, November 13, 2003 9:53 AM
© 2004 by CRC Press LLC
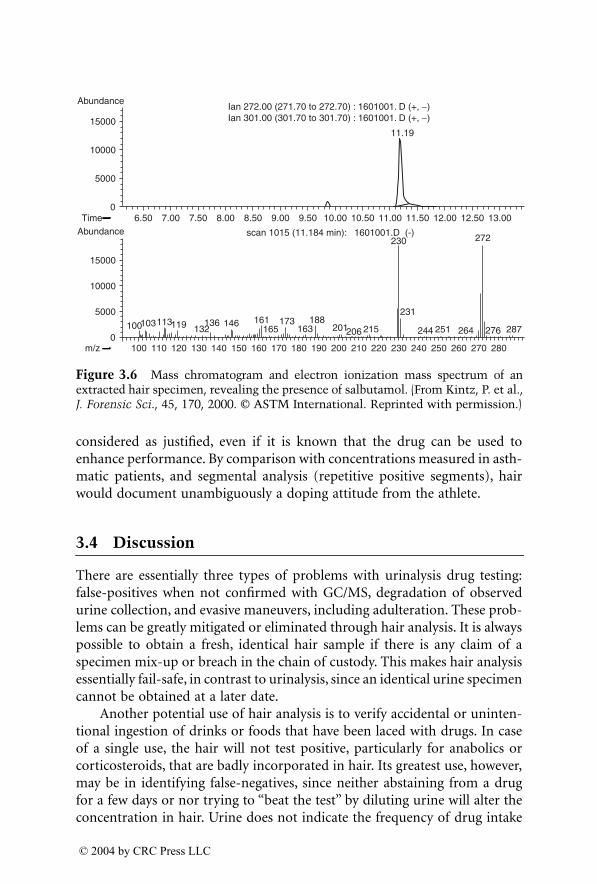
considered as justified, even if it is known that the drug can be used toenhance performance. By comparison with concentrations measured in asth-matic patients, and segmental analysis (repetitive positive segments), hairwould document unambiguously a doping attitude from the athlete.
3.4 Discussion
There are essentially three types of problems with urinalysis drug testing:false-positives when not confirmed with GC/MS, degradation of observedurine collection, and evasive maneuvers, including adulteration. These prob-lems can be greatly mitigated or eliminated through hair analysis. It is alwayspossible to obtain a fresh, identical hair sample if there is any claim of aspecimen mix-up or breach in the chain of custody. This makes hair analysisessentially fail-safe, in contrast to urinalysis, since an identical urine specimencannot be obtained at a later date.
Another potential use of hair analysis is to verify accidental or uninten-tional ingestion of drinks or foods that have been laced with drugs. In caseof a single use, the hair will not test positive, particularly for anabolics orcorticosteroids, that are badly incorporated in hair. Its greatest use, however,may be in identifying false-negatives, since neither abstaining from a drugfor a few days or nor trying to “beat the test” by diluting urine will alter theconcentration in hair. Urine does not indicate the frequency of drug intake
Figure 3.6 Mass chromatogram and electron ionization mass spectrum of anextracted hair specimen, revealing the presence of salbutamol. (From Kintz, P. et al.,J. Forensic Sci., 45, 170, 2000. © ASTM International. Reprinted with permission.)
100103113119 132136 146 161
165173
163188
201206 215
231
244 251 264 276 287
272230scan 1015 (11.184 min): 1601001.D (-)Abundance
15000
10000
5000
0100 110 120 130 140 150 160 170 180 190 200 210 220 230 240 250 260 270 280m/z
11.19
Ian 272.00 (271.70 to 272.70) : 1601001. D (+, −)Ian 301.00 (301.70 to 301.70) : 1601001. D (+, −)
6.50 7.00 7.50 8.00 8.50 9.00 9.50 10.00 10.50 11.00 11.50 12.00 12.50 13.00
Abundance
15000
10000
5000
0Time
1522_C03.fm Page 143 Thursday, November 13, 2003 9:53 AM
© 2004 by CRC Press LLC
in subjects who might deliberately abstain for several days before biomedicalscreenings. While analysis of urine specimens cannot distinguish betweenchronic use or single exposure, hair analysis can make this distinction.
Although hair is not yet a valid specimen for the International OlympicCommittee (IOC), it is accepted in most courts of justice. During the period1998–2002, some conflicting results were observed, all involving athletes thattested positive in urine in accredited IOC laboratories and negative in hairin forensic certified laboratories.
A lot of experience has been aquired in the detection of opiates andcocaine in hair. In contrast, there is a serious lack of suitable references tointerpret the analytical findings for doping agents. In hair, doping agentconcentrations for such drugs as anabolic steroids, corticosteroids, or b2-agonists are in the range of picograms per milligram, whereas cocaine,amphetamines, or opiates are generally found in the range of several nano-grams per milligram. Therefore, it was the feeling of the Society of HairTesting to obtain a consensus on hair testing for doping agents.27
This consensus is as follows:
1. Hair analysis can essentially contribute to doping analysis in specialcases, in addition to urine.
2. Hair specimens are not suitable for general routine control.3. In case of positive urine results, the negative hair result cannot exclude
the administration of the detected drug and cannot overrule thepositive urine result.
4. In case of negative urine result, the positive hair result demonstratesdrug exposure during the period prior to the sample collection.
5. Before using hair analysis for doping control, sample collection andanalytical methods have to be harmonized with respect to the sophis-ticated requirements already valid for urine.
6. The Society feels responsible to support efforts that lead to this har-monization.
7. This statment was adopted on June 16, 1999 by the Society of HairTesting.
It is clear that there is a great deal of research to be performed before thescientific questions and curiosity surrounding hair drug testing is satisfied.Some of this is due to a lack of consensus among the active investigators onhow to interpret the results on an analysis of hair. Among the unansweredquestions, five are of critical importance: (1) What is the minimal amountof drug detectable in hair after administration? (2) What is the relationshipbetween the amount of the drug used and the concentration of the drug orits metabolites in hair? (3) What is the influence of hair color? (4) Is there
1522_C03.fm Page 144 Thursday, November 13, 2003 9:53 AM
© 2004 by CRC Press LLC
any racial bias in hair testing? (5) What is the influence of cosmetic treat-ments? Several answers were recently provided28 on these specific topics.
It is always possible to obtain a fresh identical hair sample if there is anyclaim of a specimen mix-up or breach in the chain of custody. This makeshair analysis essentially fail-safe, in contrast to urine analysis, since an iden-tical urine specimen cannot be obtained at a later date. Clearly, hair analysiscan thus function as a “safety net” for urine analysis.
Unfortunately, according to the International Olympic Committee(IOC), basic scientific knowledge in hair biology is still lacking to make scalphair analysis now a valid specimen in the field of doping control and thefollowing points should be resolved before applications: (1) analytical meth-ods are missing for several doping compounds, such as diuretics, (2) peptidehormones are not extractable, (3) hair washing, discoloring, tinting, andhair color (resulting in potential ethnic discrimination) appear to influencethe concentration of drug measured in hair, and (4) drug incorporationwithin the hair longitudinal axis and upon time is not proved to be regularon all occasions.
3.5 Conclusions
It appears that the value of hair analysis for the identification of drug usersis steadily gaining recognition. This can be seen from its growing use inpreemployment screening, in forensic sciences, and in clinical applications.Hair analysis may be a useful adjunct to conventional drug testing in dopingcontrol. Specimens can be more easily obtained with less embarrassment,and hair can provide a more accurate history of drug use.
Although there are still controversies on how to interpret the results,particularly concerning external contamination, cosmetic treatments, ethnicbias, or drug incorporation, pure analytical work in hair analysis has reacheda sort of plateau, having solved almost all the analytical problems.
Though GC/MS is the method of choice in practice, GC/MS/MS orLC/MS are today used in several laboratories, even for routine cases, partic-ularly to target low dosage compounds like corticoids.
In the case of doping control, drugs are screened in urine specimensaccording to validated standard operating procedures in accredited labora-tories. As forensic laboratories can be involved in testimony dealing withdoping agents, the idea of using hair for doping control has emerged as hairanalysis has been accepted in court in other cases. Courts can request addi-tional information on the pattern of use of doping substances, such as duringthe 1998 cycling Tour de France where blood, urine, and hair were simulta-neously collected. Hair can both confirm repetitive abuse and identify the
1522_C03.fm Page 145 Thursday, November 13, 2003 9:53 AM
© 2004 by CRC Press LLC
exact nature of the parent compound (e.g., nandrolone, norandrostendiol,or norandrostendione, in the case of positive urine for norandrosterone).Moreover, long-term use (over several months) of restricted compounds(only authorized under specific conditions and for a short period), such assalbutamol or corticoids, can be documented through hair analysis. Thedetermination of testosterone esters in hair should allow a definitive unam-biguous confirmation of the administration of exogenous testosterone.
However, some issues have to be discussed before considering hair as avalid specimen by the IOC and the International Sport Federations. Therelationship between urine and hair results is not yet established and negativehair result does not mean “no doping.” The potential ethnic discriminationmust be evaluated to avoid inequality during doping control.
In contrast with the problems associated with cosmetic treatments or theabsence of specimen (bald or fully shaved subject), external contaminationdoes not constitute a major trouble when testing for doping agents.
References
1. Baumgartner, A.M. et al., Radioimmunoassay of hair for determining opiate-abuse histories, J. Nuclear Med., 20, 748, 1979.
2. Borges, C.R., Wilkins, D.G., and Rollins, D.E., Amphetamine and N-acetyl-amphetamine incorporation into hair: an investigation of the potential roleof drug basicity in hair color bias, J. Anal. Toxicol., 25, 221, 2001.
3. Henderson, G.L., Harkey, M.R., and Zhou, C., Incorporation of isotopicallylabeled cocaine into human hair: race as a factor, J. Anal. Toxicol., 22, 156,1998.
4. Nakahara, Y. et al., Hair analysis for drug abuse III. Movement and stabilityof methoxyphenamine (as a model compound of methamphetamine) alonghair shaft with hair growth, J. Anal. Toxicol., 16, 253, 1992.
5. Scherer, C.R. and Reinhardt, G., Nachweis sechs endogener Steroide in men-schlichen Haaren mit GC/MS und Isotopenverdünnungsanalyse. In AlthoffH., Ed., Abstract from 74. Jahrestagung der Deutschen Gesellschaft für Rechts-medizin. Aachen, 1995, 55.
6. Kintz, P. et al., Identification of testosterone and testosterone esters in humanhair, J. Anal. Toxicol., 23, 352, 1999.
7. Kintz, P., Cirimele, V., and Ludes, B., Physiological concentrations of DHEAin human hair, J. Anal. Toxicol., 23, 424, 1999.
8. Thieme, D. et al., Analytical strategy for detecting doping agents in hair,Forensic Sci. Int., 107, 335, 2000.
9. Gaillard, Y. et al., Gas chromatographic-tandem mass spectrometric deter-mination of anabolic steroids and their esters in hair. Application in dopingcontrol and meat quality control, J. Chromatogr. B, 735, 189, 1999.
1522_C03.fm Page 146 Thursday, November 13, 2003 9:53 AM
© 2004 by CRC Press LLC
10. Rivier, L., New trends in doping analysis, Chimia, 56, 84, 2002.
11. Cirimele, V., Kintz, P., and Ludes, B., Testing of the anabolic stanozolol inhuman hair by gas chromatography–negative ion chemical ionization massspectrometry, J. Chromatogr. B, 740, 265, 2000.
12. Kintz, P. et al., Doping control for methenolone using hair analysis by gaschromatography–tandem mass spectrometry, J. Chromatogr. B, 766, 161,2002.
13. Kintz, P. et al., Doping control for nandrolone using hair analysis, J. Pharm.Biomed. Anal., 24, 1125, 2001.
14. Kintz, P., Cirimele, V., and Ludes, B., Discrimination of the nature of dopingwith 19-norsteroids through hair analysis, Clin. Chem., 46, 2020, 2000.
15. Kintz, P. et al., Testing for anabolic steroids in hair from two bodybuilders,Forensic Sci. Int., 101, 209, 1999.
16. Deng, X.S., Kurosu, A., and Pounder, D.J., Detection of anabolic steroids inhead hair, J. Forensic Sci., 44, 343, 1999.
17. Dumestre-Toulet, V. et al., Hair analysis of seven bodybuilders for anabolicsteroids, ephedrine and clenbuterol, J. Forensic Sci., 47, 211, 2002.
18. Cirimele, V. et al., First identification of prednisone in human hair by liquidchromatography–ionspray mass spectrometry, J. Anal. Toxicol., 23, 225,1999.
19. Cirimele, V. et al., Identification of ten corticosteroids in human hair by liquidchromatography-ionspray mass spectrometry, Forensic Sci. Int., 107, 381,2000.
20. Cirimele, V. et al., Prednisone concentrations in human hair, J. Anal. Toxicol.,26, 110, 2002.
21. Raul, J.S. et al., A single therapeutic treatment with betamethasone is detect-able in hair, J. Anal. Toxicol., 26, 582, 2002.
22. Bévalot, F. et al., Analysis of corticosteroids in hair by liquid chromatogra-phy-electrospray ionization mass spectrometry, J. Chromatogr. B, 740, 227,2000.
23. Gaillard, Y., Vaysette, F., and Pépin, G., Compared interest between hairanalysis and urinalysis in doping controls. Results for amphetamines, corti-costeroids, and anabolic steroids in racing cyclists, Forensic Sci. Int., 107, 361,2000.
24. Gleixner, A., Sauerwein, H., and Meyer, H.H.D., Detection of the anabolicb2-adrenoceptor agonist clenbuterol in human scalp hair by HPLC/EIA, Clin.Chem., 42, 1869, 1996.
25. Machnik, M. et al., Long-term detection of clenbuterol in human scalp hairby gas chromatography-high resolution mass spectrometry, J. Chromatogr. B,723, 147, 1999.
26. Kintz, P. et al., Doping control for b-adrenergic compounds through hairanalysis, J. Forensic Sci., 45, 170, 2000.
1522_C03.fm Page 147 Thursday, November 13, 2003 9:53 AM
© 2004 by CRC Press LLC
27. Sachs, H. and Kintz, P., Consensus of the Society of Hair Testing on hairtesting for doping agents, Forensic Sci. Int., 107, 3, 2000.
28. Kintz, P., Cirimele, V., and Ludes, B., Pharmacological criteria that can affectthe detection of doping agents in hair, Forensic Sci. Int., 107, 325, 2000.
1522_C03.fm Page 148 Thursday, November 13, 2003 9:53 AM
© 2004 by CRC Press LLC
0-8493-1522-0/04/$0.00+$1.50© 2004 by CRC Press LLC
4
Forensic Applications of Isotope Ratio Mass Spectrometry
WOLFRAM MEIER-AUGENSTEIN
RAY H. LIU
Contents
4.1 Introduction4.1.1 Convention4.1.2 Variations in Stable Isotope Contents4.1.3 Discrimination Power
4.2 Instrumentation4.2.1 Introduction4.2.2 Dual-Inlet Isotope Ratio/Mass Spectrometry (IRMS)4.2.3 Continuous-Flow IRMS
4.2.3.1 Bulk Stable Isotope Analysis (BSIA)4.2.3.2 Compound Specific Isotope Analysis (CSIA)4.2.3.3 Hyphenated CSIA Systems
4.3 Isotope Dilution4.4 Sample Differentiation
4.4.1 Detection of Adulteration in Food Products4.4.2 Dietary Composition as a Basis for Sample
Differentiation4.4.3 Drugs
4.4.3.1 Marijuana4.4.3.2 Coca Leaves4.4.3.3 Heroin, Morphine, and Cutting Agents4.4.3.4 Synthetic Drugs
4.4.4 Antidoping Testing4.4.5 Explosives
4.5 Stable Isotope Coding as a Tracing Mechanism:Methamphetamine Example
References
1522_C04.fm Page 149 Thursday, November 13, 2003 9:54 AM
© 2004 by CRC Press LLC
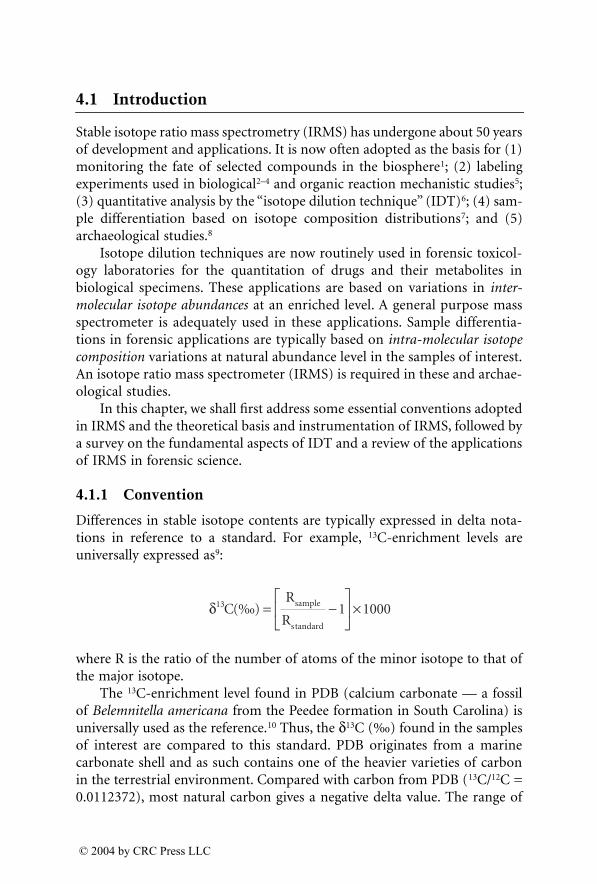
4.1 Introduction
Stable isotope ratio mass spectrometry (IRMS) has undergone about 50 yearsof development and applications. It is now often adopted as the basis for (1)monitoring the fate of selected compounds in the biosphere
1
; (2) labelingexperiments used in biological
2–4
and organic reaction mechanistic studies
5
;(3) quantitative analysis by the “isotope dilution technique” (IDT)
6
; (4) sam-ple differentiation based on isotope composition distributions
7
; and (5)archaeological studies.
8
Isotope dilution techniques are now routinely used in forensic toxicol-ogy laboratories for the quantitation of drugs and their metabolites inbiological specimens. These applications are based on variations in
inter-molecular isotope abundances
at an enriched level. A general purpose massspectrometer is adequately used in these applications. Sample differentia-tions in forensic applications are typically based on
intra-molecular isotopecomposition
variations at natural abundance level in the samples of interest.An isotope ratio mass spectrometer (IRMS) is required in these and archae-ological studies.
In this chapter, we shall first address some essential conventions adoptedin IRMS and the theoretical basis and instrumentation of IRMS, followed bya survey on the fundamental aspects of IDT and a review of the applicationsof IRMS in forensic science.
4.1.1 Convention
Differences in stable isotope contents are typically expressed in delta nota-tions in reference to a standard. For example,
13
C-enrichment levels areuniversally expressed as
9
:
where R is the ratio of the number of atoms of the minor isotope to that ofthe major isotope.
The
13
C-enrichment level found in PDB (calcium carbonate — a fossilof
Belemnitella americana
from the Peedee formation in South Carolina) isuniversally used as the reference.
10
Thus, the
d
13
C (‰) found in the samplesof interest are compared to this standard. PDB originates from a marinecarbonate shell and as such contains one of the heavier varieties of carbonin the terrestrial environment. Compared with carbon from PDB (
13
C/
12
C =0.0112372), most natural carbon gives a negative delta value. The range of
d13 1 1000C ‰R
Rsample
s dard
( )tan
= -È
ÎÍ
˘
˚˙ ¥
1522_C04.fm Page 150 Thursday, November 13, 2003 9:54 AM
© 2004 by CRC Press LLC
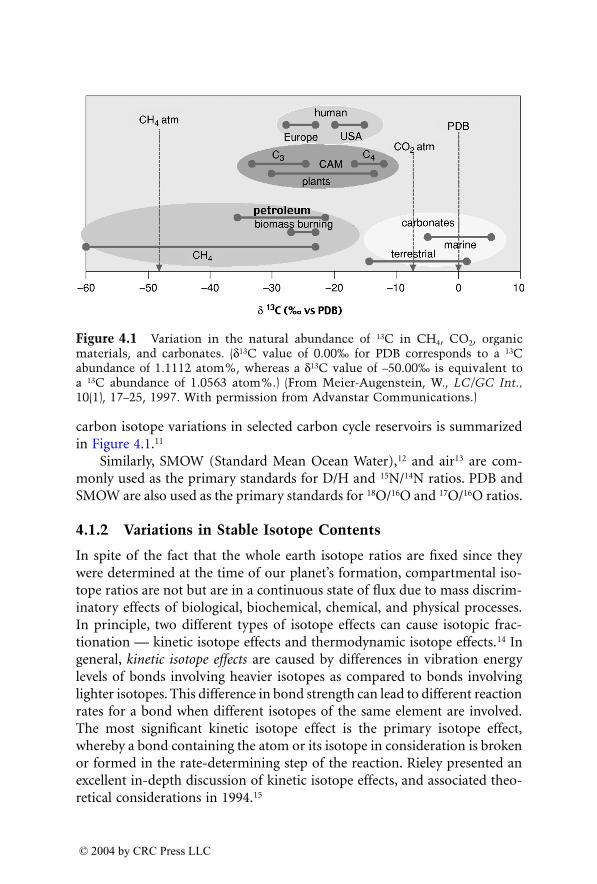
carbon isotope variations in selected carbon cycle reservoirs is summarizedin Figure 4.1.
11
Similarly, SMOW (Standard Mean Ocean Water),
12
and air
13
are com-monly used as the primary standards for D/H and
15
N/
14
N ratios. PDB andSMOW are also used as the primary standards for
18
O/
16
O and
17
O/
16
O ratios.
4.1.2 Variations in Stable Isotope Contents
In spite of the fact that the whole earth isotope ratios are fixed since theywere determined at the time of our planet’s formation, compartmental iso-tope ratios are not but are in a continuous state of flux due to mass discrim-inatory effects of biological, biochemical, chemical, and physical processes.In principle, two different types of isotope effects can cause isotopic frac-tionation — kinetic isotope effects and thermodynamic isotope effects.
14
Ingeneral,
kinetic isotope effects
are caused by differences in vibration energylevels of bonds involving heavier isotopes as compared to bonds involvinglighter isotopes. This difference in bond strength can lead to different reactionrates for a bond when different isotopes of the same element are involved.The most significant kinetic isotope effect is the primary isotope effect,whereby a bond containing the atom or its isotope in consideration is brokenor formed in the rate-determining step of the reaction. Rieley presented anexcellent in-depth discussion of kinetic isotope effects, and associated theo-retical considerations in 1994.
15
Figure 4.1
Variation in the natural abundance of
13
C in CH
4
, CO
2
, organicmaterials, and carbonates. (
d
13
C value of 0.00‰ for PDB corresponds to a
13
Cabundance of 1.1112 atom%, whereas a
d
13
C value of –50.00‰ is equivalent toa
13
C abundance of 1.0563 atom%.) (From Meier-Augenstein, W.,
LC/GC
Int.,
10(1), 17–25, 1997. With permission from Advanstar Communications.)
1522_C04.fm Page 151 Thursday, November 13, 2003 9:54 AM
© 2004 by CRC Press LLC
The second kind of isotope effect is associated with differences in phys-ico–chemical properties such as infrared absorption, molar volume, vaporpressure, boiling point, and melting point. Of course, these properties are alllinked to the same parameters as those mentioned for the kinetic isotopeeffect, i.e., bond strength, reduced mass, and, hence, vibration energy levels.However, to set it apart from the kinetic isotope effect, this effect is referredto as the
thermodynamic isotope effect
because it manifests itself in processeswhere chemical bonds are neither broken nor formed. Typical examples forsuch processes in which the results of thermodynamic isotope effects can beobserved are infrared spectroscopy, distillation, and any kind of two-phasepartitioning. This thermodynamic isotope effect or physico–chemical isotopeeffect is the reason for the higher infrared absorption of
13
CO
2
as comparedto
12
CO
2
, the enrichment of ocean surface water with H
218
O, and the isotopicfractionation observed during chromatographic separations.
16
Due to the high precision of isotope abundance measurements by mod-ern IRMS instruments, even minute changes in the isotopic composition ofa given compound can be reliably detected, irrespective of whether theseminute changes have been caused by kinetic isotope effects associated withenzyme-mediated biochemical reactions or batch-to-batch variations of reac-tion conditions during its chemical synthesis. The resulting variation in thenatural abundance of, e.g.,
13
C can be as high as 0.1 atom%. This wide rangereflects the varying degree of mass discrimination associated with the differ-ent pathways of carbon assimilation and fixation, but can also reflect differentgrowing conditions due to climatic and geographic differences.
4.1.3 Discrimination Power
Analytical methods currently applied in support of law enforcement agenciesestablish a degree of identity between one substance and another by meansof identifying their constituent elements, functional groups, and by elucidat-ing their chemical structures. Should the spectroscopic data of two com-pounds correspond, it may be concluded that they are chemically identical.However, an argument can be brought forward as a defense that althoughtwo substances in question are chemically identical, they are not the same,i.e., not sharing the same origin, hence coming from a different source. Theanalytical technique at the heart of this chapter, IRMS, permits this conten-tion to be tested and provides the resolution to the question of whether twocompounds or substances are truly identical. With the help of stable isotopefinger-printing (or stable isotope “DNA”), forensic scientists will be able tolink a person to an event, a crime scene, or a criminal organization (such asa terrorist group) based on a unique characteristic of physical evidence.
For example, research carried out on cocaine base has confirmed thepotential probative power of the data provided by this analytical technique
1522_C04.fm Page 152 Thursday, November 13, 2003 9:54 AM
© 2004 by CRC Press LLC
by analyzing the isotopic composition of trimethoxycocaine and truxillineextracted from coca leaves sampled at different geographic locations in SouthAmerica.
17
This work confirmed that the stable isotope make-up of a sub-stance is a function of its origin. In other words, two substances that arechemically the same may have different stable isotope compositions if eithertheir origin and/or (bio)chemical history differ. This finding will remove thedefense of substances that are chemically the same not necessarily originatingfrom identical sources and will thus be a significant advance in forensicscience, intelligence gathering, and crime detection and reduction.
Stable isotope finger-printing or “chemical DNA,” in conjunction withother spectroscopic data, will significantly increase the probative power ofanalytical results for drugs, flammable liquids, explosives, fibers, textiles,paints, varnishes, papers, inks, plastics, adhesives, and organic materials ingeneral
æ
indeed any nonbiological physical evidence. Multidimensionalisotope analysis (or multiisotope analysis) of a given material can provide acombined specificity on a scale hitherto known only for DNA analysis. If oneassumes that two given organic compounds (e.g., truxilline and trimethox-ycocaine) made up of C, N, H, and O would occur naturally in only 14significantly different isotopic variations (in fact, this number would be muchhigher), the combined specificity of a 4-dimensional isotope analysis (
2
H,
13
C,
15
N, and
18
O) would thus be 1/{(14
2
)
4
} or 1/14(
2*4
), i.e., 1 in 1.47 billion.
4.2 Instrumentation
4.2.1 Introduction
Mass spectrometry is best known among chemists as one of the most impor-tant analytical techniques for the characterization of molecular structure andamount, elemental composition, and spatial arrangement.
18
In contrast, nat-ural or life scientists such as biomedical, biological, food, and geochemicalscientists regard MS as a tool that reveals origin and genesis, or the state ofcomplex systems through high precision measurements of isotopic abun-dances. The latter type of MS is more aptly named IRMS to denote differencesin instrumental design between IRMS and scanning MS systems, as well asthe fact that IRMS determines isotope abundances by measuring isotoperatios to reveal this other dimension of information locked into matter, whichis usually not available from structural or quantitative studies.
In contrast to single collector MS that yield structural information byscanning a mass range over several hundred Dalton for characteristic frag-ment ions, IRMS instruments achieve highly accurate and precise measure-ment of isotopic abundance at the expense of the flexibility of scanning MS.However, scanning mass spectrometers universally employ single detector
1522_C04.fm Page 153 Thursday, November 13, 2003 9:54 AM
© 2004 by CRC Press LLC
electron multipliers (EM) and therefore cannot simultaneously detect par-ticular isotope pairs for continuous isotope ratio measurement. For isotoperatio measurement, a MS has to be operated in a selected ion monitoringmode (SIM) to optimize sensitivity to selected masses. Even in SIM mode,limited accuracy and precision of such isotope ratio measurements imposea minimum working enrichment for
13
C and
15
N of at least 0.5 atom% excess(APE).
19,20
In other words, single collector scanning MS cannot provide reli-able quantitative information on isotopic composition at natural abundancelevel.
Isotope ratio mass spectrometry systems have been designed to measureisotopic composition at low enrichment and natural abundance levels. In anIRMS, molecular ions emerge from the ion source and are separated by amagnetic sector set to a single field strength throughout the experiment. Noenergy filtering is used so as to optimize transmission near unity, giving atypical absolute sensitivity of 10
–3
(about 1000 molecules enter the ion sourceper ion detected) and better. Mass-filtered ions are focused onto dedicatedFaraday cup (FC) detectors positioned specifically for the masses of interest.For example, IRMS instruments equipped to determine CO
2
have three FCsfor measurement of
m/z
44, 45, and 46, positioned so that the ion beam ofeach mass falls simultaneously on the appropriate cup. Each FC has a dedi-cated amplifier mounted on the vacuum housing to minimize noise pickup,and dedicated counters/recorders for continuous and simultaneous recordingof all relevant ion beams. FCs are the detectors of choice for IRMS due totwo major considerations. First, the absolute precision required for IRMSdeterminations is at least 10
–4
, which is attainable based on counting statisticswith at least 10
8
particles detected. Ion currents that achieve these levels arewell within the range detectable by FCs. For instance, the major ion beamcurrent for atmospheric CO
2
analysis,
m/z
44, will typically be around 10nA, with the minor
m/z
46 beam around 40 pA. Second, FCs are highly stableand rugged, and rarely need replacement, compared to EMs, whose sensitivitydegrades with use and age. This means that minute variations in very smallamounts of the heavier isotope are detected in the presence of large amountsof the lighter isotope. The abundance A
s
of the heavier isotope n
2
in a sample,given in atom%, is defined as:
A
s
= R
s
/(1 + R
s
)
¥
100 [atom%] (1)
where R
s
is the ratio n
2
/n
1
of the two isotopes for the sample. The enrichmentof an isotope in a sample as compared to a standard value (A
std
) is given inatom% excess (APE):
APE = A
s
– A
std
(2)
1522_C04.fm Page 154 Thursday, November 13, 2003 9:54 AM
© 2004 by CRC Press LLC
Since the small variations of the heavier isotope habitually measured byIRMS are of the order of –0.07 to +0.02 APE, the
d
-notation in units of permil (‰) has been adopted to report changes in isotopic abundance as a permil deviation compared to a designated isotopic standard:
d
s
= ([R
s
– R
std
]/R
std
)
¥
1000 [‰] (3)
where R
s
is the measured isotope ratio for the sample and R
std
is the measuredisotope ratio for the standard. To give a convenient rule-of-thumb approxi-mation, in the
d
-notation, a
13
C abundance in the range of –0.033 to +0.0549APE corresponds to a
d
13
C value range of –30‰ to +50‰. A change of +1‰is approximately equivalent to a change of 0.001 APE and 0.0003 APE for
13
C and
15
N, respectively.Natural abundance applications for the most part require the high-pre-
cision techniques introduced in the late 1940s; these techniques dominatedIRMS for four decades. They focused initially on the analysis of bulk materialsof high chemical complexity such as plant extracts or petroleum reduced tosimple gases by combustion to CO
2
or conversion to N
2
or H
2
. Analysis ofchemically pure materials was much more common for compounds thatoccur in relatively pure form in nature, such as water, because off-line samplepreparation is a time-consuming affair fraught with the risk of contaminationand subtle isotopic fractionation.
4.2.2 Dual-Inlet Isotope Ratio/Mass Spectrometry (IRMS)
However, until the commercial availability of continuous-flow isotope ratiomass spectrometer (CF-IRMS) systems enabling on-line isotope analysis oforganic compounds in the late 1980s, initial attempts to exploit the informa-tion locked into stable isotope ratios at natural abundance level for forensicpurposes were confined to employing dual-inlet IRMS systems. Typically, off-line preparation involves multiple steps on custom-designed vacuum linesequipped with high-vacuum and sample-compression pumps, concentratorsusing cryogenic or chemical traps, reactions in furnaces using catalysts ortrue reagents, and microdistillation steps. Contamination and isotopic frac-tionation are a constant threat at any step, and, in general, manual off-linemethods are slow and tedious, usually requiring large sample amounts.
7
Thequality of the results depends considerably on operator skill and dedication.
The dual-adjustable volume inlet system facilitates sample/standardcomparison under the most nearly identical of circumstances. It is necessaryfor highest precision to compensate for (a) normal fluctuations in instru-mental response and (b) ion source nonlinearity which produces isotoperatios that depend on the source gas pressure. The latter phenomenon can
1522_C04.fm Page 155 Thursday, November 13, 2003 9:54 AM
© 2004 by CRC Press LLC
be understood from consideration of the physical arrangement of an EI ionsource. The source includes magnets that collimate the electron flow fromthe filament through the ion box. Once formed, ions are accelerated acrossmagnetic field lines which induce minor but measurable mass selectivity. Asthe mean-free path of ions depends on the relatively high pressure in theclosed ion source, the mean position from which ions escape the ion boxdepends on pressure, as well as on mass. This translates into a subtle depen-dence of isotope ratio on pressure, which becomes apparent in the precisionof these measurements. The severity of this effect in any particular sourcedefines the relative importance of sample/standard pressure matching. Con-tinuous-flow IRMS instruments have only become available because modernion sources have been designed for maximum linearity and because the Hecarrier gas flow maintains the ion source pressure nearly constant and inde-pendent of the level of sample gas flowing into the source.
4.2.3 Continuous-Flow IRMS
4.2.3.1 Bulk Stable Isotope Analysis (BSIA)
In the IRMS inlet system referred to as “continuous flow,” a He carrier gaspasses continuously into the ion source and sweeps bands or peaks of analytegas into the source for analysis. This approach overcomes the sample sizerequirements for viscous flow because the He carrier gas stream maintainsviscous conditions independent of sample size. Although originally devel-oped for on-line coupling of a gas chromatograph (GC) to an IRMS, thisapproach has also been successfully used to connect IRMS to a variety ofautomated sample processing devices such as an elemental analyzer.
With the increasing use of bulk stable isotopes analysis (BSIA) in fieldssuch as geochemistry, ecology, bio-medicine, and nutritional sciences, agreat demand existed for the rapid analysis of large numbers of solid sam-ples. In 1983, Preston and Owens
21
demonstrated the first CF interface to amulti- (dual) collector IRMS for the bulk analysis of nitrogen from solidsamples. Precisions of about SD (
d
15
N) = 0.7‰ were obtained for 3.5
m
molaliquots of N
2
derived from urea in CF mode after flash combustion andseparation in a GC equipped with a gas separation column. These authorsobserved degradation in the precision due to ion source nonlinearities whenanalyzing samples of varying size, as is now observed in demanding CFanalyses. This system was the first high-precision multicollector CF-IRMS.Two years later, these authors extended the instrument to the analysis of Cwith similar reproducibility.
22
Modern commercially available elemental analyzers provide an auto-mated means for on-line high-precision isotope ratios for bulk analysis ofsolid and nonvolatile liquid samples. Samples are placed in a capsule, typically
1522_C04.fm Page 156 Thursday, November 13, 2003 9:54 AM
© 2004 by CRC Press LLC
silver or tin, and loaded into a carousel for automated analysis. The sampleis dropped into a heated reactor that contains an oxidant, such as copper andchromium oxide for C or S analysis, where combustion takes place in an Heatmosphere with an excess of oxygen. Combustion products are transportedby flowing He through a reduction furnace for removal of excess oxygen andconversion of nitrous oxides into N
2
. A drying tube is used to remove anyexcess water in the system. The gas-phase products are separated on a PLOTcolumn under isothermal conditions, and detected nondestructively by ther-mal conductivity before introduction to the IRMS.
Oxygen and hydrogen are the two most recent elements for whichelemental analyzer data for bulk compounds have been presented. Oxygen-containing samples are converted on-line to CO by pyrolytic reaction withcarbon (the “Unterzaucher reaction”) as first shown by Brand et al.,
23
usinga GC-based system; several other reports using this principle subsequentlyappeared, showing an elemental analyzer
24
or direct injection analysis.
25
The report of Farquhar et al.26 demonstrates the automated on-line con-version of the oxygen in water or nitrogen-containing plant dry matter toCO, using a pyrolysis-based reaction on carbonized nickel at about 1100˚C.CO is separated from N2, using a GC with a molecular sieve column;precisions of SD (d18O) = 0.2‰ are obtained. Begley and Scrimgeour haveshown the analysis of oxygen (d18O) and hydrogen (d2H) on a single sampleby measuring the isotope ratio of H2 gas produced in the pyrolytic reactorwith a high mass dispersion IRMS, capable of fully resolving analyte HD(m/z 3) from excess He carrier (m/z 4). Precisions for water, urine, andvolatile organic compounds are about SD (dD) = 2‰ and SD (d18O) =0.3‰.25
Nowadays, thanks to advances in electronics and instrument design, dual13C/15N analysis of the same sample in one analytical run is possible on acombustion/reduction EA-IRMS. Allowing for a good separation of the N2
peak from the CO2 peak to permit a high precision magnetic field jump, totalanalysis time can be as fast as 7 min per sample. Similarly, dual 2H/18O analysisfrom the same sample can be carried out using a high temperature thermalconversion EA (TC/EA). In addition to the aforementioned reaction oncarbonized nickel at 1100˚C, high temperature conversion on glassy carbonat 1400˚C is used as an alternative. Both solid and liquid samples, the latterby means of a special liquid injector, can be analyzed for 2H and 18O simul-taneously, with total analysis time being as fast as 6 min per sample. Inconclusion, EA-IRMS or TC/EA-IRMS would appear to be the method ofchoice for many forensic applications (drugs, explosives, hair, fingernails,etc.), at least as a quickly performed initial measurement to concentrate theefforts of more elaborate techniques and analyses on samples seeminglyidentical, based on their bulk isotopic composition.
1522_C04.fm Page 157 Thursday, November 13, 2003 9:54 AM
© 2004 by CRC Press LLC
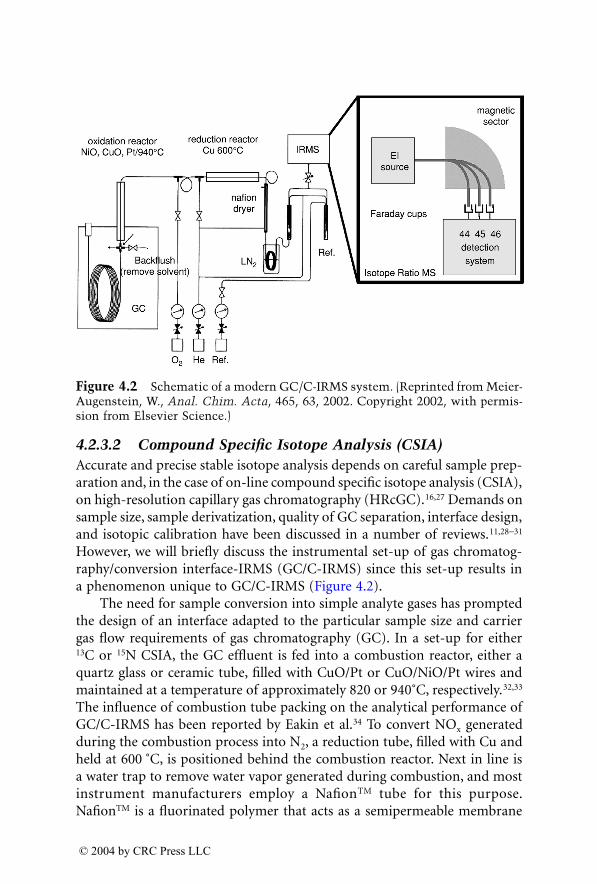
4.2.3.2 Compound Specific Isotope Analysis (CSIA)Accurate and precise stable isotope analysis depends on careful sample prep-aration and, in the case of on-line compound specific isotope analysis (CSIA),on high-resolution capillary gas chromatography (HRcGC).16,27 Demands onsample size, sample derivatization, quality of GC separation, interface design,and isotopic calibration have been discussed in a number of reviews.11,28-31
However, we will briefly discuss the instrumental set-up of gas chromatog-raphy/conversion interface-IRMS (GC/C-IRMS) since this set-up results ina phenomenon unique to GC/C-IRMS (Figure 4.2).
The need for sample conversion into simple analyte gases has promptedthe design of an interface adapted to the particular sample size and carriergas flow requirements of gas chromatography (GC). In a set-up for either13C or 15N CSIA, the GC effluent is fed into a combustion reactor, either aquartz glass or ceramic tube, filled with CuO/Pt or CuO/NiO/Pt wires andmaintained at a temperature of approximately 820 or 940˚C, respectively.32,33
The influence of combustion tube packing on the analytical performance ofGC/C-IRMS has been reported by Eakin et al.34 To convert NOx generatedduring the combustion process into N2, a reduction tube, filled with Cu andheld at 600 ˚C, is positioned behind the combustion reactor. Next in line isa water trap to remove water vapor generated during combustion, and mostinstrument manufacturers employ a NafionTM tube for this purpose.NafionTM is a fluorinated polymer that acts as a semipermeable membrane
Figure 4.2 Schematic of a modern GC/C-IRMS system. (Reprinted from Meier-Augenstein, W., Anal. Chim. Acta, 465, 63, 2002. Copyright 2002, with permis-sion from Elsevier Science.)
1522_C04.fm Page 158 Thursday, November 13, 2003 9:54 AM
© 2004 by CRC Press LLC
through which H2O passes freely while all the other combustion productsare retained in the carrier gas stream. Quantitative water removal prior toadmitting the combustion gases into the ion source is essential because anywater residue would lead to protonation of CO2 to produce HCO2
+, whichinterferes with analysis of 13CO2 (isobaric interference). A detailed study ofthis effect has been reported by Leckrone and Hayes.35
In dual-inlet systems, the analyte gas comes from an adjustable reservoir(bellow) and only travels a short distance prior to entering the ion source.For this reason, the gas pulses result in rectangular signals. In contrast, inCF-IRMS systems used for gas isotope analysis, on-line gas purification stepsand overall interface length lead to bell-shaped signals. This is, evidently,even more the case in GC/C-IRMS systems, where analyte peaks eluting fromthe GC column are fed into an on-line microchemical reactor to produce,e.g., CO2 peaks. However, due to the chromatographic isotope effect36,37 them/z 45 signal (13CO2) precedes the m/z 44 signal (12CO2) by 150 ms onaverage,32 an effect not observed in ordinary CF-IRMS systems. This timedisplacement depends on the nature of the compound and on chromato-graphic parameters such as polarity of the stationary phase, column temper-ature, and carrier gas flow.38 Therefore, loss of peak data due to unsuitably-set time windows for peak detection and, hence, partial peak integration willseverely compromise the quality of the isotope ratio measurement by GC/C-IRMS, as will traces of peak data from another sample compound due toclose proximity, resulting in peak overlap with the sample peak to be ana-lyzed. Due to the fact that isotope ratios cannot be determined accuratelyfrom the partial examination of a GC peak, HRcGC resulting in true baselineseparation for adjacent peaks is of paramount importance for accurate andprecise CSIA.
4.2.3.3 Hyphenated CSIA SystemsIn recent years, the research efforts of different groups working in the fieldof GC/C-IRMS have focused on extending the scope of on-line CSIA towardsthe measurement of 18O/16O and 2H/1H isotope ratios of organic compounds.In a first step towards on-line measurement of 2H isotope signatures oforganic compounds, Prosser and Srimgeour coupled a high mass dispersionIRMS to a GC via a pyrolysis interface including a 5 Å molecular sieve PLOTcolumn to achieve CSIA for 2H of fatty acids.39 Employing this instrumentalset-up, d2H-values for 16:0, 18:1, and 22:6 fatty acids (as methyl esters) fromtuna oil were reported as –148.5 ± 4.1‰, –155.3 ± 1.0‰, and –147.7 ±1.2‰ (vs. VSMOV), respectively.40 IRMS manufacturers now offer GC cou-pled IRMS systems where the GC effluent is fed into a pyrolysis (Py)/thermalconversion (TC) reactor, or even systems with a dual reactor set-up, i.e.,combustion and thermal conversion, giving the user the freedom to connect
1522_C04.fm Page 159 Thursday, November 13, 2003 9:54 AM
© 2004 by CRC Press LLC
the capillary coming from the GC column to either reactor, depending onthe analytical task.
Another hyphenated technique for position specific isotope analysis(PSIA) of fatty acids using an on-line pyrolysis system was described in detailfor the first time by Corso and Brenna.41 They coupled one GC (GC-1) forsample separation prior to pyrolysis to a second GC (GC-2), separatingpyrolytic products of the selected sample compound. Furthermore, theyinstalled a valve into GC-2 to permit separated pyrolysis fragments to beadmitted to an organic MS for structure analysis of these fragments.
Even more important, from a forensic point of view, is another typeof hyphenated CSIA system. Since organic compounds have to be convertedinto simple analyte gases isotopically representative of the parent material,naturally all structural information is lost that would otherwise be used toconfirm the identity of the organic compound whose isotopic signaturehas been measured. One “solution” to overcoming this dilemma is to ana-lyze another aliquot of the same sample on a scanning GC/MS systememploying the same chromatographic conditions that have been used forGC/C-IRMS analysis. This approach relies ultimately on a mere comparisonof retention index or retention time of a given peak, a modus operandi thatcould cause severe problems if such results would have to be put forwardas evidence in a court of law. This problem was recognized by one of theauthors who, in collaboration with an instrument manufacturer, developeda hyphenated mass spectrometric hybrid system that enables CSIA, whileat the same time recording a conventional mass spectrum of the targetcompound to aid its unambiguous identification.42 To this end, a GC/C-IRMS system was interfaced with an Ion Trap mass spectrometer to facil-itate splitting of the GC effluent to the conversion interface with simulta-neous admission to the ion source of the organic MS yet without incurringisotopic fractionation.43,44
4.3 Isotope Dilution
The use of mass spectrometry (MS)–based methodologies for quantitativeanalysis is now a routine practice in forensic science laboratories. In mostapplications, isotope-labeled analogs (ILA) of the analytes are used as theinternal standards (IS), and the MS is operated in selected ion monitoring(SIM) mode. Although 2H-analogs are most commonly used, recent com-parative studies suggested 13C-analogs (see Figure 4.3) could be more effec-tive.45 With practically identical chemical properties and MS fragmentationcharacteristics, an ILA is a preferred IS because it offers the followingadvantages.
1522_C04.fm Page 160 Thursday, November 13, 2003 9:54 AM
© 2004 by CRC Press LLC
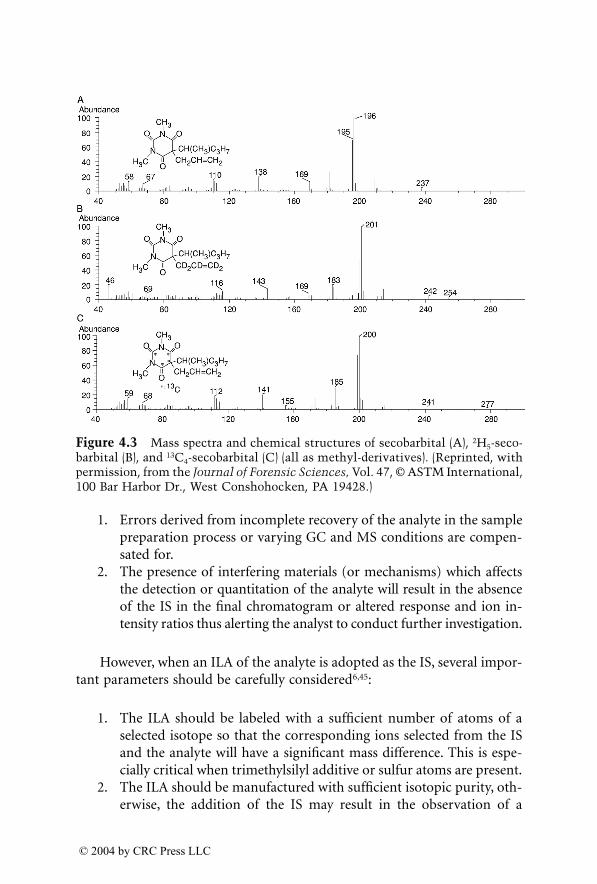
1. Errors derived from incomplete recovery of the analyte in the samplepreparation process or varying GC and MS conditions are compen-sated for.
2. The presence of interfering materials (or mechanisms) which affectsthe detection or quantitation of the analyte will result in the absenceof the IS in the final chromatogram or altered response and ion in-tensity ratios thus alerting the analyst to conduct further investigation.
However, when an ILA of the analyte is adopted as the IS, several impor-tant parameters should be carefully considered6,45:
1. The ILA should be labeled with a sufficient number of atoms of aselected isotope so that the corresponding ions selected from the ISand the analyte will have a significant mass difference. This is espe-cially critical when trimethylsilyl additive or sulfur atoms are present.
2. The ILA should be manufactured with sufficient isotopic purity, oth-erwise, the addition of the IS may result in the observation of a
Figure 4.3 Mass spectra and chemical structures of secobarbital (A), 2H5-seco-barbital (B), and 13C4-secobarbital (C) (all as methyl-derivatives). (Reprinted, withpermission, from the Journal of Forensic Sciences, Vol. 47, © ASTM International,100 Bar Harbor Dr., West Conshohocken, PA 19428.)
1522_C04.fm Page 161 Thursday, November 13, 2003 9:54 AM
© 2004 by CRC Press LLC
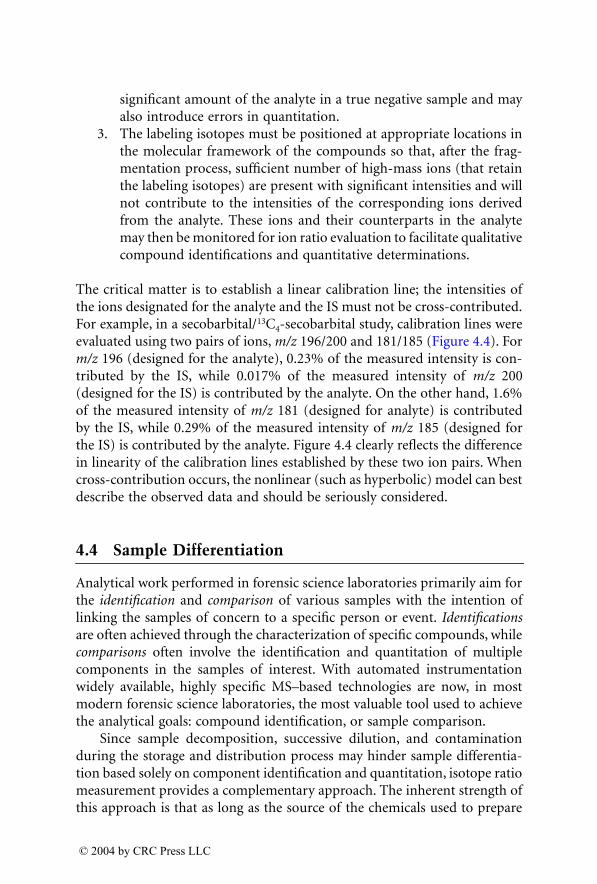
significant amount of the analyte in a true negative sample and mayalso introduce errors in quantitation.
3. The labeling isotopes must be positioned at appropriate locations inthe molecular framework of the compounds so that, after the frag-mentation process, sufficient number of high-mass ions (that retainthe labeling isotopes) are present with significant intensities and willnot contribute to the intensities of the corresponding ions derivedfrom the analyte. These ions and their counterparts in the analytemay then be monitored for ion ratio evaluation to facilitate qualitativecompound identifications and quantitative determinations.
The critical matter is to establish a linear calibration line; the intensities ofthe ions designated for the analyte and the IS must not be cross-contributed.For example, in a secobarbital/13C4-secobarbital study, calibration lines wereevaluated using two pairs of ions, m/z 196/200 and 181/185 (Figure 4.4). Form/z 196 (designed for the analyte), 0.23% of the measured intensity is con-tributed by the IS, while 0.017% of the measured intensity of m/z 200(designed for the IS) is contributed by the analyte. On the other hand, 1.6%of the measured intensity of m/z 181 (designed for analyte) is contributedby the IS, while 0.29% of the measured intensity of m/z 185 (designed forthe IS) is contributed by the analyte. Figure 4.4 clearly reflects the differencein linearity of the calibration lines established by these two ion pairs. Whencross-contribution occurs, the nonlinear (such as hyperbolic) model can bestdescribe the observed data and should be seriously considered.
4.4 Sample Differentiation
Analytical work performed in forensic science laboratories primarily aim forthe identification and comparison of various samples with the intention oflinking the samples of concern to a specific person or event. Identificationsare often achieved through the characterization of specific compounds, whilecomparisons often involve the identification and quantitation of multiplecomponents in the samples of interest. With automated instrumentationwidely available, highly specific MS–based technologies are now, in mostmodern forensic science laboratories, the most valuable tool used to achievethe analytical goals: compound identification, or sample comparison.
Since sample decomposition, successive dilution, and contaminationduring the storage and distribution process may hinder sample differentia-tion based solely on component identification and quantitation, isotope ratiomeasurement provides a complementary approach. The inherent strength ofthis approach is that as long as the source of the chemicals used to prepare
1522_C04.fm Page 162 Thursday, November 13, 2003 9:54 AM
© 2004 by CRC Press LLC
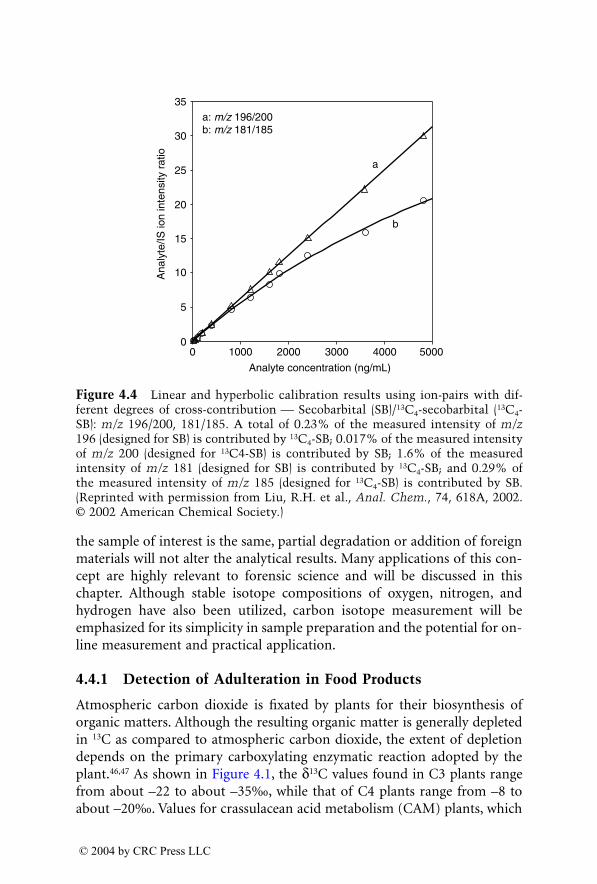
the sample of interest is the same, partial degradation or addition of foreignmaterials will not alter the analytical results. Many applications of this con-cept are highly relevant to forensic science and will be discussed in thischapter. Although stable isotope compositions of oxygen, nitrogen, andhydrogen have also been utilized, carbon isotope measurement will beemphasized for its simplicity in sample preparation and the potential for on-line measurement and practical application.
4.4.1 Detection of Adulteration in Food Products
Atmospheric carbon dioxide is fixated by plants for their biosynthesis oforganic matters. Although the resulting organic matter is generally depletedin 13C as compared to atmospheric carbon dioxide, the extent of depletiondepends on the primary carboxylating enzymatic reaction adopted by theplant.46,47 As shown in Figure 4.1, the d13C values found in C3 plants rangefrom about –22 to about –35‰, while that of C4 plants range from –8 toabout –20‰. Values for crassulacean acid metabolism (CAM) plants, which
Figure 4.4 Linear and hyperbolic calibration results using ion-pairs with dif-ferent degrees of cross-contribution æ Secobarbital (SB)/13C4-secobarbital (13C4-SB): m/z 196/200, 181/185. A total of 0.23% of the measured intensity of m/z196 (designed for SB) is contributed by 13C4-SB; 0.017% of the measured intensityof m/z 200 (designed for 13C4-SB) is contributed by SB; 1.6% of the measuredintensity of m/z 181 (designed for SB) is contributed by 13C4-SB; and 0.29% ofthe measured intensity of m/z 185 (designed for 13C4-SB) is contributed by SB.(Reprinted with permission from Liu, R.H. et al., Anal. Chem., 74, 618A, 2002.© 2002 American Chemical Society.)
0
5
10
15
20
25
30
35
0 1000 2000 3000 4000 5000
Ana
lyte
/IS io
n in
tens
ity r
atio
Analyte concentration (ng/mL)
b
a
a: m/z 196/200b: m/z 181/185
1522_C04.fm Page 163 Thursday, November 13, 2003 9:54 AM
© 2004 by CRC Press LLC
use features of both the C3 and C4 pathways, spread throughout most of therange of values found for C3 and C4 plants.
The possibility of characterizing a plant by its 13C/12C ratio has lead tosome interesting applications in food regulation relevant to forensic sci-ence.48,49 Most of the plants used in agriculture are C3 plants with two majorexceptions; corn and cane are C4 plants. Cane sugar and high-fructose cornsyrup derived from these two plants are lower-priced sweeteners and 13C/12Canalysis allows the detection of the illicit addition of these sweeteners to fooditems such as orange, grape, apple juices, maple syrup, and honey. Thecarbohydrates in honey are normally derived from flowering plants50 whichare almost exclusively C3 plants. The distributions of d13C values in honey,50
maple syrup,51 apple,52 grape,51 and orange53 juices have been thoroughlystudied. The delta 13C values of related food items are listed in Table 4.1. Thisisotope ratio information is a basis for the detection of cane sugar and high-fructose corn syrup in honey;54 apple,55 orange,56 and lemon57 juices; candiedpineapple and papaya;58 and maple syrup.51
Table 4.1 Carbon Isotope Composition of Common Sugars, Syrups, and Juices
Item dddd13C (‰)
Sugar and Syrup
High-fructose corn syrup –9.5 to –10.7Beet sugar –24.2Maple syrup –23.5 to –24.3Maple sugar –23.4Sorghum syrup –12.0Cane sugar –11.5
Fruit juice
Apricot –24.1Concord grape –26.2Cranberry –25.0Grapefruit –25.3Pineapple –12.5Plum –25.0Prune –26.0Strawberry –24.3Lemon –24.2
Source: Parker, P.L., The chemical basis of the useof 13C/12C ratios to detect the addition of sweetenersto fruit juice concentrates, in Proc. Symp. Technol.Probl. Fruit Juice Concentrates, Oregon State Uni-versity, Portland, OR, 1981, p. 50.
1522_C04.fm Page 164 Thursday, November 13, 2003 9:54 AM
© 2004 by CRC Press LLC
There are, however, complicating factors. For example, the d13C values ofhoney range from –22.5 to –27.4‰ (standard deviation = 0.98), while thosederived from CAM plants with d13C values range from –12 to –18‰ andrequire special limits in determining the authenticity.54 The Association ofOfficial Analytical Chemists has established isotopic analysis procedures forproviding legal proof of adulteration of honey and apple juice. Consideringpossible variations of the natural isotopic composition of a particular product,a conservative approach is adopted for the interpretation of analytical results;usually a limit of four standard deviations (1 in 25,000 error probability) ofthe natural variability of the product is set for concluding that the productis adulterated. Thus, –21.5‰ was used as the limit which could allow as muchas 20% of added C4 sugars. An internal standard carbon isotope ratio analysis(ISCIRA) approach was used to improve the sensitivity and objectivity intesting honey with d13C values less negative than –23.5‰ (2 standard devi-ation less negative than the mean). This method compared the d13C valuesof the protein isolated from the honey and that of the honey itself. A differencegreater than –1‰ indicated the presence of significant amount of added C4sugars. This index (1‰) is equivalent to 7% of added material.59
Using a similar approach, it is possible to prove whether a food sampleis of synthetic or of biogenic origin. Examples of these studies include thedifferentiation of:
1. Vanillin extracted from vanilla beans of different geographic origins,and that synthesized from lignin, eugenol (clove oil), or guaiacol (acoal tar)60
2. Vinegars obtained by biogenic fermentation and by syntheticprocess61
3. Beers brewed with barley alone, and those with the addition of maizeor petrochemical carbon dioxide derived from natural gas62
To detect fraudulent adulteration of high premium olive oils, Angerosaet al. compared d13C values of the aliphatic alcoholic oil fractions and foundthose of the adulterant pomace oil to be significantly more negative thanthose of virgin and refined olive oils.63 In a subsequent study, Angerosa et al.employed both 13C and 18O isotope analysis to determine geographical originof olive oils according to climatic regions in different Mediterranean coun-tries such as Greece, Morocco, and Spain.64
4.4.2 Dietary Composition as a Basis for Sample Differentiation
A more specific study has been reported for coffee and tea. Carbon, hydrogenand oxygen isotope compositions of chemically pure caffeine derived from
1522_C04.fm Page 165 Thursday, November 13, 2003 9:54 AM
© 2004 by CRC Press LLC
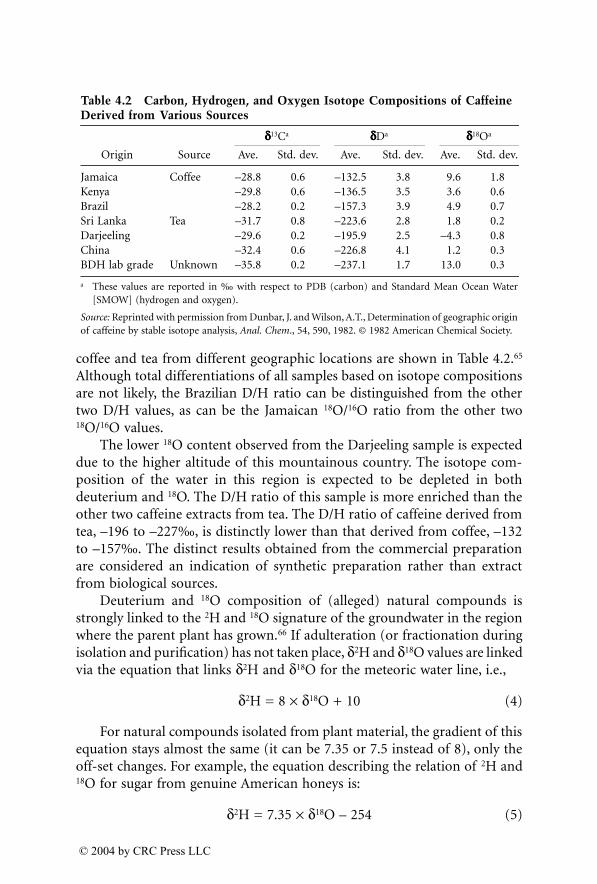
coffee and tea from different geographic locations are shown in Table 4.2.65
Although total differentiations of all samples based on isotope compositionsare not likely, the Brazilian D/H ratio can be distinguished from the othertwo D/H values, as can be the Jamaican 18O/16O ratio from the other two18O/16O values.
The lower 18O content observed from the Darjeeling sample is expecteddue to the higher altitude of this mountainous country. The isotope com-position of the water in this region is expected to be depleted in bothdeuterium and 18O. The D/H ratio of this sample is more enriched than theother two caffeine extracts from tea. The D/H ratio of caffeine derived fromtea, –196 to –227‰, is distinctly lower than that derived from coffee, –132to –157‰. The distinct results obtained from the commercial preparationare considered an indication of synthetic preparation rather than extractfrom biological sources.
Deuterium and 18O composition of (alleged) natural compounds isstrongly linked to the 2H and 18O signature of the groundwater in the regionwhere the parent plant has grown.66 If adulteration (or fractionation duringisolation and purification) has not taken place, d2H and d18O values are linkedvia the equation that links d2H and d18O for the meteoric water line, i.e.,
d2H = 8 ¥ d18O + 10 (4)
For natural compounds isolated from plant material, the gradient of thisequation stays almost the same (it can be 7.35 or 7.5 instead of 8), only theoff-set changes. For example, the equation describing the relation of 2H and18O for sugar from genuine American honeys is:
d2H = 7.35 ¥ d18O – 254 (5)
Table 4.2 Carbon, Hydrogen, and Oxygen Isotope Compositions of Caffeine Derived from Various Sources
Origin Source
dddd13Ca ddddDa dddd18Oa
Ave. Std. dev. Ave. Std. dev. Ave. Std. dev.
Jamaica Coffee –28.8 0.6 –132.5 3.8 9.6 1.8Kenya –29.8 0.6 –136.5 3.5 3.6 0.6Brazil –28.2 0.2 –157.3 3.9 4.9 0.7Sri Lanka Tea –31.7 0.8 –223.6 2.8 1.8 0.2Darjeeling –29.6 0.2 –195.9 2.5 –4.3 0.8China –32.4 0.6 –226.8 4.1 1.2 0.3BDH lab grade Unknown –35.8 0.2 –237.1 1.7 13.0 0.3
a These values are reported in ‰ with respect to PDB (carbon) and Standard Mean Ocean Water[SMOW] (hydrogen and oxygen).
Source: Reprinted with permission from Dunbar, J. and Wilson, A.T., Determination of geographic originof caffeine by stable isotope analysis, Anal. Chem., 54, 590, 1982. © 1982 American Chemical Society.
1522_C04.fm Page 166 Thursday, November 13, 2003 9:54 AM
© 2004 by CRC Press LLC
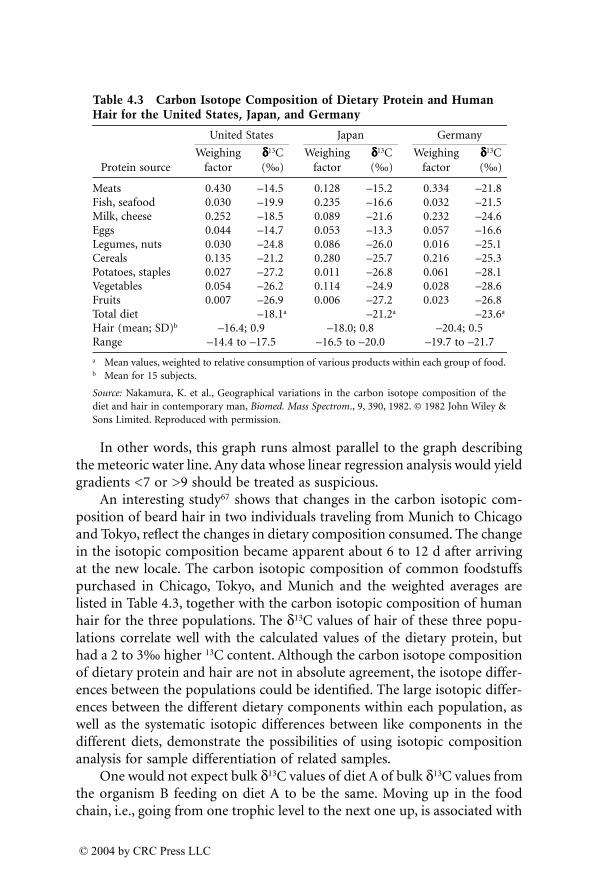
In other words, this graph runs almost parallel to the graph describingthe meteoric water line. Any data whose linear regression analysis would yieldgradients <7 or >9 should be treated as suspicious.
An interesting study67 shows that changes in the carbon isotopic com-position of beard hair in two individuals traveling from Munich to Chicagoand Tokyo, reflect the changes in dietary composition consumed. The changein the isotopic composition became apparent about 6 to 12 d after arrivingat the new locale. The carbon isotopic composition of common foodstuffspurchased in Chicago, Tokyo, and Munich and the weighted averages arelisted in Table 4.3, together with the carbon isotopic composition of humanhair for the three populations. The d13C values of hair of these three popu-lations correlate well with the calculated values of the dietary protein, buthad a 2 to 3‰ higher 13C content. Although the carbon isotope compositionof dietary protein and hair are not in absolute agreement, the isotope differ-ences between the populations could be identified. The large isotopic differ-ences between the different dietary components within each population, aswell as the systematic isotopic differences between like components in thedifferent diets, demonstrate the possibilities of using isotopic compositionanalysis for sample differentiation of related samples.
One would not expect bulk d13C values of diet A of bulk d13C values fromthe organism B feeding on diet A to be the same. Moving up in the foodchain, i.e., going from one trophic level to the next one up, is associated with
Table 4.3 Carbon Isotope Composition of Dietary Protein and Human Hair for the United States, Japan, and Germany
Protein source
United States Japan Germany
Weighingfactor
dddd13C(‰)
Weighingfactor
dddd13C(‰)
Weighingfactor
dddd13C(‰)
Meats 0.430 –14.5 0.128 –15.2 0.334 –21.8Fish, seafood 0.030 –19.9 0.235 –16.6 0.032 –21.5Milk, cheese 0.252 –18.5 0.089 –21.6 0.232 –24.6Eggs 0.044 –14.7 0.053 –13.3 0.057 –16.6Legumes, nuts 0.030 –24.8 0.086 –26.0 0.016 –25.1Cereals 0.135 –21.2 0.280 –25.7 0.216 –25.3Potatoes, staples 0.027 –27.2 0.011 –26.8 0.061 –28.1Vegetables 0.054 –26.2 0.114 –24.9 0.028 –28.6Fruits 0.007 –26.9 0.006 –27.2 0.023 –26.8Total diet –18.1a –21.2a –23.6a
Hair (mean; SD)b –16.4; 0.9 –18.0; 0.8 –20.4; 0.5Range –14.4 to –17.5 –16.5 to –20.0 –19.7 to –21.7
a Mean values, weighted to relative consumption of various products within each group of food.b Mean for 15 subjects.
Source: Nakamura, K. et al., Geographical variations in the carbon isotope composition of thediet and hair in contemporary man, Biomed. Mass Spectrom., 9, 390, 1982. © 1982 John Wiley &Sons Limited. Reproduced with permission.
1522_C04.fm Page 167 Thursday, November 13, 2003 9:54 AM
© 2004 by CRC Press LLC
a mass discrimination (= isotopic fractionation) favoring the heavier iso-topes. For 13C, moving up in the food chain by 1 level is associated with bulkd13C values in the feeding organism to be 1 to 3‰ higher (i.e., more enrichedin 13C) as compared to those found in its diet. The same is true for d15Nvalues; here the trophic mass discrimination leads to bulk d15N values beinggenerally higher by 2 to 4‰. As a matter of fact, this relation of isotopicfraction and feeding level can be exploited to prove that salmon sold as wildsalmon is indeed wild and not farmed. Bulk d13C values of wild salmon shouldbe of the order of –16 to –17‰, i.e., 2 to 3‰ higher than its favorite food,crustaceans (e.g., prawns) that shows bulk d13C values of about –19 to –20‰.In contrast, farmed salmon usually exhibits bulk d13C values of –22 to –23‰thus betraying its origin. So, finding a difference in the isotopic compositionof diet and feeding organism is (1) expected and (2) a very useful analyticaltool.68 This is further confirmed by a recent study on two strains of bacteria(Bacillus globigii and Erwinia agglomerans).69
4.4.3 Drugs
Drug sample differentiation based on natural stable isotope variation canrely on isotope composition determination in the bulk sample or in specificcompounds. These approaches are more commonly used to differentiateproducts from different geographical regions. It has also been advocated todifferentiate products from different manufacturing batches.
4.4.3.1 MarijuanaData shown in Table 4.4 show variations in 13C/12C ratios derived from thecombustion of bulk marijuana samples.70 These results indicate that ambientair seems to control the isotopic composition of the plant. The 13C contentin the samples analyzed decreases in the order of A, B (from rural area), C(from metropolitan area), D, F (indoor plant). This order coincides with theorder of the 13C content in the ambient air under which these plants aregrown. Since a heater using natural gas containing less-than-usual amountsof 13C is used in the greenhouse, the carbon dioxide inside the greenhousewould be the lightest. The reabsorption of carbon dioxide derived from plantsconfined in the greenhouse might have led to further depletion in 13C con-tent.71 Due to the heavy use of petroleum products, it seems reasonable toassume that the 13C content in metropolitan areas are less than that of ruralareas. Whether the difference in samples D (a male plant) and F (a femaleplant) is due to sex difference is not certain as the origin of the seeds is notwell established. This preliminary study certainly provides interesting infor-mation, but a more extended survey and more specific analysis of purechemical components are needed for better understanding.
1522_C04.fm Page 168 Thursday, November 13, 2003 9:54 AM
© 2004 by CRC Press LLC
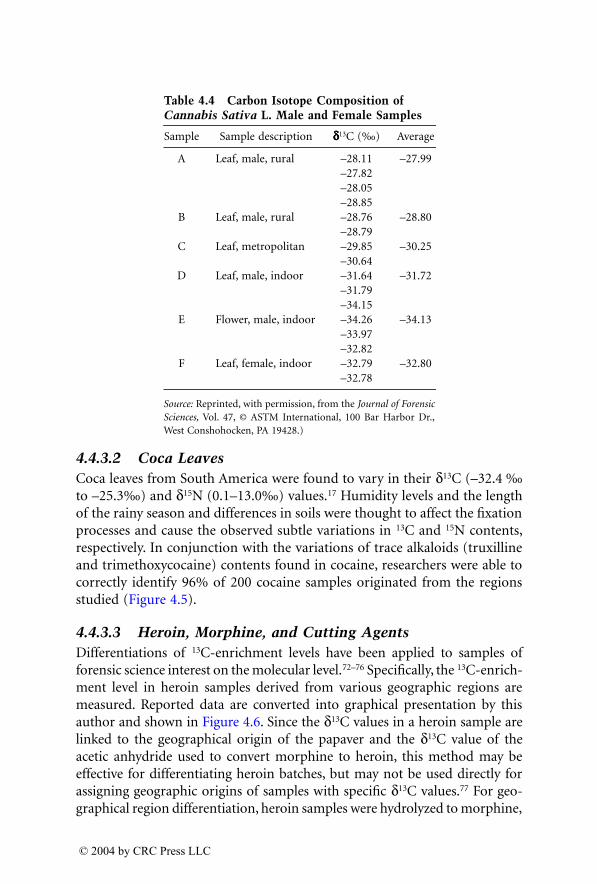
4.4.3.2 Coca LeavesCoca leaves from South America were found to vary in their d13C (–32.4 ‰to –25.3‰) and d15N (0.1–13.0‰) values.17 Humidity levels and the lengthof the rainy season and differences in soils were thought to affect the fixationprocesses and cause the observed subtle variations in 13C and 15N contents,respectively. In conjunction with the variations of trace alkaloids (truxillineand trimethoxycocaine) contents found in cocaine, researchers were able tocorrectly identify 96% of 200 cocaine samples originated from the regionsstudied (Figure 4.5).
4.4.3.3 Heroin, Morphine, and Cutting AgentsDifferentiations of 13C-enrichment levels have been applied to samples offorensic science interest on the molecular level.72–76 Specifically, the 13C-enrich-ment level in heroin samples derived from various geographic regions aremeasured. Reported data are converted into graphical presentation by thisauthor and shown in Figure 4.6. Since the d13C values in a heroin sample arelinked to the geographical origin of the papaver and the d13C value of theacetic anhydride used to convert morphine to heroin, this method may beeffective for differentiating heroin batches, but may not be used directly forassigning geographic origins of samples with specific d13C values.77 For geo-graphical region differentiation, heroin samples were hydrolyzed to morphine,
Table 4.4 Carbon Isotope Composition of Cannabis Sativa L. Male and Female Samples
Sample Sample description dddd13C (‰) Average
A Leaf, male, rural –28.11 –27.99–27.82–28.05–28.85
B Leaf, male, rural –28.76 –28.80–28.79
C Leaf, metropolitan –29.85 –30.25–30.64
D Leaf, male, indoor –31.64 –31.72–31.79–34.15
E Flower, male, indoor –34.26 –34.13–33.97–32.82
F Leaf, female, indoor –32.79 –32.80–32.78
Source: Reprinted, with permission, from the Journal of ForensicSciences, Vol. 47, © ASTM International, 100 Bar Harbor Dr.,West Conshohocken, PA 19428.)
1522_C04.fm Page 169 Thursday, November 13, 2003 9:54 AM
© 2004 by CRC Press LLC
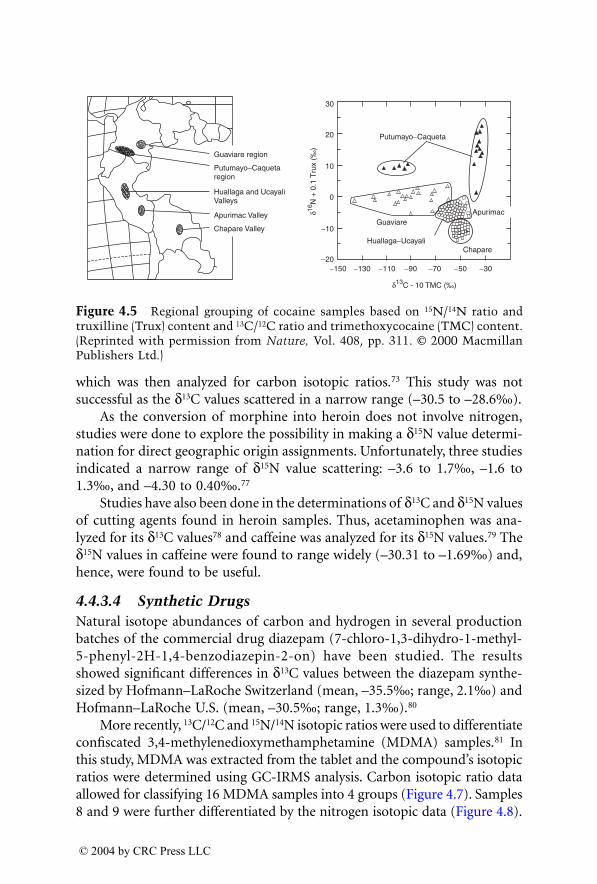
which was then analyzed for carbon isotopic ratios.73 This study was notsuccessful as the d13C values scattered in a narrow range (–30.5 to –28.6‰).
As the conversion of morphine into heroin does not involve nitrogen,studies were done to explore the possibility in making a d15N value determi-nation for direct geographic origin assignments. Unfortunately, three studiesindicated a narrow range of d15N value scattering: –3.6 to 1.7‰, –1.6 to1.3‰, and –4.30 to 0.40‰.77
Studies have also been done in the determinations of d13C and d15N valuesof cutting agents found in heroin samples. Thus, acetaminophen was ana-lyzed for its d13C values78 and caffeine was analyzed for its d15N values.79 Thed15N values in caffeine were found to range widely (–30.31 to –1.69‰) and,hence, were found to be useful.
4.4.3.4 Synthetic DrugsNatural isotope abundances of carbon and hydrogen in several productionbatches of the commercial drug diazepam (7-chloro-1,3-dihydro-1-methyl-5-phenyl-2H-1,4-benzodiazepin-2-on) have been studied. The resultsshowed significant differences in d13C values between the diazepam synthe-sized by Hofmann–LaRoche Switzerland (mean, –35.5‰; range, 2.1‰) andHofmann–LaRoche U.S. (mean, –30.5‰; range, 1.3‰).80
More recently, 13C/12C and 15N/14N isotopic ratios were used to differentiateconfiscated 3,4-methylenedioxymethamphetamine (MDMA) samples.81 Inthis study, MDMA was extracted from the tablet and the compound’s isotopicratios were determined using GC-IRMS analysis. Carbon isotopic ratio dataallowed for classifying 16 MDMA samples into 4 groups (Figure 4.7). Samples8 and 9 were further differentiated by the nitrogen isotopic data (Figure 4.8).
Figure 4.5 Regional grouping of cocaine samples based on 15N/14N ratio andtruxilline (Trux) content and 13C/12C ratio and trimethoxycocaine (TMC) content.(Reprinted with permission from Nature, Vol. 408, pp. 311. © 2000 MacmillanPublishers Ltd.)
Guaviare region
Putumayo−Caqueta
Apurimac
ChapareHuallaga−Ucayali
Guaviare
30
20
10
δ16N
+ 0
.1 T
rux
(‰)
δ13C - 10 TMC (‰)
0
−10
−20−150 −130 −110 −90 −70 −50 −30
Putumayo–Caquetaregion
Huallaga and UcayaliValleys
Apurimac Valley
Chapare Valley
1522_C04.fm Page 170 Thursday, November 13, 2003 9:54 AM
© 2004 by CRC Press LLC
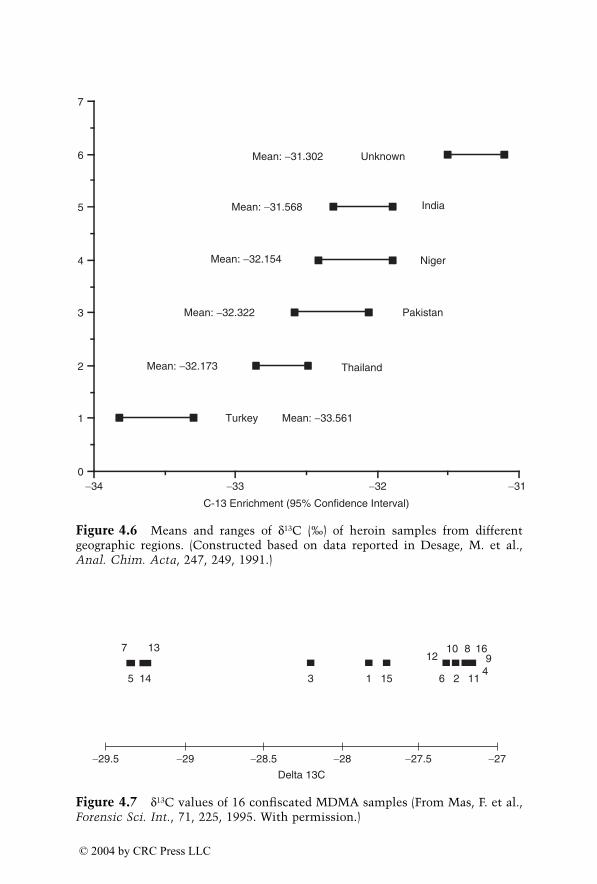
Figure 4.6 Means and ranges of d13C (‰) of heroin samples from differentgeographic regions. (Constructed based on data reported in Desage, M. et al.,Anal. Chim. Acta, 247, 249, 1991.)
Figure 4.7 d13C values of 16 confiscated MDMA samples (From Mas, F. et al.,Forensic Sci. Int., 71, 225, 1995. With permission.)
−31−32−33−340
1
2
3
4
5
6
7
C-13 Enrichment (95% Confidence Interval)
Unknown
India
Pakistan
Thailand
Turkey
Niger
Mean: −31.568
Mean: −32.173
Mean: −33.561
Mean: −31.302
Mean: −32.154
Mean: −32.322
−29.5 −29 −28.5
Delta 13C
7 13
14 3 1 15 6 2 1149
1681012
5
−28 −27.5 −27
1522_C04.fm Page 171 Thursday, November 13, 2003 9:54 AM
© 2004 by CRC Press LLC
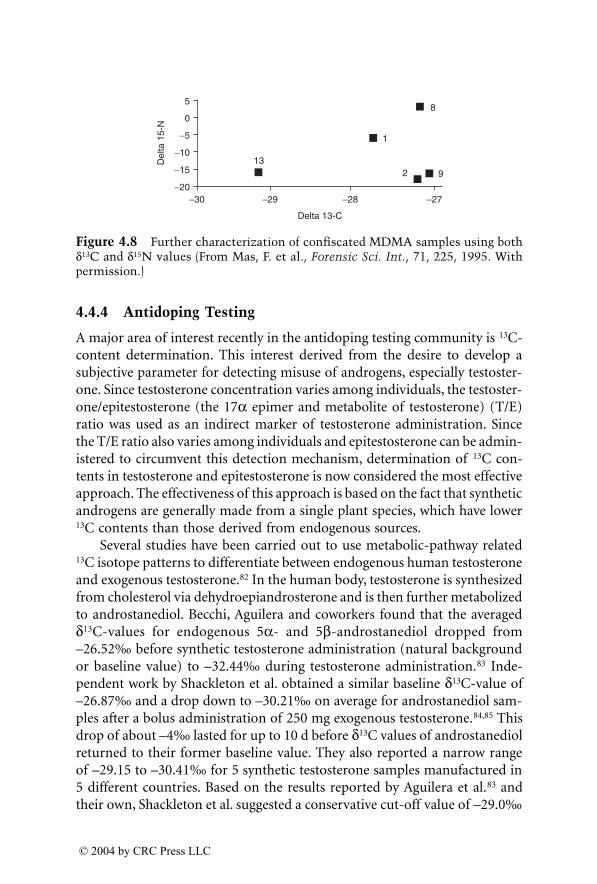
4.4.4 Antidoping Testing
A major area of interest recently in the antidoping testing community is 13C-content determination. This interest derived from the desire to develop asubjective parameter for detecting misuse of androgens, especially testoster-one. Since testosterone concentration varies among individuals, the testoster-one/epitestosterone (the 17a epimer and metabolite of testosterone) (T/E)ratio was used as an indirect marker of testosterone administration. Sincethe T/E ratio also varies among individuals and epitestosterone can be admin-istered to circumvent this detection mechanism, determination of 13C con-tents in testosterone and epitestosterone is now considered the most effectiveapproach. The effectiveness of this approach is based on the fact that syntheticandrogens are generally made from a single plant species, which have lower13C contents than those derived from endogenous sources.
Several studies have been carried out to use metabolic-pathway related13C isotope patterns to differentiate between endogenous human testosteroneand exogenous testosterone.82 In the human body, testosterone is synthesizedfrom cholesterol via dehydroepiandrosterone and is then further metabolizedto androstanediol. Becchi, Aguilera and coworkers found that the averagedd13C-values for endogenous 5a- and 5b-androstanediol dropped from–26.52‰ before synthetic testosterone administration (natural backgroundor baseline value) to –32.44‰ during testosterone administration.83 Inde-pendent work by Shackleton et al. obtained a similar baseline d13C-value of–26.87‰ and a drop down to –30.21‰ on average for androstanediol sam-ples after a bolus administration of 250 mg exogenous testosterone.84,85 Thisdrop of about –4‰ lasted for up to 10 d before d13C values of androstanediolreturned to their former baseline value. They also reported a narrow rangeof –29.15 to –30.41‰ for 5 synthetic testosterone samples manufactured in5 different countries. Based on the results reported by Aguilera et al.83 andtheir own, Shackleton et al. suggested a conservative cut-off value of –29.0‰
Figure 4.8 Further characterization of confiscated MDMA samples using bothd13C and d15N values (From Mas, F. et al., Forensic Sci. Int., 71, 225, 1995. Withpermission.)
−30
5
0
−5
−10
−15
−20−29
Delta 13-C
13
1
8
2 9
Del
ta 1
5-N
−28 −27
1522_C04.fm Page 172 Thursday, November 13, 2003 9:54 AM
© 2004 by CRC Press LLC
for androstanediol to identify unambiguously testosterone abuse for up to 7d after administration.
In a recently published study, it has been reported that the d13C valuesfor 4 synthetic epitestosterone samples examined were all –30.3‰, while themean d13C value of epitestosterone obtained from 43 healthy male urinesamples was –23.8‰ (SD, 0.93‰). Nine of 10 athletes’ urine samples withepitestosterone concentrations >180 mg/l had their d13C values within ±3 SDof the control group. The other athlete’s d13C value was found to be –32.6‰and the sample suggested the administering of synthetic epitestosterone.86
4.4.5 Explosives
Samples of TNT from a known country of origin (but unknown date ofmanufacturing) were analyzed for carbon isotope composition.87 The d13Cvalues of these samples were compared with that of coal and crude petro-leum. Variations of 13C/12C ratios of these samples were clearly demon-strated and may provide information for sample differentiation purposes.The exact cause of this variation is not obvious. If all toluene is manufac-tured from coal or petroleum sources, these variations must be due to adifference in the initial isotopic composition of the parent material or adifference introduced in the toluene manufacturing process, depending onthe type of hydroforming process, the kind of catalyst, and the reactiontemperature used.
4.5 Stable Isotope Coding as a Tracing Mechanism: Methamphetamine Example
Isotope ratio measurement of compounds that have been deliberately taggedwith selected stable isotopes can also be used as a mechanism for sampledifferentiation purposes. Parallel with the mechanism of labeling medicallyimportant research drugs with radioactive and nonradioactive isotopes,88
drugs with high potential for being channeled into illicit use could be labeledwith specific amounts of a nonradioactive isotope during the manufacturingprocess. A subsequent isotope ratio measurement could then be used todifferentiate samples from different sources and to further identify the sourceof the drug and/or its precursors.
To illustrate this concept, an example is made of the frequently abusedmethamphetamine. A study89 from this author's group incorporates varyingamounts of 13C-labeled methylamine during the methamphetamine synthesisprocess. The 13C to 12C ratios in the resulting products are monitored by anelectron impact/quadrupole mass spectrometer, with selected ion monitoring
1522_C04.fm Page 173 Thursday, November 13, 2003 9:54 AM
© 2004 by CRC Press LLC
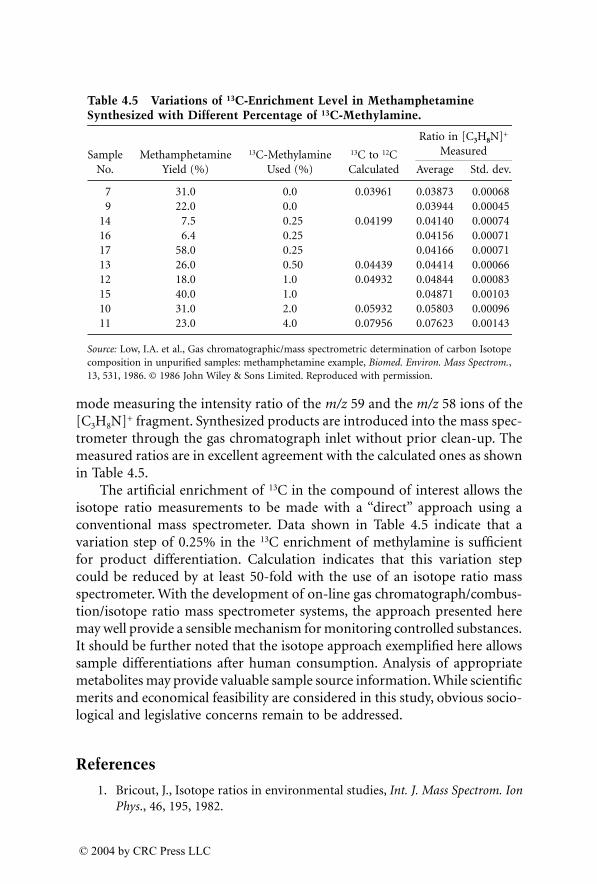
mode measuring the intensity ratio of the m/z 59 and the m/z 58 ions of the[C3H8N]+ fragment. Synthesized products are introduced into the mass spec-trometer through the gas chromatograph inlet without prior clean-up. Themeasured ratios are in excellent agreement with the calculated ones as shownin Table 4.5.
The artificial enrichment of 13C in the compound of interest allows theisotope ratio measurements to be made with a “direct” approach using aconventional mass spectrometer. Data shown in Table 4.5 indicate that avariation step of 0.25% in the 13C enrichment of methylamine is sufficientfor product differentiation. Calculation indicates that this variation stepcould be reduced by at least 50-fold with the use of an isotope ratio massspectrometer. With the development of on-line gas chromatograph/combus-tion/isotope ratio mass spectrometer systems, the approach presented heremay well provide a sensible mechanism for monitoring controlled substances.It should be further noted that the isotope approach exemplified here allowssample differentiations after human consumption. Analysis of appropriatemetabolites may provide valuable sample source information. While scientificmerits and economical feasibility are considered in this study, obvious socio-logical and legislative concerns remain to be addressed.
References
1. Bricout, J., Isotope ratios in environmental studies, Int. J. Mass Spectrom. IonPhys., 46, 195, 1982.
Table 4.5 Variations of 13C-Enrichment Level in Methamphetamine Synthesized with Different Percentage of 13C-Methylamine.
SampleNo.
MethamphetamineYield (%)
13C-MethylamineUsed (%)
13C to 12CCalculated
Ratio in [C3H8N]+
Measured
Average Std. dev.
7 31.0 0.0 0.03961 0.03873 0.000689 22.0 0.0 0.03944 0.00045
14 7.5 0.25 0.04199 0.04140 0.0007416 6.4 0.25 0.04156 0.0007117 58.0 0.25 0.04166 0.0007113 26.0 0.50 0.04439 0.04414 0.0006612 18.0 1.0 0.04932 0.04844 0.0008315 40.0 1.0 0.04871 0.0010310 31.0 2.0 0.05932 0.05803 0.0009611 23.0 4.0 0.07956 0.07623 0.00143
Source: Low, I.A. et al., Gas chromatographic/mass spectrometric determination of carbon Isotopecomposition in unpurified samples: methamphetamine example, Biomed. Environ. Mass Spectrom.,13, 531, 1986. © 1986 John Wiley & Sons Limited. Reproduced with permission.
1522_C04.fm Page 174 Thursday, November 13, 2003 9:54 AM
© 2004 by CRC Press LLC
2. Wolfe, R.R., Tracers in Metabolic Research æ Radioactive and Stable Iso-tope/Mass Spectrometry Methods, Alan R. Liss, New York, 1983.
3. Baillie, T.A., The use of stable isotopes in pharmacological research, Pharma-col. Rev., 33, 81, 1981.
4. Haskins, N.J., The application of stable isotope in biomedical research,Biomed. Mass Spectrom., 9, 269, 1982.
5. Ramesh, S. et al., Three-electron oxidations. 18. Carbon-13 and deuteriumisotope effects in the cooxidation of 2-hydroxy-2-methylbutyric acid and 2-propanol. Evidence for a two-step mechanism, J. Am. Chem. Soc., 103, 5172,1981.
6. Liu, R.H. et al., Isotopically labelled analogues for drug quantitation, Anal.Chem., 74, 618A, 2002.
7. Liu, R.H., Sample differentiation by stable-isotope-ratio mass spectrometry,in Analytical Methods in Forensic Chemistry, Ho, M.H., Ed., Ellis Horwood,New York, 1990, Chap. 4.
8. Rouhi, A.M., Nitrogen isotope tales from a tomb, C&EN, November 12, 2001,p. 34.
9. Gonfiantini, R., Standards for stable isotope measurements in natural com-pounds, Nature, 271, 534, 1978.
10. Urey, H.C. et al., Measurement of paleotemperatures and temperatures of theupper cretaceous of England, Denmark, and the Southeastern United States,Bull. Geol. Soc. Am., 62, 399, 1951.
11. Meier-Augenstein, W., The chromatographic side of isotope ratio mass spec-trometry — Pitfalls and answers, LC/GC Int., 10(1), 17–25, 1997.
12. Craig, H., Standard for reporting concentrations of deuterium and oxygen-18 in natural waters, Science, 133, 1833, 1961.
13. Junk, G. and Svec, H., The absolute abundance of the nitrogen isotopes inthe atmosphere and compressed gas from various sources, Geochim. Cosmo-chim. Acta, 14, 234, 1958.
14. Melander, L. and Saunders, W.H., Reaction Rates of Isotopic Molecules, Wiley& Sons, New York, 1980.
15. Rieley, G., Derivatization of organic-compounds prior to gas-chromato-graphic combustion-isotope ratio mass-spectrometric analysis æ identifica-tion of isotope fractionation processes, Analyst, 119, 915, 1994.
16. Meier-Augenstein, W., Applied gas chromatography coupled to isotope ratiomass spectrometry, J. Chromatogr. A, 842, 351, 1999.
17. Ehleringer, J.R. et al., Tracing the geographical origin of cocaine, Nature, 408,311, 2000.
18. Burlingame, A.L. et al., Mass spectrometry, Anal. Chem., 70, R647, 1998.
19. Preston, T. and Slater, C., Mass-spectrometric analysis of stable-isotope-labeled amino-acid tracers, Proc. Nutr. Soc., 53, 363, 1994.
1522_C04.fm Page 175 Thursday, November 13, 2003 9:54 AM
© 2004 by CRC Press LLC
20. Rennie, M.J. et al., Use of continuous-flow combustion ms in studies ofhuman metabolism, Biochem. Soc. Trans., 24, 927, 1996.
21. Preston, T. and Owens, N.J.P., Interfacing an automatic elemental analyserwith an isotope ratio mass spectrometer: the potential for fully automatedtotal nitrogen and nitrogen-15 analysis, Analyst, 108, 971, 1983.
22. Preston, T. and Owens, N.J.P., Preliminary 13C measurements using a gaschromatograph interfaced to an isotope ratio mass spectrometer, Biomed.Mass Spectrom., 12, 510, 1985.
23. Brand, W.A. et al., Compound-specific isotope analysis — extending towardN-15/N-14 and O-18/O-16, Org. Geochem., 21, 585, 1994.
24. Werner, R.A. et al., Online determination of delta-O-18 values of organic-substances, Anal. Chim. Acta, 319, 159, 1996.
25. Begley, I.S. and Scrimgeour, C.M., High-precision delta H-2 and delta O-18measurement for water and volatile organic compounds by continuous-flowpyrolysis isotope ratio mass spectrometry, Anal. Chem., 69, 1530, 1997.
26. Farquhar, G.D. et al., A rapid on-line technique for determination of oxygenisotope composition of nitrogen-containing organic matter and water, RapidCommun. Mass Spectrom., 11, 1554, 1997.
27. Meier-Augenstein, W., Stable isotope analysis of fatty acids by gas chroma-tography — isotope ratio mass spectrometry, Anal. Chim. Acta, 465, 63, 2002.
28. Brenna, J.T., High-precision gas isotope ratio mass-spectrometry æ recentadvances in instrumentation and biomedical applications, Acc. Chem. Res.,27, 340, 1994.
29. Brand, W.A., High precision isotope ratio monitoring techniques in massspectrometry, J. Mass Spectrom., 31, 225, 1996.
30. Ellis, L. and Fincannon, A.L., Analytical improvements in irm-GC/MS anal-yses: advanced techniques in tube furnace design and sample preparation,Org. Geochem., 29, 1101, 1998.
31. Metges, C.C. and Petzke, K.J., The use of GC-C-IRMS for the analysis ofstable isotope enrichment in nitrogenous compounds, in Methods of Investi-gation of Amino Acid and Protein Metabolism, El-Khoury, A.E., Ed., CRC Press,Boca Raton, FL, 1999, p. 121.
32. Rautenschlein, M. et al., High-precision measurement of 13C/12C ratios byon-line combustion of GC eluates and isotope ratio mass spectrometry, inStable Isotopes in Paediatric, Nutritional and Metabolic Research, Chapman,T.E. et al., Eds., Intercept, Andover, 1990, p. 133.
33. Merritt, D.A. et al., Performance and optimization of a combustion interfacefor isotope ratio monitoring gas-chromatography mass-spectrometry, Anal.Chem., 67, 2461, 1995.
34. Eakin, P.A. et al., Some instrumental effects in the determination of stablecarbon isotope ratios by gas-chromatography isotope ratio mass-spectrom-etry, Chem. Geol., 101, 71, 1992.
1522_C04.fm Page 176 Thursday, November 13, 2003 9:54 AM
© 2004 by CRC Press LLC
35. Leckrone, K.J. and Hayes, J.M., Water-induced errors in continuous-flowcarbon isotope ratio mass spectrometry, Anal. Chem., 70, 2737, 1998.
36. Matucha, M. et al., Isotope effect in gas-liquid-chromatography of labeledcompounds, J. Chromatogr, 588, 251, 1991.
37. Matucha, M., Isotope effects (IEs) in gas chromatography (GC) of labelledcompounds (LCs), in Synthesis and Applications of Isotopically Labelled Com-pounds, Allen, J., Ed., John Wiley & Sons, New York, 1995, p. 489.
38. Meier-Augenstein, W. et al., Influence of gas-chromatographic parameters onmeasurement of C-13/C-12 isotope ratios by gas-liquid-chromatographycombustion isotope ratio mass-spectrometry. 1, J. Chromatogr. A, 752, 233,1996.
39. Prosser, S.J. and Scrimgeour, C.M., High-precision determination of H-2/H-1 in H2 and H2O by continuous-flow isotope ratio mass-spectrometry, Anal.Chem., 67, 1992, 1995.
40. Scrimgeour, C.M. et al., Measurement of deuterium incorporation into fattyacids by gas chromatography isotope ratio mass spectrometry, Rapid Com-mun. Mass Spectrom., 13, 271, 1999.
41. Corso, T.N. and Brenna, J.T., High-precision position-specific isotope anal-ysis, Proc. Natl. Acad. Sci. U.S.A., 94, 1049, 1997.
42. Meier-Augenstein, W. et al., Bridging the information gap between isotoperatio mass-spectrometry and conventional mass-spectrometry, Biol. MassSpectrom., 23, 376, 1994.
43. Meier-Augenstein, W., Online recording of C-13/C-12 ratios and mass-spec-tra in one gas-chromatographic analysis., J. High Res. Chromatogr., 18, 28,1995.
44. Meier-Augenstein, W. et al., Determination of 13C enrichment by conven-tional GC-MS and GC-(MS)-C-IRMS, Isotopes Environ. Health Stud., 31, 261,1995.
45. Chang, W.-T., Smith, J., and Liu, R.H., Isotopic analogs as internal standardsfor quantitative GC/MS analysis — molecular abundance and retention timedifference as interference factors, J. Forensic Sci., 47, 873, 2002.
46. Smith, B.N. and Epstein, S., Two categories of 13C/12C ratios of higher plants,Plant Physiol., 47, 308, 1971.
47. Dellens, E., La discrimination du 12C et des trois types de metabolisme desplantes, Physiol. Veget., 14, 641, 1976.
48. Rittenberg, D. and Ponticorvo, L., A method for the determination of the 18Oconcentration of the oxygen of organic compounds, Int. J. Appl. Radiat. Isot.,1, 208, 1956.
49. Parker, P.L., The chemical basis of the use of 13C/12C ratios to detect theaddition of sweeteners to fruit juice concentrates, in Proc. Symp. Technol.Probl. Fruit Juice Concentrates, Oregon State University, Portland, OR, 1981,p. 50.
1522_C04.fm Page 177 Thursday, November 13, 2003 9:54 AM
© 2004 by CRC Press LLC
50. White, J. and Doner, L., The 13C/12C ratio in honey, J. Apic. Res., 17, 94, 1978.
51. Krueger, H.W. and Reesman, R.H., Carbon isotope analyses in food technol-ogy, Mass Spectrom. Rev., 1, 205, 1982.
52. Doner, L.W., Krueger, H.W., and Reesman, R.H., Isotope composition ofcarbon in apple juice, J. Agric. Food Chem., 28, 362, 1980.
53. Doner, L.W. and Bills, D.D., Stable carbon isotope ratios in orange juice, J.Agric. Food Chem., 29, 803, 1981.
54. White, J.W. and Doner, L.W., Mass spectrometric detection of high-fructosecorn syrup in honey by use of 13C/12C ratio: collaborative study, J. Assoc. Off.Anal. Chem., 61, 747, 1978.
55. Doner, L.W. and Phillips, J.G., Detection of high fructose corn syrup in applejuice by mass spectrometric 13C/12C analysis: collaborative study, J. Assoc. Off.Anal. Chem., 64, 85, 1981.
56. Brause, A.R. et al., Verification of authenticity of orange juice, J. Assoc. Off.Anal. Chem., 67, 535, 1984.
57. Doner, L.W., Carbon isotope ratios in natural and synthetic citric acid asindicators of lemon juice adulteration, J. Agric. Food Chem., 33, 770, 1985.
58. Doner, L.W., Chia, D., and White, J.W., Mass spectrometric 13C/12C determi-nation to distinguish honey and C3 plant syrup from C4 plant syrups (sugarcane and corn) in candied pineapple and papaya, J. Assoc. Off. Anal. Chem.,62, 928, 1979.
59. White, J.W. et al., Stable carbon isotope ratio analysis of honey: validation ofinternal standard procedure for worldwide application, J. AOAC Int., 81, 610,1998.
60. Schmid, E.R. et al., Intramolecular 13C/12C isotope ratios of acetic acid ofbiological and synthetic origin, Biomed. Mass Spectrom., 8, 496, 1981.
61. Hoffman, P. and Salb, M.J., Isolation and stable isotope ratio analysis ofvanillin, J. Agric. Food Chem., 27, 352, 1979.
62. Winkler, F. and Schmidt, H.-L., Application possibilities of carbon-13 isotopemass spectrometry in food analysis, Z. Lebensm. Unters. Forsch., 171, 85, 1980.
63. Angerosa, F. et al., Carbon stable isotopes and olive oil adulteration withpomace oil, J. Agric. Food Chem., 45, 3044, 1997.
64. Angerosa, F. et al., Application of stable isotope ratio analysis to the charac-terization of the geographical origin of olive oils, J. Agric. Food Chem., 47,1013, 1999.
65. Dunbar, J. and Wilson, A.T., Determination of geographic origin of caffeineby stable isotope analysis, Anal. Chem., 54, 590, 1982.
66. Rossmann, A. et al., Stable isotope oxygen isotope content of water of EUdata-bank wines from Italy, France and Germany, Z. Lebensm. Uners. Forsch.A, 208, 400, 1999.
1522_C04.fm Page 178 Thursday, November 13, 2003 9:54 AM
© 2004 by CRC Press LLC
67. Nakamura, K. et al., Geographical variations in the carbon isotope compo-sition of the diet and hair in contemporary man, Biomed. Mass Spectrom., 9,390, 1982.
68. Borobia, M. et al., Blubber fatty acids of finback and humpback whales fromthe Gulf of St. Lawrence, Mar. Biol., 122, 341, 1995.
69. Horita, J. and Vass, A.A., Stable-isotope fingerprints of biological agents asforensic tool, J. Forensic Sci., 48, 122, 2003.
70. Liu, J.[R.]H. et al., Possible characterization of samples of Cannabis sativa L.by their carbon isotopic distribution, J. Forensic Sci., 24, 814, 1979.
71. Keelin, C.D., A mechanism for cyclic environment of carbon-12 by terrestrialplants, Geochim. Cosmochim. Acta, 24, 299, 1961.
72. Desage, M. et al., Gas chromatography with mass spectrometry or isotope-ratio mass spectrometry in studying the geographical origin of heroin, Anal.Chim. Acta, 247, 249, 1991.
73. Besacier, F. et al., Isotopic analysis of 13C as a tool for comparison and originassignment of seized heroin samples, J. Forensic Sci., 42, 429, 1997.
74. Ihle, E. and Schmidt, H.L., Multielement isotope analysis on drugs of abuse.Possibility for their origin assignment, Isotope Environ. Health Stud., 32, 226,1996.
75. Ehleringer, J.R. et al., Geo-location of heroin and cocaine by stable isotoperatios, Forensic Sci. Int., 106, 27, 1999.
76. Hays, P.A. et al., Geographic origin determination of heroin and cocaine usingsite-specific isotopic ratio deuterium NMR, J. Forensic Sci., 45, 552, 2000.
77. Besacier, F. and Chaudron-Thozet, H., Chemical profiling of illicit heroinsamples, Forensic Sci. Rev., 11, 105, 1999.
78. Dautraix, S. et al., 13C isotopic analysis of an acetaminophen and diacetyl-morphine mixture, J. Chromatogr. A, 756, 203, 1996.
79. Besacier, F. et al., Application du couplage chromatographie gazeuse-spec-trometrie de masse isotopique de l’azote á l’analyse d’échantillons de drogues,Analysis, 27, 17, 1999.
80. Bommer, P. et al., Determination of the origin of drugs by measuring naturalisotope contents: D/H and 13C/12C ratio of some diazepam samples, Zeit.Naturforsch., 31c, 111, 1976.
81. Mas, F. et al., Determination of “common-batch” members in a set of con-fiscated 3,4-(methylenedioxy)methylamphetamine samples by measuring thenatural isotope abundances: a prelimiary study, Forensic Sci. Int., 71, 225,1995.
82. Becchi, M. et al., Gas chromatography combustion isotope ratio mass-spec-trometry analysis of urinary steroids to detect misuse of testosterone in sport,Rapid Commun. Mass Spectrom., 8, 304, 1994.
1522_C04.fm Page 179 Thursday, November 13, 2003 9:54 AM
© 2004 by CRC Press LLC
83. Aguilera, R. et al., Improved method of detection of testosterone abuse bygas chromatography/combustion/isotope ratio mass spectrometry analysis ofurinary steroids, J. Mass Spectrom., 31, 169, 1997.
84. Shackleton, C.H.L. et al., Confirming testosterone administration by isotoperatio mass spectrometric analysis of urinary androstanediols, Steroids, 62,379, 1997.
85. Shackleton, C.H. L. et al., Androstanediol and 5-androstenediol profiling fordetecting exogenously administered dihydrotestosterone, epitestosterone,and dehydroepiandrosterone: potential use in gas chromatography isotoperatio mass spectrometry, Steroids, 62, 665, 1997.
86. Aguilera, R., Hatton, C.K., and Catlin, D.H., Detection of epitestosteronedoping by isotope ratio mass spectrometry, Clin. Chem., 48, 629, 2002.
87. Nissenbaum, A., The distribution of natural stable isotopes of carbon as apossible tool for the differentiation of samples of TNT, J. Forensic Sci., 20,455, 1975.
88. Wolfe, R.R., Tracers in Metabolic Research — Radioactive and Stable Iso-tope/Mass Spectrometry Methods, Alan R. Liss, New York, 1983.
89. Low, I.A. et al., Gas chromatographic/mass spectrometric determination ofcarbon isotope composition in unpurified samples: methamphetamineexample, Biomed. Environ. Mass Spectrom., 13, 531, 1986.
1522_C04.fm Page 180 Thursday, November 13, 2003 9:54 AM
© 2004 by CRC Press LLC
5
Identification of Ignitable Liquid Residues in Fire Debris by GC/MS/MS
DALE SUTHERLANDJEANNETTE PERR
JOSÉ R. ALMIRALL
Two different approaches to forensic analysis of accelerants in fire debris byGC/MS/MS are described in this chapter. One method is to optimize MS/MSparameters and conditions for a series of target compounds in order to obtainmaximum sensitivity and specificity for ignitable liquids. A specific com-pound of interest is isolated by selecting a parent ion, which is passed throughthe MS/MS collision chamber, to be decomposed by collision-induced dis-sociation (CID), followed by analysis of the daughter ions for compoundidentification. This is being discussed as an optimized target compoundGC/MS/MS analysis.
The other approach is to select parent ions characteristic of several chem-ical classes in order to optimize the selectivity of the GC/MS/MS analysisthrough class pattern recognition. MS/MS is being used to “clean up” theGC/MS chromatogram, followed by comparison of the profile of the inves-tigated analyte with profiles of standards. This is being discussed as targetclass GC/MS/MS analysis.
Contents
5.1 The Use of Compound-Specific MS/MS for the Identification of Ignitable Liquid Residues in Fire Debris Analysis5.1.1 Introduction 5.1.2 Tandem Mass Spectrometry (MS/MS)5.1.3 Fire Debris Analysis
5.1.3.1 Ion Trap MS/MS in Fire Debris Analysis5.1.3.2 MS/MS Examples
5.1.4 ConclusionsAcknowledgments
References
1522_book.fm Page 181 Thursday, November 13, 2003 9:58 AM
© 2004 by CRC Press LLC
5.2 Analysis of Ignitable Liquids in Fire Debris and the Roleof GC/MS/MS5.2.1 Introduction5.2.2 Specificity — The Key to Difficult Samples
5.2.2.1 Specificity Improvement —Chromatographic
5.2.2.2 Specificity Improvement — Detection5.2.2.3 Specificity Improvement — Data Processing
Software5.2.2.4 Specificity Improvement — Hardware
5.2.3 Analysis by GC/MS/MS 5.2.3.1 GC/MS and GC/MS/MS Spectra Comparison
5.2.4 GC/MS/MS — Target Class Analysis5.2.4.1 GC/MS/MS — Chemical Analysis —
Examples 5.2.4.2 Appropriate Sensitivity5.2.4.3 Disadvantages5.2.4.4 Benefits
5.2.5 ConclusionReferences
5.1 The Use of Compound-Specific MS/MS for the Identification of Ignitable Liquid Residues in Fire
Debris Analysis
José R. Almirall and Jeannette Perr
5.1.1 Introduction
The crime of arson is very difficult to prosecute for several reasons, includingthe usual lack of physical evidence at the crime scene and the difficulty inassociating with a particular suspect any physical evidence found, such as thepresence of an ignitable liquid residue. The detection and identification ofan
ignitable liquid residue
, the term used for the compounds or mixtures ofcompounds often used to accelerate a fire, is one of the first steps in theinvestigation of a suspected arson. As often noted, the arson scene can bequite complex and chaotic. The forensic chemist considers every suspectedarson scene as unique, taking into account all the many different variablesthat can affect the extraction and identification of any ignitable liquid resi-dues present. In a case where there is ample evidence of an ignitable liquidresidue, the analysis of the evidence is very straightforward. The AmericanSociety for Testing and Materials (ASTM) International has published several
1522_book.fm Page 182 Thursday, November 13, 2003 9:58 AM
© 2004 by CRC Press LLC
excellent standards for the extraction
1–6
of ignitable liquids and for the clas-sification and interpretation
7–8
of the analytical results from this examination.It is when the sample contains these compounds in very low concentrationsor in the presence of a large amount of background substrate that moresensitive techniques are required. In the absence of these sensitive techniques,the samples would be determined as negative for the presence of ignitableliquid residues. This chapter describes the recent application of a tandem(MS/MS) mass spectrometry experiment for the purposes of isolating andidentifying ignitable liquid residues in the presence of background productsthat may mask the target analytes of interest. Our approach involves com-pound specific MS/MS experiments that can be used to first isolate a specificcompound of interest by isolating the parent ion (or one of the fragmentions) in the first MS experiment, conducting a collisional-induced dissocia-tion, and then resolving the resulting daughter ions for compound identifi-cation, all within the approximate time frame of a single mass spectrometryexperiment. The approach, previously described for the identification ofignitable liquid residues from fire debris,
9–12
is widely used in analyticalchemistry for the identification of many different analytes of interest, includ-ing drugs of abuse.
13
Other researchers
14
are currently investigating MS/MSmethods for the analysis of fire debris evidence in order to distinguish pyroly-sate markers from fuels.
5.1.2 Tandem Mass Spectrometry (MS/MS)
Mass spectrometry is now widely used in the identification of organic com-pounds such as the components found in ignitable liquid residues. The resultof an MS experiment is an ion that could represent the molecular ion or oneof the fragment ions of the target analyte. Tandem mass spectrometryinvolves a second MS experiment on the isolated ion from the first experi-ment. MS/MS can be achieved in space (spatial resolution) with magneticsector or quadrupole instruments connected in series or in time (temporalresolution) with the use of an ion trap mass spectrometer instrument. Thetriple-quadrupole mass spectrometer was developed
15
and commercializedfor routine use of this technique. Following the chromatographic separationof the compounds, an ion source provides the ionization step and is followedby component ion separation in the first quadrupole, which acts as a massfilter. In the typical GC/MS experiment, detection of the ions would followthis step to end the experiment. In a triple-quadrupole MS/MS experiment,a second quadrupole acts as a collision chamber to produce collisionalinduced dissociation (CID) of the selected ions. The third quadrupole, alsoa mass analyzer, can resolve the resulting daughter ions produced in thecollision chamber and detect the ions. MS/MS can be coupled to gas or liquidchromatography systems.
1522_book.fm Page 183 Thursday, November 13, 2003 9:58 AM
© 2004 by CRC Press LLC
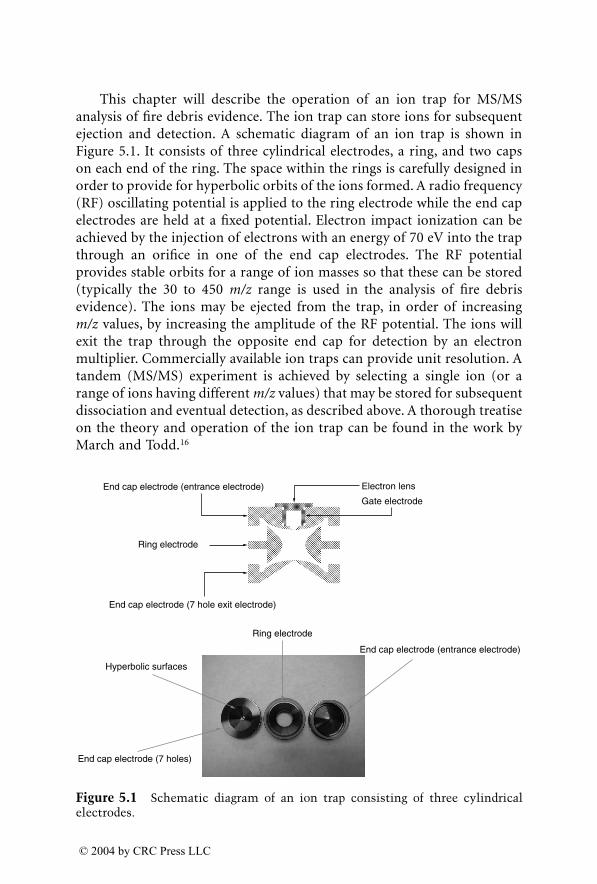
This chapter will describe the operation of an ion trap for MS/MSanalysis of fire debris evidence. The ion trap can store ions for subsequentejection and detection. A schematic diagram of an ion trap is shown inFigure 5.1. It consists of three cylindrical electrodes, a ring, and two capson each end of the ring. The space within the rings is carefully designed inorder to provide for hyperbolic orbits of the ions formed. A radio frequency(RF) oscillating potential is applied to the ring electrode while the end capelectrodes are held at a fixed potential. Electron impact ionization can beachieved by the injection of electrons with an energy of 70 eV into the trapthrough an orifice in one of the end cap electrodes. The RF potentialprovides stable orbits for a range of ion masses so that these can be stored(typically the 30 to 450
m/z
range is used in the analysis of fire debrisevidence). The ions may be ejected from the trap, in order of increasing
m/z
values, by increasing the amplitude of the RF potential. The ions willexit the trap through the opposite end cap for detection by an electronmultiplier. Commercially available ion traps can provide unit resolution. Atandem (MS/MS) experiment is achieved by selecting a single ion (or arange of ions having different
m/z
values) that may be stored for subsequentdissociation and eventual detection, as described above. A thorough treatiseon the theory and operation of the ion trap can be found in the work byMarch and Todd.
16
Figure 5.1
Schematic diagram of an ion trap consisting of three cylindricalelectrodes.
End cap electrode (entrance electrode)
Ring electrode
End cap electrode (7 hole exit electrode)
Electron lens
Gate electrode
Ring electrode
End cap electrode (entrance electrode)
End cap electrode (7 holes)
Hyperbolic surfaces
1522_book.fm Page 184 Thursday, November 13, 2003 9:58 AM
© 2004 by CRC Press LLC
5.1.3 Fire Debris Analysis
The investigation of a suspected arson includes the extraction, isolation, andanalysis of the debris resulting from the fire, in order to determine thepresence of any ignitable liquid residues (ILR) that may have been used asan “accelerant” and could serve as evidence of an arson. Typical accelerantsused are automobile gasoline, diesel fuel, and other volatile mixtures that canbe acquired commercially. The literature describing the extraction of thesecompounds from debris, the analysis of the extracts, and the interpretationof the data is very mature.
17–24
Forensic scientists, through the ASTM, havedeveloped and published consensus standards for the analysis and interpre-tation of fire debris evidence.
1–8
These advances have led to what are nowfairly routine and standardized analytical methodologies for the analysis offire debris. In most cases, there is enough target compound concentrationin the sample so that the extraction and analysis is straightforward. In theabsence of methods for the extraction and analysis of very low concentrationsof the volatile organic compounds that make up ILRs, the sample may bedetermined as negative, possibly ending the investigation process. Recentreports of sensitive methods for the extraction and analysis of ILR targetcompounds, including the use of solid phase microextraction (SPME), havedescribed the application of SPME as an improvement in the extraction andpreconcentration of the analytes of interest in a single, simple step prior toGC/MS analysis.
25–35,12
These methods have been shown to improve the sen-sitivity of the analysis by improving the extraction efficiency of very lowconcentrations of the target compounds. Further complications during theanalysis of these kinds of samples include the presence of compounds fromthe substrate background and product compounds formed during the com-bustion and pyrolysis of substrate material. It has been reported that theseinterferences could have an effect on the analysis of the ILRs,
24
even whenGC/MS is used as the analytical technique. One possible solution to theresolution of small quantities of target compounds in the presence of inter-fering species is the use of GC/MS/MS, which isolates the target compoundsof interest in the first MS experiment (using an ion trap), followed by dis-sociation of the “trapped” target compound, and finally, the identificationof the target compound, free of interferences. The following describes theuse of MS/MS in the isolation and analysis of ILRs in the presence of inter-fering species when the sample contains ILRs in very low concentrations, andGC/MS alone cannot solve the problem.
5.1.3.1 Ion Trap MS/MS in Fire Debris Analysis
Electron ionization (EI) is typically used as the source of ionization in themass spectral analysis of ignitable liquid residues. A voltage of 70 V impartsenough energy in the ionization process to form positive ion fragments.
1522_book.fm Page 185 Thursday, November 13, 2003 9:58 AM
© 2004 by CRC Press LLC
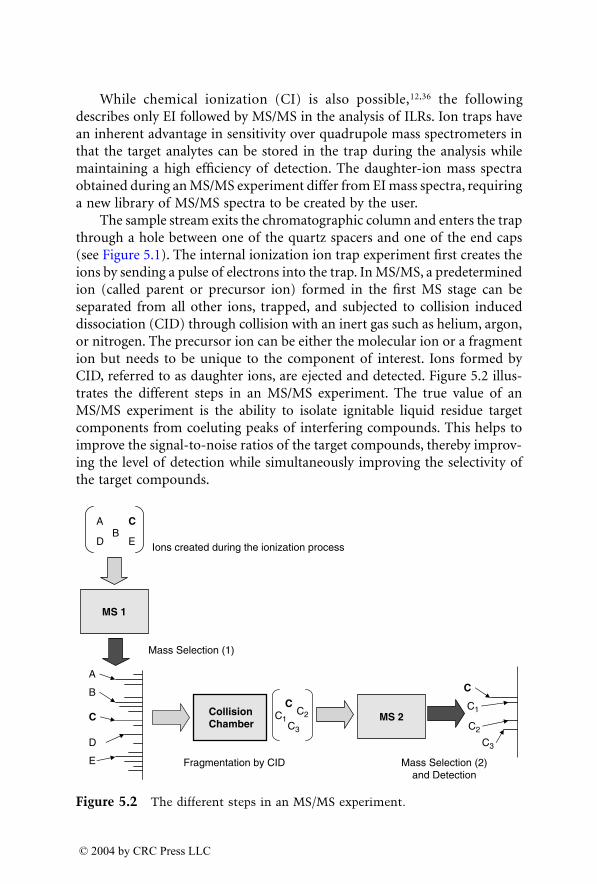
While chemical ionization (CI) is also possible,
12,36
the followingdescribes only EI followed by MS/MS in the analysis of ILRs. Ion traps havean inherent advantage in sensitivity over quadrupole mass spectrometers inthat the target analytes can be stored in the trap during the analysis whilemaintaining a high efficiency of detection. The daughter-ion mass spectraobtained during an MS/MS experiment differ from EI mass spectra, requiringa new library of MS/MS spectra to be created by the user.
The sample stream exits the chromatographic column and enters the trapthrough a hole between one of the quartz spacers and one of the end caps(see Figure 5.1). The internal ionization ion trap experiment first creates theions by sending a pulse of electrons into the trap. In MS/MS, a predeterminedion (called parent or precursor ion) formed in the first MS stage can beseparated from all other ions, trapped, and subjected to collision induceddissociation (CID) through collision with an inert gas such as helium, argon,or nitrogen. The precursor ion can be either the molecular ion or a fragmention but needs to be unique to the component of interest. Ions formed byCID, referred to as daughter ions, are ejected and detected. Figure 5.2 illus-trates the different steps in an MS/MS experiment. The true value of anMS/MS experiment is the ability to isolate ignitable liquid residue targetcomponents from coeluting peaks of interfering compounds. This helps toimprove the signal-to-noise ratios of the target compounds, thereby improv-ing the level of detection while simultaneously improving the selectivity ofthe target compounds.
Figure 5.2
The different steps in an MS/MS experiment.
AB
C
D
Mass Selection (1)
AC
C1
C2
C3
B
C1C2
C3
CC
D
Fragmentation by CIDE
Ions created during the ionization processE
CollisionChamber
MS 2
MS 1
Mass Selection (2)and Detection
1522_book.fm Page 186 Thursday, November 13, 2003 9:58 AM
© 2004 by CRC Press LLC
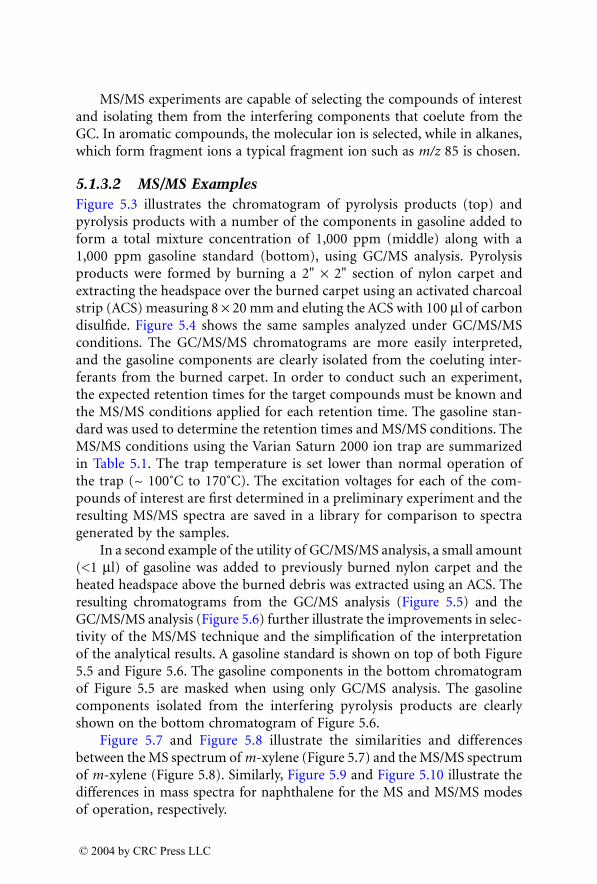
MS/MS experiments are capable of selecting the compounds of interestand isolating them from the interfering components that coelute from theGC. In aromatic compounds, the molecular ion is selected, while in alkanes,which form fragment ions a typical fragment ion such as
m/z
85 is chosen.
5.1.3.2 MS/MS Examples
Figure 5.3 illustrates the chromatogram of pyrolysis products (top) andpyrolysis products with a number of the components in gasoline added toform a total mixture concentration of 1,000 ppm (middle) along with a1,000 ppm gasoline standard (bottom), using GC/MS analysis. Pyrolysisproducts were formed by burning a 2"
¥
2" section of nylon carpet andextracting the headspace over the burned carpet using an activated charcoalstrip (ACS) measuring 8
¥
20 mm and eluting the ACS with 100
m
l of carbondisulfide. Figure 5.4 shows the same samples analyzed under GC/MS/MSconditions. The GC/MS/MS chromatograms are more easily interpreted,and the gasoline components are clearly isolated from the coeluting inter-ferants from the burned carpet. In order to conduct such an experiment,the expected retention times for the target compounds must be known andthe MS/MS conditions applied for each retention time. The gasoline stan-dard was used to determine the retention times and MS/MS conditions. TheMS/MS conditions using the Varian Saturn 2000 ion trap are summarizedin Table 5.1. The trap temperature is set lower than normal operation ofthe trap (~ 100˚C to 170˚C). The excitation voltages for each of the com-pounds of interest are first determined in a preliminary experiment and theresulting MS/MS spectra are saved in a library for comparison to spectragenerated by the samples.
In a second example of the utility of GC/MS/MS analysis, a small amount(<1
m
l) of gasoline was added to previously burned nylon carpet and theheated headspace above the burned debris was extracted using an ACS. Theresulting chromatograms from the GC/MS analysis (Figure 5.5) and theGC/MS/MS analysis (Figure 5.6) further illustrate the improvements in selec-tivity of the MS/MS technique and the simplification of the interpretationof the analytical results. A gasoline standard is shown on top of both Figure5.5 and Figure 5.6. The gasoline components in the bottom chromatogramof Figure 5.5 are masked when using only GC/MS analysis. The gasolinecomponents isolated from the interfering pyrolysis products are clearlyshown on the bottom chromatogram of Figure 5.6.
Figure 5.7 and Figure 5.8 illustrate the similarities and differencesbetween the MS spectrum of
m
-xylene (Figure 5.7) and the MS/MS spectrumof
m
-xylene (Figure 5.8). Similarly, Figure 5.9 and Figure 5.10 illustrate thedifferences in mass spectra for naphthalene for the MS and MS/MS modesof operation, respectively.
1522_book.fm Page 187 Thursday, November 13, 2003 9:58 AM
© 2004 by CRC Press LLC
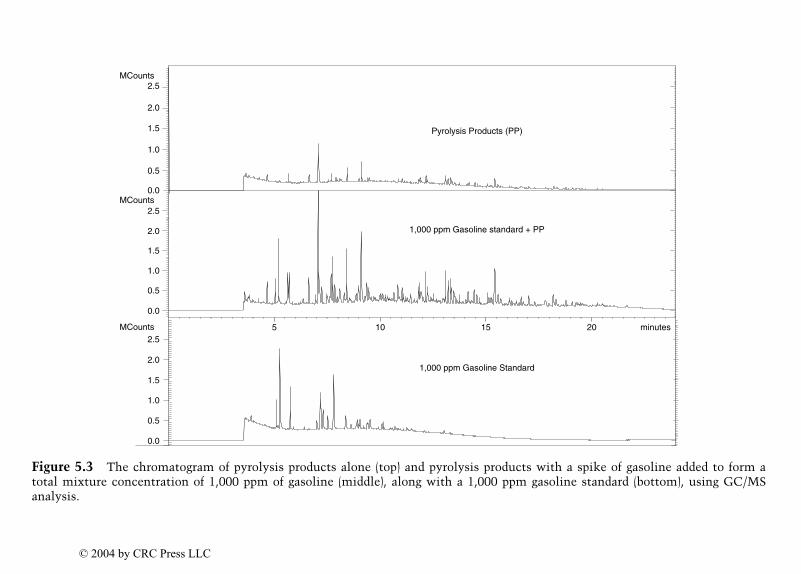
Figure 5.3
The chromatogram of pyrolysis products alone (top) and pyrolysis products with a spike of gasoline added to form atotal mixture concentration of 1,000 ppm of gasoline (middle), along with a 1,000 ppm gasoline standard (bottom), using GC/MSanalysis.
0.0
0.5
1.0
1.5
2.0
2.5
0.5
2.5
2.0
1.5
1.0
0.5
0.0
2.5
2.0
1.5
1.0
0.0
MCounts
MCounts
MCounts
minutes2015105
1,000 ppm Gasoline Standard
1,000 ppm Gasoline standard + PP
Pyrolysis Products (PP)
1522_book.fm Page 188 T
hursday, Novem
ber 13, 2003 9:58 AM
© 2004 by CRC Press LLC
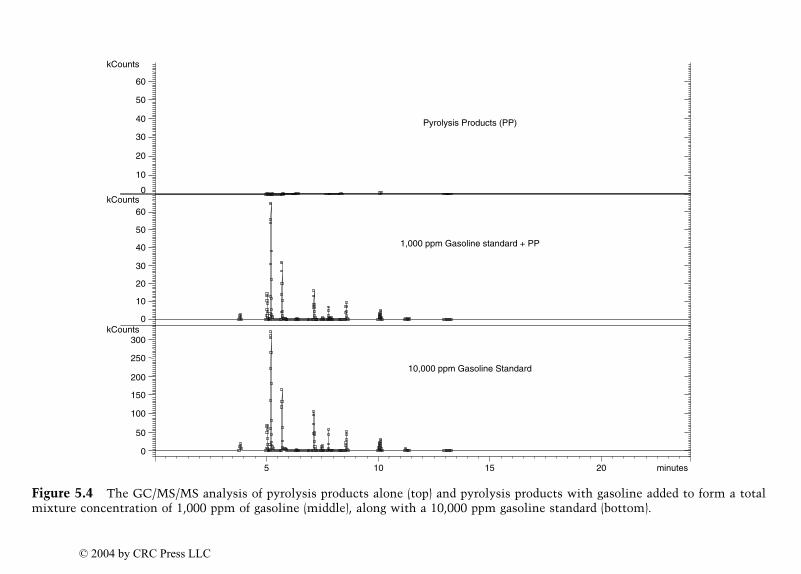
Figure 5.4
The GC/MS/MS analysis of pyrolysis products alone (top) and pyrolysis products with gasoline added to form a totalmixture concentration of 1,000 ppm of gasoline (middle), along with a 10,000 ppm gasoline standard (bottom).
60
50
40
30
20
10
0
10
20
60
50
40
30
0
300
250
200
150
100
50
0
minutes2015105
10,000 ppm Gasoline Standard
1,000 ppm Gasoline standard + PP
Pyrolysis Products (PP)
kCounts
kCounts
kCounts
1522_book.fm Page 189 T
hursday, Novem
ber 13, 2003 9:58 AM
© 2004 by CRC Press LLC
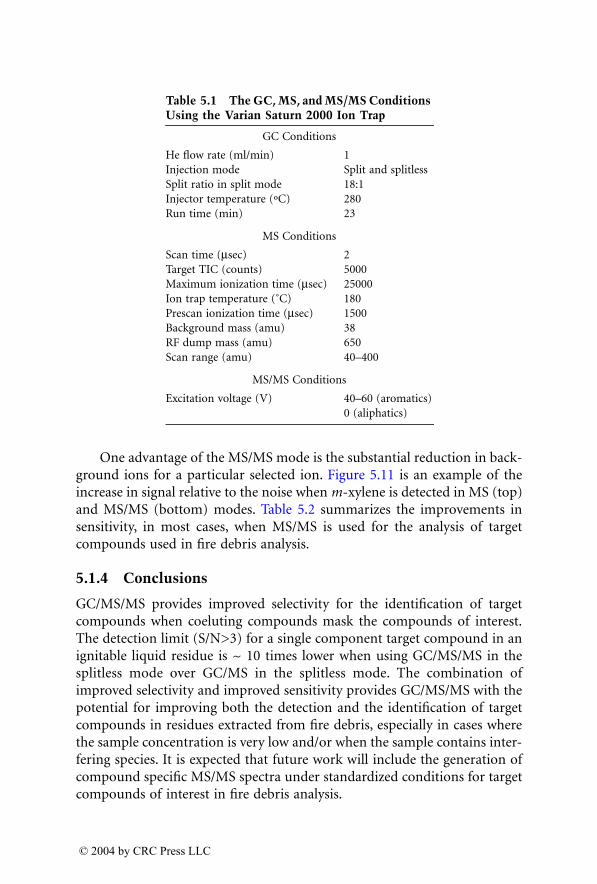
One advantage of the MS/MS mode is the substantial reduction in back-ground ions for a particular selected ion. Figure 5.11 is an example of theincrease in signal relative to the noise when
m -xylene is detected in MS (top)and MS/MS (bottom) modes. Table 5.2 summarizes the improvements insensitivity, in most cases, when MS/MS is used for the analysis of targetcompounds used in fire debris analysis.
5.1.4 Conclusions
GC/MS/MS provides improved selectivity for the identification of targetcompounds when coeluting compounds mask the compounds of interest.The detection limit (S/N>3) for a single component target compound in anignitable liquid residue is ~ 10 times lower when using GC/MS/MS in thesplitless mode over GC/MS in the splitless mode. The combination ofimproved selectivity and improved sensitivity provides GC/MS/MS with thepotential for improving both the detection and the identification of targetcompounds in residues extracted from fire debris, especially in cases wherethe sample concentration is very low and/or when the sample contains inter-fering species. It is expected that future work will include the generation ofcompound specific MS/MS spectra under standardized conditions for targetcompounds of interest in fire debris analysis.
Table 5.1 The GC, MS, and MS/MS Conditions
Using the Varian Saturn 2000 Ion Trap
GC Conditions
He flow rate (ml/min) 1Injection mode Split and splitlessSplit ratio in split mode 18:1Injector temperature (ºC) 280Run time (min) 23
MS Conditions
Scan time (
m sec) 2Target TIC (counts) 5000Maximum ionization time (
m
sec) 25000Ion trap temperature (˚C) 180Prescan ionization time (
m sec) 1500Background mass (amu) 38RF dump mass (amu) 650Scan range (amu) 40–400
MS/MS Conditions
Excitation voltage (V) 40–60 (aromatics)0 (aliphatics)
1522_book.fm Page 190 Thursday, November 13, 2003 9:58 AM
© 2004 by CRC Press LLC
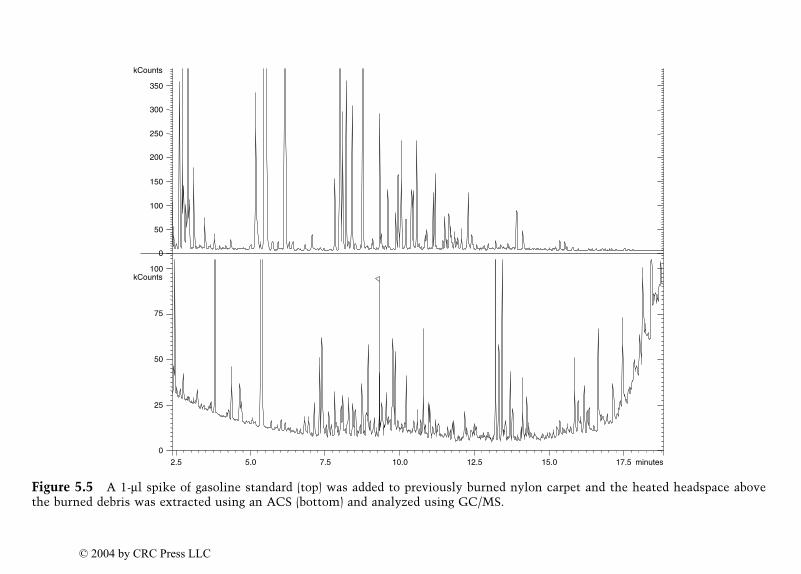
Figure 5.5
A 1-
m
l spike of gasoline standard (top) was added to previously burned nylon carpet and the heated headspace abovethe burned debris was extracted using an ACS (bottom) and analyzed using GC/MS.
2.5
0
5.0 7.5 10.0 12.5 15.0 17.5
0
50
100
150
200
250
300
350
25
50
75
100
minutes
kCounts
kCounts
1522_book.fm Page 191 T
hursday, Novem
ber 13, 2003 9:58 AM
© 2004 by CRC Press LLC
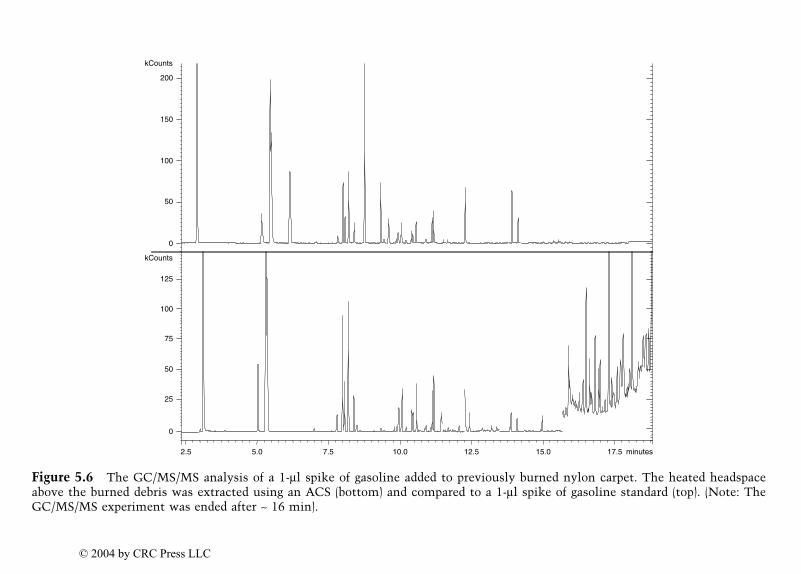
Figure 5.6
The GC/MS/MS analysis of a 1-
m
l spike of gasoline added to previously burned nylon carpet. The heated headspaceabove the burned debris was extracted using an ACS (bottom) and compared to a 1-
m
l spike of gasoline standard (top). (Note: TheGC/MS/MS experiment was ended after ~ 16 min).
200
50
100
150
2.5 5.0 7.5 10.0 12.5 15.0 17.5
0
125
100
75
50
25
0
minutes
kCounts
kCounts
1522_book.fm Page 192 T
hursday, Novem
ber 13, 2003 9:58 AM
© 2004 by CRC Press LLC
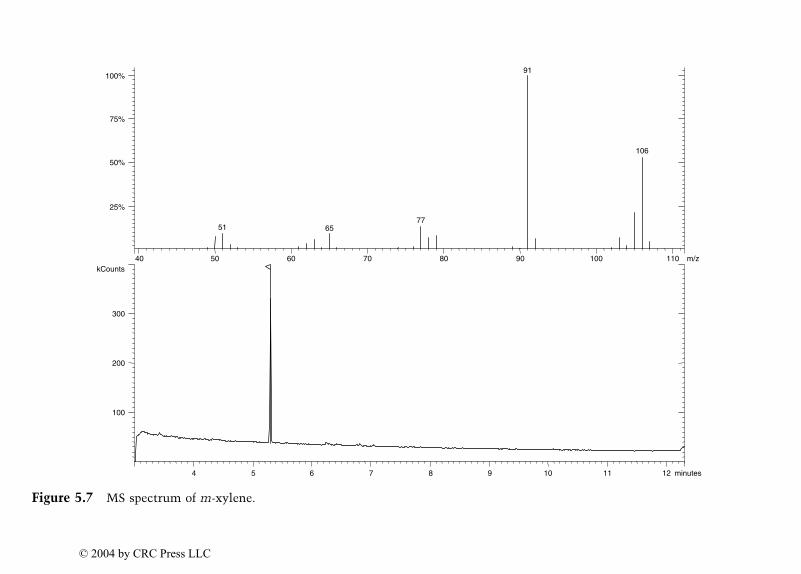
Figure 5.7
MS spectrum of
m
-xylene.
40 50 60 70 80 90 100 110
25%
65
91
4 5 6 7 8 9 10 11 12
100%
75%
106
50%
7751
300
200
100
minutes
m/zkCounts
1522_book.fm Page 193 T
hursday, Novem
ber 13, 2003 9:58 AM
© 2004 by CRC Press LLC

Figure 5.8
MS/MS spectrum of
m
-xylene.
91100%
75%
50%
65
25% 77
51 102 1060%
6040
10
20
50 70 10080 90
4 6 7 8 9 10 11 12
30
40
minutes5
m/zkCounts
1522_book.fm Page 194 T
hursday, Novem
ber 13, 2003 9:58 AM
© 2004 by CRC Press LLC
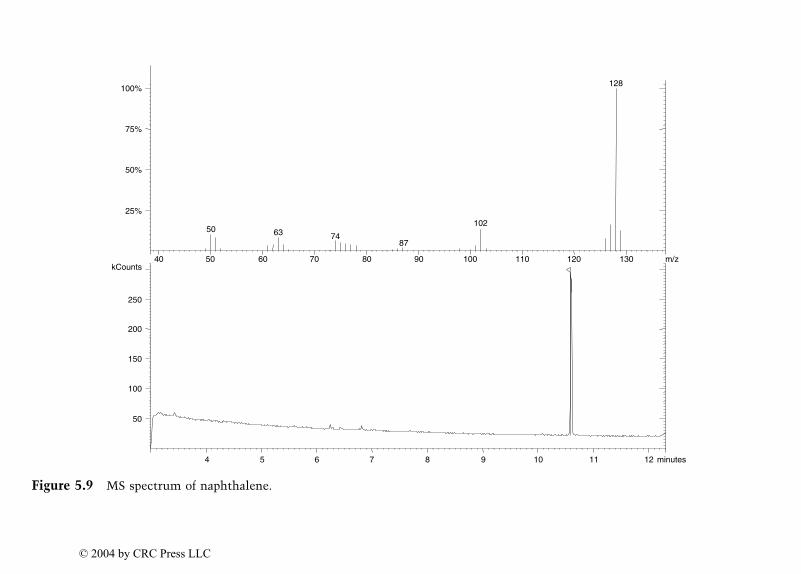
Figure 5.9
MS spectrum of naphthalene.
40 50 60 70 80 90 100 110 120 130 m/z
25%
50 63 7487
102
128
4 5 7 8 9 10 11 12
50
100%
75%
50%
250
200
150
100
minutes6
kCounts
1522_book.fm Page 195 T
hursday, Novem
ber 13, 2003 9:58 AM
© 2004 by CRC Press LLC
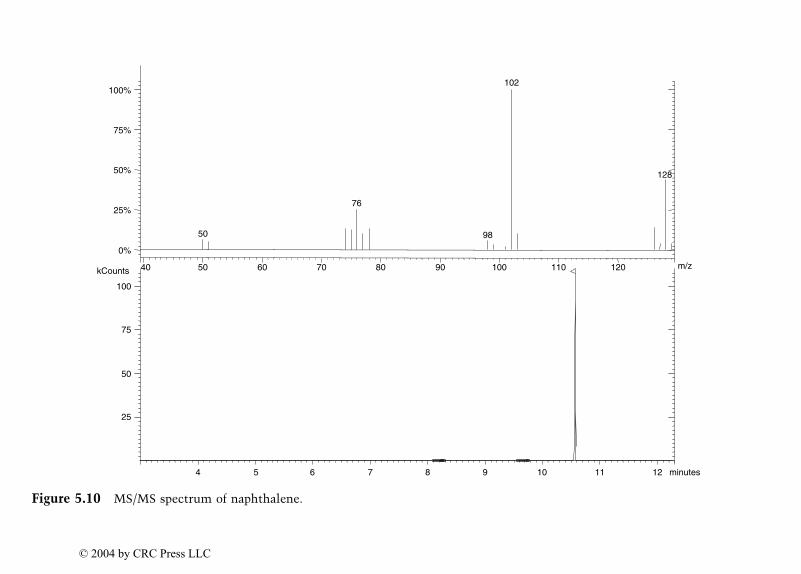
Figure 5.10
MS/MS spectrum of naphthalene.
102100%
75%
50% 128
7625%
50 98
0%
80 9050 60 70 100 110
10
40 120
100
75
50
25
126 8 9 1154 minutes7
kCountsm/z
1522_book.fm Page 196 T
hursday, Novem
ber 13, 2003 9:58 AM
© 2004 by CRC Press LLC
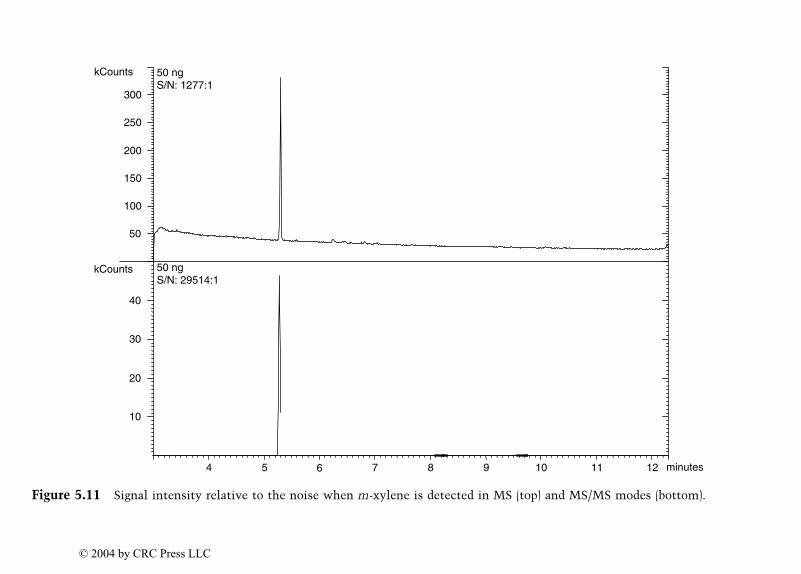
Figure 5.11
Signal intensity relative to the noise when
m
-xylene is detected in MS (top) and MS/MS modes (bottom).
4 5 7 9 10 11 12
10
20
30
50 ngS/N: 1277:1
50 ngS/N: 29514:1
300
250
200
150
100
50
40
kCounts
kCounts
minutes6 8
1522_book.fm Page 197 T
hursday, Novem
ber 13, 2003 9:58 AM
© 2004 by CRC Press LLC
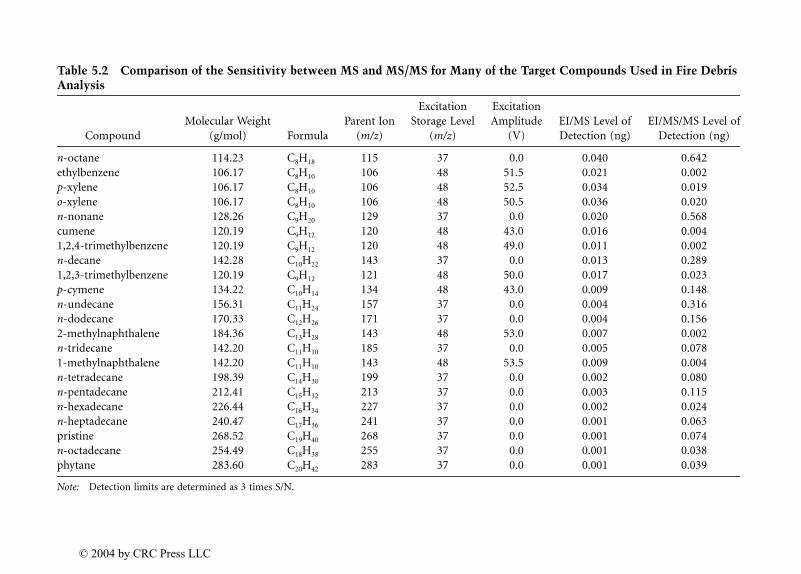
Table 5.2 Comparison of the Sensitivity between MS and MS/MS for Many of the Target Compounds Used in Fire Debris
Analysis
CompoundMolecular Weight
(g/mol) FormulaParent Ion
(
m/z
)
ExcitationStorage Level
(
m/z
)
ExcitationAmplitude
(V)EI/MS Level ofDetection (ng)
EI/MS/MS Level ofDetection (ng)
n
-octane 114.23 C
8
H
18
115 37 0.0 0.040 0.642ethylbenzene 106.17 C
8
H
10
106 48 51.5 0.021 0.002
p
-xylene 106.17 C
8
H
10
106 48 52.5 0.034 0.019
o
-xylene 106.17 C
8
H
10
106 48 50.5 0.036 0.020
n
-nonane 128.26 C
9
H
20
129 37 0.0 0.020 0.568cumene 120.19 C
9
H
12
120 48 43.0 0.016 0.0041,2,4-trimethylbenzene 120.19 C
9
H
12
120 48 49.0 0.011 0.002
n
-decane 142.28 C
10
H
22
143 37 0.0 0.013 0.2891,2,3-trimethylbenzene 120.19 C
9
H
12
121 48 50.0 0.017 0.023
p
-cymene 134.22 C
10
H
14
134 48 43.0 0.009 0.148
n
-undecane 156.31 C
11
H
24
157 37 0.0 0.004 0.316
n
-dodecane 170.33 C
12
H
26
171 37 0.0 0.004 0.1562-methylnaphthalene 184.36 C
13
H
28
143 48 53.0 0.007 0.002
n
-tridecane 142.20 C
11
H
10 185 37 0.0 0.005 0.0781-methylnaphthalene 142.20 C11H10 143 48 53.5 0.009 0.004n-tetradecane 198.39 C14H30 199 37 0.0 0.002 0.080n-pentadecane 212.41 C15H32 213 37 0.0 0.003 0.115n-hexadecane 226.44 C16H34 227 37 0.0 0.002 0.024n-heptadecane 240.47 C17H36 241 37 0.0 0.001 0.063pristine 268.52 C19H40 268 37 0.0 0.001 0.074n-octadecane 254.49 C18H38 255 37 0.0 0.001 0.038phytane 283.60 C20H42 283 37 0.0 0.001 0.039
Note: Detection limits are determined as 3 times S/N.
1522_book.fm Page 198 T
hursday, Novem
ber 13, 2003 9:58 AM
© 2004 by CRC Press LLC
Acknowledgments
The authors would like to acknowledge Supelco Sigma-Aldrich and the Col-lege of Arts and Sciences of Florida International University for financialsupport and Varian Inc. for a partial instrument grant which enabled us toconduct some of the work referred to in this chapter.
References
1. ASTM E1412-00 Standard Practice for Separation of Ignitable Liquid Resi-dues from Fire Debris Samples by Passive Headspace Concentration WithActivated Charcoal, ASTM Annual Book of Standards, Volume 14.02, ASTMInternational, West Conshohocken, PA, 2002.
2. ASTM E1413-00 Standard Practice for Separation and Concentration ofIgnitable Liquid Residues from Fire Debris Samples by Dynamic HeadspaceConcentration, ASTM Annual Book of Standards, Volume 14.02, ASTM Inter-national, West Conshohocken, PA, 2002.
3. ASTM E1388-00 Standard Practice for Sampling of Headspace Vapors fromFire Debris Samples, ASTM Annual Book of Standards, Volume 14.02, ASTMInternational, West Conshohocken, PA, 2002.
4. ASTM E1385-00 Standard Practice for Separation and Concentration ofIgnitable Liquid Residues from Fire Debris Samples by Steam Distillation,ASTM Annual Book of Standards, Volume 14.02, ASTM International, WestConshohocken, PA, 2002.
5. ASTM E1386-00 Standard Practice for Separation and Concentration ofIgnitable Liquid Residues from Fire Debris Samples by Solvent Extraction,ASTM Annual Book of Standards, Volume 14.02, ASTM International, WestConshohocken, PA, 2002.
6. ASTM E2154-01 Standard Practice for Separation and Concentration ofIgnitable Liquid Residues from Fire Debris Samples by Passive HeadspaceConcentration with Solid Phase Microextraction (SPME), ASTM AnnualBook of Standards, Volume 14.02, ASTM International, West Conshohocken,PA, 2002.
7. ASTM E1387-01 Standard Test Method for Ignitable Liquid Residues inExtracts from Fire Debris Samples by Gas Chromatography, ASTM AnnualBook of Standards, Volume 14.02, ASTM International, West Conshohocken,PA, 2002.
8. ASTM E1618-01 Standard Test Method for Ignitable Liquid Residues inExtracts from Fire Debris Samples by Gas Chromatography-Mass Spectrom-etry, ASTM Annual Book of Standards, Volume 14.02, ASTM International,West Conshohocken, PA, 2002.
1522_book.fm Page 199 Thursday, November 13, 2003 9:58 AM
© 2004 by CRC Press LLC
9. Plasencia, M. D., Montero, S., Krivis, J., Armstrong, A., and Almirall, J.,Improved sensitivity and selectivity for the detection and identification ofignitable liquid residues from fire debris by ion trap mass spectrometry I,in Proc. of the American Academy of Forensic Sciences Meeting, Reno, NV,2000.
10. Perr, J. M., Diaz, C., Furton, K. G., and Almirall, J. R., A comprehensiveapproach for analyzing ignitable liquid residues and explosive material usingSPME/GC/MS/MS, in Proc. of the International Association of Forensic ScienceMeeting, Montpellier, France, 2002.
11. Perr, J. M., Furton, K. G., and Almirall, J. R., The analysis of ignitable liquidresidues and explosive material using SPME/GC/MS/MS, in Proc. of the Amer-ican Academy of Forensic Sciences Meeting, Chicago, IL, 2003.
12. Almirall, J. R. and Perr, J., New developments and quality assurance in firedebris analysis, in Analysis and Interpretation of Fire Scene Evidence, Almirall,J. R. and Furton, K. G., Eds., CRC Press, Boca Raton, FL, 2003, in press.
13. Yost, R. A. and Fetterolf, D. D., MS/MS: Tandem mass spectrometry forforensic analysis, in Analytical Methods in Forensic Chemistry, Ho, M. H., Ed.,Ellis Horwood, West Sussex, England, 1990.
14. Homeyer, S., The FBI research partnership program, Forensic Sci. Comm., 1,5, 2003.
15. Yost, R. A. and Enke, C. G., Triple quadrupole mass spectrometry for directmixture analysis and structure elucidation, Anal. Chem. 51, 1251A, 1979.
16. Todd, J. F. J., Introduction to practical aspects of ion trap mass spectrometry,in Practical Aspects of Ion Trap Mass Spectrometry, March, R. E. and Todd, J.F. J., Eds., CRC Press, Boca Raton, FL, 1995.
17. Bertsch, W. and Zhang, Q.-W., Sample preparation for the chemical analysisof debris in suspect arson cases, Anal. Chim. Acta, 236, 183, 1990.
18. Keto, R. O. and Wineman, P. L., Detection of petroleum-based accelerants infire debris by target compound gas chromatography/mass spectrometry, Anal.Chem., 63, 1964, 1991.
19. Caddy, B., Smith, F. P., and Macy, J., Methods of fire debris preparation fordetection of accelerants, Forensic Sci. Rev., 3, 57, 1991.
20. Bertsch, W., Chemical analysis of fire debris. Was it arson? Anal. Chem. (News& Features), 68, 541A, 1996.
21. DeHaan, J. D., Kirk’s Fire Investigation, 5th ed., Prentice Hall, Upper SaddleRiver, NJ, 2002.
22. Bertsch, W., Analysis of accelerants in fire debris — data interpretation,Forensic Sci. Rev., 9, 1, 1997.
23. Newman, R., Gilbert, M., and Lothridge, K., GC-MS Guide to Ignitable Liq-uids, CRC Press, Boca Raton, FL, 1998.
1522_book.fm Page 200 Thursday, November 13, 2003 9:58 AM
© 2004 by CRC Press LLC
24. Almirall, J. R. and Furton, K. G., Characterization of background and pyrol-ysis products that may interfere with the forensic analysis of fire debris, J.Anal. Appl. Pyrolysis, in press , 2003.
25. Furton, K. G., Almirall, J. R., and Bruna, J., A simple, inexpensive, rapid,sensitive, and solventless technique for the analysis of accelerants in fire debrisbased on SPME, J. High Resolution Chromatogr., 18, 625, 1995.
26. Almirall, J. R. and Furton, K. G., A fast and simple method for the analysisof accelerants from fire debris using headspace solid-phase microextraction,in Proc. of the Int. Symp. on the Forensic Aspects of Arson Investigations, U.S.Government Printing Office, Washington, D.C., 1995, p. 337.
27. Almirall, J. R., Bruna, J., and Furton, K. G., The recovery of accelerants inaqueous samples from fire debris using solid phase microextraction (SPME),Science and Justice (J. Forensic Sci. Soc.), 36, 283, 1996.
28. Furton, K. G., Almirall, J. R., and Bruna, J., A novel method for the analysisof gasoline from fire debris using headspace solid phase microextraction, J.Forensic Sci., 41, 12, 1996.
29. Almirall, J. R. and Furton, K. G., Forensic and toxicology applications, inSolid Phase Microextraction: A Practical Guide, Scheppers Wercinski, S.A., Ed.,Marcel Dekker, New York, 1999, p. 203.
30. Furton, K. G., Wang, J., Hsu, Y.-L., Walton, J., and Almirall, J. R., The use ofsolid-phase microextraction/gas chromatography in forensic analysis, J. Chro-matogr. Sci., 38, 297, 2000.
31. Almirall, J. R., Wang, J., Lothridge, K., and Furton, K. G., The detection andanalysis of flammable or combustible liquid residues on human skin usingSPME/GC, J. Forensic Sci., 45, 461, 2000.
32. Furton, K. G., Almirall, J. R., Bi, M., Wang, J., and Wu, L., Application ofsolid-phase microextraction to the recovery of explosives and ignitable liquidresidues from forensic specimens, J. Chromatogr. A, 885, 419, 2000.
33. Almirall, J. R. and Furton, K. G., New developments in sampling and samplepreparation for forensic analysis, in Sample Preparation in Field and Labo-ratory, Pawliszyn, J. B., Ed., Elsevier Science, Amsterdam, 2002, chap. 17, p.919.
34. Ren, Q. L. and Bertsch, W., A comprehensive sample preparation scheme foraccelerants in suspect arson cases, J. Forensic Sci., 44, 504, 1999.
35. Harris, A. C. and Wheeler, J. F., GC-MS of ignitable liquids using solvent-desorbed SPME for automated analysis, J. Forensic Sci., 48, 41, 2003.
36. Armstrong, A., Plasencia, M. D., Montero, S., Krivis, J., and Almirall, J.R.,Improved sensitivity and selectivity for the detection and identification ofignitable liquid residues from fire debris by ion trap mass spectrometry II,in Proc. of the American Academy of Forensic Sciences Meeting, Reno, NV,2000.
1522_book.fm Page 201 Thursday, November 13, 2003 9:58 AM
© 2004 by CRC Press LLC
5.2 Analysis of Ignitable Liquids in Fire Debris and the Role of GC/MS/MS
Dale Sutherland
5.2.1 Introduction
Black hole, copious amounts of water, thunderstorm, hot spell, decisions, deci-sions…
Finally, you are able to investigate, take notes, observe burn patterns, getcircumstantial evidence, and obtain samples from the fire scene. But are thesesamples truly negative or does this field of forensic science lack the capabilityto handle these highly weathered, more difficult samples? In spite of burnpatterns, multiple areas of origin, K9 or other sample locators, etc., thesenow older samples often return from the forensic laboratory with negativeresults. This scenario has been seen more than once by many investigators.
As a rule, samples of debris that remain after any fire are very complexas they contain large quantities of a wide variety of burnt material. Thesesamples obtained by investigators may be turned over directly for laboratoryanalysis or may be stored for long periods of time awaiting other case infor-mation that may lead to a decision to have the samples analyzed. The analysisof the burnt material or fire debris can be very complex due to the largenumber of organic compounds present that represents the natural compo-nents of the material, compounds (called pyrolysates) made through expo-sure to heat and combustion, as well as potential ignitable liquid residuesthat may or may not have been used to accelerate a fire. No two fire debrissamples are identical. The detailed analysis of fire debris samples requires theskill and knowledge of a scientist that is focused on the challenges andobjectives in this field of trace evidence analysis. There are few tests availablethat can review and compare such a large number of characteristic targetedorganic compounds and/or organic class profiles to ultimately determinewhether a sample is “positive,” meaning that the sample contains residues ofan ignitable liquid, or “negative.” The ignitable liquid characteristics are oftenin very small amounts relative to the presence of large quantities of pyroly-sates. The most common samples contain materials such as wood, plastics,and polymers, which have a wide range of diversity without considering thepotential number of pyrolysates developed from their combustion.
Aside from the following brief statements, this chapter will not dwell onthe history of the analysis, which is readily available elsewhere.1 This chapterwill focus on the latest advancements and strategies in fire debris analysistoday. For many years the analysis of fire debris has been conducted by theextraction of the organic components from the fire debris sample, followedby compound separation with gas chromatography and detection by a uni-
1522_book.fm Page 202 Thursday, November 13, 2003 9:58 AM
© 2004 by CRC Press LLC
versal carbon detector such as a flame- or photo-ionization detector. ThisGC/FID or GC/PID approach is still being used today but is surpassed inspecificity — and thus in confidence in the result — as well as in its sensitivity,by detection with a mass spectrometer (GC/MS). The mass spectrometer isa much more flexible detector with effectively a universal response whenoperated in a full scan mode. The result is a total ion chromatogram verymuch like the chromatogram obtained from a GC/FID or GC/PID. The massspectrometer however can offer another dimension of specificity by obtaininga mass spectrum for a response that can be used to obtain a tentative iden-tification through computer library matching algorithms. Also, the scientistcan reconstruct specific-mass ions of interest that are characteristic for aspecific-class of organic compounds. For example an ion at m/z 120 can bereconstructed to show an ion chromatogram that describes the profile fordimethylbenzenes that may be present as a chemical class. This profile canalso be confirmed by similarly reconstructing (for a secondary identification)the ion at m/z 105.
However, when samples are very complex, the interpretation may bemore difficult, and the scientist often would like to see more clear informationupon which to base the result. This is especially true when some character-istics of an ignitable liquid may be observed in small quantities but may notbe comparable enough to the laboratory’s library of reference analyses todocument a positive result for the presence of an ignitable liquid. In somecomplex, weak, or highly weathered samples, the characteristic ion profilesdo not compare well enough for the layman to understand, whether judgeor jury. More information is then needed to conclusively show whether anignitable liquid is present or not. Other methods of analysis may provide theadditional information that confidently documents a positive or negativeresult in an unmistakable manner to both judge and jury.
5.2.2 Specificity — The Key to Difficult Samples
There are several ways to approach the analysis of samples that have a com-plex makeup or matrix. Fire debris samples may be a significant challengewhen they have a complex matrix dominated by large quantities of pyroly-sates, combined with compounds that are inherent to the material(s). Thesecan be many times more in quantity than any ignitable liquid residue thatmay be present. To uncover the ignitable liquid characteristics, the methodhas to either remove the unwanted pyrolysates and matrix or improve thespecificity of the test. Extract cleanup approaches have not been popular andhave not been routinely effective; some have recently been removed from listspublished by ASTM International.
It has been argued that more sensitivity is not required as this might leadto false positive results that may really be a natural characteristic of the
1522_book.fm Page 203 Thursday, November 13, 2003 9:58 AM
© 2004 by CRC Press LLC
background, or that such small quantities of hydrocarbons could be detectedthat virtually any sample would be positive. In fact, more sensitivity aloneis, not by itself, the solution to obtaining the additional information theforensic scientist needs. What is needed is more specificity in the test. Theoutcome of enhanced specificity is increased confidence in the result and anatural by-product is some increase in sensitivity. More specific methods canoften reveal the organic characteristics necessary to conclusively reportwhether the sample is positive or negative for the presence of an ignitableliquid. The way that a scientist can improve specificity can be in the form ofnew chromatographic methods, new processing software, new instrumentalhardware, or a combination of these.
5.2.2.1 Specificity Improvement — ChromatographicTo improve specificity, the scientist can turn to improving chromatographicresolution, which usually requires longer analysis times, or to narrower inter-nal diameter capillary columns that have higher resolution but less samplecapacity. The scientist can also use multidimensional or 2D chromatography(GCxGC) which can be very complex, especially for this matrix. Improvingchromatography alone is not enough to adequately address these samples.Instead of improving chromatography — or in addition to it — we turn todetection systems to improve specificity.
5.2.2.2 Specificity Improvement — DetectionDetection using mass spectrometry has greatly improved specificity over pastdetectors such as FID or PID. Today, GC/MS represents the benchmark inspecificity and thus the benchmark in confidence in the result. However, forweak samples, highly complex samples, or highly weathered samples, forensicscientists may still find themselves lacking some chemical characteristicsnecessary to provide a clear positive or negative result. In these cases analystsfind that the sample comparability is not adequate relative to their library ofreference analyses. To obtain more information from GC/MS analysis, thereare ways of improving specificity using new software for data reduction.
5.2.2.3 Specificity Improvement — Data Processing SoftwareNewly developed algorithms, to deconvolute chromatographically coelutingcompounds, effectively enhance selectivity. This is a result of the resurgenceof Time-of-Flight (TOF) mass spectrometers which have showcased the abil-ity to deconvolute target compounds from very difficult artificial concoctionsas well as real samples. Currently, this is not just a feature for TOF spectrom-eters but can also be conducted on data acquired by more common ion trapor quadrupole-based mass spectrometers. Software such as Ion FingerprintDetection (IFD) has been used by this author and has shown similarly
1522_book.fm Page 204 Thursday, November 13, 2003 9:58 AM
© 2004 by CRC Press LLC
impressive capabilities to the deconveluting algorithms associated with TOF.IFD has also impressed the U.S. Environmental Protection Agency for theanalysis of target compounds in difficult environmental samples.
Another software approach to improve specificity is to use pattern rec-ognition to search for the presence of certain chemical compounds andclasses. Macro methods1 and identification stratagems have been published2
that aid the scientist in the interpretation of samples primarily using massion profiles. A consistent approach to identification is required but it is oftenvery time-consuming. Thermo-Finnigan’s Xaminer program can be used ina stand-alone fashion or is well integrated into their Xcalibur data processingsoftware. Xaminer can process the contents of a GC/MS sample analysis andisolate target compounds. It then formulates these target compounds intoa spectragram comprised of compounds of many classes. The unknownspectragram is then compared against the spectragrams developed with thelaboratory’s library of reference substance analyses and provides a list ofprobable results. The results are listed in order of a fit score that uses thesame Biller–Biemann algorithms that scientists have been using for yearsfor NIST mass spectral library searches. The Xaminer algorithm uses an 8-peak presearch and the 50 most significant spectragram peaks with propor-tional mass weighting are removed. The simple intensity vs. compoundidentification data arrays allows for very rapid searching against the labo-ratory’s library of spectrograms developed from reference ignitable liquidanalyses. This gives confidence to the result as it adds the specificity ofpattern recognition across the chromatogram. Also of significant impor-tance is that with increasing numbers of ignitable liquid substances, itbecomes more and more difficult for the scientist to remember every char-acteristic for all the substances in the laboratory’s growing reference library.It is thus a very valuable tool for the scientist, who can then ensure acomplete, reproducible, and unbiased review of the sample against the ref-erence library. The scientist can then quickly double-check the results, know-ing that the sample characteristics have also been compared to not onlycommon ignitable liquids in the reference library but also to the moreobscure substances that are rarely seen. Some scientists at the Miami–DadeCounty Crime Laboratory are currently exploring the use of Xaminer inconjunction with GC/TOF.3
5.2.2.4 Specificity Improvement — HardwareSpecificity, beyond full scan mass spectrometry (GC/MS), can be improvedby adding additional hardware to the method. This can be done by addinganother gas chromatograph with the mass spectrometer as detector(GCxGC/MS), using emerging technology such as GC/isotope ratio massspectrometry (GC/IRMS), improving the mass resolution of the spectrometer
1522_book.fm Page 205 Thursday, November 13, 2003 9:58 AM
© 2004 by CRC Press LLC
beyond unit mass (high resolution mass spectrometers [GC/HRMS]), or bythe addition of another mass spectrometer procedure (GC/MS/MS).
Very recently GCxGC/MS (or two-dimensional gas chromatogra-phy/mass spectrometry, 2D GC/MS) has been used in experimentation onfire debris.4 The objective was to address the extra and coeluting pyrolysatepeaks that complicate the interpretation of class ion profiles, thus adverselyaffecting some compound ratios. A TOF instrument (Leco Pegasus) was useddue to its very fast scanning speed, essential for 2D GC/MS. An internal ovenmodulator was used to sequentially heart-cut 4-second components that arediverted to another more polar capillary column. The resulting 2D data plots,similar in appearance to 2D Gel Proteomics data, illustrated the additionalseparation of coeluting compounds. The data is displayed as a top–downview of a now-2D total ion chromatogram. With real samples, these 2D plots,which show a dot for the presence of each compound, are difficult to compareeven to the trained eye. This data has not been used in a court of law and inthis format would be incomprehensible to judge and jury alike. If the softwarecould be visually improved to more easily compare chemical class informa-tion in a courtroom situation, this approach might have merit as it addsadditional specificity to the GC/MS analysis by chromatographically resolv-ing some additional pyrolysates from compounds of interest. The 4-secondanalysis on the more polar column does not appear to have a particularlyhigh level of chromatographic resolution. It is unknown whether the analystcan display selected compounds that have been deconvoluted in a selectedion profile manner to allow easy pattern recognition and comparison ofcompound class characteristics.
Analysis by GC/HRMS significantly improves the analysis by improvingthe mass resolution; e.g., the mass of an ion can be measured to 0.001 amu ata resolution of 10,000, which often completely removes all pyrolysates that havea similar mass. However, this half-million dollar instrument is usually reservedfor environmental samples that are tested for the presence of polychlorinateddibenzo-p-dioxins and -furans at ultra trace parts-per-quadrillion levels.
GC/IRMS may show promise, but it is of high cost and is also in exper-imental use and unproven for trace evidence work.
With the advent of the benchtop ion trap mass spectrometer, at a costsimilar to quadrupole units, the price to obtain MS/MS capability and itsspecificity is not an obstacle and is now discussed further.
5.2.3 Analysis by GC/MS/MS
As references will show, the use of GC/MS/MS is well documented in otherfields of analysis including forensics. This laboratory has conducted researchand development using GC/MS/MS since April 1997. GC/MS/MS is the
1522_book.fm Page 206 Thursday, November 13, 2003 9:58 AM
© 2004 by CRC Press LLC
coupling of gas chromatography with mass ion isolation with the first massspectrometer, followed by a second MS stage of dissociation through ioncollisions and subsequent detection of the daughter ions formed. The seconddissociation and new daughter ion spectrum detected by the second MSoperation creates the added specificity that labels GC/MS/MS as perhaps theultimate method today for mixture analysis.
In MS/MS, a significant ion from a targeted compound or a characteristicion from a chemical class is chosen from a full scan GC/MS mass spectrum.This is the parent (or precursor) ion. In the MS/MS acquisition, the chosenparent ion is isolated in the first MS operation. In the second MS stage itundergoes collision induced dissociation (CID) with helium reagent gas, whichresults in a new daughter ion (or product ion) spectrum. The isolation andCID process makes MS/MS inherently more selective than MS alone, and thispresents numerous advantages for complex samples where analyte and matrixcoelution are common. An ion trap mass spectrometer that includes tandemmass spectrometry in time also offers advantages of reduced electronics, man-ifolds, and pumps (and price), compared to a triple linear quadrupole massspectrometer which is based on tandem mass spectrometry in space.5 The latestion trap mass spectrometers include higher scan rates, external ionization, andthe capability of obtaining both full scan and MS/MS information in the sameanalytical run. This use of GC/MS/MS is not new. This tandem mass spec-trometry approach has clearly been shown to be the method of choice forbiological specimens, detection of explosives, and drugs of abuse, as well asfor structure elucidation in pharmaceutical analysis. Its application in forensiclaboratories has been limited in the past by the cost and complexity of theinstrumentation. This has changed with the relatively low cost and high effi-ciency of conducting MS/MS in an ion trap mass spectrometer.
GC/MS/MS has been used to address problems of analytes in complexmatrices such as THC in blood,6 trace quantities in difficult matrices suchas residues of drugs of abuse in hair,7 or to minimize the matrix interferencesin the analysis of pesticides in fruits and vegetables.8
The high sensitivity and selectivity of GC/MS/MS have been used in thedetection of trace components in explosive mixtures.9 These are importantin environmental remediation projects or for high-speed security sweeps suchas those done at airports.
GC/MS/MS is one of the laboratory’s “big guns” used when the resultmust have the highest defensibility. An example is the use of MS/MS(although with liquid chromatographic separation) in the much publicizedO.J. Simpson trial. A method using LC/MS/MS was developed to determinewhether the blood stained cloth swatch and socks found at the O.J. Simpsonresidence contained the blood preservative EDTA. The analysis successfullydetermined that EDTA was not present in the evidence at levels indicating
1522_book.fm Page 207 Thursday, November 13, 2003 9:58 AM
© 2004 by CRC Press LLC
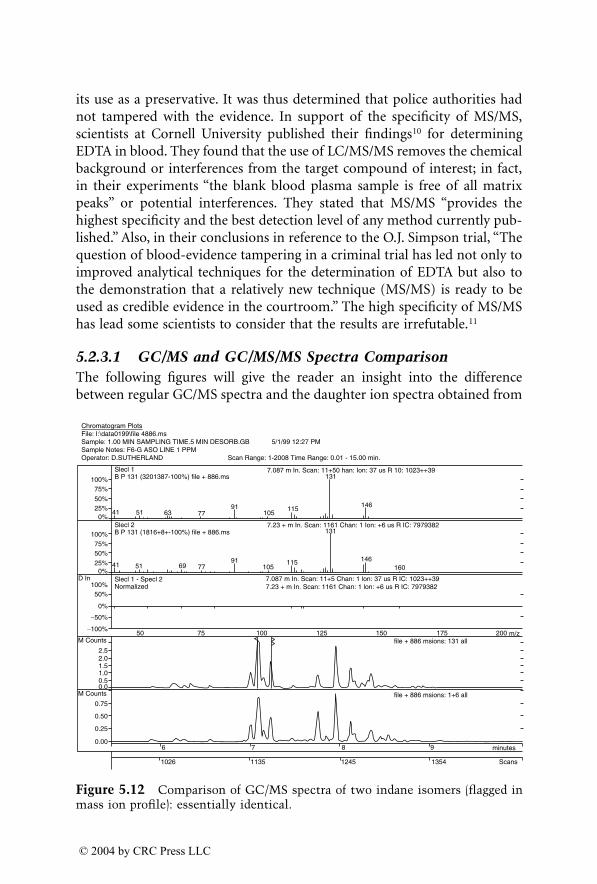
its use as a preservative. It was thus determined that police authorities hadnot tampered with the evidence. In support of the specificity of MS/MS,scientists at Cornell University published their findings10 for determiningEDTA in blood. They found that the use of LC/MS/MS removes the chemicalbackground or interferences from the target compound of interest; in fact,in their experiments “the blank blood plasma sample is free of all matrixpeaks” or potential interferences. They stated that MS/MS “provides thehighest specificity and the best detection level of any method currently pub-lished.” Also, in their conclusions in reference to the O.J. Simpson trial, “Thequestion of blood-evidence tampering in a criminal trial has led not only toimproved analytical techniques for the determination of EDTA but also tothe demonstration that a relatively new technique (MS/MS) is ready to beused as credible evidence in the courtroom.” The high specificity of MS/MShas lead some scientists to consider that the results are irrefutable.11
5.2.3.1 GC/MS and GC/MS/MS Spectra ComparisonThe following figures will give the reader an insight into the differencebetween regular GC/MS spectra and the daughter ion spectra obtained from
Figure 5.12 Comparison of GC/MS spectra of two indane isomers (flagged inmass ion profile): essentially identical.
M Counts
0.006
1026 1135 1245 1354 Scans
7 8 9 minutes
0.25
0.50
0.75
0.00.51.01.52.02.5
−100%
−50%
0%
50%100%
D In0%
25%
50%75%
100%
0%41
41
51
51
50 75 100 125 150 175 200 m/z
69 7791
105115
131
146160
63 7791
105115
131
14625%50%
75%100%
7.087 m In. Scan: 11+50 han: Ion: 37 us R 10: 1023++39
7.23 + m In. Scan: 1161 Chan: 1 Ion: +6 us R IC: 7979382
7.087 m In. Scan: 11+5 Chan: 1 lon: 37 us R IC: 1023++397.23 + m In. Scan: 1161 Chan: 1 lon: +6 us R IC: 7979382
file + 886 msions: 131 all
file + 886 msions: 1+6 all
Slecl 1 B P 131 (3201387-100%) file + 886.ms
Slecl 2 B P 131 (1816+8+-100%) file + 886.ms
Slecl 1 - Specl 2 Normalized
M Counts
Chromatogram PlotsFile: I:\data0199\file 4886.msSample: 1.00 MIN SAMPLING TIME.5 MIN DESORB.GB 5/1/99 12:27 PMSample Notes: F6-G ASO LINE 1 PPMOperator: D.SUTHERLAND Scan Range: 1-2008 Time Range: 0.01 - 15.00 min.
1522_book.fm Page 208 Thursday, November 13, 2003 9:58 AM
© 2004 by CRC Press LLC
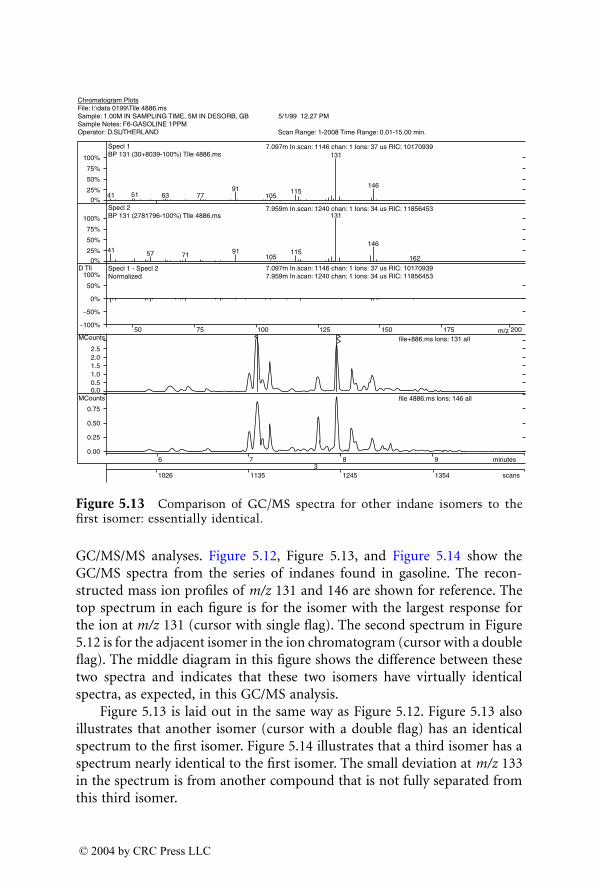
GC/MS/MS analyses. Figure 5.12, Figure 5.13, and Figure 5.14 show theGC/MS spectra from the series of indanes found in gasoline. The recon-structed mass ion profiles of m/z 131 and 146 are shown for reference. Thetop spectrum in each figure is for the isomer with the largest response forthe ion at m/z 131 (cursor with single flag). The second spectrum in Figure5.12 is for the adjacent isomer in the ion chromatogram (cursor with a doubleflag). The middle diagram in this figure shows the difference between thesetwo spectra and indicates that these two isomers have virtually identicalspectra, as expected, in this GC/MS analysis.
Figure 5.13 is laid out in the same way as Figure 5.12. Figure 5.13 alsoillustrates that another isomer (cursor with a double flag) has an identicalspectrum to the first isomer. Figure 5.14 illustrates that a third isomer has aspectrum nearly identical to the first isomer. The small deviation at m/z 133in the spectrum is from another compound that is not fully separated fromthis third isomer.
Figure 5.13 Comparison of GC/MS spectra for other indane isomers to thefirst isomer: essentially identical.
1026 1135 1245 1354 scans
Chromatogram PlotsFile: I:\data 0199\Tlle 4886.msSample: 1.00M IN SAMPLING TIME, 5M IN DESORB, GB 5/1/99 12.27 PMSample Notes: F6-GASOLINE 1PPMOperator: D.SUTHERLAND Scan Range: 1-2008 Time Range: 0.01-15.00 min.
7.097m In.scan: 1146 chan: 1 Ions: 37 us RIC: 10170939
7.959m In.scan: 1240 chan: 1 Ions: 34 us RIC: 11856453
7.097m In.scan: 1146 chan: 1 Ions: 37 us RIC: 101709397.959m In.scan: 1240 chan: 1 Ions: 34 us RIC: 11856453
minutes
file 4886.ms lons: 146 all
file+886.ms lons: 131 all
36 7 8 9
MCounts
0.00
0.25
0.50
0.75
MCounts
0.00.51.01.52.02.5
D Tll
−100%
−50%
0%
50%
100%
25%
50%
75%
100%
0%
25%
0%
50%
75%
100%
Specl 1BP 131 (30+8039-100%) Tlle 4886.ms
Specl 2BP 131 (2781796-100%) Tlle 4886.ms
Specl 1 - Specl 2Normalized
50 75 100 125 150 175 200m/z
41 57 71 91105
115
131
146
162
41
146
131
115105
91776351
1522_book.fm Page 209 Thursday, November 13, 2003 9:58 AM
© 2004 by CRC Press LLC
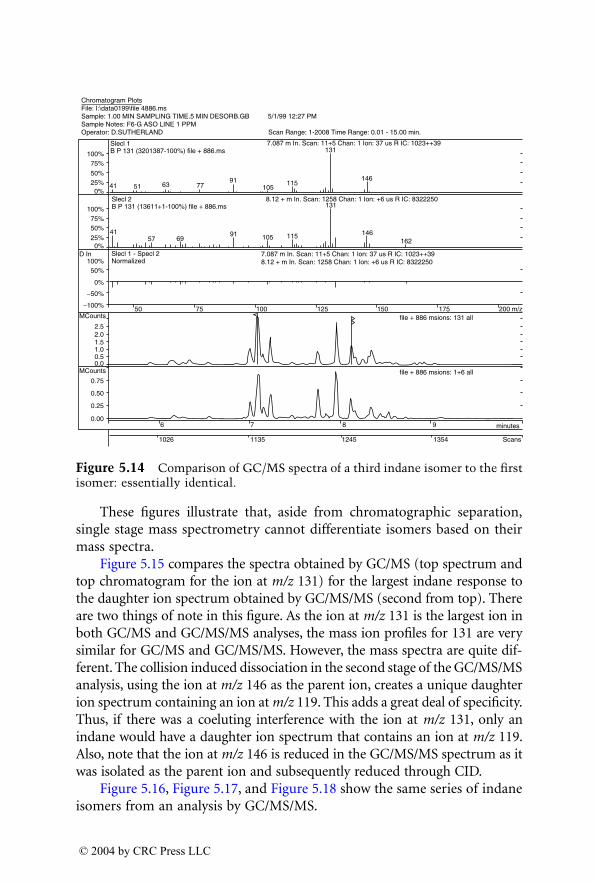
These figures illustrate that, aside from chromatographic separation,single stage mass spectrometry cannot differentiate isomers based on theirmass spectra.
Figure 5.15 compares the spectra obtained by GC/MS (top spectrum andtop chromatogram for the ion at m/z 131) for the largest indane response tothe daughter ion spectrum obtained by GC/MS/MS (second from top). Thereare two things of note in this figure. As the ion at m/z 131 is the largest ion inboth GC/MS and GC/MS/MS analyses, the mass ion profiles for 131 are verysimilar for GC/MS and GC/MS/MS. However, the mass spectra are quite dif-ferent. The collision induced dissociation in the second stage of the GC/MS/MSanalysis, using the ion at m/z 146 as the parent ion, creates a unique daughterion spectrum containing an ion at m/z 119. This adds a great deal of specificity.Thus, if there was a coeluting interference with the ion at m/z 131, only anindane would have a daughter ion spectrum that contains an ion at m/z 119.Also, note that the ion at m/z 146 is reduced in the GC/MS/MS spectrum as itwas isolated as the parent ion and subsequently reduced through CID.
Figure 5.16, Figure 5.17, and Figure 5.18 show the same series of indaneisomers from an analysis by GC/MS/MS.
Figure 5.14 Comparison of GC/MS spectra of a third indane isomer to the firstisomer: essentially identical.
MCounts
0.00
0.25
0.50
0.75
0.00.51.01.52.02.5
MCounts
1026
6 7 8 9 minutes
1135 1245 1354 Scans
Slecl 1 B P 131 (3201387-100%) file + 886.ms
Chromatogram PlotsFile: I:\data0199\file 4886.msSample: 1.00 MIN SAMPLING TIME.5 MIN DESORB.GB 5/1/99 12:27 PMSample Notes: F6-G ASO LINE 1 PPMOperator: D.SUTHERLAND Scan Range: 1-2008 Time Range: 0.01 - 15.00 min.
0%25%50%
75%100%
0%25%
4157
41 51 63 7791
105115
131
146
6991 105 115
131
146162
50%75%
100%
−100% 50 75 100 125 150 175 200 m/z
−50%
0%
50%100%
D In
Slecl 2 B P 131 (13611+1-100%) file + 886.ms
Slecl 1 - Specl 2 Normalized
7.087 m In. Scan: 11+5 Chan: 1 lon: 37 us R IC: 1023++398.12 + m In. Scan: 1258 Chan: 1 lon: +6 us R IC: 8322250
7.087 m In. Scan: 11+5 Chan: 1 Ion: 37 us R IC: 1023++39
8.12 + m In. Scan: 1258 Chan: 1 Ion: +6 us R IC: 8322250
file + 886 msions: 131 all
file + 886 msions: 1+6 all
1522_book.fm Page 210 Thursday, November 13, 2003 9:58 AM
© 2004 by CRC Press LLC
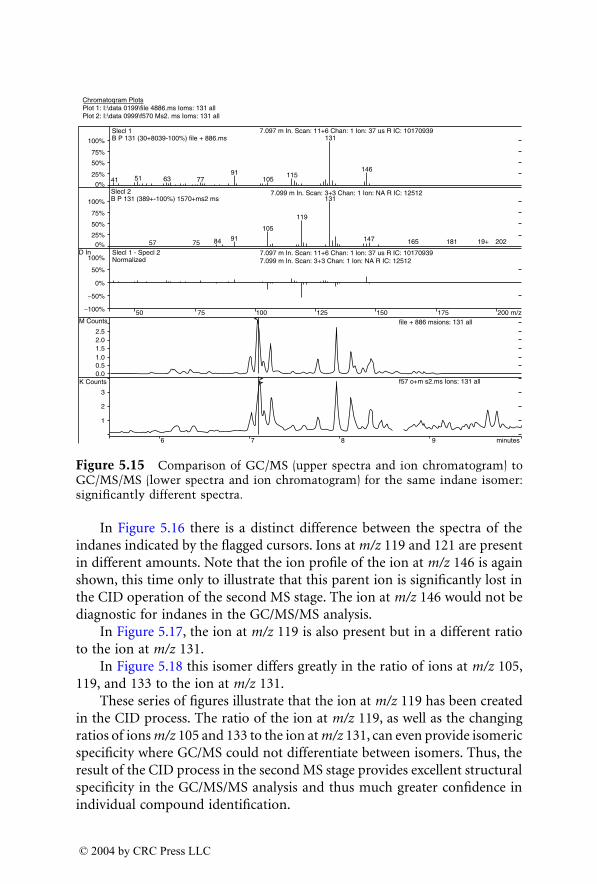
In Figure 5.16 there is a distinct difference between the spectra of theindanes indicated by the flagged cursors. Ions at m/z 119 and 121 are presentin different amounts. Note that the ion profile of the ion at m/z 146 is againshown, this time only to illustrate that this parent ion is significantly lost inthe CID operation of the second MS stage. The ion at m/z 146 would not bediagnostic for indanes in the GC/MS/MS analysis.
In Figure 5.17, the ion at m/z 119 is also present but in a different ratioto the ion at m/z 131.
In Figure 5.18 this isomer differs greatly in the ratio of ions at m/z 105,119, and 133 to the ion at m/z 131.
These series of figures illustrate that the ion at m/z 119 has been createdin the CID process. The ratio of the ion at m/z 119, as well as the changingratios of ions m/z 105 and 133 to the ion at m/z 131, can even provide isomericspecificity where GC/MS could not differentiate between isomers. Thus, theresult of the CID process in the second MS stage provides excellent structuralspecificity in the GC/MS/MS analysis and thus much greater confidence inindividual compound identification.
Figure 5.15 Comparison of GC/MS (upper spectra and ion chromatogram) toGC/MS/MS (lower spectra and ion chromatogram) for the same indane isomer:significantly different spectra.
2
3
0.00.51.01.52.02.5
−100%
−50%
0%
50%
100%
0%25%
50%
75%
100%
0%
25%
50%
75%
100%
41
57
50
6 7 8 9 minutes
75 100 125 150 175 200 m/z
75 84 91
105
119
131
147 165 181 19+ 202
51 63 7791
105115
131
146
D In
M Counts
K Counts
1
Slecl 1 B P 131 (30+8039-100%) file + 886.ms
Chromatoqram PlotsPlot 1: I:\data 0199\file 4886.ms Ioms: 131 allPlot 2: I:\data 0999\f570 Ms2. ms Ioms: 131 all
Slecl 2 B P 131 (389+-100%) 1570+ms2 ms
Slecl 1 - Specl 2 Normalized
7.097 m In. Scan: 11+6 Chan: 1 Ion: 37 us R IC: 10170939
7.099 m In. Scan: 3+3 Chan: 1 Ion: NA R IC: 12512
7.097 m In. Scan: 11+6 Chan: 1 lon: 37 us R IC: 101709397.099 m In. Scan: 3+3 Chan: 1 lon: NA R IC: 12512
file + 886 msions: 131 all
f57 o+m s2.ms Ions: 131 all
1522_book.fm Page 211 Thursday, November 13, 2003 9:58 AM
© 2004 by CRC Press LLC
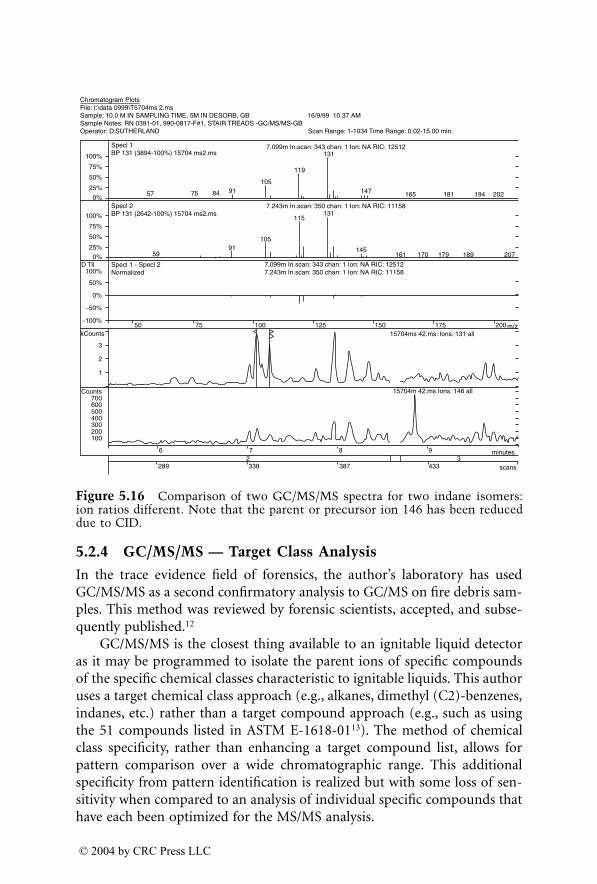
5.2.4 GC/MS/MS — Target Class Analysis
In the trace evidence field of forensics, the author’s laboratory has usedGC/MS/MS as a second confirmatory analysis to GC/MS on fire debris sam-ples. This method was reviewed by forensic scientists, accepted, and subse-quently published.12
GC/MS/MS is the closest thing available to an ignitable liquid detectoras it may be programmed to isolate the parent ions of specific compoundsof the specific chemical classes characteristic to ignitable liquids. This authoruses a target chemical class approach (e.g., alkanes, dimethyl (C2)-benzenes,indanes, etc.) rather than a target compound approach (e.g., such as usingthe 51 compounds listed in ASTM E-1618-0113). The method of chemicalclass specificity, rather than enhancing a target compound list, allows forpattern comparison over a wide chromatographic range. This additionalspecificity from pattern identification is realized but with some loss of sen-sitivity when compared to an analysis of individual specific compounds thathave each been optimized for the MS/MS analysis.
Figure 5.16 Comparison of two GC/MS/MS spectra for two indane isomers:ion ratios different. Note that the parent or precursor ion 146 has been reduceddue to CID.
289 338 387 433 scans
Chromatogram PlotsFile: I:\data 0999\T5704ms 2.msSample: 10.0 M IN SAMPLING TIME, 5M IN DESORB, GB 16/9/99 10.37 AMSample Notes: RN 0391-01, 990-0817-F#1, STAIR TREADS -GC/MS/MS-GBOperator: D.SUTHERLAND Scan Range: 1-1034 Time Range: 0.02-15.00 min.
7.099m In.scan: 343 chan: 1 Ion: NA RIC: 12512
7.243m In.scan: 350 chan: 1 Ion: NA RIC: 11158
7.099m In.scan: 343 chan: 1 Ion: NA RIC: 125127.243m In.scan: 350 chan: 1 Ion: NA RIC: 11158
minutes
15704m 42.ms Ions: 146 all
15704ms 42.ms: Ions: 131 all
326 7 8 9
Counts
100200300400500600700
kCounts
1
2
3
D Tll
-100%
-50%
0%
50%
100%
25%
50%
75%
100%
0%
25%
0%
50%
75%
100%
Specl 1BP 131 (3894-100%) 15704 ms2.ms
Specl 2BP 131 (2642-100%) 15704 ms2.ms
Specl 1 - Specl 2Normalized
50 75 100 125 150 175 200 m/z
9159
105
115131
145161 170 179 189 207
147 165 181 194 202
131
105
119
9175 8457
1522_book.fm Page 212 Thursday, November 13, 2003 9:58 AM
© 2004 by CRC Press LLC
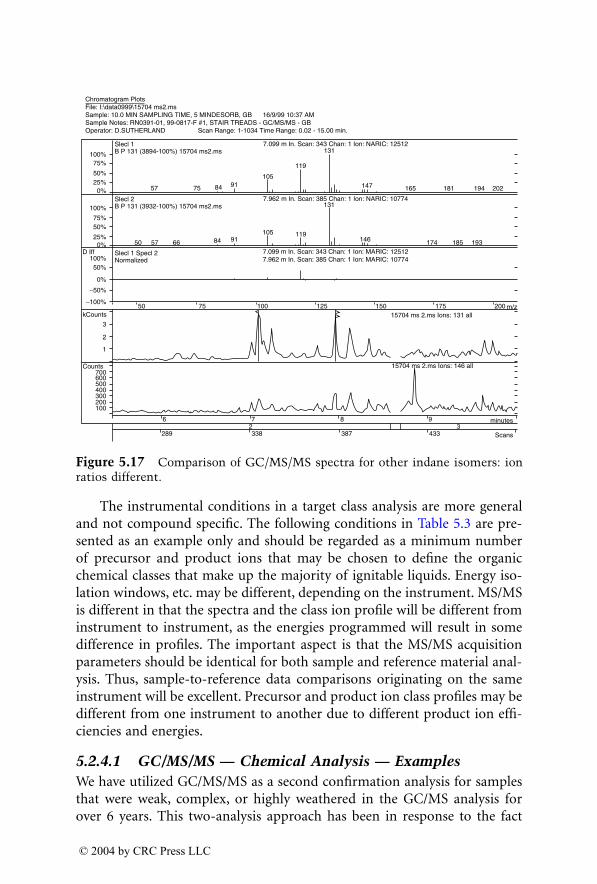
The instrumental conditions in a target class analysis are more generaland not compound specific. The following conditions in Table 5.3 are pre-sented as an example only and should be regarded as a minimum numberof precursor and product ions that may be chosen to define the organicchemical classes that make up the majority of ignitable liquids. Energy iso-lation windows, etc. may be different, depending on the instrument. MS/MSis different in that the spectra and the class ion profile will be different frominstrument to instrument, as the energies programmed will result in somedifference in profiles. The important aspect is that the MS/MS acquisitionparameters should be identical for both sample and reference material anal-ysis. Thus, sample-to-reference data comparisons originating on the sameinstrument will be excellent. Precursor and product ion class profiles may bedifferent from one instrument to another due to different product ion effi-ciencies and energies.
5.2.4.1 GC/MS/MS — Chemical Analysis — ExamplesWe have utilized GC/MS/MS as a second confirmation analysis for samplesthat were weak, complex, or highly weathered in the GC/MS analysis forover 6 years. This two-analysis approach has been in response to the fact
Figure 5.17 Comparison of GC/MS/MS spectra for other indane isomers: ionratios different.
kCounts
D Iff
Counts
100
6
289 338 387 433
72 3
8 9 minutes
Scans
200300400500600700
1
2
3
50 75 100 125 150 175 200 m/z−100%
−50%
50%100%
0% 50
57 75 84 91105
119
1317.099 m In. Scan: 343 Chan: 1 Ion: NARIC: 12512
7.962 m In. Scan: 385 Chan: 1 Ion: NARIC: 10774
7.099 m In. Scan: 343 Chan: 1 Ion: MARIC: 125127.962 m In. Scan: 385 Chan: 1 Ion: MARIC: 10774
15704 ms 2.ms Ions: 131 all
15704 ms 2.ms Ions: 146 all
147 165 181 194 202
57 66 84 91105 119
131
146 174 185 19325%
50%75%
100%
0%25%50%
75%100%
0%
Slecl 1 B P 131 (3894-100%) 15704 ms2.ms
Chromatogram PlotsFile: I:\data0999\15704 ms2.msSample: 10.0 MIN SAMPLING TIME, 5 MINDESORB, GB 16/9/99 10:37 AMSample Notes: RN0391-01, 99-0817-F #1, STAIR TREADS - GC/MS/MS - GBOperator: D.SUTHERLAND Scan Range: 1-1034 Time Range: 0.02 - 15.00 min.
Slecl 2 B P 131 (3932-100%) 15704 ms2.ms
Slecl 1 Specl 2 Normalized
1522_book.fm Page 213 Thursday, November 13, 2003 9:58 AM
© 2004 by CRC Press LLC
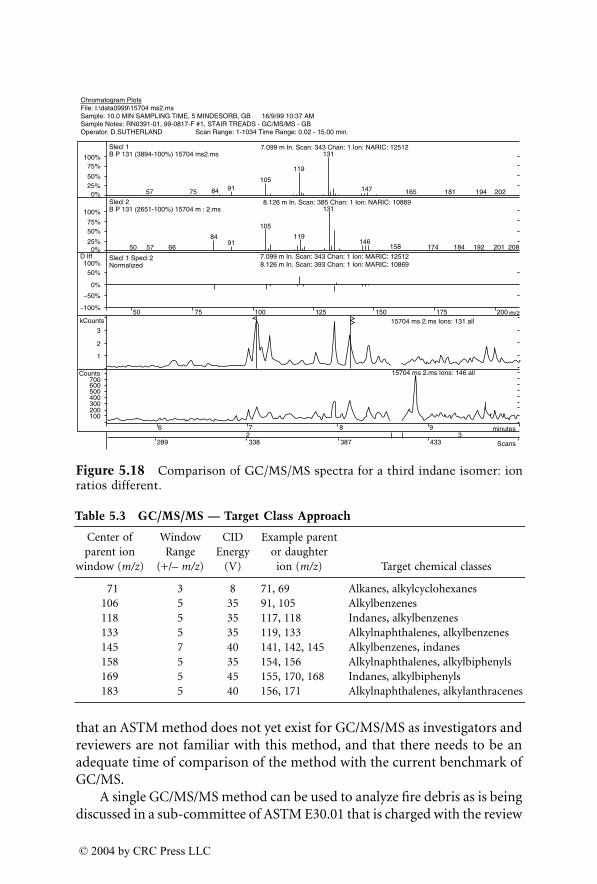
that an ASTM method does not yet exist for GC/MS/MS as investigators andreviewers are not familiar with this method, and that there needs to be anadequate time of comparison of the method with the current benchmark ofGC/MS.
A single GC/MS/MS method can be used to analyze fire debris as is beingdiscussed in a sub-committee of ASTM E30.01 that is charged with the review
Figure 5.18 Comparison of GC/MS/MS spectra for a third indane isomer: ionratios different.
Table 5.3 GC/MS/MS — Target Class Approach
Center ofparent ion
window (m/z)
WindowRange
(+/– m/z)
CIDEnergy
(V)
Example parentor daughterion (m/z) Target chemical classes
71 3 8 71, 69 Alkanes, alkylcyclohexanes106 5 35 91, 105 Alkylbenzenes118 5 35 117, 118 Indanes, alkylbenzenes133 5 35 119, 133 Alkylnaphthalenes, alkylbenzenes145 7 40 141, 142, 145 Alkylbenzenes, indanes158 5 35 154, 156 Alkylnaphthalenes, alkylbiphenyls169 5 45 155, 170, 168 Indanes, alkylbiphenyls183 5 40 156, 171 Alkylnaphthalenes, alkylanthracenes
kCounts
D Iff
Counts
100
6
289 338 387 433
72 3
8 9 minutes
Scans
200300400500600700
1
2
3
50 75 100 125 150 175 200 m/z−100%
−50%
50%100%
0% 50
57 75 84 91105
119
1317.099 m In. Scan: 343 Chan: 1 Ion: NARIC: 12512
8.126 m In. Scan: 385 Chan: 1 Ion: NARIC: 10869
7.099 m In. Scan: 343 Chan: 1 Ion: MARIC: 125128.126 m In. Scan: 393 Chan: 1 Ion: MARIC: 10869
15704 ms 2.ms Ions: 131 all
15704 ms 2.ms Ions: 146 all
147 165 181 194 202
57 66
8491
105
119
131
146158 174 184 192 201 208
25%
50%75%
100%
0%25%50%
75%100%
0%
Slecl 1 B P 131 (3894-100%) 15704 ms2.ms
Slecl 2 B P 131 (2651-100%) 15704 m : 2.ms
Slecl 1 Specl 2 Normalized
Chromatogram PlotsFile: I:\data0999\15704 ms2.msSample: 10.0 MIN SAMPLING TIME, 5 MINDESORB, GB 16/9/99 10:37 AMSample Notes: RN0391-01, 99-0817-F #1, STAIR TREADS - GC/MS/MS - GBOperator: D.SUTHERLAND Scan Range: 1-1034 Time Range: 0.02 - 15.00 min.
1522_book.fm Page 214 Thursday, November 13, 2003 9:58 AM
© 2004 by CRC Press LLC
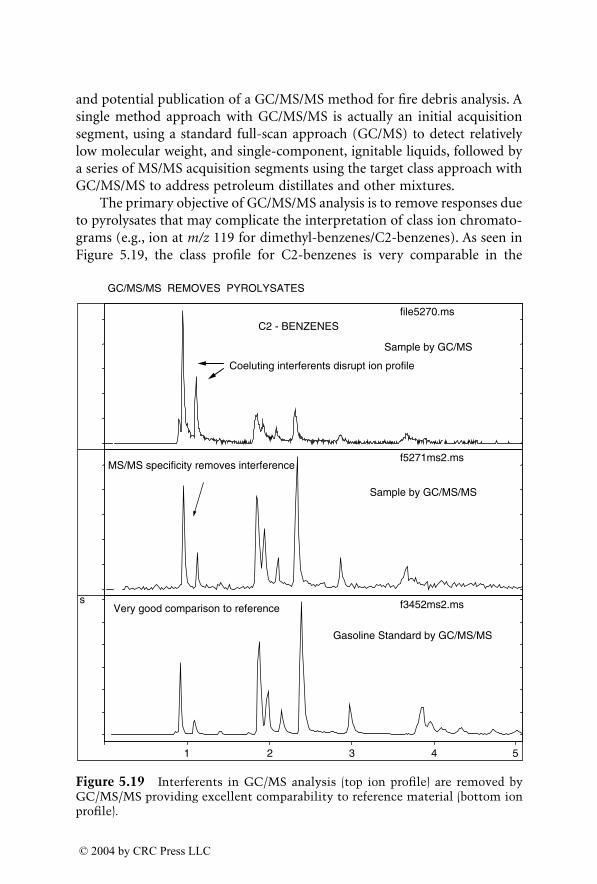
and potential publication of a GC/MS/MS method for fire debris analysis. Asingle method approach with GC/MS/MS is actually an initial acquisitionsegment, using a standard full-scan approach (GC/MS) to detect relativelylow molecular weight, and single-component, ignitable liquids, followed bya series of MS/MS acquisition segments using the target class approach withGC/MS/MS to address petroleum distillates and other mixtures.
The primary objective of GC/MS/MS analysis is to remove responses dueto pyrolysates that may complicate the interpretation of class ion chromato-grams (e.g., ion at m/z 119 for dimethyl-benzenes/C2-benzenes). As seen inFigure 5.19, the class profile for C2-benzenes is very comparable in the
Figure 5.19 Interferents in GC/MS analysis (top ion profile) are removed byGC/MS/MS providing excellent comparability to reference material (bottom ionprofile).
1 2 3 4 5
s
file5270.ms
f5271ms2.ms
f3452ms2.ms
GC/MS/MS REMOVES PYROLYSATES
C2 - BENZENES
Sample by GC/MS
Coeluting interferents disrupt ion profile
Sample by GC/MS/MS
MS/MS specificity removes interference
Gasoline Standard by GC/MS/MS
Very good comparison to reference
1522_book.fm Page 215 Thursday, November 13, 2003 9:58 AM
© 2004 by CRC Press LLC
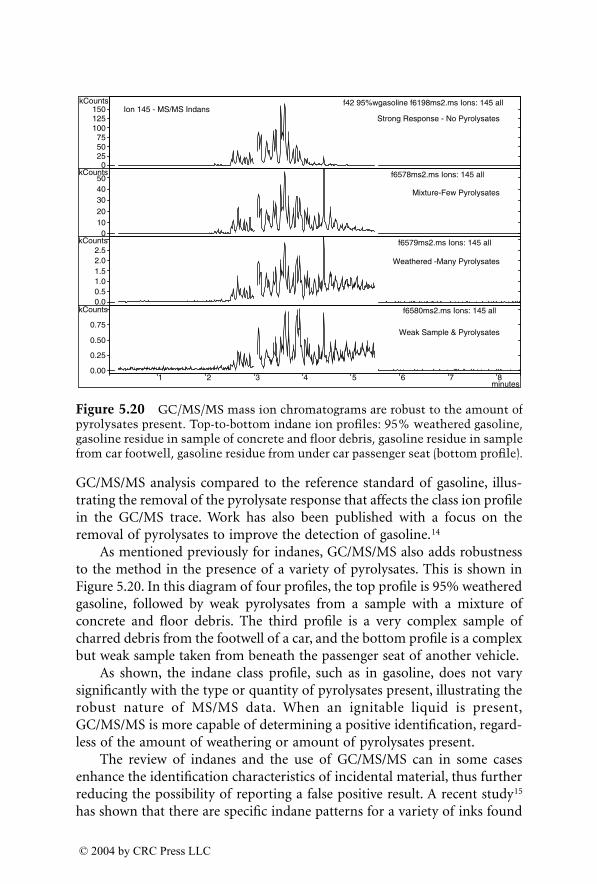
GC/MS/MS analysis compared to the reference standard of gasoline, illus-trating the removal of the pyrolysate response that affects the class ion profilein the GC/MS trace. Work has also been published with a focus on theremoval of pyrolysates to improve the detection of gasoline.14
As mentioned previously for indanes, GC/MS/MS also adds robustnessto the method in the presence of a variety of pyrolysates. This is shown inFigure 5.20. In this diagram of four profiles, the top profile is 95% weatheredgasoline, followed by weak pyrolysates from a sample with a mixture ofconcrete and floor debris. The third profile is a very complex sample ofcharred debris from the footwell of a car, and the bottom profile is a complexbut weak sample taken from beneath the passenger seat of another vehicle.
As shown, the indane class profile, such as in gasoline, does not varysignificantly with the type or quantity of pyrolysates present, illustrating therobust nature of MS/MS data. When an ignitable liquid is present,GC/MS/MS is more capable of determining a positive identification, regard-less of the amount of weathering or amount of pyrolysates present.
The review of indanes and the use of GC/MS/MS can in some casesenhance the identification characteristics of incidental material, thus furtherreducing the possibility of reporting a false positive result. A recent study15
has shown that there are specific indane patterns for a variety of inks found
Figure 5.20 GC/MS/MS mass ion chromatograms are robust to the amount ofpyrolysates present. Top-to-bottom indane ion profiles: 95% weathered gasoline,gasoline residue in sample of concrete and floor debris, gasoline residue in samplefrom car footwell, gasoline residue from under car passenger seat (bottom profile).
1 2 3 4 5 6 7 8
0255075
01020304050
2.5
Strong Response - No Pyrolysates
kCountsIon 145 - MS/MS Indans
f42 95%wgasoline f6198ms2.ms Ions: 145 all
f6578ms2.ms Ions: 145 all
Mixture-Few Pyrolysates
Weathered -Many Pyrolysates
f6579ms2.ms Ions: 145 all
f6580ms2.ms Ions: 145 all
Weak Sample & Pyrolysates
minutes
150125100
kCounts
kCounts
kCounts
2.01.51.00.50.0
0.75
0.50
0.25
0.00
1522_book.fm Page 216 Thursday, November 13, 2003 9:58 AM
© 2004 by CRC Press LLC
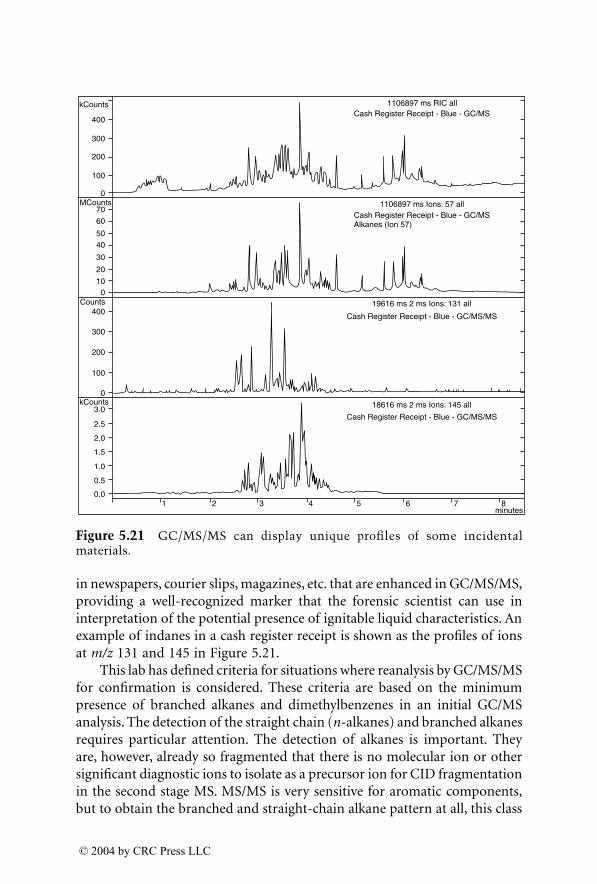
in newspapers, courier slips, magazines, etc. that are enhanced in GC/MS/MS,providing a well-recognized marker that the forensic scientist can use ininterpretation of the potential presence of ignitable liquid characteristics. Anexample of indanes in a cash register receipt is shown as the profiles of ionsat m/z 131 and 145 in Figure 5.21.
This lab has defined criteria for situations where reanalysis by GC/MS/MSfor confirmation is considered. These criteria are based on the minimumpresence of branched alkanes and dimethylbenzenes in an initial GC/MSanalysis. The detection of the straight chain (n-alkanes) and branched alkanesrequires particular attention. The detection of alkanes is important. Theyare, however, already so fragmented that there is no molecular ion or othersignificant diagnostic ions to isolate as a precursor ion for CID fragmentationin the second stage MS. MS/MS is very sensitive for aromatic components,but to obtain the branched and straight-chain alkane pattern at all, this class
Figure 5.21 GC/MS/MS can display unique profiles of some incidentalmaterials.
0.01 2 3 4 5 6 7 8
minutes
0.5
1.0
1.5
2.0
2.5
3.0
0
100
200
300
400
010
20
30
4050
60
70
0
100
200
300
400
kCountsCash Register Receipt - Blue - GC/MS
Cash Register Receipt - Blue - GC/MSAlkanes (Ion 57)
Cash Register Receipt - Blue - GC/MS/MS
Cash Register Receipt - Blue - GC/MS/MS
1106897 ms RIC all
1106897 ms Ions: 57 all
19616 ms 2 ms Ions: 131 all
18616 ms 2 ms Ions: 145 all
MCounts
Counts
kCounts
1522_book.fm Page 217 Thursday, November 13, 2003 9:58 AM
© 2004 by CRC Press LLC
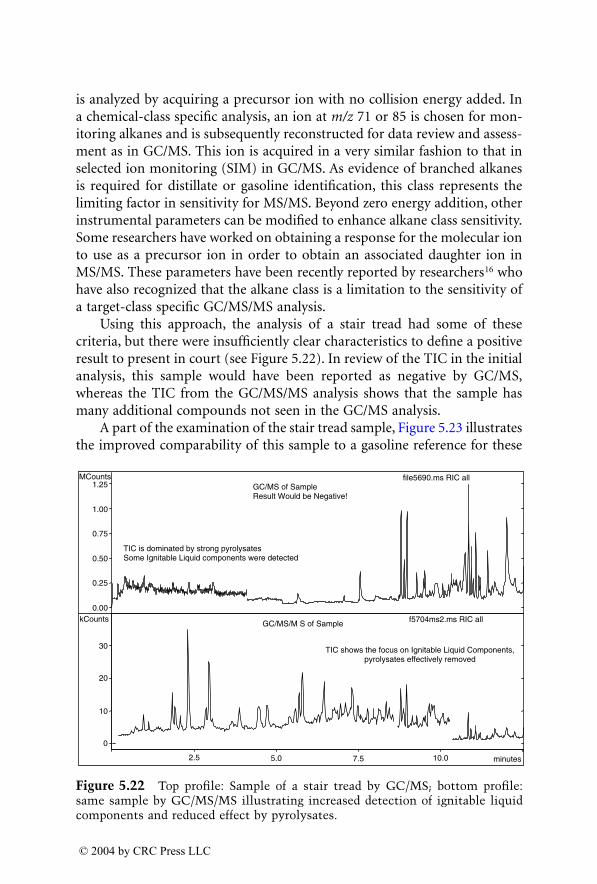
is analyzed by acquiring a precursor ion with no collision energy added. Ina chemical-class specific analysis, an ion at m/z 71 or 85 is chosen for mon-itoring alkanes and is subsequently reconstructed for data review and assess-ment as in GC/MS. This ion is acquired in a very similar fashion to that inselected ion monitoring (SIM) in GC/MS. As evidence of branched alkanesis required for distillate or gasoline identification, this class represents thelimiting factor in sensitivity for MS/MS. Beyond zero energy addition, otherinstrumental parameters can be modified to enhance alkane class sensitivity.Some researchers have worked on obtaining a response for the molecular ionto use as a precursor ion in order to obtain an associated daughter ion inMS/MS. These parameters have been recently reported by researchers16 whohave also recognized that the alkane class is a limitation to the sensitivity ofa target-class specific GC/MS/MS analysis.
Using this approach, the analysis of a stair tread had some of thesecriteria, but there were insufficiently clear characteristics to define a positiveresult to present in court (see Figure 5.22). In review of the TIC in the initialanalysis, this sample would have been reported as negative by GC/MS,whereas the TIC from the GC/MS/MS analysis shows that the sample hasmany additional compounds not seen in the GC/MS analysis.
A part of the examination of the stair tread sample, Figure 5.23 illustratesthe improved comparability of this sample to a gasoline reference for these
Figure 5.22 Top profile: Sample of a stair tread by GC/MS; bottom profile:same sample by GC/MS/MS illustrating increased detection of ignitable liquidcomponents and reduced effect by pyrolysates.
2.5 5.0 7.5 10.0
0.00
0.25
0.50
0.75
1.00
1.25
0
10
20
30
kCounts
MCounts
minutes
f5704ms2.ms RIC all
file5690.ms RIC allGC/MS of SampleResult Would be Negative!
TIC is dominated by strong pyrolysatesSome Ignitable Liquid components were detected
GC/MS/M S of Sample
TIC shows the focus on Ignitable Liquid Components,pyrolysates effectively removed
1522_book.fm Page 218 Thursday, November 13, 2003 9:58 AM
© 2004 by CRC Press LLC
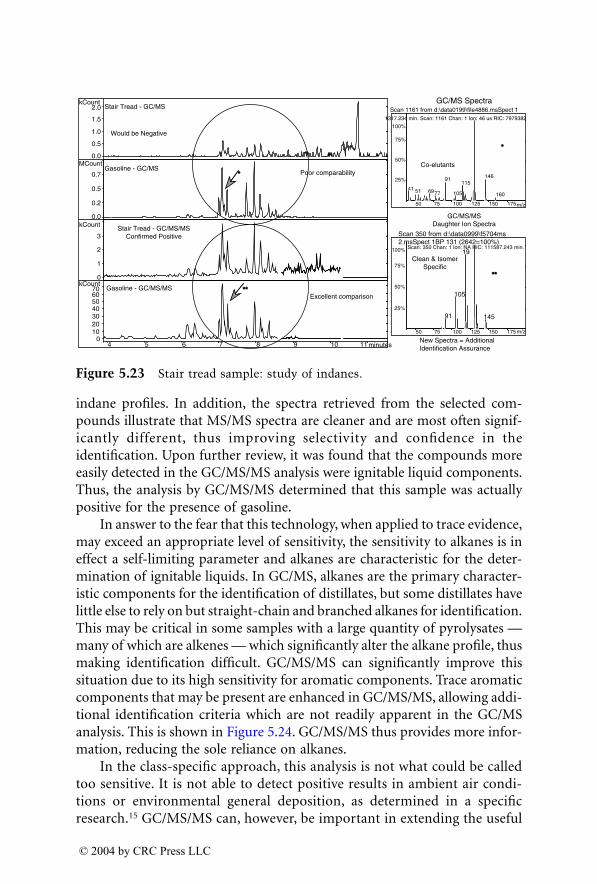
indane profiles. In addition, the spectra retrieved from the selected com-pounds illustrate that MS/MS spectra are cleaner and are most often signif-icantly different, thus improving selectivity and confidence in theidentification. Upon further review, it was found that the compounds moreeasily detected in the GC/MS/MS analysis were ignitable liquid components.Thus, the analysis by GC/MS/MS determined that this sample was actuallypositive for the presence of gasoline.
In answer to the fear that this technology, when applied to trace evidence,may exceed an appropriate level of sensitivity, the sensitivity to alkanes is ineffect a self-limiting parameter and alkanes are characteristic for the deter-mination of ignitable liquids. In GC/MS, alkanes are the primary character-istic components for the identification of distillates, but some distillates havelittle else to rely on but straight-chain and branched alkanes for identification.This may be critical in some samples with a large quantity of pyrolysates —many of which are alkenes — which significantly alter the alkane profile, thusmaking identification difficult. GC/MS/MS can significantly improve thissituation due to its high sensitivity for aromatic components. Trace aromaticcomponents that may be present are enhanced in GC/MS/MS, allowing addi-tional identification criteria which are not readily apparent in the GC/MSanalysis. This is shown in Figure 5.24. GC/MS/MS thus provides more infor-mation, reducing the sole reliance on alkanes.
In the class-specific approach, this analysis is not what could be calledtoo sensitive. It is not able to detect positive results in ambient air condi-tions or environmental general deposition, as determined in a specificresearch.15 GC/MS/MS can, however, be important in extending the useful
Figure 5.23 Stair tread sample: study of indanes.
4 5 6 7 10 minutes
0.0
0.5
1.0
1.5
2.0kCount
0.0
0.2
0.5
0.7
MCount
0
1
2
3
kCount
010203040506070
kCount
25%
50%
75%
100%
91
105
19
145
50 75 1001125 150 175
25%
50%
75%
100%
41 51 6977
91
105
115146
160
8 9 11
50 75 100 125 150 175
1
GC/MS/MSDaughter Ion Spectra
*
*
**
**
Would be Negative
GC/MS Spectra
Co-elutants
Clean & IsomerSpecific
New Spectra = AdditionalIdentification Assurance
Excellent comparison
Poor comparability
Stair Tread - GC/MS
Gasoline - GC/MS
Stair Tread - GC/MS/MSConfirmed Positive
Gasoline - GC/MS/MS
Scan 1161 from d:\data0199\file4886.msSpect 11317.234 min. Scan: 1161 Chan: 1 Ion: 46 us RIC: 7979382
m/z
m/z
Scan 350 from d:\data0999\f5704ms2.msSpect 1BP 131 (2642=100%)
Scan: 350 Chan: 1 Ion: NA RIC: 111587.243 min.
1522_book.fm Page 219 Thursday, November 13, 2003 9:58 AM
© 2004 by CRC Press LLC
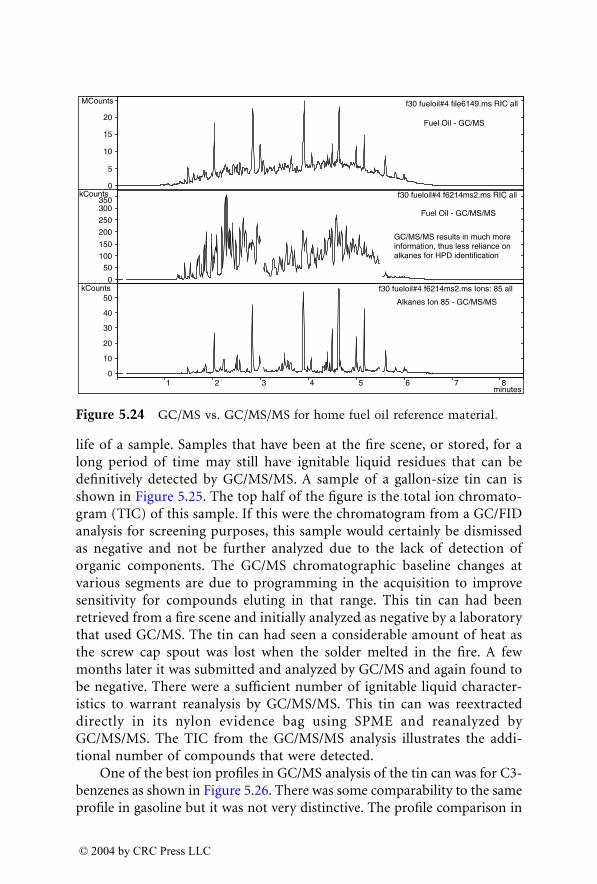
life of a sample. Samples that have been at the fire scene, or stored, for along period of time may still have ignitable liquid residues that can bedefinitively detected by GC/MS/MS. A sample of a gallon-size tin can isshown in Figure 5.25. The top half of the figure is the total ion chromato-gram (TIC) of this sample. If this were the chromatogram from a GC/FIDanalysis for screening purposes, this sample would certainly be dismissedas negative and not be further analyzed due to the lack of detection oforganic components. The GC/MS chromatographic baseline changes atvarious segments are due to programming in the acquisition to improvesensitivity for compounds eluting in that range. This tin can had beenretrieved from a fire scene and initially analyzed as negative by a laboratorythat used GC/MS. The tin can had seen a considerable amount of heat asthe screw cap spout was lost when the solder melted in the fire. A fewmonths later it was submitted and analyzed by GC/MS and again found tobe negative. There were a sufficient number of ignitable liquid character-istics to warrant reanalysis by GC/MS/MS. This tin can was reextracteddirectly in its nylon evidence bag using SPME and reanalyzed byGC/MS/MS. The TIC from the GC/MS/MS analysis illustrates the addi-tional number of compounds that were detected.
One of the best ion profiles in GC/MS analysis of the tin can was for C3-benzenes as shown in Figure 5.26. There was some comparability to the sameprofile in gasoline but it was not very distinctive. The profile comparison in
Figure 5.24 GC/MS vs. GC/MS/MS for home fuel oil reference material.
1 2 3 4 5 6 7 8
0
5
10
15
20
0
10
20
30
40
50
MCounts
kCounts
kCounts
0
50
350300
250
200
150
100
minutes
Alkanes Ion 85 - GC/MS/MS
f30 fueloil#4 f6214ms2.ms Ions: 85 all
f30 fueloil#4 f6214ms2.ms RIC all
Fuel Oil - GC/MS/MS
GC/MS/MS results in much moreinformation, thus less reliance onalkanes for HPD identification
Fuel Oil - GC/MS
f30 fueloil#4 file6149.ms RIC all
1522_book.fm Page 220 Thursday, November 13, 2003 9:58 AM
© 2004 by CRC Press LLC
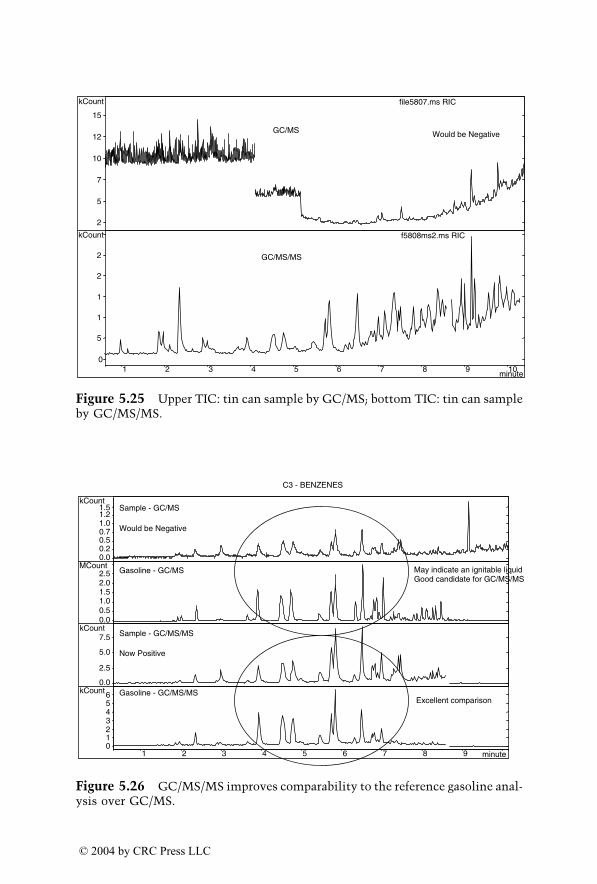
Figure 5.25 Upper TIC: tin can sample by GC/MS; bottom TIC: tin can sampleby GC/MS/MS.
Figure 5.26 GC/MS/MS improves comparability to the reference gasoline anal-ysis over GC/MS.
1 2 3 4 5 6 7 8 9 10
2
5
7
10
12
15
kCount
0
5
1
1
2
2
kCount
GC/MS
GC/MS/MS
Would be Negative
f5808ms2.ms RIC
file5807.ms RIC
minute
1 2 3 4 5 6 7 8 9 minute
0.00.20.50.71.01.21.5
kCount
0.00.51.01.52.02.5
MCount
0.0
2.5
5.0
7.5kCount
0123456kCount
Would be Negative
Now Positive
C3 - BENZENES
May indicate an ignitable liquidGood candidate for GC/MS/MS
Excellent comparisonGasoline - GC/MS/MS
Sample - GC/MS/MS
Gasoline - GC/MS
Sample - GC/MS
1522_book.fm Page 221 Thursday, November 13, 2003 9:58 AM
© 2004 by CRC Press LLC
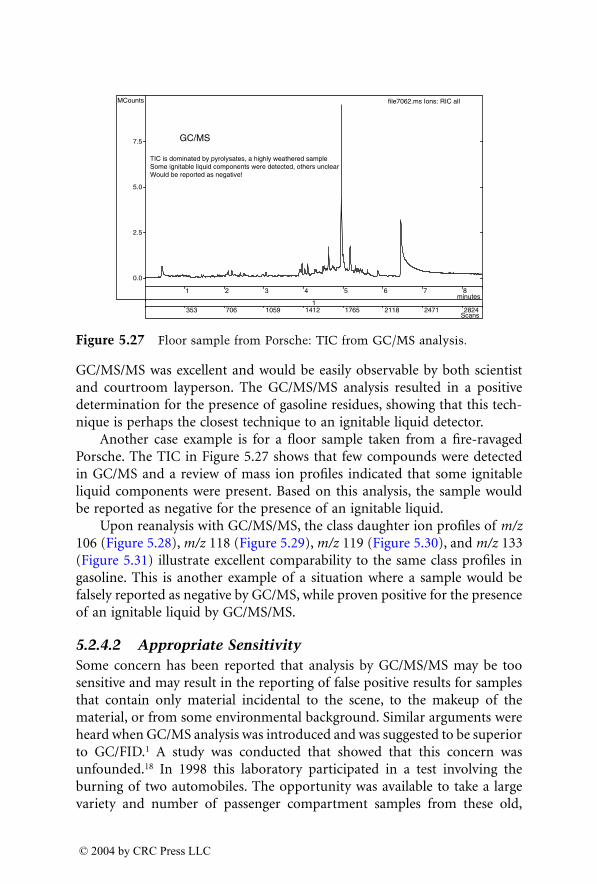
GC/MS/MS was excellent and would be easily observable by both scientistand courtroom layperson. The GC/MS/MS analysis resulted in a positivedetermination for the presence of gasoline residues, showing that this tech-nique is perhaps the closest technique to an ignitable liquid detector.
Another case example is for a floor sample taken from a fire-ravagedPorsche. The TIC in Figure 5.27 shows that few compounds were detectedin GC/MS and a review of mass ion profiles indicated that some ignitableliquid components were present. Based on this analysis, the sample wouldbe reported as negative for the presence of an ignitable liquid.
Upon reanalysis with GC/MS/MS, the class daughter ion profiles of m/z106 (Figure 5.28), m/z 118 (Figure 5.29), m/z 119 (Figure 5.30), and m/z 133(Figure 5.31) illustrate excellent comparability to the same class profiles ingasoline. This is another example of a situation where a sample would befalsely reported as negative by GC/MS, while proven positive for the presenceof an ignitable liquid by GC/MS/MS.
5.2.4.2 Appropriate SensitivitySome concern has been reported that analysis by GC/MS/MS may be toosensitive and may result in the reporting of false positive results for samplesthat contain only material incidental to the scene, to the makeup of thematerial, or from some environmental background. Similar arguments wereheard when GC/MS analysis was introduced and was suggested to be superiorto GC/FID.1 A study was conducted that showed that this concern wasunfounded.18 In 1998 this laboratory participated in a test involving theburning of two automobiles. The opportunity was available to take a largevariety and number of passenger compartment samples from these old,
Figure 5.27 Floor sample from Porsche: TIC from GC/MS analysis.
1 2 3 4 5 6 7 8
0.0
2.5
5.0
7.5
MCounts
1353 706 1059 1412 1765 2118 2471 2824
GC/MS
TIC is dominated by pyrolysates, a highly weathered sampleSome ignitable liquid components were detected, others unclearWould be reported as negative!
file7062.ms Ions: RIC all
Scans
minutes
1522_book.fm Page 222 Thursday, November 13, 2003 9:58 AM
© 2004 by CRC Press LLC

Figure 5.28 GC/MS/MS analysis of sample from Porsche: mass ion profilesfor 106.
Figure 5.29 GC/MS/MS analysis of sample from Porsche: mass ion profilesfor 118.
0.5 1.0 1.5 2.0 2.5 3.0 3.5minutes
0.00
0.25
0.50
0.75
1.00
1.25
1.50kCounts
0
5
10
15
20
kCounts
f7079ms2.ms Ions: 106 all -0.02 min offset
f6 gasoline f6196ms2.ms Ions: 106 all
Sample
Gasoline
GOOD COMPARISON
1.0 1.5 2.0 2.5 3.0 3.5 minutes
0
100
200
300
400
500
600Counts
0.0
2.5
5.0
7.5
10.0
kCounts
f7079ms2.ms Ions: 118 all -0.02 min offset
f6 gasoline f6196ms2.ms Ions: 118 all
Sample
Gasoline
Ion 118
GOOD COMPARISON
1522_book.fm Page 223 Thursday, November 13, 2003 9:58 AM
© 2004 by CRC Press LLC
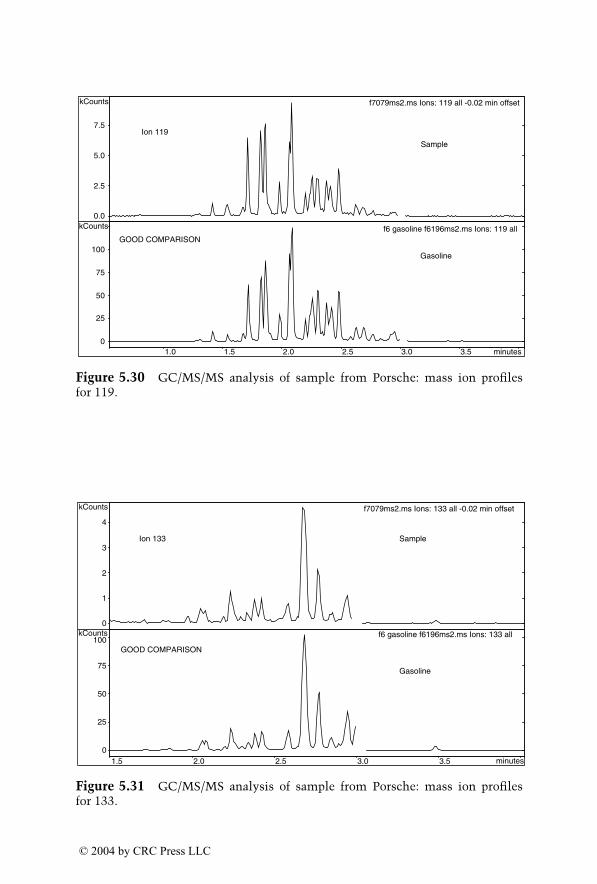
Figure 5.30 GC/MS/MS analysis of sample from Porsche: mass ion profilesfor 119.
Figure 5.31 GC/MS/MS analysis of sample from Porsche: mass ion profilesfor 133.
1.0 1.5 2.0 2.5 3.0 3.5 minutes
0.0
2.5
5.0
7.5
kCounts
0
25
50
75
100
kCounts
f7079ms2.ms Ions: 119 all -0.02 min offset
f6 gasoline f6196ms2.ms Ions: 119 all
Sample
Gasoline
Ion 119
GOOD COMPARISON
1.5 2.0 2.5 3.0 3.5 minutes
0
1
2
3
4
kCounts
0
25
50
75
100kCounts
f7079ms2.ms Ions: 133 all -0.02 min offset
f6 gasoline f6196ms2.ms Ions: 133 all
Sample
Gasoline
Ion 133
GOOD COMPARISON
1522_book.fm Page 224 Thursday, November 13, 2003 9:58 AM
© 2004 by CRC Press LLC
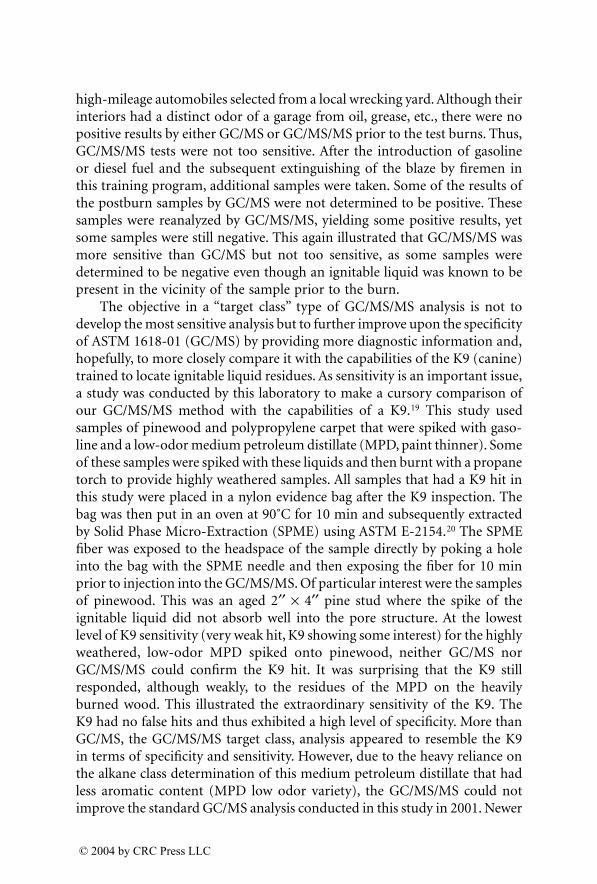
high-mileage automobiles selected from a local wrecking yard. Although theirinteriors had a distinct odor of a garage from oil, grease, etc., there were nopositive results by either GC/MS or GC/MS/MS prior to the test burns. Thus,GC/MS/MS tests were not too sensitive. After the introduction of gasolineor diesel fuel and the subsequent extinguishing of the blaze by firemen inthis training program, additional samples were taken. Some of the results ofthe postburn samples by GC/MS were not determined to be positive. Thesesamples were reanalyzed by GC/MS/MS, yielding some positive results, yetsome samples were still negative. This again illustrated that GC/MS/MS wasmore sensitive than GC/MS but not too sensitive, as some samples weredetermined to be negative even though an ignitable liquid was known to bepresent in the vicinity of the sample prior to the burn.
The objective in a “target class” type of GC/MS/MS analysis is not todevelop the most sensitive analysis but to further improve upon the specificityof ASTM 1618-01 (GC/MS) by providing more diagnostic information and,hopefully, to more closely compare it with the capabilities of the K9 (canine)trained to locate ignitable liquid residues. As sensitivity is an important issue,a study was conducted by this laboratory to make a cursory comparison ofour GC/MS/MS method with the capabilities of a K9.19 This study usedsamples of pinewood and polypropylene carpet that were spiked with gaso-line and a low-odor medium petroleum distillate (MPD, paint thinner). Someof these samples were spiked with these liquids and then burnt with a propanetorch to provide highly weathered samples. All samples that had a K9 hit inthis study were placed in a nylon evidence bag after the K9 inspection. Thebag was then put in an oven at 90˚C for 10 min and subsequently extractedby Solid Phase Micro-Extraction (SPME) using ASTM E-2154.20 The SPMEfiber was exposed to the headspace of the sample directly by poking a holeinto the bag with the SPME needle and then exposing the fiber for 10 minprior to injection into the GC/MS/MS. Of particular interest were the samplesof pinewood. This was an aged 2¢¢ ¥ 4¢¢ pine stud where the spike of theignitable liquid did not absorb well into the pore structure. At the lowestlevel of K9 sensitivity (very weak hit, K9 showing some interest) for the highlyweathered, low-odor MPD spiked onto pinewood, neither GC/MS norGC/MS/MS could confirm the K9 hit. It was surprising that the K9 stillresponded, although weakly, to the residues of the MPD on the heavilyburned wood. This illustrated the extraordinary sensitivity of the K9. TheK9 had no false hits and thus exhibited a high level of specificity. More thanGC/MS, the GC/MS/MS target class, analysis appeared to resemble the K9in terms of specificity and sensitivity. However, due to the heavy reliance onthe alkane class determination of this medium petroleum distillate that hadless aromatic content (MPD low odor variety), the GC/MS/MS could notimprove the standard GC/MS analysis conducted in this study in 2001. Newer
1522_book.fm Page 225 Thursday, November 13, 2003 9:58 AM
© 2004 by CRC Press LLC
instrument parameters determined since that time may provide furtherimprovement. Thus, neither GC/MS nor GC/MS/MS could confirm some ofthe weak K9 hits when a low odor medium petroleum distillate was present.
Although conducted with only one laboratory and one K9, this studyserved as a check on where this method resides in sensitivity relative to theK9. In this study, the GC/MS/MS method was easily able to detect ignitableliquids that have a significant number of aromatic components, as expected,and resulted in an improvement in the confirmation of the K9 hits over theanalysis conducted by GC/MS analysis on the same instrument.
Thus, GC/MS/MS is not too sensitive and does not appear to exceed thecapabilities of the K9. The moderate increase in sensitivity by GC/MS/MS isdue to the increase in specificity only and not in signal strength.
5.2.4.3 DisadvantagesThe disadvantage of the target class approach is the somewhat lower sensi-tivity than the target compound approach for one specific compound, as theMS/MS acquisition parameters are more general and not optimized for anyspecific compound. The analysis by MS/MS also does not allow for the reviewof the general quantity or type of pyrolysates that may be present in thesample. These pyrolysates have been purposefully filtered out as we programthe MS/MS parameters to focus as much on ignitable liquids as possible.Similarly, an analysis by MS/MS does not allow the study of any unusualmatrix components that may be of interest or be incidental. As sometimesis the case, the matrix profile may be useful to link samples to a locationwithin a case (e.g., a case file may contain samples 2, 3, and 6 that are allcarpet as found in the living room, and samples 1, 4, and 5 are wood fromthe floor joist in the basement). This link can be shown by a study of thepolypropylene or wood pyrolysates to confirm the link of the sample to theresults in the GC/MS analysis.
5.2.4.4 BenefitsThe primary objective is the detection and identification of ignitable liquids.The advantage of a target class GC/MS/MS analysis is the greater specificityrealized by mixture identification through comparison by pattern recognitionof the reconstructed daughter ion chromatograms. GC/MS/MS is still moresensitive than GC/MS and it has been proven in one study that GC/MS/MScan lengthen the period of time that a residue of an ignitable liquid can beidentified by 2 additional weeks.15 The more sensitive and specific analysisby GC/MS/MS may also help the investigator. In theory, samples that containan ignitable liquid can still be proven positive at a greater distance from theinitial location of an ignitable liquid as it can detect more minute residuesof ignitable liquids and thus be more forgiving as to the sample location. It
1522_book.fm Page 226 Thursday, November 13, 2003 9:58 AM
© 2004 by CRC Press LLC
is also important in the analysis of samples from hot or arid climates as ithas more capability of detecting an ignitable liquid, if present, in very highlyweathered samples.
As discussed previously,19 the target class analysis appeared to moreclosely resemble the K9 in terms of specificity and sensitivity, and it has beenshown that GC/MS/MS is not overly sensitive for the purposes of this testfor ignitable liquids.
GC/MS/MS can significantly remove pyrolysates and thus make ion chro-matograms that are representative of a particular class clearer and morecomparable to reference analyses than with GC/MS data. GC/MS/MS resultswill easily enable a very clear decision as to whether an ignitable liquid ispresent or absent.
GC/MS/MS also improves the specificity and confidence in the result byproviding new chromatographic patterns, with new daughter ion chromato-grams and more aromatic information, which lessens the dependence on thealkanes for the identification of petroleum distillates. This is a significantbenefit as alkanes are the class that is most susceptible to significant weath-ering. Thus, GC/MS/MS improves the analysis for highly weathered samplesby providing additional characteristics for identification.
GC/MS/MS in the target class approach provides an appropriateimprovement in sensitivity while adding robustness to the method. Thissensitivity improvement is more probable at confirming K9 hits than GC/MSand, up to this point, has not been observed as going beyond the sensitivityof the K9. GC/MS/MS is the closest method to an ignitable liquid detectorthat is both sensitive and specific and provides identity information of theresidue.
5.2.5 Conclusion
In 1999, this laboratory has shown that in its case analyses by GC/MS/MS,approximately 10% of the samples that were reported as negative by GC/MSwere actually positive after GC/MS/MS analysis.21 An average of 30% of thesubmitted samples of carpet, wood, soil, and charred debris were foundpositive by GC/MS. As a rule, GC/MS/MS is invaluable when a sampleexhibits some ignitable liquid characteristics in a GC/MS analysis. This isespecially true when the interpretation shows that there are insufficient iden-tification characteristics, which is due to incomplete compound class pat-terns, heavy sample weathering, weak samples (due to low quantity), andcomplex samples due to a large quantity of pyrolysates. The samples thatshow some ignitable liquid characteristics were reanalyzed by GC/MS/MS.Of these samples that would have been reported as negative, 28% were foundto be positive by GC/MS/MS. Reanalysis of samples by GC/MS/MS has veryoften provided the additional information to confirm the presence of an
1522_book.fm Page 227 Thursday, November 13, 2003 9:58 AM
© 2004 by CRC Press LLC
ignitable liquid. Thus, GC/MS/MS has shown that some GC/MS results canbe falsely reported as negative.
In general, scientists must gravitate towards more specific methods thatprovide more confident results that will represent the true contents of forensicsamples. There is a concern among forensic scientists that any improvementin sensitivity will result in positive results for nearly all samples and will weighheavily on the legal process, thus automatically invoking the word “arson.”Due to the specificity of GC/MS/MS the apprehension of finding an ignitableliquid in virtually every sample due to an increase in sensitivity is unfounded.
In court, the forensic scientist can only attest to the contents of thesample, analyzed to his/her best capabilities. However, the forensic scientistshould also be responsible for helping investigators, lawyers, and the courtby making them aware of potential incidental sources, and thus helpingensure that the data is reviewed appropriately in litigation proceedings. As aminimum, ASTM recommends that a report should state in a footnote themeaning of negative results such as “A negative result does not preclude thepossibility that an ignitable liquid is present in the sample at a concentrationlower than the method can detect, or that an ignitable liquid may have beenpresent in the sample at some point in time.” Perhaps forensic scientistsshould also be incorporating a statement on positive results such as “Positiveresults should also be reviewed in terms of the sampling location and historyto ensure that any incidental material or external sources that may be respon-sible for the positive result are reviewed and assessed.”
Some comments regarding a new, more sensitive technique revolvearound the danger of identifying an ignitable liquid that may be present dueto environmental conditions or some previous incidental material. This con-cern has been addressed.15,22–24 Of course, the positive identification of asample with a minute quantity of gasoline from an area of a garage must becarefully reviewed by the investigator vs. the presence of the same substancein a sample of pillow foam from a couch in the living room, if we use a housefor an example. The forensic scientist is responsible for interpreting thesample and not the circumstances. However, it would be prudent to make astatement to ensure that the investigator will review information regardingthe location and history of the sample.
GC/MS/MS is a proven technique and has previously been presented incourt. Specifically, the analysis of fire debris samples by GC/MS andGC/MS/MS has been used in a case and was described in a testimony of afirst-degree murder trial in January of 2002 in Ontario, Canada.
The advantages of GC/MS/MS significantly outweigh any disadvantages,and it is a most valuable tool for helping the forensic scientist interpretcomplex samples such as ignitable liquids in arson cases.
1522_book.fm Page 228 Thursday, November 13, 2003 9:58 AM
© 2004 by CRC Press LLC
References
1. Bertsch, W., Holzer, G., and Sellers, C.S., Chemical Analysis for the ArsonInvestigator and Attorney, Huthig, Heidelberg, Germany, 1993.
2. Jackowski, J.P., Incidence of ignitable liquid residues in fire debris as deter-mined by a sensitive and comprehensive analytical scheme, J. Forensic Sci.,42, 828, 1997.
3. Fleisher, K., Harrison, S.J., Bukowski N., and Blackburn M., Rapid identifi-cation of accelerants in arson analysis using GC/TOF-MS and automatedchromatography matching, Thermo-Finnigan Application Note AN 2004T.
4. Frysinger, G.S. and Gaines, R., CT Forensic analysis of ignitable liquids infire debris with comprehensive 2D GC/MS, Presented at the Pittsburgh Con-ference, Orlando, FL, 2003.
5. March, R.E., Quadrupole ion trap mass spectrometer, in Encyclopedia ofAnalytical Chemistry, John Wiley & Sons, New York, 2000, p. 11848.
6. Collins, M., Easson, J., Hansen, G., Hodda, A. and Lewis, K., GC-MS-MSconfirmation of unusually high D9-tetrahydrocannabinol levels in two post-mortem blood samples, J. Anal. Toxicol., 21, 538, 1997.
7. Baumgartner, W.A., Cheng, C.-C., Donahue, T.D., Hayes, G.F., Hill, V.A. andScholtz, H., Forensic drug testing by mass spectrometric analysis of hair, inForensic Applications of Mass Spectrometry, Yinon, J., Ed., CRC Press, BocaRaton, FL, 1995.
8. Butler, J., Minimize matrix interferences in the analysis of residual pesticidesin fruits and vegetables using PPINICI and GC-MS/MS with a large volumeinjection, Presented at the Pittsburg Conference, Orlando, FL, 2003.
9. Fetterolf, D.D., Detection and identification of explosives by mass spectrom-eter, in Forensic Applications of Mass Spectrometry, Yinon, J., Ed., CRC Press,Boca Raton, FL, 1995.
10. Sheppard, R.L., Henion, J., Determination of EDTA in blood, Anal. Chem.,69, 477A, 1997.
11. Munoz-Guerra, J., Carreras, D., Soriano, C., Rodriguez, C., Rodriguez, A.F.,Cortes, R., GC/MS/MS Analysis for anabolic steroids in urine for athletictesting, Varian Application Note No. 60.
12. Sutherland, D., The analysis of fire debris by GC/MS/MS, J. Canad. Soc.Forensic Sci., 30, 185, 1997.
13. ASTM International, E-1618-01 Standard Test Method for Ignitable LiquidResidues in Extracts from Fire Debris Samples by Gas Chromatography–MassSpectrometry, 2001.
14. de Vos, B.J., Froneman, M., Rohwer, E., Sutherland, D., Detection of petrol(gasoline) in fire debris by gas chromatography/mass spectrometry/massspectrometry, (GC/MS/MS), J. Forensic Sci., 47, 736, 2002.
1522_book.fm Page 229 Thursday, November 13, 2003 9:58 AM
© 2004 by CRC Press LLC
15. Sutherland, D. and Penderell, K., GC/MS/MS — An important developmentin fire debris analysis, Fire and Arson Investigator, International Associationof Arson Investigators, October 2000, p. 21.
16. Sittidech, M., Optimization of ion trap GC/MS and GC/MS/MS for theanalysis of potential accelerants in fire debris, Presented at the PittsburgConference, Orlando, FL, 2003.
17. Sutherland, D. and Penderell, K., Exploring the limitations of GC/MS andGC/MS/MS: The potential interference of printed inks in fire debris, J. Foren-sic Sci. (in review).
18. Sutherland, D. and Byers, K., Vehicle test burns, Fire and Arson Investigator,International Association of Arson Investigators, 1998. p. 23.
19. Sutherland, D. and Lam, S., Fire debris analysis research: limitations andcomparability of laboratory analysis using GC/MS and GC/MS/MS and theK9, J. Canad. Soc. Forensic Sci. (in review).
20. ASTM International, E2154-01 Standard Practice for Separation and Con-centration of Ignitable Liquid Residues from Fire Debris Samples by PassiveHeadspace Concentration with Solid Phase Microextraction (SPME), 2001.
21. Sutherland, D. and Hamilton, A., Fire debris analysis statistics and the use ofthe latest analytical tools, J. Canad. Assoc. of Fire Investigators, September1999, p. 11.
22. Sutherland, D., Fire debris analysis by GC/MS/MS: The latest in specificityand sensitivity, Presented at The Canadian Society of Forensic Science (44thAGM), September 1997, Regina, Saskatchewan, Canada.
23. Sutherland, D., Byers, K. and Sutherland, A., Fire debris analysis results fromthe IAAI Fire Investigation and Arson Task Force Seminar, Guelph (June 98),Simcoe (June 99), International Association of Arson Investigators, OntarioChapter, Fall Issue 1999.
24. Sutherland, D., The latest in fire debris analysis — GC/MS/MS, Presented atthe FRENZY Conference (Forensic Sciences and Crime Scene Technology),Washington, D.C., 2000.
1522_book.fm Page 230 Thursday, November 13, 2003 9:58 AM
© 2004 by CRC Press LLC
6
Analysis of Explosives by LC/MS
JEHUDA YINON
Contents
6.1 Introduction6.2 Electrospray Ionization (ESI) and Atmospheric Pressure
Chemical Ionization (APCI6.2.1 Principle of Operation of ESI 6.2.2 Principle of Operation of APCI6.2.3 Comparison between ESI and APCI
6.3 Analysis of Explosives6.3.1 Nitroaromatic Explosives and Their Degradation
Products 6.3.2 Nitramine Explosives6.3.3 Nitrate Ester Explosives6.3.4 Various Explosives and Oxidizers 6.3.5 Military, Commercial, and Other Explosive Mixtures
6.4 Summary and Future Directions References
6.1 Introduction
One of the challenging areas in the field of explosives is the identification ofpostblast explosive residues. The purpose of such analyses is twofold:
1. To serve as evidence in court. Although there is usually no need toprove that an explosion has occurred, it is necessary to explain theexplosion, which includes the reconstruction of the explosive deviceand the identification of explosive or explosives used.
2. To help the investigation in connecting a suspect to the scene of theexplosion. In addition to identifying the type of explosive, character-ization of the explosive, such as country of origin and manufacturer,would be of great help to the investigation.
1522_book.fm Page 231 Thursday, November 13, 2003 9:58 AM
© 2004 by CRC Press LLC
The analysis of postexplosion residues is very difficult because it is basedon finding and identifying residues from the original explosive, rather thanproducts formed during the explosion. The amount of residual unexplodedexplosive is usually very small and has to be isolated from large amounts ofdebris which could cover wide areas. A scientifically sound method has notyet been established to determine the debris on which there is a greaterprobability to find residual explosives.
Several comprehensive schemes for screening of the debris, clean-upprocedures, extraction, and analysis have been described.
1
The combinationof the separation power of high performance liquid chromatography (HPLC)with the identification capability of mass spectrometry (MS) has resulted ina powerful analytical system, LC/MS, which is being widely used in a largevariety of analytical applications,
2–4
including forensic.
5–7
A great deal of progress has been made in the technology of LC/MS duringthe last 20 years. The first LC/MS systems used for the analysis of explosiveswere the direct liquid introduction (DLI)-LC/MS systems,
8,9
which had a lowsensitivity because of effluent splitting. Thermospray (TS)-LC/MS interfacewas the first to combine interface and ionization capabilities, in which ionsin the gas phase were produced directly from solution without the need ofan additional means of ionization.
10
Analysis of explosives by TS-LC/MS witha quadrupole mass spectrometer was found to have best sensitivity in thenegative-ion mode with filament on.
11
Detection limits, in the full scan mode,were 200 pg for TNT, and 1 ng for RDX, HMX, and PETN. Results obtainedwith a triple-stage quadrupole mass spectrometer, in the single-ion monitor-ing (SIM) mode, yielded a detection limit of 2.5 pg for PETN.
12
Particle beam (PB)-LC/MS, a solute transport-enrichment technique,was also used for the analysis of explosives.
13
The mode of ionization wasnegative-ion chemical ionization, with methane as moderator gas, at a pres-sure of 1.8 Torr in the ion source. Detection limits in the SIM mode were 60pg for NG, 120 pg for TNT, and 200 pg for RDX and PETN.
The main drawbacks of thermospray and particle beam ionization foranalysis of explosives were the difficulty in reproducing results and in usingthese techniques on a routine basis.
6.2 Electrospray Ionization (ESI) and Atmospheric Pressure
Chemical Ionization (APCI)
6.2.1 Principle of Operation of ESI
Electrospray ionization (ESI) is a soft ionization technique that allows theanalysis of large biomolecules, as well as a wide range of smaller polar mol-ecules.
14–17
For molecules up to 1000 Da in molecular mass, either an [M +
1522_book.fm Page 232 Thursday, November 13, 2003 9:58 AM
© 2004 by CRC Press LLC
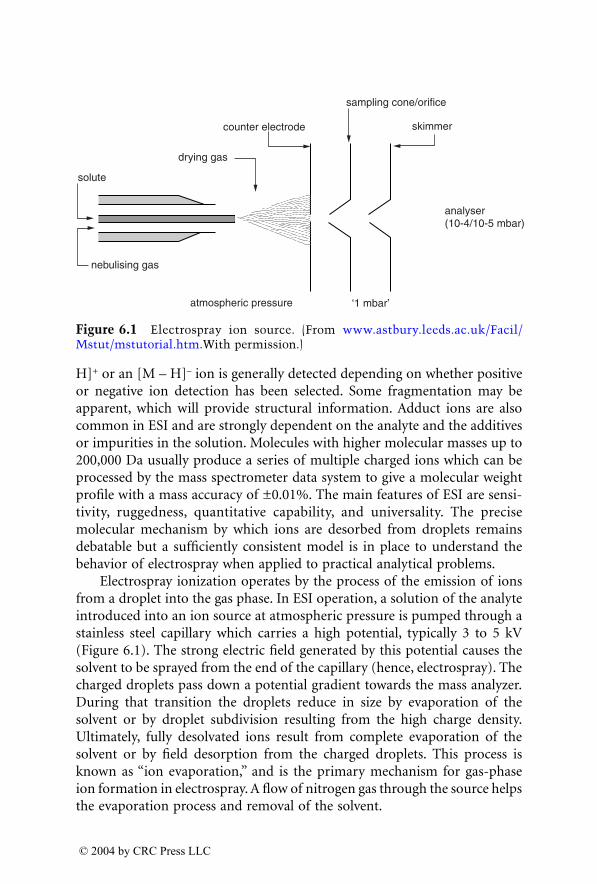
H]
+
or an [M – H]
–
ion is generally detected depending on whether positiveor negative ion detection has been selected. Some fragmentation may beapparent, which will provide structural information. Adduct ions are alsocommon in ESI and are strongly dependent on the analyte and the additivesor impurities in the solution. Molecules with higher molecular masses up to200,000 Da usually produce a series of multiple charged ions which can beprocessed by the mass spectrometer data system to give a molecular weightprofile with a mass accuracy of ±0.01%. The main features of ESI are sensi-tivity, ruggedness, quantitative capability, and universality. The precisemolecular mechanism by which ions are desorbed from droplets remainsdebatable but a sufficiently consistent model is in place to understand thebehavior of electrospray when applied to practical analytical problems.
Electrospray ionization operates by the process of the emission of ionsfrom a droplet into the gas phase. In ESI operation, a solution of the analyteintroduced into an ion source at atmospheric pressure is pumped through astainless steel capillary which carries a high potential, typically 3 to 5 kV(Figure 6.1). The strong electric field generated by this potential causes thesolvent to be sprayed from the end of the capillary (hence, electrospray). Thecharged droplets pass down a potential gradient towards the mass analyzer.During that transition the droplets reduce in size by evaporation of thesolvent or by droplet subdivision resulting from the high charge density.Ultimately, fully desolvated ions result from complete evaporation of thesolvent or by field desorption from the charged droplets. This process isknown as “ion evaporation,” and is the primary mechanism for gas-phaseion formation in electrospray. A flow of nitrogen gas through the source helpsthe evaporation process and removal of the solvent.
Figure 6.1
Electrospray ion source. (From www.astbury.leeds.ac.uk/Facil/Mstut/mstutorial.htm.With permission.)
nebulising gas
solute
atmospheric pressure
drying gas
counter electrode
sampling cone/orifice
skimmer
analyser(10-4/10-5 mbar)
‘1 mbar’
1522_book.fm Page 233 Thursday, November 13, 2003 9:58 AM
© 2004 by CRC Press LLC
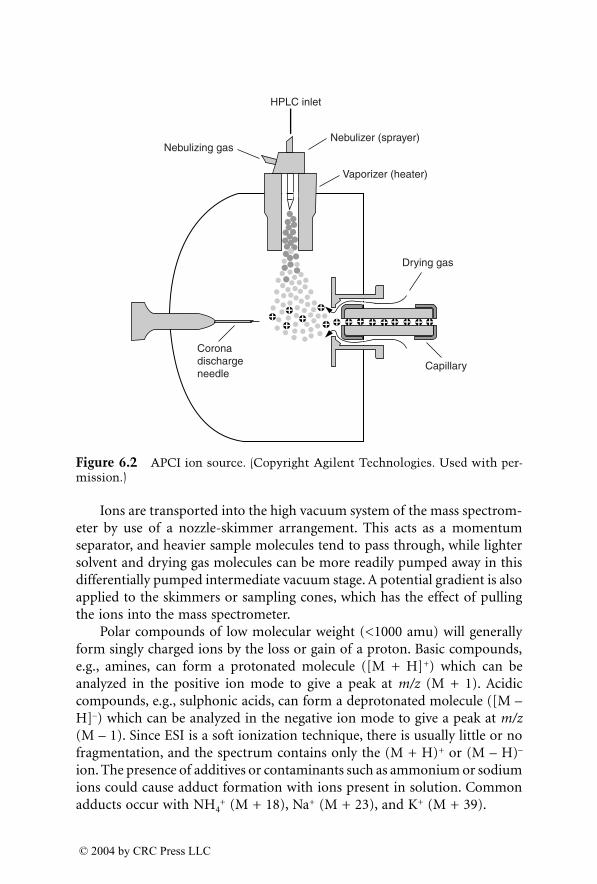
Ions are transported into the high vacuum system of the mass spectrom-eter by use of a nozzle-skimmer arrangement. This acts as a momentumseparator, and heavier sample molecules tend to pass through, while lightersolvent and drying gas molecules can be more readily pumped away in thisdifferentially pumped intermediate vacuum stage. A potential gradient is alsoapplied to the skimmers or sampling cones, which has the effect of pullingthe ions into the mass spectrometer.
Polar compounds of low molecular weight (<1000 amu) will generallyform singly charged ions by the loss or gain of a proton. Basic compounds,e.g., amines, can form a protonated molecule ([M + H]
+
) which can beanalyzed in the positive ion mode to give a peak at
m/z
(M + 1). Acidiccompounds, e.g., sulphonic acids, can form a deprotonated molecule ([M –H]
–
) which can be analyzed in the negative ion mode to give a peak at
m/z
(M – 1). Since ESI is a soft ionization technique, there is usually little or nofragmentation, and the spectrum contains only the (M + H)
+
or (M – H)
–
ion. The presence of additives or contaminants such as ammonium or sodiumions could cause adduct formation with ions present in solution. Commonadducts occur with NH
4+
(M + 18), Na
+
(M + 23), and K
+
(M + 39).
Figure 6.2
APCI ion source. (Copyright Agilent Technologies. Used with per-mission.)
HPLC inlet
Nebulizer (sprayer)
Vaporizer (heater)
Nebulizing gas
Coronadischargeneedle
Capillary
Drying gas
1522_book.fm Page 234 Thursday, November 13, 2003 9:58 AM
© 2004 by CRC Press LLC
The main advantages of ESI are molecular weight information, goodsensitivity, and suitability for large bio- or synthetic polymers as well as forpolar and even ionic compounds.
6.2.2 Principle of Operation of APCI
The APCI source is based on the original API source developed by Horning’sgroup in the mid-1970s.
18
Its commercial viability was only realized as anadjunct option to ESI when it became commercially available in 1989. Thetechnique is very sensitive and simple to operate. It operates just as well athigh mobile phase flow rates (>1 ml/min and 4.6 mm ID columns) as itdoes with lower flows and smaller ID columns. Thus, the full advantage ofthe robustness of large ID HPLC columns and ease of transfer of alreadyestablished HPLC methods based on standard chromatography, is realizedwith APCI.
Ionization takes place at atmospheric pressure and the ions are extractedinto the mass spectrometer by exactly the same set of skimmers used forelectrospray (Figure 6.2). In APCI there is no voltage applied to the capillary.The liquid elutes from the capillary probe, which is surrounded by a coaxialflow of N
2
nebulizing gas into a heated region. The combination of nebulizergas and heat forms an aerosol which begins to evaporate rapidly. At the endof the APCI probe is a high-voltage (2.5 to 3 kV) metal needle to produce acorona discharge, causing solvent molecules eluting into the source to beionized.
2
Sample molecules which elute and pass through this region ofsolvent ions can be ionized by gas-phase ion molecule reactions.
3
Chemical ionization of sample molecules is very efficient at atmosphericpressure due to the high collision frequency. Proton transfer, forming [M +H]
+
ions, occurs in the positive-ion mode, and either electron transfer orproton transfer, forming [M – H]
–
ions, occurs in the negative-ion mode.The moderating influence of the solvent clusters on the reagent ions and theinfluence of the high gas pressure reduce fragmentation during ionizationand results in primarily [M + H]
+
, [M – H]
–
, and/or adduct ions. As in ESI,ions are transported into the high vacuum system of the mass spectrometerby use of a nozzle-skimmer arrangement. The probe can be situated axiallyor orthogonally (as in Figure 6.1) to the sampling orifice.
The main advantages of APCI are molecular weight information onvolatile molecules, typical flow rates up to 2 ml/min, and good reproducibilityfor quantitation.
6.2.3 Comparison between ESI and APCI
Flows in the range of 0.2 to 2 ml/min can be used with APCI. This permitsdirect coupling of 2.1 mm and 4.6 mm ID HPLC columns to the APCI
1522_book.fm Page 235 Thursday, November 13, 2003 9:58 AM
© 2004 by CRC Press LLC
interface. ESI sources can be used up to 1 ml/min, although this is at the topof the flow range. ESI sources can also be used at flow rates down to <5
m
l/min, thus allowing the interfacing of capillary columns.Although a high temperature is applied to the APCI probe, most of the
heat is used in evaporating the solvent and heating the N
2
gas, and the thermaleffect on the sample is much less than may be expected. However, with verythermally labile compounds the heated probe may cause some thermal frag-mentation. Since ESI uses a colder probe, it is sometimes possible to produce[M + H]
+
or [M – H]
–
ions by ESI in compounds which fragment in APCI.Many compounds can be analyzed by either APCI or ESI. There are no
definitive rules on when to use APCI over ESI, but a general observation isthat APCI tends to give better sensitivity than ESI for less polar compounds.
Unlike ESI, APCI does not produce multiple charged series and is there-fore unsuitable for the analysis of high molecular weight compounds suchas proteins.
6.3 Analysis of Explosives
6.3.1 Nitroaromatic Explosives and Their Degradation Products
The most widely used military explosive is 2,4,6-trinitrotoluene (TNT). Itsmain features include low melting point, stability, low sensitivity to impact,friction, shock and electrostatic energy, and its relatively safe methods ofmanufacture.
1,19,20
Its melting point is 80.65˚C. TNT is highly soluble inacetone (132 g per 100 g acetone at 25˚C) but still soluble enough in water(10 mg per 100 g water at 25˚C). Its vapor pressure at 25˚C is 5.8
¥
10
–6
Torr.The addition of oxygen-rich products to TNT can form mixtures withenhanced explosive power. Various explosive compounds have been addedto TNT to form binary explosives. Other compounds have been added todecrease sensitivity and increase the mechanical strength of the cast.
Electrospray ionization coupled to tandem mass spectrometry was usedfor the analysis of a series of explosives, including TNT.
21
Analyses wereperformed with a Perkin–Elmer Sciex API III-PLUS triple quadrupole massspectrometer with electrospray ionization. A standard solution of TNT wasmade in acetonitrile–water (50:50), containing 2 m
M
of ammonium acetate.The solution was introduced directly into the ion source by means of a
syringe pump at a flow rate of 5
m
l/min. The major ion in the negative-ionspectrum of TNT, at a concentration of 100 pg/
m
l, was the [M – H]
–
ion at
m/z
226. TNT, DNT, and 4-amino-2,6-dinitrotoluene (4-ADNT) were analyzed
by electrospray-MS with various additives in order to obtain ion intensityenhancement.
22
A Finnigan TSQ 700 mass spectrometer with an electrospray
1522_book.fm Page 236 Thursday, November 13, 2003 9:58 AM
© 2004 by CRC Press LLC
ion source was used. Additives tested included ammonium nitrate, trifluo-roacetate (TFA), and chloroacetonitrile. Nitrate adduct ions were moreintense than TFA or chloride adduct ions by a factor of 6–40. The base peakin the negative-ion mass spectrum of TNT, with 1 m
M
ammonium nitratein the mobile phase, was at
m/z
226 due to the [M – H]
–
ion. For samplesas large as 500 ng, a nitrate adduct ion [M + NO
3
]
–
at
m/z
283 with a relativeintensity of 5% was observed. The base peak in the mass spectrum of 4-ADNTwas at
m/z
259, [M + NO
3
]
–
, while in DNT no nitrate adduct ion was detected.Additional experiments in ESI with the additives ammonium fluoride, bif-luoride, chloride, bromide, and iodide
23
showed no formation of adduct ionsin nitroaromatic compounds, probably due to the high electron density intheir rings.
ESI and APCI in the negative-ion mode were compared for the analysisof explosives, using a Hewlett–Packard 5989B LC/MS mass spectrometer.
24
Standard solutions of the investigated explosives, which included 1,3,5-TNB,1,3-DNB, TNT, 2-ADNT, 4-ADNT, 2,4-DNT, and 2,6-DNT, were preparedin a methanol–water (50:50) solution. Figure 6.3 shows the APCI and ESImass spectra in the negative-ion mode of TNT. In 1,3-DNB, 2,4-, and 2,6-DNT, no ions were detected in the ESI mode. The APCI mass spectrum of2,6-DNT is shown in Figure 6.4. In 2,4-DNT the ion at
m/z
181 has a higherabundance than the one at
m/z
182.The major ions in the APCI mass spectrum of 1,3,5-TNB were at
m/z
213,[M]
–
and at
m/z
183, [M – NO]
–
. The major ions in the APCI spectrumof 1,3-DNB were at
m/z
168, [M]
–
, at
m/z
138, [M – NO]
–
, and at
m/z
108,[M – 2NO]
–
. Both the ESI and APCI mass spectra of 2- and 4-ADNT containa major ion at
m/z
196, [M – H]
–
.The ESI mass spectrum of TNT without any additive was recorded with
a Finnigan LCQ ion trap mass spectrometer.
25
The mass spectrum containeda larger number of fragment ions than ESI mass spectra with additives.Lowest detection limit in the SIM mode, at a signal-to-noise ratio of 3, was5 pg.
A typical group of byproducts of industrial 2,4,6-trinitrotoluene (TNT)include isomers of trinitrotoluene, dinitrotoluene, trinitrobenzene, and dini-trobenzene. These compounds were investigated using APCI-LC/MS in thenegative-ion mode and MS/MS using a Thermo–Finnigan LCQ
DUO
ion trapmass spectrometer.
26
. HPLC separations were done with a Restek reversed-phase Allure C18 column (150
¥
3.2 mm, 5
m
m particle size) at a flow rateof 0.4 ml/min with sample injection volume of 10
m
l. Three mobile phasesystems consisting of methanol–isopropanol–water or methanol–water wereused for different groups of standard mixtures. The separation of the sixstandard TNT isomers (2,3,4-, 2,3,5-, 2,3,6-, 2,4,5-, 3,4,5-, and 2,4,6-TNT)(Scheme 1) was carried out with a linear gradient elution of methanol–iso-
1522_book.fm Page 237 Thursday, November 13, 2003 9:58 AM
© 2004 by CRC Press LLC
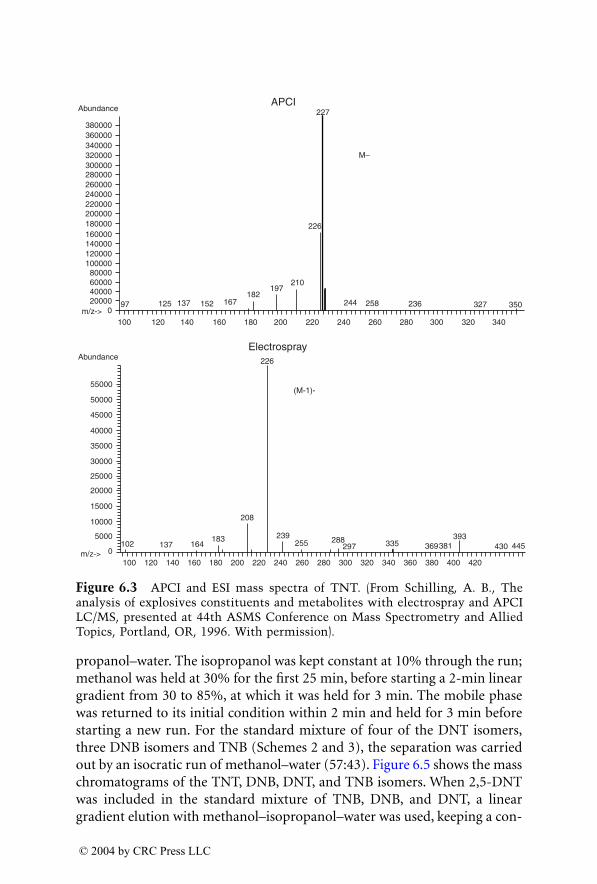
propanol–water. The isopropanol was kept constant at 10% through the run;methanol was held at 30% for the first 25 min, before starting a 2-min lineargradient from 30 to 85%, at which it was held for 3 min. The mobile phasewas returned to its initial condition within 2 min and held for 3 min beforestarting a new run. For the standard mixture of four of the DNT isomers,three DNB isomers and TNB (Schemes 2 and 3), the separation was carriedout by an isocratic run of methanol–water (57:43). Figure 6.5 shows the masschromatograms of the TNT, DNB, DNT, and TNB isomers. When 2,5-DNTwas included in the standard mixture of TNB, DNB, and DNT, a lineargradient elution with methanol–isopropanol–water was used, keeping a con-
Figure 6.3
APCI and ESI mass spectra of TNT. (From Schilling, A. B., Theanalysis of explosives constituents and metabolites with electrospray and APCILC/MS, presented at 44th ASMS Conference on Mass Spectrometry and AlliedTopics, Portland, OR, 1996. With permission).
288445430
393381369335297255
239
208
183164137102
226
5000
10000
15000
20000
25000
30000
35000
40000
45000
50000
55000
100 120 140 160 180 200 220 240 260 280 300 320 340 360 380 400 420m/z-> 0
AbundanceElectrospray
(M-1)-
20000400006000080000
100000120000140000160000180000200000220000240000260000280000300000320000340000360000380000
0350
340
327
320300280
236258
260
244
240220
210
200
197182
180
167
160
152
140
137125
120100
97
226
227APCI
M-
Abundance
m/z->
1522_book.fm Page 238 Thursday, November 13, 2003 9:58 AM
© 2004 by CRC Press LLC
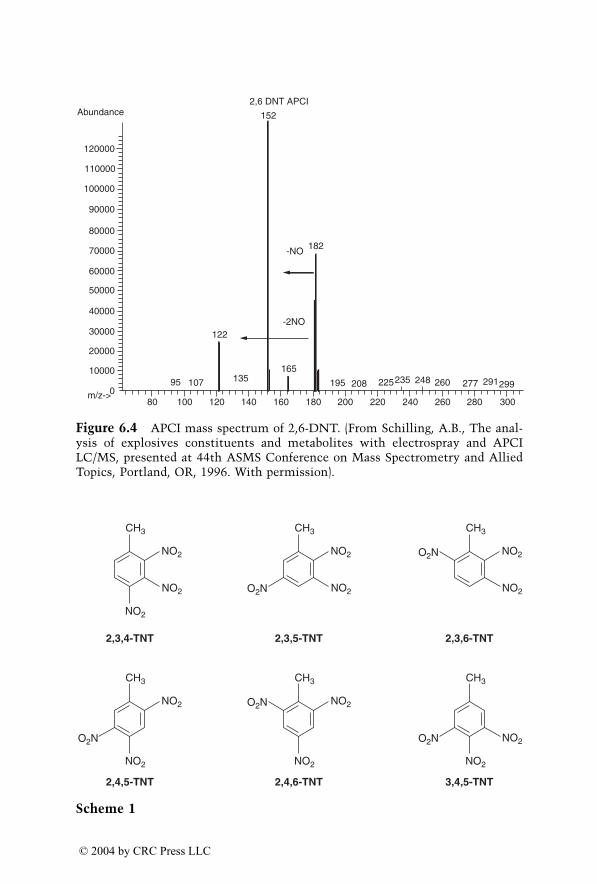
Figure 6.4
APCI mass spectrum of 2,6-DNT. (From Schilling, A.B., The anal-ysis of explosives constituents and metabolites with electrospray and APCILC/MS, presented at 44th ASMS Conference on Mass Spectrometry and AlliedTopics, Portland, OR, 1996. With permission).
Scheme 1
225235 248 260 277 291299
300280260240220
208195
200180
165
160
135107
140120100
95
800
10000
20000
30000
40000
50000
60000
70000
80000
90000
100000
110000
120000
122-2NO
-NO
Abundance 152
182
2,6 DNT APCI
m/z->
NO2
NO2
CH3
NO2
NO2
O2N
CH3
NO2
NO2O2N
CH3
NO2
NO2
NO2
O2N
CH3
NO2
NO2O2N
CH3
NO2
O2N
CH3
NO2
2,3,4-TNT 2,3,5-TNT 2,3,6-TNT
2,4,5-TNT 2,4,6-TNT 3,4,5-TNT
1522_book.fm Page 239 Thursday, November 13, 2003 9:58 AM
© 2004 by CRC Press LLC
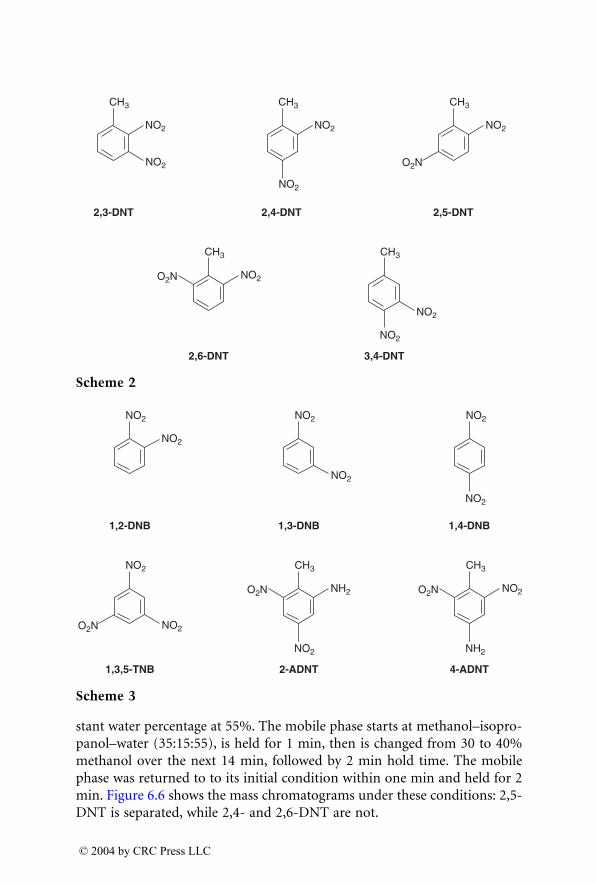
stant water percentage at 55%. The mobile phase starts at methanol–isopro-panol–water (35:15:55), is held for 1 min, then is changed from 30 to 40%methanol over the next 14 min, followed by 2 min hold time. The mobilephase was returned to to its initial condition within one min and held for 2min. Figure 6.6 shows the mass chromatograms under these conditions: 2,5-DNT is separated, while 2,4- and 2,6-DNT are not.
Scheme 2
Scheme 3
NO2
CH3
NO2
NO2
CH3
NO2
NO2
CH3
O2N
NO2O2N
CH3
NO2
CH3
NO2
2,3-DNT 2,4-DNT 2,5-DNT
2,6-DNT 3,4-DNT
NO2
NO2 NO2
NO2
NO2
NO2
O2N
NO2
NO2
NH2O2N
CH3
NO2O2N
NH2
NO2
CH3
1,2-DNB 1,3-DNB 1,4-DNB
1,3,5-TNB 2-ADNT 4-ADNT
1522_book.fm Page 240 Thursday, November 13, 2003 9:58 AM
© 2004 by CRC Press LLC
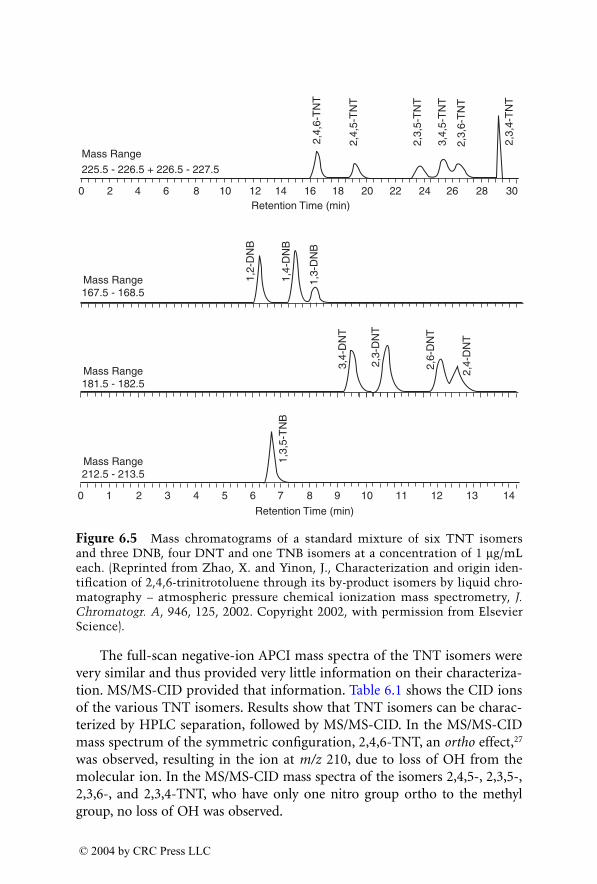
The full-scan negative-ion APCI mass spectra of the TNT isomers werevery similar and thus provided very little information on their characteriza-tion. MS/MS-CID provided that information. Table 6.1 shows the CID ionsof the various TNT isomers. Results show that TNT isomers can be charac-terized by HPLC separation, followed by MS/MS-CID. In the MS/MS-CIDmass spectrum of the symmetric configuration, 2,4,6-TNT, an
ortho
effect,
27
was observed, resulting in the ion at
m/z
210, due to loss of OH from themolecular ion. In the MS/MS-CID mass spectra of the isomers 2,4,5-, 2,3,5-,2,3,6-, and 2,3,4-TNT, who have only one nitro group ortho to the methylgroup, no loss of OH was observed.
Figure 6.5
Mass chromatograms of a standard mixture of six TNT isomersand three DNB, four DNT and one TNB isomers at a concentration of 1
m
g/mLeach. (Reprinted from Zhao, X. and Yinon, J., Characterization and origin iden-tification of 2,4,6-trinitrotoluene through its by-product isomers by liquid chro-matography – atmospheric pressure chemical ionization mass spectrometry,
J.Chromatogr. A
, 946, 125, 2002. Copyright 2002, with permission from ElsevierScience).
2,4,
6-T
NT
2,4,
5-T
NT
2,3,
5-T
NT
3,4,
5-T
NT
2,3,
6-T
NT
2,3,
4-T
NT
Mass Range
Mass Range167.5 - 168.5
Mass Range181.5 - 182.5
Mass Range212.5 - 213.5
225.5 - 226.5 + 226.5 - 227.5
1,3,
5-T
NB
3,4-
DN
T
2,3-
DN
T
2,6-
DN
T
2,4-
DN
T
1,2-
DN
B
1,4-
DN
B
1,3-
DN
B
0 2 4 6 8 10 12 14 16 18 20 22 24 26 28 30
0 2 4 6 8 10 12 141 3 5 7 9 11 13
Retention Time (min)
Retention Time (min)
1522_book.fm Page 241 Thursday, November 13, 2003 9:58 AM
© 2004 by CRC Press LLC
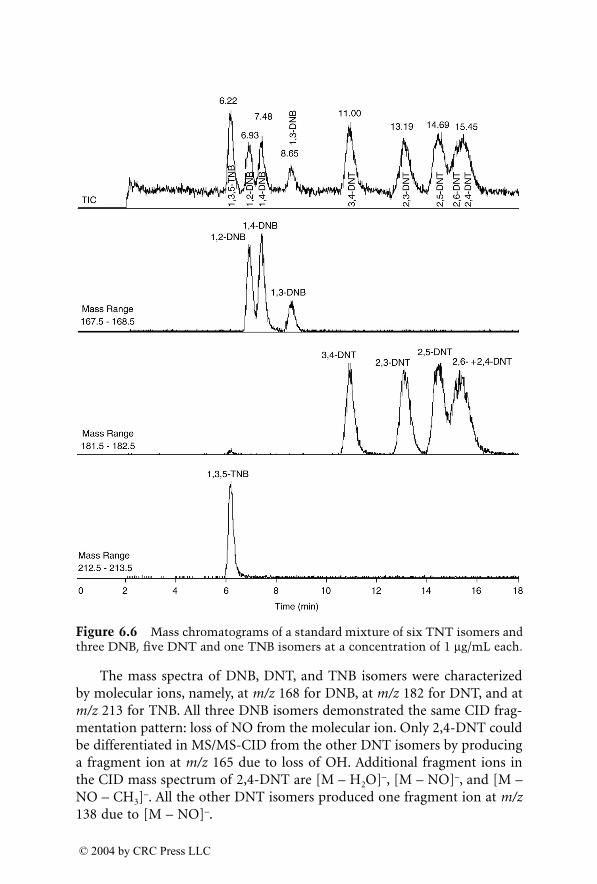
The mass spectra of DNB, DNT, and TNB isomers were characterizedby molecular ions, namely, at
m/z
168 for DNB, at
m/z
182 for DNT, and at
m/z
213 for TNB. All three DNB isomers demonstrated the same CID frag-mentation pattern: loss of NO from the molecular ion. Only 2,4-DNT couldbe differentiated in MS/MS-CID from the other DNT isomers by producinga fragment ion at
m/z
165 due to loss of OH. Additional fragment ions inthe CID mass spectrum of 2,4-DNT are [M – H
2
O]–, [M – NO]–, and [M –NO – CH3]–. All the other DNT isomers produced one fragment ion at m/z138 due to [M – NO]–.
Figure 6.6 Mass chromatograms of a standard mixture of six TNT isomers andthree DNB, five DNT and one TNB isomers at a concentration of 1 mg/mL each.
1522_book.fm Page 242 Thursday, November 13, 2003 9:58 AM
© 2004 by CRC Press LLC
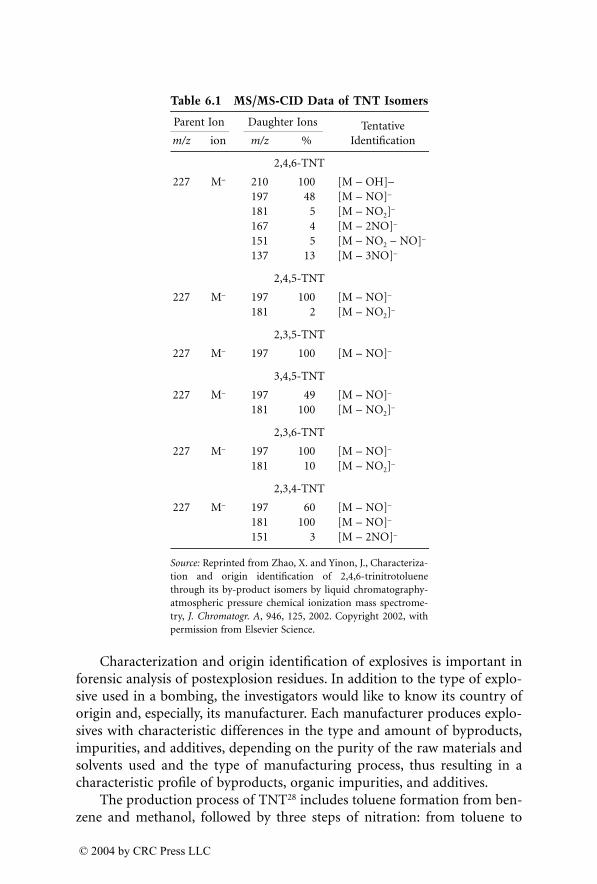
Characterization and origin identification of explosives is important inforensic analysis of postexplosion residues. In addition to the type of explo-sive used in a bombing, the investigators would like to know its country oforigin and, especially, its manufacturer. Each manufacturer produces explo-sives with characteristic differences in the type and amount of byproducts,impurities, and additives, depending on the purity of the raw materials andsolvents used and the type of manufacturing process, thus resulting in acharacteristic profile of byproducts, organic impurities, and additives.
The production process of TNT28 includes toluene formation from ben-zene and methanol, followed by three steps of nitration: from toluene to
Table 6.1 MS/MS-CID Data of TNT Isomers
Parent Ion Daughter Ions Tentative Identificationm/z ion m/z %
2,4,6-TNT
227 M– 210 100 [M – OH]–197 48 [M – NO]–
181 5 [M – NO2]–
167 4 [M – 2NO]–
151 5 [M – NO2 – NO]–
137 13 [M – 3NO]–
2,4,5-TNT
227 M– 197 100 [M – NO]–
181 2 [M – NO2]–
2,3,5-TNT
227 M– 197 100 [M – NO]–
3,4,5-TNT
227 M– 197 49 [M – NO]–
181 100 [M – NO2]–
2,3,6-TNT
227 M– 197 100 [M – NO]–
181 10 [M – NO2]–
2,3,4-TNT
227 M– 197 60 [M – NO]–
181 100 [M – NO]–
151 3 [M – 2NO]–
Source: Reprinted from Zhao, X. and Yinon, J., Characteriza-tion and origin identification of 2,4,6-trinitrotoluenethrough its by-product isomers by liquid chromatography-atmospheric pressure chemical ionization mass spectrome-try, J. Chromatogr. A, 946, 125, 2002. Copyright 2002, withpermission from Elsevier Science.
1522_book.fm Page 243 Thursday, November 13, 2003 9:58 AM
© 2004 by CRC Press LLC
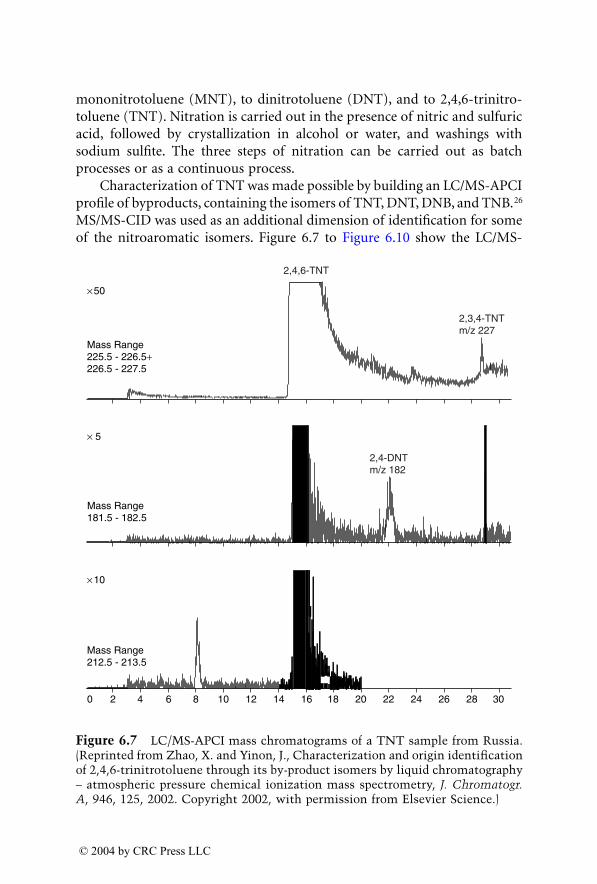
mononitrotoluene (MNT), to dinitrotoluene (DNT), and to 2,4,6-trinitro-toluene (TNT). Nitration is carried out in the presence of nitric and sulfuricacid, followed by crystallization in alcohol or water, and washings withsodium sulfite. The three steps of nitration can be carried out as batchprocesses or as a continuous process.
Characterization of TNT was made possible by building an LC/MS-APCIprofile of byproducts, containing the isomers of TNT, DNT, DNB, and TNB.26
MS/MS-CID was used as an additional dimension of identification for someof the nitroaromatic isomers. Figure 6.7 to Figure 6.10 show the LC/MS-
Figure 6.7 LC/MS-APCI mass chromatograms of a TNT sample from Russia.(Reprinted from Zhao, X. and Yinon, J., Characterization and origin identificationof 2,4,6-trinitrotoluene through its by-product isomers by liquid chromatography– atmospheric pressure chemical ionization mass spectrometry, J. Chromatogr.A, 946, 125, 2002. Copyright 2002, with permission from Elsevier Science.)
¥ 50
Mass Range225.5 - 226.5+226.5 - 227.5
¥ 5
Mass Range181.5 - 182.5
2,4-DNTm/z 182
2,3,4-TNTm/z 227
2,4,6-TNT
¥ 10
Mass Range212.5 - 213.5
0 2 4 6 8 10 12 14 16 18 20 22 24 26 28 30
1522_book.fm Page 244 Thursday, November 13, 2003 9:58 AM
© 2004 by CRC Press LLC
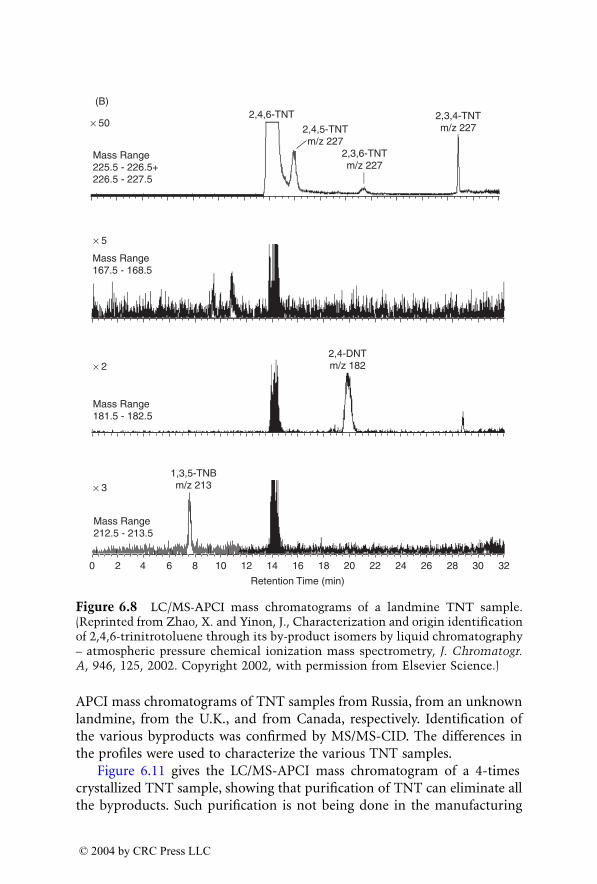
APCI mass chromatograms of TNT samples from Russia, from an unknownlandmine, from the U.K., and from Canada, respectively. Identification ofthe various byproducts was confirmed by MS/MS-CID. The differences inthe profiles were used to characterize the various TNT samples.
Figure 6.11 gives the LC/MS-APCI mass chromatogram of a 4-timescrystallized TNT sample, showing that purification of TNT can eliminate allthe byproducts. Such purification is not being done in the manufacturing
Figure 6.8 LC/MS-APCI mass chromatograms of a landmine TNT sample.(Reprinted from Zhao, X. and Yinon, J., Characterization and origin identificationof 2,4,6-trinitrotoluene through its by-product isomers by liquid chromatography– atmospheric pressure chemical ionization mass spectrometry, J. Chromatogr.A, 946, 125, 2002. Copyright 2002, with permission from Elsevier Science.)
0 2 4 6 8 10 12 14 16 18 20 22 24 26 28 30 32
Retention Time (min)
× 2
× 5
× 50
× 3
Mass Range212.5 - 213.5
Mass Range181.5 - 182.5
1,3,5-TNBm/z 213
2,4-DNTm/z 182
Mass Range167.5 - 168.5
(B)
Mass Range225.5 - 226.5+226.5 - 227.5
2,4,6-TNT
2,4,5-TNTm/z 227
2,3,6-TNTm/z 227
2,3,4-TNTm/z 227
1522_book.fm Page 245 Thursday, November 13, 2003 9:58 AM
© 2004 by CRC Press LLC
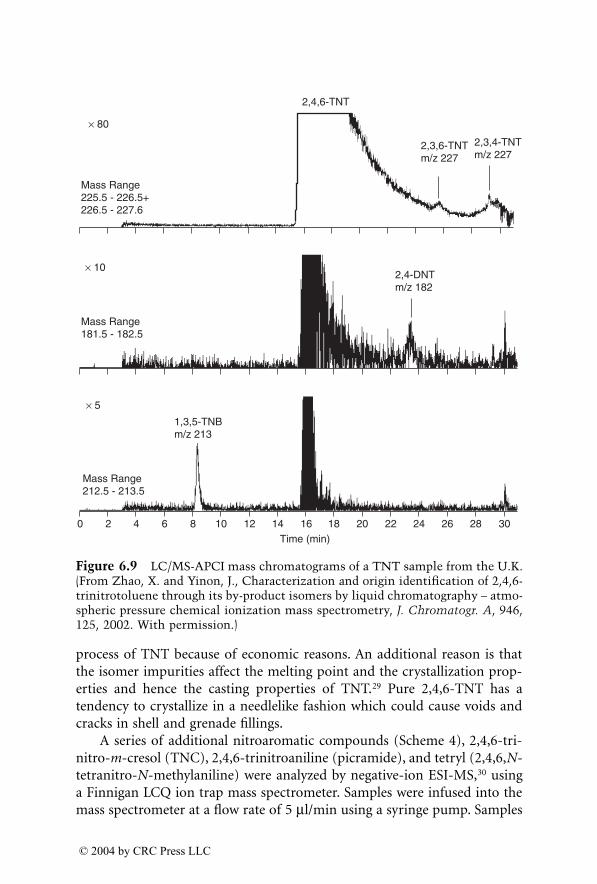
process of TNT because of economic reasons. An additional reason is thatthe isomer impurities affect the melting point and the crystallization prop-erties and hence the casting properties of TNT.29 Pure 2,4,6-TNT has atendency to crystallize in a needlelike fashion which could cause voids andcracks in shell and grenade fillings.
A series of additional nitroaromatic compounds (Scheme 4), 2,4,6-tri-nitro-m-cresol (TNC), 2,4,6-trinitroaniline (picramide), and tetryl (2,4,6,N-tetranitro-N-methylaniline) were analyzed by negative-ion ESI-MS,30 usinga Finnigan LCQ ion trap mass spectrometer. Samples were infused into themass spectrometer at a flow rate of 5 ml/min using a syringe pump. Samples
Figure 6.9 LC/MS-APCI mass chromatograms of a TNT sample from the U.K.(From Zhao, X. and Yinon, J., Characterization and origin identification of 2,4,6-trinitrotoluene through its by-product isomers by liquid chromatography – atmo-spheric pressure chemical ionization mass spectrometry, J. Chromatogr. A, 946,125, 2002. With permission.)
¥ 80
Mass Range225.5 - 226.5+226.5 - 227.6
2,4,6-TNT
2,3,6-TNTm/z 227
2,3,4-TNTm/z 227
¥ 5
Mass Range212.5 - 213.5
1,3,5-TNBm/z 213
0 2 4 6 8 10 12 14 16 18 20 22 24 26 28 30Time (min)
¥ 10
Mass Range181.5 - 182.5
2,4-DNTm/z 182
1522_book.fm Page 246 Thursday, November 13, 2003 9:58 AM
© 2004 by CRC Press LLC
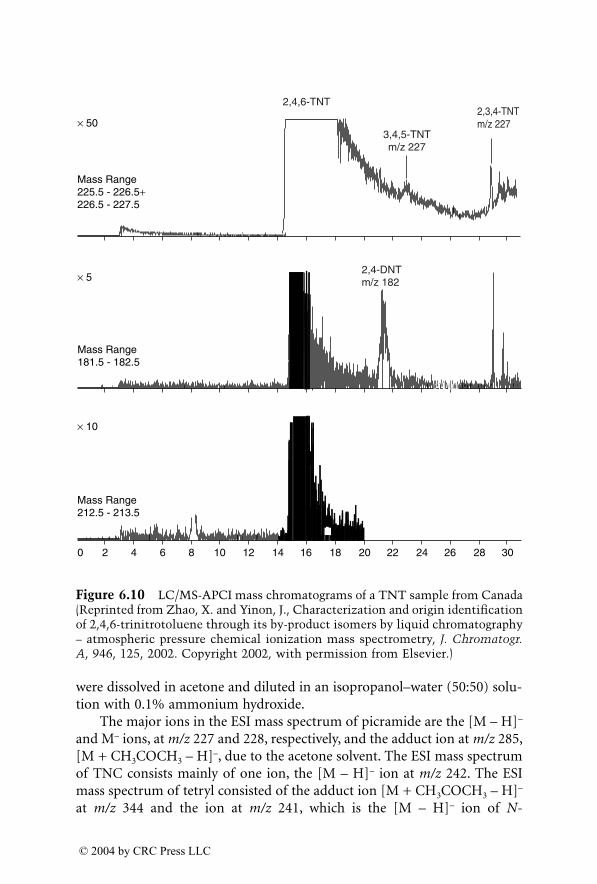
were dissolved in acetone and diluted in an isopropanol–water (50:50) solu-tion with 0.1% ammonium hydroxide.
The major ions in the ESI mass spectrum of picramide are the [M – H]–
and M– ions, at m/z 227 and 228, respectively, and the adduct ion at m/z 285,[M + CH3COCH3 – H]–, due to the acetone solvent. The ESI mass spectrumof TNC consists mainly of one ion, the [M – H]– ion at m/z 242. The ESImass spectrum of tetryl consisted of the adduct ion [M + CH3COCH3 – H]–
at m/z 344 and the ion at m/z 241, which is the [M – H]– ion of N-
Figure 6.10 LC/MS-APCI mass chromatograms of a TNT sample from Canada(Reprinted from Zhao, X. and Yinon, J., Characterization and origin identificationof 2,4,6-trinitrotoluene through its by-product isomers by liquid chromatography– atmospheric pressure chemical ionization mass spectrometry, J. Chromatogr.A, 946, 125, 2002. Copyright 2002, with permission from Elsevier.)
× 50
Mass Range225.5 - 226.5+226.5 - 227.5
2,3,4-TNTm/z 227
2,4,6-TNT
× 5
Mass Range181.5 - 182.5
2,4-DNTm/z 182
3,4,5-TNTm/z 227
× 10
Mass Range212.5 - 213.5
0 2 4 6 8 10 12 14 16 18 20 22 24 26 28 30
1522_book.fm Page 247 Thursday, November 13, 2003 9:58 AM
© 2004 by CRC Press LLC
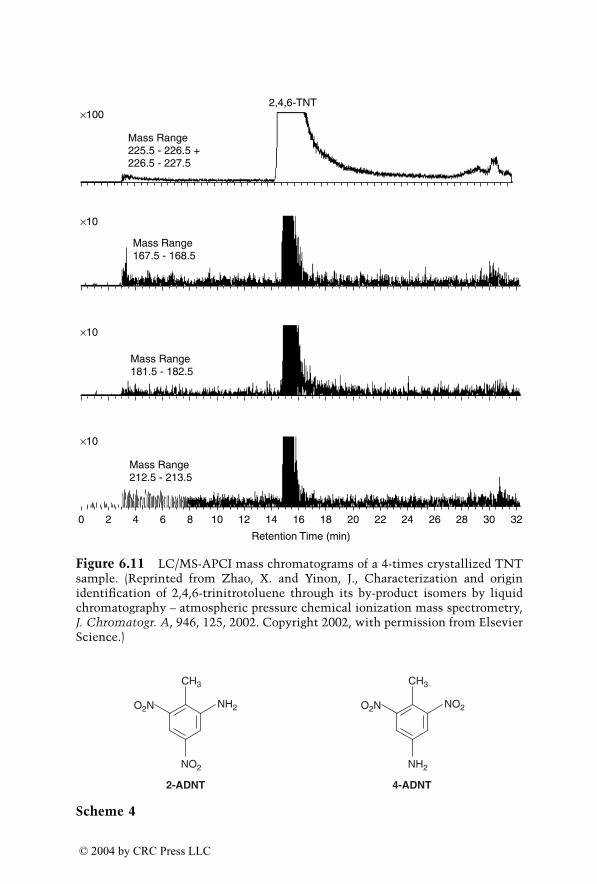
Figure 6.11 LC/MS-APCI mass chromatograms of a 4-times crystallized TNTsample. (Reprinted from Zhao, X. and Yinon, J., Characterization and originidentification of 2,4,6-trinitrotoluene through its by-product isomers by liquidchromatography – atmospheric pressure chemical ionization mass spectrometry,J. Chromatogr. A, 946, 125, 2002. Copyright 2002, with permission from ElsevierScience.)
Scheme 4
×100
×10
×10
×10
Mass Range225.5 - 226.5 +226.5 - 227.5
2,4,6-TNT
Mass Range167.5 - 168.5
Mass Range181.5 - 182.5
Mass Range212.5 - 213.5
0 2 4 6 8 10 12 14 16 18 20 22 24 26 28 30 32
Retention Time (min)
NO2
NH2O2N
CH3
NH2
NO2O2N
CH3
2-ADNT 4-ADNT
1522_book.fm Page 248 Thursday, November 13, 2003 9:58 AM
© 2004 by CRC Press LLC
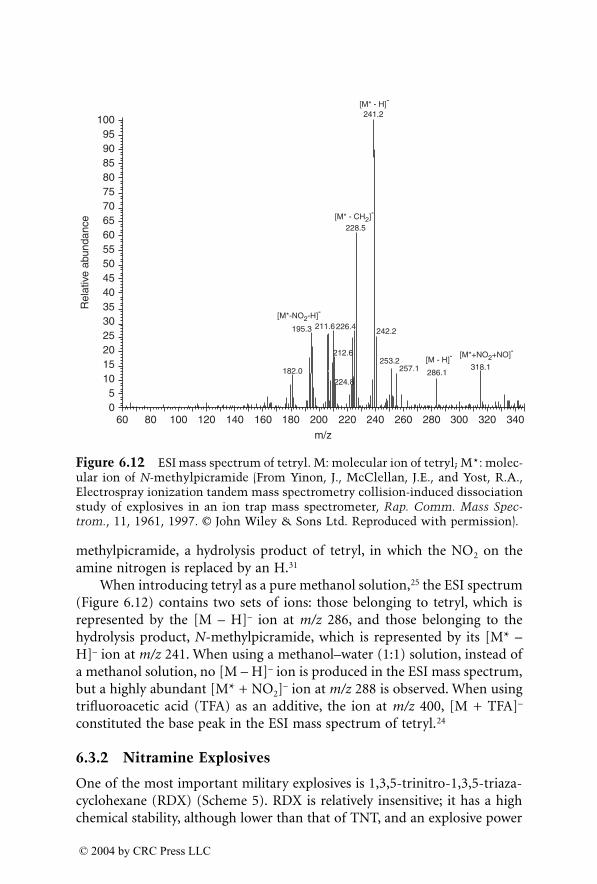
methylpicramide, a hydrolysis product of tetryl, in which the NO2 on theamine nitrogen is replaced by an H.31
When introducing tetryl as a pure methanol solution,25 the ESI spectrum(Figure 6.12) contains two sets of ions: those belonging to tetryl, which isrepresented by the [M – H]– ion at m/z 286, and those belonging to thehydrolysis product, N-methylpicramide, which is represented by its [M* –H]– ion at m/z 241. When using a methanol–water (1:1) solution, instead ofa methanol solution, no [M – H]– ion is produced in the ESI mass spectrum,but a highly abundant [M* + NO2]– ion at m/z 288 is observed. When usingtrifluoroacetic acid (TFA) as an additive, the ion at m/z 400, [M + TFA]–
constituted the base peak in the ESI mass spectrum of tetryl.24
6.3.2 Nitramine Explosives
One of the most important military explosives is 1,3,5-trinitro-1,3,5-triaza-cyclohexane (RDX) (Scheme 5). RDX is relatively insensitive; it has a highchemical stability, although lower than that of TNT, and an explosive power
Figure 6.12 ESI mass spectrum of tetryl. M: molecular ion of tetryl; M*: molec-ular ion of N-methylpicramide (From Yinon, J., McClellan, J.E., and Yost, R.A.,Electrospray ionization tandem mass spectrometry collision-induced dissociationstudy of explosives in an ion trap mass spectrometer, Rap. Comm. Mass Spec-trom., 11, 1961, 1997. © John Wiley & Sons Ltd. Reproduced with permission).
211.6195.3 226.4
Rel
ativ
e ab
unda
nce
100959085807570656055504540353025201510
50
60 80 100 120 140 160 180 200
m/z
220 240 260 280 300 320 340
182.0
[M*-NO2-H]-
212.6
224.8
253.2257.1 286.1
[M - H]-[M*+NO2+NO]-
318.1
[M* - CH2]-
228.5
242.2
[M* - H]-
241.2
1522_book.fm Page 249 Thursday, November 13, 2003 9:58 AM
© 2004 by CRC Press LLC
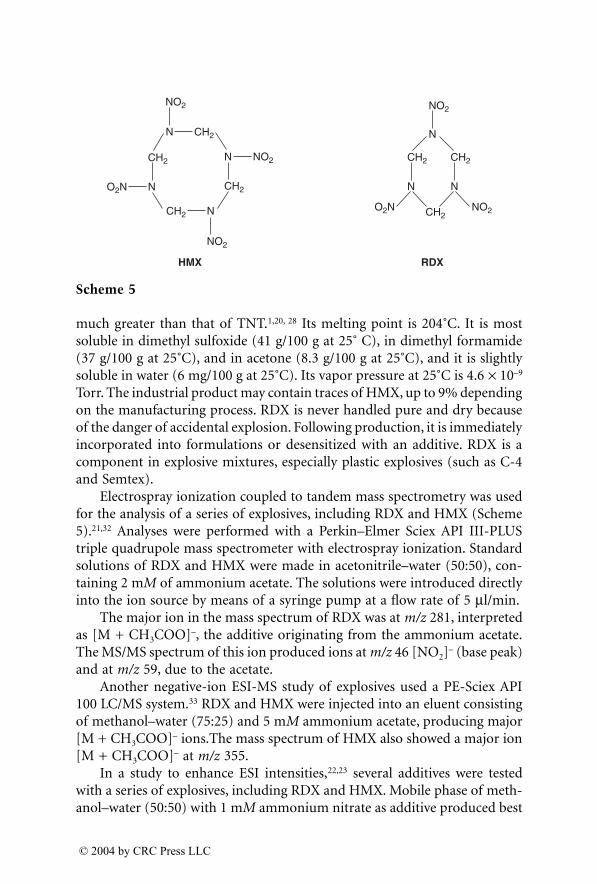
much greater than that of TNT.1,20, 28 Its melting point is 204˚C. It is mostsoluble in dimethyl sulfoxide (41 g/100 g at 25˚ C), in dimethyl formamide(37 g/100 g at 25˚C), and in acetone (8.3 g/100 g at 25˚C), and it is slightlysoluble in water (6 mg/100 g at 25˚C). Its vapor pressure at 25˚C is 4.6 ¥ 10–9
Torr. The industrial product may contain traces of HMX, up to 9% dependingon the manufacturing process. RDX is never handled pure and dry becauseof the danger of accidental explosion. Following production, it is immediatelyincorporated into formulations or desensitized with an additive. RDX is acomponent in explosive mixtures, especially plastic explosives (such as C-4and Semtex).
Electrospray ionization coupled to tandem mass spectrometry was usedfor the analysis of a series of explosives, including RDX and HMX (Scheme5).21,32 Analyses were performed with a Perkin–Elmer Sciex API III-PLUStriple quadrupole mass spectrometer with electrospray ionization. Standardsolutions of RDX and HMX were made in acetonitrile–water (50:50), con-taining 2 mM of ammonium acetate. The solutions were introduced directlyinto the ion source by means of a syringe pump at a flow rate of 5 ml/min.
The major ion in the mass spectrum of RDX was at m/z 281, interpretedas [M + CH3COO]–, the additive originating from the ammonium acetate.The MS/MS spectrum of this ion produced ions at m/z 46 [NO2]– (base peak)and at m/z 59, due to the acetate.
Another negative-ion ESI-MS study of explosives used a PE-Sciex API100 LC/MS system.33 RDX and HMX were injected into an eluent consistingof methanol–water (75:25) and 5 mM ammonium acetate, producing major[M + CH3COO]– ions.The mass spectrum of HMX also showed a major ion[M + CH3COO]– at m/z 355.
In a study to enhance ESI intensities,22,23 several additives were testedwith a series of explosives, including RDX and HMX. Mobile phase of meth-anol–water (50:50) with 1 mM ammonium nitrate as additive produced best
Scheme 5
NN
CH2CH2
CH2O2N
N
NO2
NO2
O2N
NO2
NO2
NO2
CH2
CH2
N
NCH2
N
CH2N
HMX RDX
1522_book.fm Page 250 Thursday, November 13, 2003 9:58 AM
© 2004 by CRC Press LLC
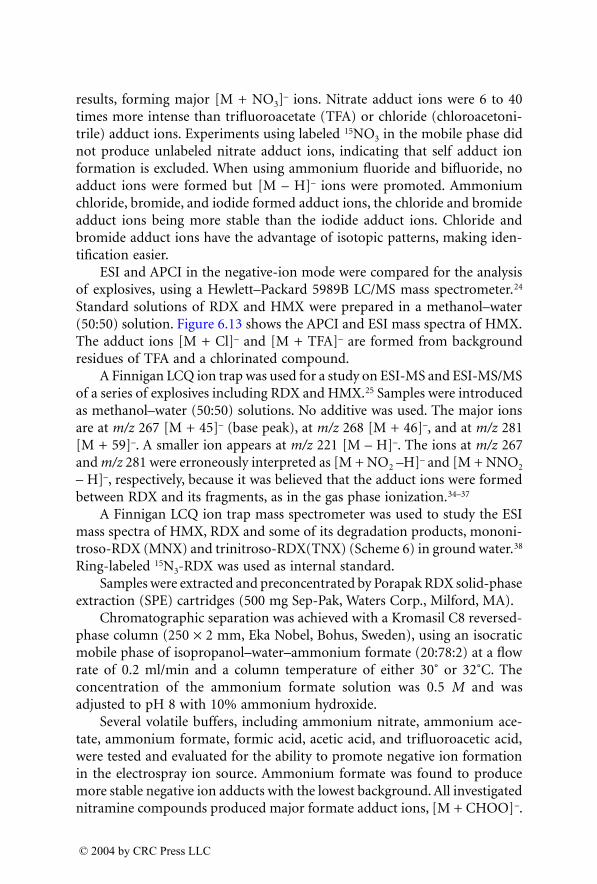
results, forming major [M + NO3]– ions. Nitrate adduct ions were 6 to 40times more intense than trifluoroacetate (TFA) or chloride (chloroacetoni-trile) adduct ions. Experiments using labeled 15NO3 in the mobile phase didnot produce unlabeled nitrate adduct ions, indicating that self adduct ionformation is excluded. When using ammonium fluoride and bifluoride, noadduct ions were formed but [M – H]– ions were promoted. Ammoniumchloride, bromide, and iodide formed adduct ions, the chloride and bromideadduct ions being more stable than the iodide adduct ions. Chloride andbromide adduct ions have the advantage of isotopic patterns, making iden-tification easier.
ESI and APCI in the negative-ion mode were compared for the analysisof explosives, using a Hewlett–Packard 5989B LC/MS mass spectrometer.24
Standard solutions of RDX and HMX were prepared in a methanol–water(50:50) solution. Figure 6.13 shows the APCI and ESI mass spectra of HMX.The adduct ions [M + Cl]– and [M + TFA]– are formed from backgroundresidues of TFA and a chlorinated compound.
A Finnigan LCQ ion trap was used for a study on ESI-MS and ESI-MS/MSof a series of explosives including RDX and HMX.25 Samples were introducedas methanol–water (50:50) solutions. No additive was used. The major ionsare at m/z 267 [M + 45]– (base peak), at m/z 268 [M + 46]–, and at m/z 281[M + 59]–. A smaller ion appears at m/z 221 [M – H]–. The ions at m/z 267and m/z 281 were erroneously interpreted as [M + NO2 –H]– and [M + NNO2
– H]–, respectively, because it was believed that the adduct ions were formedbetween RDX and its fragments, as in the gas phase ionization.34–37
A Finnigan LCQ ion trap mass spectrometer was used to study the ESImass spectra of HMX, RDX and some of its degradation products, mononi-troso-RDX (MNX) and trinitroso-RDX(TNX) (Scheme 6) in ground water.38
Ring-labeled 15N3-RDX was used as internal standard.Samples were extracted and preconcentrated by Porapak RDX solid-phase
extraction (SPE) cartridges (500 mg Sep-Pak, Waters Corp., Milford, MA).Chromatographic separation was achieved with a Kromasil C8 reversed-
phase column (250 ¥ 2 mm, Eka Nobel, Bohus, Sweden), using an isocraticmobile phase of isopropanol–water–ammonium formate (20:78:2) at a flowrate of 0.2 ml/min and a column temperature of either 30˚ or 32˚C. Theconcentration of the ammonium formate solution was 0.5 M and wasadjusted to pH 8 with 10% ammonium hydroxide.
Several volatile buffers, including ammonium nitrate, ammonium ace-tate, ammonium formate, formic acid, acetic acid, and trifluoroacetic acid,were tested and evaluated for the ability to promote negative ion formationin the electrospray ion source. Ammonium formate was found to producemore stable negative ion adducts with the lowest background. All investigatednitramine compounds produced major formate adduct ions, [M + CHOO]–.
1522_book.fm Page 251 Thursday, November 13, 2003 9:58 AM
© 2004 by CRC Press LLC
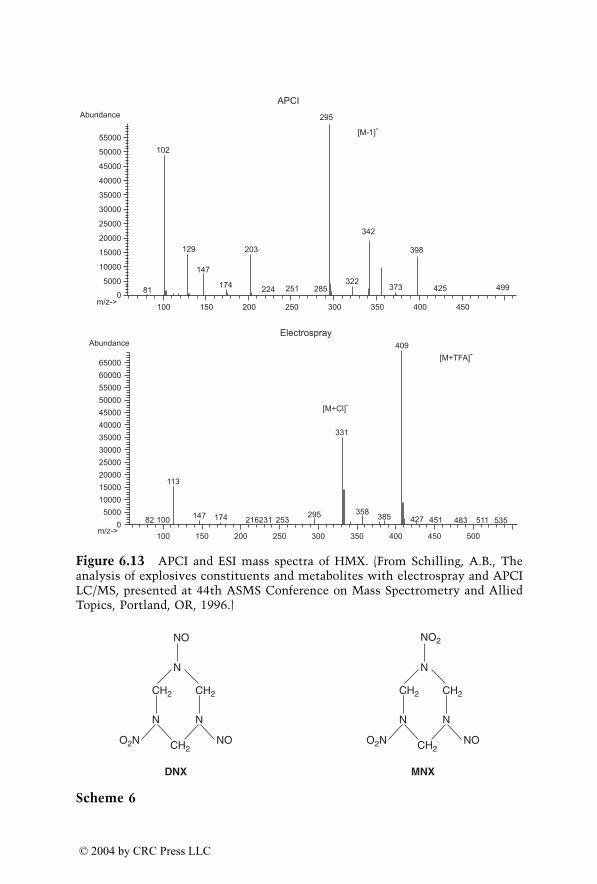
Figure 6.13 APCI and ESI mass spectra of HMX. (From Schilling, A.B., Theanalysis of explosives constituents and metabolites with electrospray and APCILC/MS, presented at 44th ASMS Conference on Mass Spectrometry and AlliedTopics, Portland, OR, 1996.)
Scheme 6
65000
60000
55000
50000
45000
40000
35000
30000
25000
20000
15000
10000
5000
0
Abundance
m/z->100 150 200 250 300 350 400 450 500
55000
50000
45000
40000
35000
30000
25000
20000
15000
10000
5000
100 150 200 250 300 350 400 450
100
113
82 147 174 216231 253295 358
385 427 451 483 511 535
331
[M+Cl]-
409
[M+TFA]-
0m/z->
81 499425
398
373322
285
295
[M-1]-
APCI
342
251224174
147
129 203
102
Abundance
Electrospray
NO
NN
CH2CH2
CH2O2N
N
NO
NO2
NN
CH2CH2
CH2O2N
N
NO
DNX MNX
1522_book.fm Page 252 Thursday, November 13, 2003 9:58 AM
© 2004 by CRC Press LLC
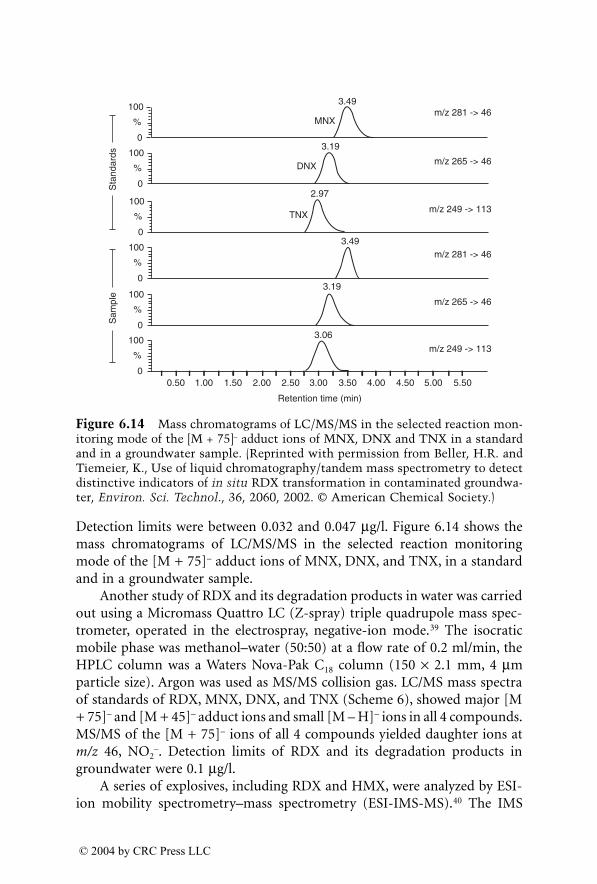
Detection limits were between 0.032 and 0.047 mg/l. Figure 6.14 shows themass chromatograms of LC/MS/MS in the selected reaction monitoringmode of the [M + 75]– adduct ions of MNX, DNX, and TNX, in a standardand in a groundwater sample.
Another study of RDX and its degradation products in water was carriedout using a Micromass Quattro LC (Z-spray) triple quadrupole mass spec-trometer, operated in the electrospray, negative-ion mode.39 The isocraticmobile phase was methanol–water (50:50) at a flow rate of 0.2 ml/min, theHPLC column was a Waters Nova-Pak C18 column (150 ¥ 2.1 mm, 4 mmparticle size). Argon was used as MS/MS collision gas. LC/MS mass spectraof standards of RDX, MNX, DNX, and TNX (Scheme 6), showed major [M+ 75]– and [M + 45]– adduct ions and small [M – H]– ions in all 4 compounds.MS/MS of the [M + 75]– ions of all 4 compounds yielded daughter ions atm/z 46, NO2
–. Detection limits of RDX and its degradation products ingroundwater were 0.1 mg/l.
A series of explosives, including RDX and HMX, were analyzed by ESI-ion mobility spectrometry–mass spectrometry (ESI-IMS-MS).40 The IMS
Figure 6.14 Mass chromatograms of LC/MS/MS in the selected reaction mon-itoring mode of the [M + 75]– adduct ions of MNX, DNX and TNX in a standardand in a groundwater sample. (Reprinted with permission from Beller, H.R. andTiemeier, K., Use of liquid chromatography/tandem mass spectrometry to detectdistinctive indicators of in situ RDX transformation in contaminated groundwa-ter, Environ. Sci. Technol., 36, 2060, 2002. © American Chemical Society.)
100
%
0
100
%
0
100
%
0
100
%
0
100
%
0
100
%
0
MNX
DNX
TNX
m/z 281 -> 46
m/z 265 -> 46
m/z 249 -> 113
m/z 265 -> 46
m/z 281 -> 46
m/z 249 -> 113
3.49
3.19
2.97
3.49
3.19
3.06
0.50 1.00 1.50 2.00 2.50 3.00 3.50 4.00 4.50 5.00 5.50
Retention time (min)
Sam
ple
Sta
ndar
ds
1522_book.fm Page 253 Thursday, November 13, 2003 9:58 AM
© 2004 by CRC Press LLC
was interfaced to an Extrel C50-Q quadrupole mass spectrometer. The elec-trospray needle was cooled by a flow of water-cooled nitrogen, in order toeliminate solvent evaporation inside the needle prior to electrospray. Themobile phase consisted of methanol–water (90:10) with an addition of 2 mMsodium chloride. Major ions in RDX and HMX were [M + Cl]–, at m/z 257and m/z 331, respectively.
Chloride adduct ion formation for a series of explosives, including RDXand HMX, was investigated in negative-ion APCI-MS.41 It is important tomaximize the number of gas-phase chloride ions formed under APCI con-ditions because their major reaction is to form the adduct ion [M + Cl]–.The higher the electron attachment rate constant of a solvent, the faster theproduction of chloride ions and the higher the efficiency of formation of [M+ Cl]– adduct ions. Carbon tetrachloride was found to produce the greatestincrease in intensities of the [M + Cl]– ion of RDX and HMX, followed bychloroform and methylene chloride. These results were in agreement withthe electron attachment rate constants of these chlorinated solvents.
A series of explosives, including RDX, were analyzed by negative-ionAPCI mass spectrometry, using a Finnigan LCQ ion trap mass spectrometer.42
Samples were introduced by infusion with a syringe pump into the LC stream,which consisted of methanol–water (50:50). Without any additive the massspectrum contained weak ions at m/z 222, [M]–, m/z 221, [M – H]–, andprominent ions at m/z 267 and m/z 268, interpreted as [M + NO2 – H]– and[M + NO2]–, respectively. Addition of ammonium chloride gave an improve-ment in response by a factor of 4, producing abundant [M + Cl]– ions at m/z257 and 259.
A series of explosives, including RDX and HMX, were studied usingnegative-ion electrospray ionization Fourier transform ion cyclotron reso-nance (ESI-FTICR) mass spectrometry.43 Samples were dissolved in acetoni-trile and spiked with 0.5% ammonium acetate. The major ions in the massspectra of RDX and HMX were [M + 45]– and [M + 59]–. As a result ofaccurate mass measurements with the FTICR mass spectrometer, these ionswere assigned as [M + HCOO]– and [M + CH3COO]–, respectively. ESI massspectra of C4, a plasticized explosive based on RDX, contained adduct ionsidentified as [RDX + NO3]–, [RDX + H2CO + HCOO]–, and [RDX + H2CO+ CH3COO]–.43 These ions were also observed in the mass spectrum of pureRDX but were more abundant in the mass spectrum of C4.
Table 6.2 shows a summary of the major adduct ions in ESI and APCImass spectrometry of RDX. Both ESI and APCI seem to produce ratherinconsistent mass spectra of RDX, resulting in the production of an array ofadduct ions. Furthermore, relative abundances of the ions largely fluctuate,depending on analyte concentration, the presence of impurities in the mobilephase, and contamination of the LC/MS system. Consequently, a study was
1522_book.fm Page 254 Thursday, November 13, 2003 9:58 AM
© 2004 by CRC Press LLC
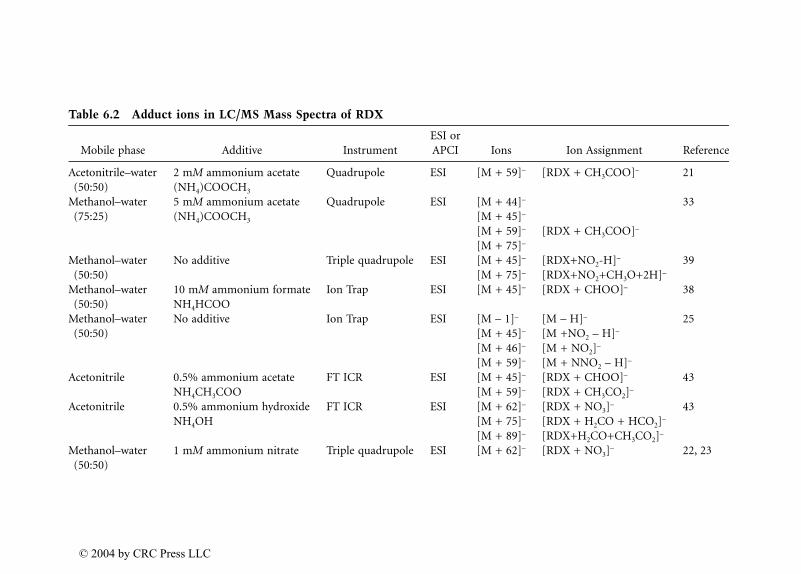
Table 6.2 Adduct ions in LC/MS Mass Spectra of RDX
Mobile phase Additive InstrumentESI orAPCI Ions Ion Assignment Reference
Acetonitrile–water(50:50)
2 mM ammonium acetate(NH4)COOCH3
Quadrupole ESI [M + 59]– [RDX + CH3COO]– 21
Methanol–water (75:25)
5 mM ammonium acetate(NH4)COOCH3
Quadrupole ESI [M + 44]–
[M + 45]–
[M + 59]–
[M + 75]–
[RDX + CH3COO]–
33
Methanol–water (50:50)
No additive Triple quadrupole ESI [M + 45]–
[M + 75]–
[RDX+NO2-H]–
[RDX+NO2+CH3O+2H]–
39
Methanol–water (50:50)
10 mM ammonium formateNH4HCOO
Ion Trap ESI [M + 45]– [RDX + CHOO]– 38
Methanol–water (50:50)
No additive Ion Trap ESI [M – 1]–
[M + 45]–
[M + 46]–
[M + 59]–
[M – H]–
[M +NO2 – H]–
[M + NO2]–
[M + NNO2 – H]–
25
Acetonitrile 0.5% ammonium acetateNH4CH3COO
FT ICR ESI [M + 45]–
[M + 59]–
[RDX + CHOO]–
[RDX + CH3CO2]–
43
Acetonitrile 0.5% ammonium hydroxideNH4OH
FT ICR ESI [M + 62]–
[M + 75]–
[M + 89]–
[RDX + NO3]–
[RDX + H2CO + HCO2]–
[RDX+H2CO+CH3CO2]–
43
Methanol–water (50:50)
1 mM ammonium nitrate Triple quadrupole ESI [M + 62]– [RDX + NO3]– 22, 23
1522_book.fm Page 255 T
hursday, Novem
ber 13, 2003 9:58 AM
© 2004 by CRC Press LLC
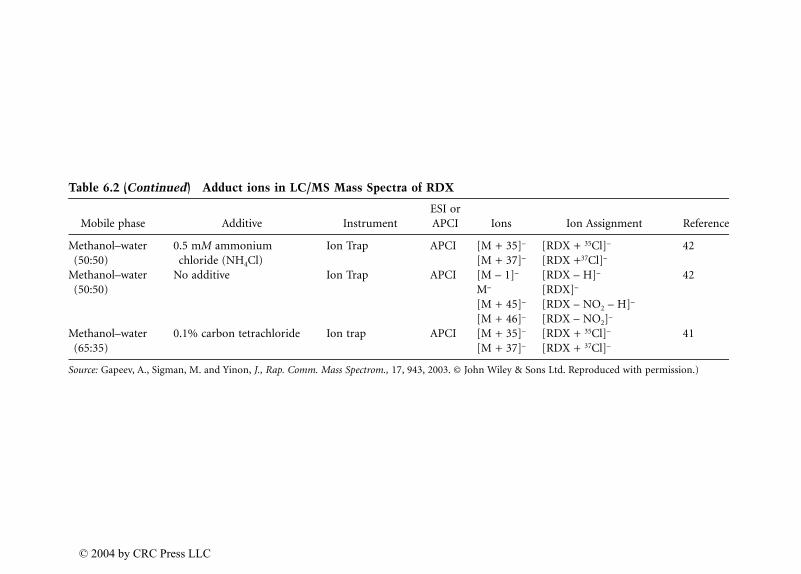
Table 6.2 (Continued) Adduct ions in LC/MS Mass Spectra of RDX
Mobile phase Additive InstrumentESI orAPCI Ions Ion Assignment Reference
Methanol–water (50:50)
0.5 mM ammonium chloride (NH4Cl)
Ion Trap APCI [M + 35]–
[M + 37]–
[RDX + 35Cl]–
[RDX +37Cl]–
42
Methanol–water (50:50)
No additive Ion Trap APCI [M – 1]–
M–
[M + 45]–
[M + 46]–
[RDX – H]–
[RDX]–
[RDX – NO2 – H]–
[RDX – NO2]–
42
Methanol–water (65:35)
0.1% carbon tetrachloride Ion trap APCI [M + 35]–
[M + 37]–
[RDX + 35Cl]–
[RDX + 37Cl]–
41
Source: Gapeev, A., Sigman, M. and Yinon, J., Rap. Comm. Mass Spectrom., 17, 943, 2003. © John Wiley & Sons Ltd. Reproduced with permission.)
1522_book.fm Page 256 T
hursday, Novem
ber 13, 2003 9:58 AM
© 2004 by CRC Press LLC
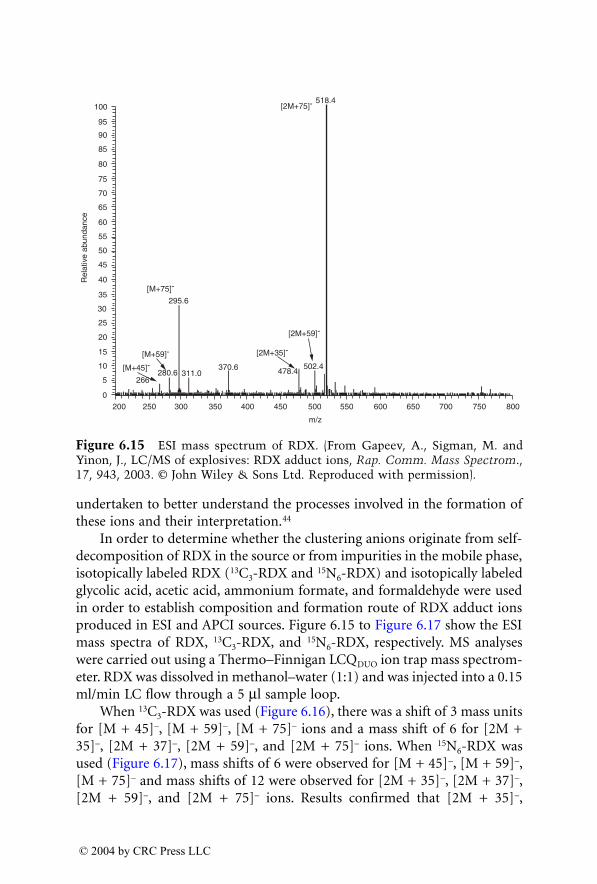
undertaken to better understand the processes involved in the formation ofthese ions and their interpretation.44
In order to determine whether the clustering anions originate from self-decomposition of RDX in the source or from impurities in the mobile phase,isotopically labeled RDX (13C3-RDX and 15N6-RDX) and isotopically labeledglycolic acid, acetic acid, ammonium formate, and formaldehyde were usedin order to establish composition and formation route of RDX adduct ionsproduced in ESI and APCI sources. Figure 6.15 to Figure 6.17 show the ESImass spectra of RDX, 13C3-RDX, and 15N6-RDX, respectively. MS analyseswere carried out using a Thermo–Finnigan LCQDUO ion trap mass spectrom-eter. RDX was dissolved in methanol–water (1:1) and was injected into a 0.15ml/min LC flow through a 5 ml sample loop.
When 13C3-RDX was used (Figure 6.16), there was a shift of 3 mass unitsfor [M + 45]–, [M + 59]–, [M + 75]– ions and a mass shift of 6 for [2M +35]–, [2M + 37]–, [2M + 59]–, and [2M + 75]– ions. When 15N6-RDX wasused (Figure 6.17), mass shifts of 6 were observed for [M + 45]–, [M + 59]–,[M + 75]– and mass shifts of 12 were observed for [2M + 35]–, [2M + 37]–,[2M + 59]–, and [2M + 75]– ions. Results confirmed that [2M + 35]–,
Figure 6.15 ESI mass spectrum of RDX. (From Gapeev, A., Sigman, M. andYinon, J., LC/MS of explosives: RDX adduct ions, Rap. Comm. Mass Spectrom.,17, 943, 2003. © John Wiley & Sons Ltd. Reproduced with permission).
[2M+75]-
[2M+35]-
[2M+59]-
[M+75]-
[M+59]-
[M+45]-
Rel
ativ
e ab
unda
nce
m/z
100
95
90
85
80
75
70
65
60
55
50
45
40
35
30
25
20
15
10
5
0200 250 300 350 400 450 500 550 600 650 700 750 800
370.6311.0
266280.6
295.6
502.4478.4
518.4
1522_book.fm Page 257 Thursday, November 13, 2003 9:58 AM
© 2004 by CRC Press LLC
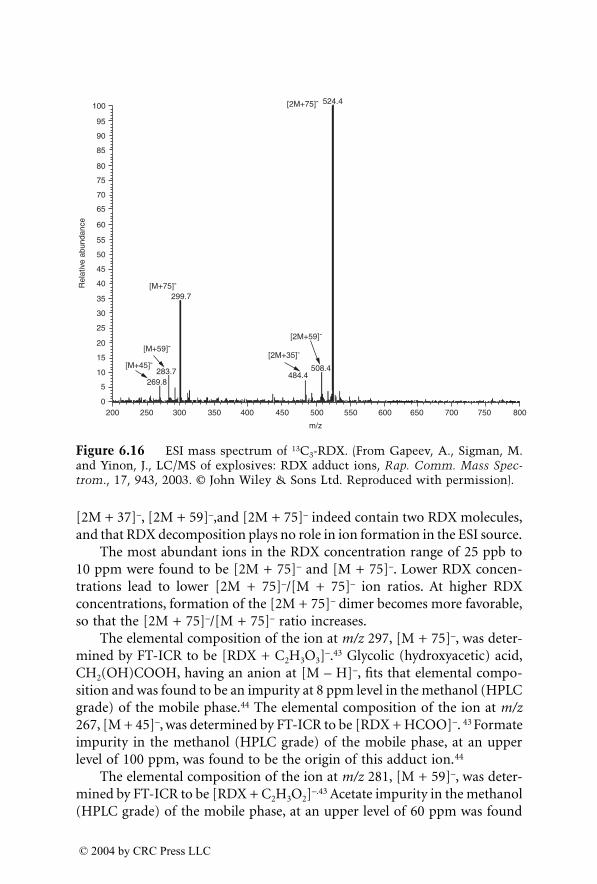
[2M + 37]–, [2M + 59]–,and [2M + 75]– indeed contain two RDX molecules,and that RDX decomposition plays no role in ion formation in the ESI source.
The most abundant ions in the RDX concentration range of 25 ppb to10 ppm were found to be [2M + 75]– and [M + 75]–. Lower RDX concen-trations lead to lower [2M + 75]–/[M + 75]– ion ratios. At higher RDXconcentrations, formation of the [2M + 75]– dimer becomes more favorable,so that the [2M + 75]–/[M + 75]– ratio increases.
The elemental composition of the ion at m/z 297, [M + 75]–, was deter-mined by FT-ICR to be [RDX + C2H3O3]–.43 Glycolic (hydroxyacetic) acid,CH2(OH)COOH, having an anion at [M – H]–, fits that elemental compo-sition and was found to be an impurity at 8 ppm level in the methanol (HPLCgrade) of the mobile phase.44 The elemental composition of the ion at m/z267, [M + 45]–, was determined by FT-ICR to be [RDX + HCOO]–. 43 Formateimpurity in the methanol (HPLC grade) of the mobile phase, at an upperlevel of 100 ppm, was found to be the origin of this adduct ion.44
The elemental composition of the ion at m/z 281, [M + 59]–, was deter-mined by FT-ICR to be [RDX + C2H3O2]–.43 Acetate impurity in the methanol(HPLC grade) of the mobile phase, at an upper level of 60 ppm was found
Figure 6.16 ESI mass spectrum of 13C3-RDX. (From Gapeev, A., Sigman, M.and Yinon, J., LC/MS of explosives: RDX adduct ions, Rap. Comm. Mass Spec-trom., 17, 943, 2003. © John Wiley & Sons Ltd. Reproduced with permission).
200 250 300 350 400 450 500 550 600 650 700 750 8000
5
10
15
20
25
30
35
40
45
50
55
60
65
70
75
80
85
90
95
100
Rel
ativ
e ab
unda
nce
[2M+35]-
[2M+59]-
[2M+75]-
[M+45]-
[M+75]-
[M+59]-
299.7
269.8283.7 484.4
508.4
m/z
524.4
1522_book.fm Page 258 Thursday, November 13, 2003 9:58 AM
© 2004 by CRC Press LLC
to be the origin of this adduct ion.44 When using purge-and-trap-gradedistilled methanol, instead of HPLC grade, the abundances of the [M + 45]–
and [M + 59]– ions were found to be lower.44
In APCI, which is a soft gas-phase ionization technique, part of the RDXmolecules decompose, yielding NO2
– species which in turn cluster with asecond RDX molecule, producing abundant [M + NO2]– cluster ions. Thiswas confirmed by using 15N6-RDX.44 The ion [M + 45]– in the APCI massspectrum of RDX was shifted by 7 mass units, when using 15N6-RDX, whichsupports the [M + NO2]– interpretation. Addition of 0.1 mM formate orchlorate in the mobile phase suppressed NO2 formation, thus making pos-sible the formation of a desired adduct ion.
6.3.3 Nitrate Ester Explosives
Three well-known explosives in this group are pentaerythritol tetranitrate(PETN), nitroglycerin (glycerol trinitrate, NG), and ethylene glycol dinitrate(EGDN) (Scheme 7).
PETN is a white, crystalline explosive used as a base charge in blastingcaps and detonators, as the core explosive in commercial detonating cord, in
Figure 6.17 ESI mass spectrum of 15N6-RDX. (From Gapeev, A., Sigman, M.and Yinon, J., LC/MS of explosives: RDX adduct ions, Rap. Comm. Mass Spec-trom., 17, 943, 2003. © John Wiley & Sons Ltd. Reproduced with permission).
Rel
ativ
e ab
unda
nce
100
90
95
85
80
75
70
65
55
45
35
25
60
50
40
30
20
15
10
5
0800
[M+75]
[M+59]
[M+45]
[2M+35]
[2M+59]
[2M+75]
302.6
226.6 272286.7
514.4
490.4
200 250 300 350 400 450 500 550 600 650 700 750
m/z
530.4
1522_book.fm Page 259 Thursday, November 13, 2003 9:58 AM
© 2004 by CRC Press LLC
booster charges, and in plastic explosives (such as Semtex andDetasheet).1,20,28 The chemical stability of PETN is very high. It is highlysensitive to impact and to initiation by explosion, but not very sensitive tofriction. Its melting point is 141˚C. It is most soluble in acetone (20 g/100 gat 20˚C) and in ethyl acetate (6.3 g/100 g at 19˚C), and very slightly solublein water (0.2 mg/100 g at 20˚C). Its vapor pressure at 25o C is 1.4 ¥ 10–8 Torr.
NG is a colorless, odorless, and viscous liquid with a burning sweetishtaste.1,20,28 NG has been the main component in many dynamites and is aningredient in multibase propellants.28 It is very sensitive to shock, impact,and friction, and is used only when desensitized with other liquids or absor-bent solids, or when mixed with nitrocellulose. NG is also used as a vasodi-lator in the treatment of angina pectoris. Its melting point is 13.2˚C, and itis miscible with ether, acetone, chloroform, ethyl acetate, dichloroethylene,benzene, and nitrobenzene. Solubility in water is 0.15 g/100 g. Its vaporpressure is 2.5 m Torr at 20˚C.
EGDN (also known as nitroglycol) is a transparent, colorless, liquidexplosive. It is less sensitive to impact than NG and is considered to be morestable than NG. EGDN is very soluble in acetone, benzene, ethanol, diethylether, chloroform, and toluene. Its solubility in water at 20˚C is 0.5 g/100 g.Its vapor pressure is 70 m Torr at 25o C. EGDN has been used in mixturewith NG for low-temperature dynamites, as its melting point is –22.8o C.
Several additives were tested with a series of explosives, including EGDN,NG, and PETN.22 Mobile phase of methanol–water (50:50) with 1 mMammonium nitrate as additive produced best results, forming major [M +NO3]– ions. EGDN formed nitrate adduct ions only for sample sizes of atleast 500 ng. The base peak in the ESI mass spectrum of NG was at m/z 289,[M + NO3]–, but it had also an ion at m/z 226, [M – H]–, having a 35%abundance.
Electrospray ionization coupled with tandem mass spectrometry wasused for the analysis of a series of explosives, including NG and PETN.21
Analyses were performed with a Perkin–Elmer Sciex API III-PLUS triplequadrupole mass spectrometer with electrospray ionization. Standard solu-tions of NG and PETN were made in acetonitrile–water (50:50), containing
Scheme 7
CHONO2
CH2ONO2
CH2ONO2
NG
CH2ONO2
CH2ONO2
EGDN
CO2NOCH2 CH2ONO2
CH2ONO2
CH2ONO2
PETN
1522_book.fm Page 260 Thursday, November 13, 2003 9:58 AM
© 2004 by CRC Press LLC
2 mM of ammonium acetate. The solutions were introduced directly into theion source by means of a syringe pump at a flow rate of 5 ml/min.
The base peak in the mass spectrum of PETN was at m/z 281, interpretedas [M + CH3COO]–, the additive originating from the ammonium acetate.Additional ions observed were [M – H]– at m/z 315 and a formate adduction, [M + HCOO]–, which originated from formic acid background, used inprevious experiments.
A comprehensive study on LC/MS of nitrate esters, including EGDN,NG, and PETN, was carried out using a Thermo–Finnigan LCQDUO ion trapmass spectrometer, with ESI and APCI in the negative-ion mode.45 Postcol-umn additives were investigated for the promotion of characteristic adductions. In ESI, additives were ammonium nitrate, sodium nitrite, propionicacid, and ammonium chloride. Additives were dissolved in methanol–water(70:30) and introduced postcolumn by a syringe pump through a T unioninto the LC flow before entering the ion source of the mass spectrometer.The characteristic adduct ions observed were [M + NO3]–, [M + NO2]–, [M+ CH3CH2CO2]–, and [M + Cl]–, respectively. Table 6.3 shows the limits ofdetection of the three explosives for each one of the additives.
Without additive, the major ions in the ESI mass spectrum of PETN are[M + 45]– at m/z 361, [M + 59]– at m/z 375, and [M + 75]– at m/z 391. In NGthe major ions observed without additive are [M + 45]– at m/z 272 [M + 75]–
at m/z 302, and [2M + 75]– at m/z 529. These adduct ions can probably beinterpreted as originating from impurities in the solvent, as proven with RDX.44
Adduct ion formation in APCI of nitrate ester explosives was investigatedusing dichloromethane, chloroform, carbon tetrachloride, and ammoniumchloride as additives.45 In APCI, both vaporizer and heated capillary temper-atures have great impact on the adduct ion formation. Except for dichlo-romethane, which required a vaporizer temperature of 330˚C, the otheradditives produced intense [M + Cl]– ions at vaporizer temperature of 150˚C.These adduct ions are easily recognizable by their isotopic composition:[M + 35Cl]– and [M + 37Cl]–. Heated capillary temperatures were in the range
Table 6.3 LC/MS-ESI Limits of Detection (pg/mmmmL) of Nitrate Ester Explosives
Additive NH4NO3 NaNO2 Propionic acid NH4ClAdduct ion [M + NO3]– [M + NO2]– [M + CH3CH2CO2]– [M + Cl]–
PETN 5 10 10 10NG 5 20 25 10EGDN 2000 10000 ND* 2500
* ND: not detected
Source: Reprinted from Zhao, X. and Yinon, J., Identification of nitrate ester explosives byliquid chromatography-electrospray ionization and atmospheric pressure chemical ionizationmass spectrometry, J. Chromatogr. A, 977, 59, Copyright 2002, with permission from Elsevier.
1522_book.fm Page 261 Thursday, November 13, 2003 9:58 AM
© 2004 by CRC Press LLC
of 125 to 130˚C. Chloroform and ammonium chloride produced the bestsensitivity for adduct ion formation. Lowest detection limits for PETN, NG,and EGDN were 10, 20 pg/ml, and 2.5 ng/ml, respectively.
Figure 6.18 shows the APCI-MS/MS mass spectrum of the [M + 35Cl]–
ion of PETN.A series of explosives, including NG and PETN, were analyzed by nega-
tive-ion APCI mass spectrometry, using a Finnigan LCQ ion trap mass spec-trometer.42 Samples were introduced by infusion with a syringe pump intothe LC stream, which consisted of methanol–water (50:50). Addition ofammonium chloride to the mobile phase at a final concentration of 0.5 mM,produced [M + Cl]– ions and improved the detection limits by one order ofmagnitude, compared to mass spectra without additive.
6.3.4 Various Explosives and Oxidizers
Electrospray ionization coupled with tandem mass spectrometry was usedfor the analysis of a series of explosives, including hexanitrostilbene (HNS)and hexanitrodiphenylamine (hexyl) (Scheme 8).21,32 Analyses were per-formed with a Perkin–Elmer Sciex API III-PLUS triple quadrupole mass
Figure 6.18 APCI-MS/MS mass spectrum of the [M + 35Cl]- ion of PETN(Reprinted from Zhao, X. and Yinon, J., Identification of nitrate ester explosivesby liquid chromatography-electrospray ionization and atmospheric pressurechemical ionization mass spectrometry, J. Chromatogr. A, 977, 59, 2002. Copy-right 2002, with permission from Elsevier Science.)
Rel
ativ
e ab
unda
nce
[P - 35Cl - H]−
315
P = [M + 35Cl]−
351
[ONO2 + NO2 + H]−
[P - 35Cl - 2ONO2]−
192109
100 120 140 160 180 200 220 240 260 280 300 320 340
m/z
PETN
0
10
100
90
80
70
60
50
40
30
20
1522_book.fm Page 262 Thursday, November 13, 2003 9:58 AM
© 2004 by CRC Press LLC
spectrometer with electrospray ionization in the negative-ion mode. Stan-dard solutions of HNS and hexyl were made in dimethylformamide anddiluted with acetonitrile. The solutions were introduced through the HPLC,using a gradient mobile phase consisting of 5 mM aqueous ammoniumacetate and acetonitrile saturated with ammonium acetate, at a constant flowrate of 1.0 ml/min. The ESI mass spectra of HNS and hexyl contained mainlyan [M – H]– ion at m/z 449 and m/z 438, respectively. The MS/MS massspectra of the [M – H]– ions showed characteristic fragment ions at m/z 403for HNS, assigned as [M – H – NO2]–, and at m/z 362 for hexyl, assigned as[M – H – NO – NO2]–.
Hexamethylenetriperoxidediamine (HMTD) (Scheme 9) is a white solidorganic peroxide explosive. It is highly sensitive to initiation by impact,friction, and electrical discharge. APCI mass spectrometry in the positive-ion mode was used for the analysis of HMTD.46 The instrument used was aThermo–Finnigan Navigator quadrupole mass spectrometer. A solution ofHMTD in acetone was injected through the HPLC, using a mobile phase ofmethanol–water (5:95) without an additive. The base peak at m/z 209 wasassigned as the [M + H]+ ion. Less intense fragment ions were observed atm/z 62, 90, 106, 179, and 207.
ESI-MS of ammonium nitrate and a group of additional inorganic oxidizerswas studied using a Thermo–Finnigan LCQDUO ion trap mass spectrometer.47,48
Ammonium nitrate (AN) (NH4NO3) is an odorless, hygroscopic, whitesolid, used as a solid oxidizer in explosive mixtures such as ANFO, slurries,and emulsions.1 Oxidizers included sodium nitrate (NaNO3), potassiumnitrate (KNO3), ammonium sulfate [(NH4)2SO4], potassium sulfate (K2SO4),
Scheme 8
Scheme 9
NO2 NO2
O2N N
H NO2
NO2
NO2
HEXYL
NO2 NO2
O2N CH CH
NO2
NO2
NO2
HNS
N NO OCH2 CH2
O OCH2 CH2
O OCH2 CH2
HMTD
1522_book.fm Page 263 Thursday, November 13, 2003 9:58 AM
© 2004 by CRC Press LLC
sodium chlorate (NaClO3), potassium chlorate (KClO3), ammonium per-chlorate (NH4ClO4), and sodium perchlorate (NaClO4). Isotopically labeledcompounds [15NH4NO3, NH4
15NO3, NH4N18O3, Na15NO3, and (15NH4)2SO4]were used to confirm ion characterization. Solutions of ammonium nitratewere prepared in methanol–water (50:50) and in pure methanol. Solutionsof other oxidizers were prepared in water and diluted in methanol–water(50:50). Solutions were introduced into the mass spectrometer by syringepump infusion at a flow rate of 5 ml/min. Heated capillary temperatures werein the range of 55 to 250oC.
It was found that in the ESI mass spectrum of AN, at heated capillarytemperatures of 55 to 150oC, in the positive-ion mode, cluster ions of thetype [(NH4NO3)nNH4]+ (n = 1–3) were dominant, which enabled character-ization and identification of the integral ammonium nitrate molecule. Figure6.19 47 shows the full-scan positive-ion ESI mass spectra at heated capillaryof 100oC, of (a) 1 mM NH4NO3, (b) 1 mM NH4
15NO3, (c) 1 mM 15NH4NO3,and (d) 1 mM NH4N18O3 in methanol–water (50:50) introduced by syringepump infusion.
Characteristic ESI mass spectra of other oxidizers could be obtained inboth positive- and negative-ion mode, and over a wider range of tempera-tures of the heated capillary.48 An exception is ammonium sulfate for whichonly the positive-ion mass spectrum produced characteristic cluster ions.Figure 6.20 48 shows the full-scan positive-(upper trace) and negative-ion(lower trace) ESI mass spectra, at heated capillary of 220oC, of 1 mM ammo-nium perchlorate in methanol–water (50:50). Table 6.4 shows the character-istic ESI ions, in both positive- and negative-ion modes of explosive oxidizers.
6.3.5 Military, Commercial, and Other Explosive Mixtures
ESI and APCI in the negative-ion mode were compared for the analysis of amixture of explosives, using a Hewlett–Packard 5989B LC/MS mass spec-trometer with a HP 1090L HPLC.24 The mixture contained 14 standardcompounds (Table 6.5). HPLC column was HP Hypersil BDS, 100 mm ¥ 4mm ID, 3 mm particle size. Mobile phase consisted of methanol–water witha gradient of 26 to 40% methanol at 10 min to 53% methanol at 20 min, ata flow rate of 0.72 ml/min. Figure 6.21 shows the total ion chromatogramsobtained in APCI and ESI. As can be seen, not all the components could bedetected in either mode of ionization.
Table 6.5 shows the base peak ions in ESI and APCI. In ESI of RDX,HMX and tetryl, the major ion is the adduct ion [M + TFA]–, the TFAprobably originating from residue background.
In APCI of tetryl, the major ions are at m/z 242, [M* – H]– and m/z 212,[M* – NO]–, where M* represents N-methylpicramide, a hydrolysis productof tetryl.
1522_book.fm Page 264 Thursday, November 13, 2003 9:58 AM
© 2004 by CRC Press LLC
Chloride adduct ion formation for a series of explosives was investigatedin negative-ion APCI-MS, using a Finnigan LCQ ion trap mass spectrome-ter.41 Chloride adduct ion formation was studied in 5-nitro-2,4-dihydro-3H-1,2,4-triazol-3-one (NTO), nitroguanidine (NQ), RDX, HMX, 2,4,6,8,10,12-hexanitro-2,4,6,8,10,12-hexazaisowurtzitane (CL-20), TNT, tetryl, andPETN. Limits of detection obtained were 40, 60, 12, 52, 10, 19, 25, and 12ppb, respectively.
A Finnigan LCQ ion trap mass spectrometer was used to study the ESImass spectra of RDX and its degradation products MNX and TNX, as wellas HMX, TNB, TNT, DNT, and 2-A-4,6-DNT in ground water.38 Solid phaseextraction (SPE) cartridges were used to concentrate samples. HPLC sepa-ration was achieved with a Kromasil C8 reversed-phase column (250 ¥ 2 mmID), using an isocratic mobile phase of isopropanol–water–ammonium
Figure 6.19 Full scan positive-ion ESI mass spectra at heated capillary of 100o
C, of (a) 1 mM NH4NO3, (b) 1 mM NH415NO3, (c) 1 mM 15NH4NO3 and (d) 1 mM
NH4N18O3 in methanol–water (50:50) introduced by syringe pump infusion. (FromZhao, X. and Yinon, J., Characterization of ammonium nitrate by electrosprayionization tandem mass spectrometry, Rap. Comm. Mass Spectrom., 15, 1514,2001. © John Wiley & Sons Ltd. Reproduced with permission).
1522_book.fm Page 265 Thursday, November 13, 2003 9:58 AM
© 2004 by CRC Press LLC
Figure 6.20 Full-scan positive-(upper trace) and negative-ion (lower trace) ESImass spectra, at heated capillary of 220o C, of 1 mM ammonium perchlorate inmethanol–water (50:50) (From Zhao, X. and Yinon, J., Forensic identification ofexplosive oxidizers by electrospray ionization, Rap. Comm. Mass Spectrom., 16,1137, 2002. © John Wiley & Sons Ltd. Reproduced with permission).
Table 6.4 Characteristic Ions in ESI Mass Spectra of Explosive Oxidizers
Oxidizer Positive-ion Negative-ion
Sodium nitrate [(NaNO3)nNa]+ [(NaNO3)nNO3]–
Potassium nitrate [(KNO3)nK]+ [(KNO3)nNO3]–
Ammonium sulfate [(NH4HSO4)nNH4]+
Potassium sulfate [(K2SO4)nK]+ [(K2SO4)nKSO4]–
Sodium chlorate [(NaClO3)nNa]+ [(NaClO3)nClO3]–
Potassium chlorate [(KClO3)nK]+ [(KClO3)nClO3]–
Ammonium perchlorate [(NH4ClO4)nNH4]+ [(NH4ClO4)nClO4]–
Sodium perchlorate [(NaClO4)nNa]+ [(NaClO4)nClO4]–
Rel
ativ
e ab
unda
nce
100
80
60
40
20
0100 200 300 400 500 600 700 800 900 1000
Rel
ativ
e ab
unda
nce
100
80
60
40
20
0100 200 300 400 500 600 700 800 900 1000
[(NH4CIO4)nCIO4]−
[(NH4CIO4)nNH4]+
× 2
99.1
[CIO4]−
215.
9
332.
7
449.
8
566.
6
683.
5
800.
5
917.
5
n =
6
n =
7
n =
5
n =
4
n =
3
n =
2
n =
1
n =
6
n =
7
n =
8
n =
5
n =
4
n =
3
n =
2
n =
1
m/z
m/z
134.
8
251.
7
368.
7
485.
6
602.
5 719.
6
836.
4
953.
4
1522_book.fm Page 266 Thursday, November 13, 2003 9:58 AM
© 2004 by CRC Press LLC
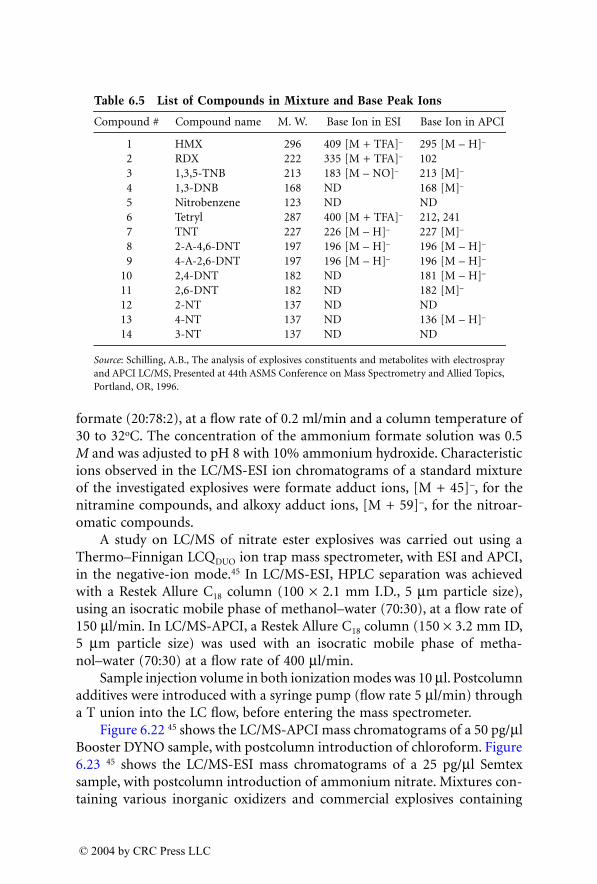
formate (20:78:2), at a flow rate of 0.2 ml/min and a column temperature of30 to 32oC. The concentration of the ammonium formate solution was 0.5M and was adjusted to pH 8 with 10% ammonium hydroxide. Characteristicions observed in the LC/MS-ESI ion chromatograms of a standard mixtureof the investigated explosives were formate adduct ions, [M + 45]–, for thenitramine compounds, and alkoxy adduct ions, [M + 59]–, for the nitroar-omatic compounds.
A study on LC/MS of nitrate ester explosives was carried out using aThermo–Finnigan LCQDUO ion trap mass spectrometer, with ESI and APCI,in the negative-ion mode.45 In LC/MS-ESI, HPLC separation was achievedwith a Restek Allure C18 column (100 ¥ 2.1 mm I.D., 5 mm particle size),using an isocratic mobile phase of methanol–water (70:30), at a flow rate of150 ml/min. In LC/MS-APCI, a Restek Allure C18 column (150 ¥ 3.2 mm ID,5 mm particle size) was used with an isocratic mobile phase of metha-nol–water (70:30) at a flow rate of 400 ml/min.
Sample injection volume in both ionization modes was 10 ml. Postcolumnadditives were introduced with a syringe pump (flow rate 5 ml/min) througha T union into the LC flow, before entering the mass spectrometer.
Figure 6.22 45 shows the LC/MS-APCI mass chromatograms of a 50 pg/mlBooster DYNO sample, with postcolumn introduction of chloroform. Figure6.23 45 shows the LC/MS-ESI mass chromatograms of a 25 pg/ml Semtexsample, with postcolumn introduction of ammonium nitrate. Mixtures con-taining various inorganic oxidizers and commercial explosives containing
Table 6.5 List of Compounds in Mixture and Base Peak Ions
Compound # Compound name M. W. Base Ion in ESI Base Ion in APCI
1 HMX 296 409 [M + TFA]– 295 [M – H]–
2 RDX 222 335 [M + TFA]– 1023 1,3,5-TNB 213 183 [M – NO]– 213 [M]–
4 1,3-DNB 168 ND 168 [M]–
5 Nitrobenzene 123 ND ND6 Tetryl 287 400 [M + TFA]– 212, 2417 TNT 227 226 [M – H]– 227 [M]–
8 2-A-4,6-DNT 197 196 [M – H]– 196 [M – H]–
9 4-A-2,6-DNT 197 196 [M – H]– 196 [M – H]–
10 2,4-DNT 182 ND 181 [M – H]–
11 2,6-DNT 182 ND 182 [M]–
12 2-NT 137 ND ND13 4-NT 137 ND 136 [M – H]–
14 3-NT 137 ND ND
Source: Schilling, A.B., The analysis of explosives constituents and metabolites with electrosprayand APCI LC/MS, Presented at 44th ASMS Conference on Mass Spectrometry and Allied Topics,Portland, OR, 1996.
1522_book.fm Page 267 Thursday, November 13, 2003 9:58 AM
© 2004 by CRC Press LLC
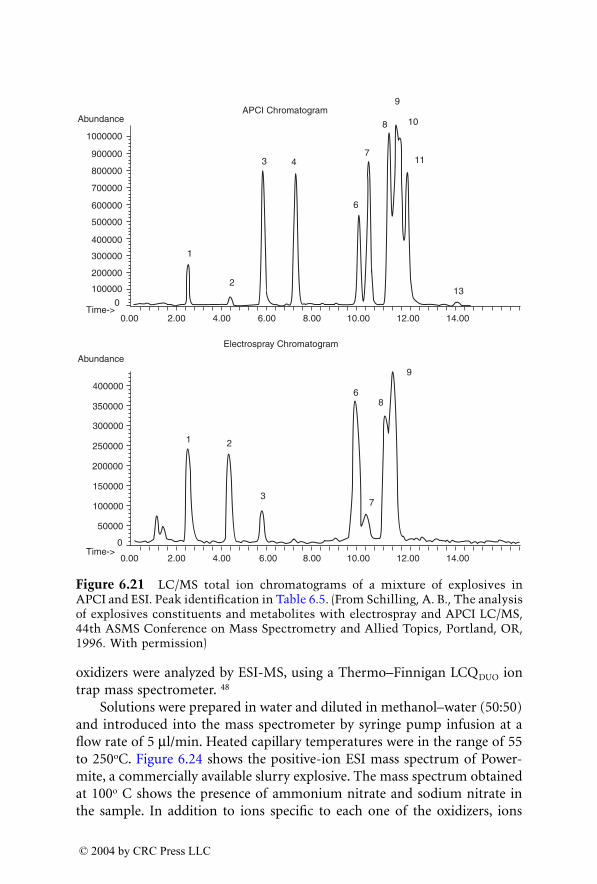
oxidizers were analyzed by ESI-MS, using a Thermo–Finnigan LCQDUO iontrap mass spectrometer. 48
Solutions were prepared in water and diluted in methanol–water (50:50)and introduced into the mass spectrometer by syringe pump infusion at aflow rate of 5 ml/min. Heated capillary temperatures were in the range of 55to 250oC. Figure 6.24 shows the positive-ion ESI mass spectrum of Power-mite, a commercially available slurry explosive. The mass spectrum obtainedat 100o C shows the presence of ammonium nitrate and sodium nitrate inthe sample. In addition to ions specific to each one of the oxidizers, ions
Figure 6.21 LC/MS total ion chromatograms of a mixture of explosives inAPCI and ESI. Peak identification in Table 6.5. (From Schilling, A. B., The analysisof explosives constituents and metabolites with electrospray and APCI LC/MS,44th ASMS Conference on Mass Spectrometry and Allied Topics, Portland, OR,1996. With permission)
Abundance
1000000
900000
800000
600000
700000
500000
400000
300000
200000
100000
0
0.00Time->
Time->
2.00 4.00 6.00 8.00 10.00 12.00 14.00
Abundance
400000
350000
300000
250000
200000
150000
100000
50000
0
0.00 2.00 4.00 6.00 8.00 10.00 12.00 14.00
Electrospray Chromatogram
APCI Chromatogram
1 2
3
6
7
8
9
1
2
3 4
6
7
8 10
11
13
9
1522_book.fm Page 268 Thursday, November 13, 2003 9:58 AM
© 2004 by CRC Press LLC
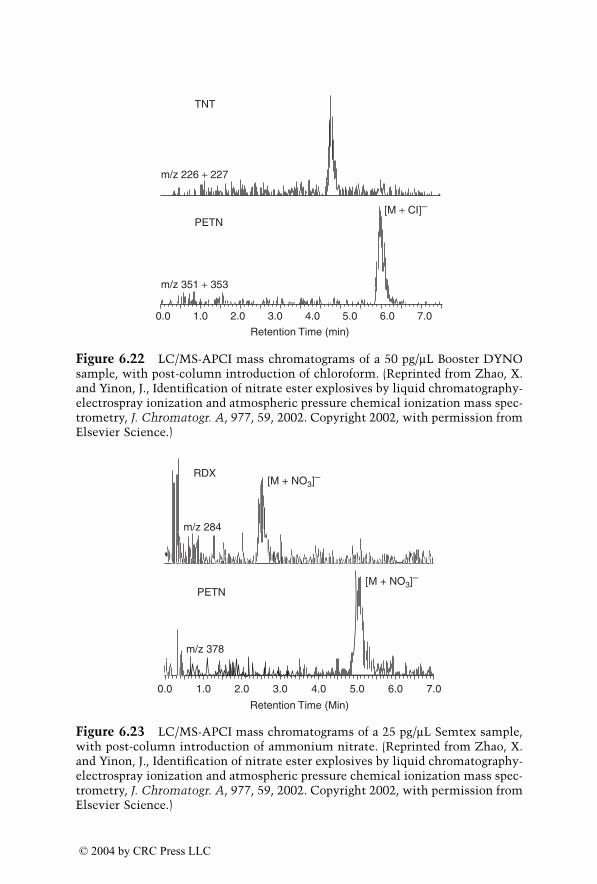
Figure 6.22 LC/MS-APCI mass chromatograms of a 50 pg/mL Booster DYNOsample, with post-column introduction of chloroform. (Reprinted from Zhao, X.and Yinon, J., Identification of nitrate ester explosives by liquid chromatography-electrospray ionization and atmospheric pressure chemical ionization mass spec-trometry, J. Chromatogr. A, 977, 59, 2002. Copyright 2002, with permission fromElsevier Science.)
Figure 6.23 LC/MS-APCI mass chromatograms of a 25 pg/mL Semtex sample,with post-column introduction of ammonium nitrate. (Reprinted from Zhao, X.and Yinon, J., Identification of nitrate ester explosives by liquid chromatography-electrospray ionization and atmospheric pressure chemical ionization mass spec-trometry, J. Chromatogr. A, 977, 59, 2002. Copyright 2002, with permission fromElsevier Science.)
0.0 1.0 2.0 3.0 4.0 5.0 6.0 7.0
m/z 351 + 353
m/z 226 + 227
PETN
TNT
[M + CI]−
Retention Time (min)
1.0 2.0 3.0 4.0 5.0 6.0 7.00.0
Retention Time (Min)
m/z 378
PETN
RDX
[M + NO3]−
[M + NO3]−
m/z 284
1522_book.fm Page 269 Thursday, November 13, 2003 9:58 AM
© 2004 by CRC Press LLC
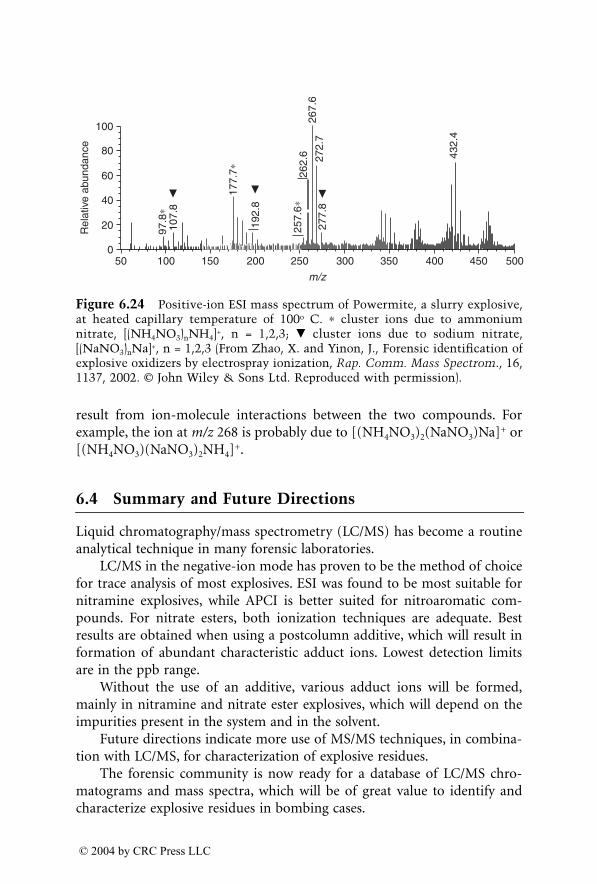
result from ion-molecule interactions between the two compounds. Forexample, the ion at m/z 268 is probably due to [(NH4NO3)2(NaNO3)Na]+ or[(NH4NO3)(NaNO3)2NH4]+.
6.4 Summary and Future Directions
Liquid chromatography/mass spectrometry (LC/MS) has become a routineanalytical technique in many forensic laboratories.
LC/MS in the negative-ion mode has proven to be the method of choicefor trace analysis of most explosives. ESI was found to be most suitable fornitramine explosives, while APCI is better suited for nitroaromatic com-pounds. For nitrate esters, both ionization techniques are adequate. Bestresults are obtained when using a postcolumn additive, which will result information of abundant characteristic adduct ions. Lowest detection limitsare in the ppb range.
Without the use of an additive, various adduct ions will be formed,mainly in nitramine and nitrate ester explosives, which will depend on theimpurities present in the system and in the solvent.
Future directions indicate more use of MS/MS techniques, in combina-tion with LC/MS, for characterization of explosive residues.
The forensic community is now ready for a database of LC/MS chro-matograms and mass spectra, which will be of great value to identify andcharacterize explosive residues in bombing cases.
Figure 6.24 Positive-ion ESI mass spectrum of Powermite, a slurry explosive,at heated capillary temperature of 100o C. * cluster ions due to ammoniumnitrate, [(NH4NO3)nNH4]+, n = 1,2,3; � cluster ions due to sodium nitrate,[(NaNO3)nNa]+, n = 1,2,3 (From Zhao, X. and Yinon, J., Forensic identification ofexplosive oxidizers by electrospray ionization, Rap. Comm. Mass Spectrom., 16,1137, 2002. © John Wiley & Sons Ltd. Reproduced with permission).
Rel
ativ
e ab
unda
nce
100
80
60
40
20
050 100 150 200 250
m/z
300 350 400 450 500
97.8
∗10
7.8
192.
8
262.
6
277.
827
2.7
267.
6
432.
4
177.
7∗
257.
6∗
1522_book.fm Page 270 Thursday, November 13, 2003 9:58 AM
© 2004 by CRC Press LLC
References
1. Yinon, J. and Zitrin, S., Modern Methods and Applications in Analysis ofExplosives, John Wiley, Chichester, U.K., 1993.
2. Abian, J., The coupling of gas and liquid chromatography with mass spec-trometry, J. Mass Spectrom., 34, 157, 1999.
3. Niessen, W.M.A., State-of-the-art in liquid chromatography-mass spectrom-etry, J. Chromatogr. A, 856, 179, 1999.
4. Lim, C.K. and Lord, G., Current developments in LC-MS for pharmaceuticalanalysis, Biol. Pharm. Bull., 25, 547, 2002.
5. Rustichelli, C., Ferioli, V., Vezzalini, F., Rossi, M.C., and Gamberini, G., Simul-taneous separation and identification of hashish constituents by coupledliquid chromatography-mass spectrometry (HPLC-MS), Chromatographia,43, 129, 1996.
6. Van Bocxlaer, J.F., Clauwaert, K.M., Lambert, W. E., Deforce, D.L., Van denEeckhout, E.G., and De Leenheer, A.P., Liquid chromatography-mass spec-trometry in forensic toxicology, Mass Spectrom. Rev., 19, 165, 2000.
7. Rivier, L., New trends in doping analysis, Chimia, 56, 84, 2002.
8. Parker, C.E., Voyksner, R.D., Tondeur, Y., Henion, J.D., Hass, J.R., and Yinon,J., Analysis of explosives by liquid chromatography-negative ion chemicalionization mass spectrometry, J. Forensic Sci., 27, 495, 1982.
9. Yinon, J. and Hwang, D.-G., High-performance liquid chromatography-massspectrometry of explosives, J. Chromatogr., 268, 45, 1983.
10. Yinon, J., Forensic analysis of explosives by LC/MS, Forensic Sci. Rev., 13, 19, 2001.
11. Voyksner, R.D. and Yinon, J., Trace analysis of explosives by thermosprayhigh-performance liquid chromatography-mass spectrometry, J. Chro-matogr., 354, 393, 1986.
12. Berberich, D.W., Yost, R.A., and Fetterolf, D.D., Analysis of explosives byliquid chromatography/thermospray/mass spectrometry, J. Forensic Sci., 33,946, 1988.
13. Cappiello, A., Famiglini, G., Lombardozzi, A., Massari, A., and Vadala, G.G.,Electron capture ionization of explosives with a microflow rate particle beaminterface, J. Am. Soc. Mass Spectrom., 7, 753, 1996.
14. Yamashita, M. and Fenn, J.B., Electrospray ion source. Another variation onthe free-jet theme., J. Phys. Chem., 88(20), 4451, 1984.
15. Fenn, J.B., Mann, M., Meng, C.K., and Wong, S.F., Electrospray ionizationfor mass spectrometry of large biomolecules, Science, 246, 64, 1989.
16. Gaskell, S.J., Electrospray — principles and practice, J. Mass Spectrom., 32,677, 1997.
17. Whitehouse, C.R., Dreyer, R.N., Yamashita, M., and Fenn, J.B., Electrosprayinterface for liquid chromatographs and mass spectrometers, Anal. Chem.,57, 675, 1985.
1522_book.fm Page 271 Thursday, November 13, 2003 9:58 AM
© 2004 by CRC Press LLC
18. Horning, E.C., New picogram detection system based on a mass spectrometerwith an external ionization source at atmospheric pressure, Anal. Chem., 45,936, 1973.
19. Urbanski, T., Chemistry and Technology of Explosives, Vol. 4, Pergamon Press,Oxford, 1984.
20. Yinon, J., Forensic and Environmental Detection of Explosives, John Wiley &Sons, Chichester, U.K., 1999.
21. Casetta, B. and Garafolo, F., Characterization of explosives by liquid chro-matography/mass spectrometry and liquid chromatography/tandem massspectrometry using electrospray ionization and parent-ion scanning tech-niques, Org. Mass Spectrom., 29, 517, 1994.
22. Miller, M.L., Leibowitz, J., and Martz, R., Additive enhancement for ESI ofnitrated explosives, Presented at 44th ASMS Conference on Mass Spectrom-etry and Allied Topics, Portland, OR, 1996, 1389.
23. Miller, M.L., The analysis of nitrated organic explosives by LC/MS: additiveenhancement, Presented at 45th ASMS Conference on Mass Spectrometryand Allied Topics, Palm Springs, CA, 1997, 52.
24. Schilling, A.B., The analysis of explosives constituents and metabolites withelectrospray and APCI LC/MS, presented at 44th ASMS Conference on MassSpectrometry and Allied Topics, Portland, OR, 1996.
25. Yinon, J., McClellan, J.E., and Yost, R.A., Electrospray ionization tandem massspectrometry collision-induced dissociation study of explosives in an ion trapmass spectrometer, Rap. Comm. Mass Spectrom., 11, 1961, 1997.
26. Zhao, X. and Yinon, J., Characterization and origin identification of 2,4,6-trinitrotoluene through its by-product isomers by liquid chromatography-atmospheric pressure chemical ionization mass spectrometry, J. Chromatogr.A, 946, 125, 2002.
27. Yinon, J., Mass spectrometry of explosives: nitro compounds, nitrate esters,and nitramines, Mass Spectrom. Rev., 1, 257, 1982.
28. Urbanski, T., Chemistry and Technology of Explosives, Vols. 1–3, McMillan,New York, 1964.
29. Tervo, J., Personal communication, 2001.
30. McClellan, J.E., Fundamentals and applications of electrospray ionization-quadrupole ion trap mass spectrometry for the analysis of explosives, Ph.D.thesis, University of Florida, Gainesville, 2000.
31. Yinon, J., Zitrin, S., and Tamiri, T., Reactions in the mass spectrometry of2,4,6-N-tetranitro-N-methylaniline (tetryl), Rap. Comm. Mass Spectrom., 7,1051, 1993.
32. Garafolo, F., Longo, A., Migliozzi, V., and Tallarico, C., Quantitative analysisof thermostable explosive compounds by combined liquid chromatogra-phy/tandem mass spectrometry, Rap. Comm. Mass Spectrom., 10, 1273, 1996.
1522_book.fm Page 272 Thursday, November 13, 2003 9:58 AM
© 2004 by CRC Press LLC
33. Schreiber, A., Efer, J., and Engewald, W., Application of spectral libraries forhigh-performance liquid chromatography-atmospheric pressure ionizationmass spectrometry to the analysis of pesticide and explosive residues in envi-ronmental samples., J. Chromatogr. A, 869, 2000.
34. Yinon, J., Identification of explosives by chemical ionization mass spectrom-etry using water as reagent, Biom. Mass Spectrom., 1, 393, 1974.
35. Zitrin, S. and Yinon, J., Chemical ionization mass spectrometry of explosives,in Advances in Mass Spectrometry in Biochemistry and Medicine, Vol. 1, Frige-rio, A. and Castagnoli, N., Eds., Spectrum Publications, New York, 1976, 369.
36. Yinon, J., Analysis of explosives by negative ion chemical ionization massspectrometry, J. Forensic Sci., 25, 401, 1980.
37. Yinon, J., Direct exposure chemical ionization mass spectra of explosives,Org. Mass Spectrom., 15, 637, 1980.
38. Cassada, D.A., Monson, S.J., Snow, D.D., and Spalding, R.F., Sensitive deter-mination of RDX, nitroso-RDX metabolites, and other munitions in groundwater by solid-phase extraction and isotope dilution liquid chromatography-atmospheric pressure electrospray ionization mass spectrometry, J. Chro-matogr. A, 844, 87, 1999.
39. Beller, H.R. and Tiemeier, K., Use of liquid chromatography/tandem massspectrometry to detect distinctive indicators of in situ RDX transformationin contaminated groundwater, Environ. Sci. Technol., 36, 2060, 2002.
40. Asbury, G.R., Klasmeier, J., and Hill, H.H., Jr., Analysis of explosives usingelectrospray ionization/ion mobility spectrometry (ESI/IMS), Talanta, 50,1291, 2000.
41. Reich, R.F. and Yost, R.A., Trace detection and quantitation of explosivesusing LC/APCI-MS, 49th Annual ASMS Conference on Mass Spectrometryand Allied Topics., Chicago, IL, 2001.
42. Evans, C.S., Sleeman, R., Luke, J., and Keely, B.J., A rapid and efficient massspectrometric method for the analysis of explosives, Rap. Comm. Mass Spec-trom., 16, 1883, 2002.
43. Wu, Z., Hendrickson, C.L., Rodgers, R.P., and Marshall, A.G., Compositionof explosives by electrospray ionization Fourier transform ion cyclotron res-onance mass spectrometry, Anal. Chem., 74, 1879, 2002.
44. Gapeev, A., Sigman, M. and Yinon, J., LC/MS of explosives: RDX adduct ions,Rap. Comm.. Mass Spectrom., 17, 943, 2003.
45. Zhao, X. and Yinon, J., Identification of nitrate ester explosives by liquidchromatography-electrospray ionization and atmospheric pressure chemicalionization mass spectrometry, J. Chromatogr. A, 977, 59, 2002.
46. Crowson, A. and Beardah, M.S., Development of an LC/MS method for thetrace analysis of hexamethylenetriperoxidediamine (HMTD), Analyst, 126,1689, 2001.
1522_book.fm Page 273 Thursday, November 13, 2003 9:58 AM
© 2004 by CRC Press LLC
47. Zhao, X. and Yinon, J., Characterization of ammonium nitrate by electrosprayionization tandem mass spectrometry, Rap. Comm. Mass Spectrom., 15, 1514,2001.
48. 48. Zhao, X. and Yinon, J., Forensic identification of explosive oxidizers byelectrospray ionization, Rap. Comm. Mass Spectrom., 16, 1137, 2002.
1522_book.fm Page 274 Thursday, November 13, 2003 9:58 AM
© 2004 by CRC Press LLC