Embed Size (px)
Citation preview
Insights into the Connected Consumer Survey 2015
© Analysys Mason Limited 2015
WHITE PAPER
analysysmason.com
Insights into the Connected Consumer Survey 2015
30/3/15
Martin Scott and Patrick Rusby
Insights into the Connected Consumer Survey 2015
© Analysys Mason Limited 2015
KEY QUESTIONS ANSWERED IN THE CONNECTED
CONSUMER SURVEY 2015 REPORT SERIES
WHO NEEDS TO READ THESE REPORTS
How can mobile operators improve customer retention – what are the
drivers of churn and what attracts customers to a new deal?
How can fixed broadband operators reduce churn and do fixed–mobile
convergent bundles improve customer retention?
How can operators address OTT messaging and voice services – do
unlimited minutes or SMS bundles work?
Does OTT video compete with pay TV, or can both services be
complementary – does the role of pay-TV providers change as OTT
services become more popular?
Which demographic groupings use mobile money services, and are these
services successful?
2
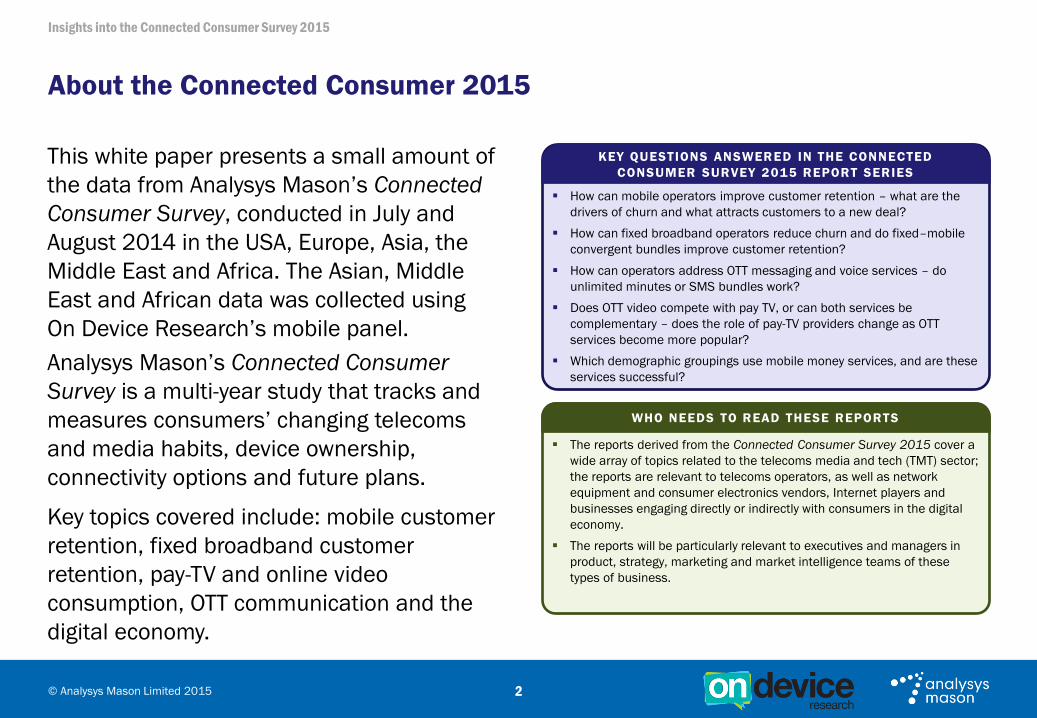
This white paper presents a small amount of
the data from Analysys Mason’s Connected
Consumer Survey, conducted in July and
August 2014 in the USA, Europe, Asia, the
Middle East and Africa. The Asian, Middle
East and African data was collected using
On Device Research’s mobile panel.
Analysys Mason’s Connected Consumer
Survey is a multi-year study that tracks and
measures consumers’ changing telecoms
and media habits, device ownership,
connectivity options and future plans.
Key topics covered include: mobile customer
retention, fixed broadband customer
retention, pay-TV and online video
consumption, OTT communication and the
digital economy.
About the Connected Consumer 2015
The reports derived from the Connected Consumer Survey 2015 cover a
wide array of topics related to the telecoms media and tech (TMT) sector;
the reports are relevant to telecoms operators, as well as network
equipment and consumer electronics vendors, Internet players and
businesses engaging directly or indirectly with consumers in the digital
economy.
The reports will be particularly relevant to executives and managers in
product, strategy, marketing and market intelligence teams of these
types of business.

Insights into the Connected Consumer Survey 2015
© Analysys Mason Limited 2015 3
Geographical coverage of Connected Consumer 2015
Online survey – Survey
Sampling International
Browser based mobile survey
– On Device Research
USA
UK
Spain
France
Germany
Poland
Turkey
Morocco
Saudi
Arabia
UAE
South
Africa
South
Korea
Malaysia
Indonesia
Qatar
Insights into the Connected Consumer Survey 2015
© Analysys Mason Limited 2015
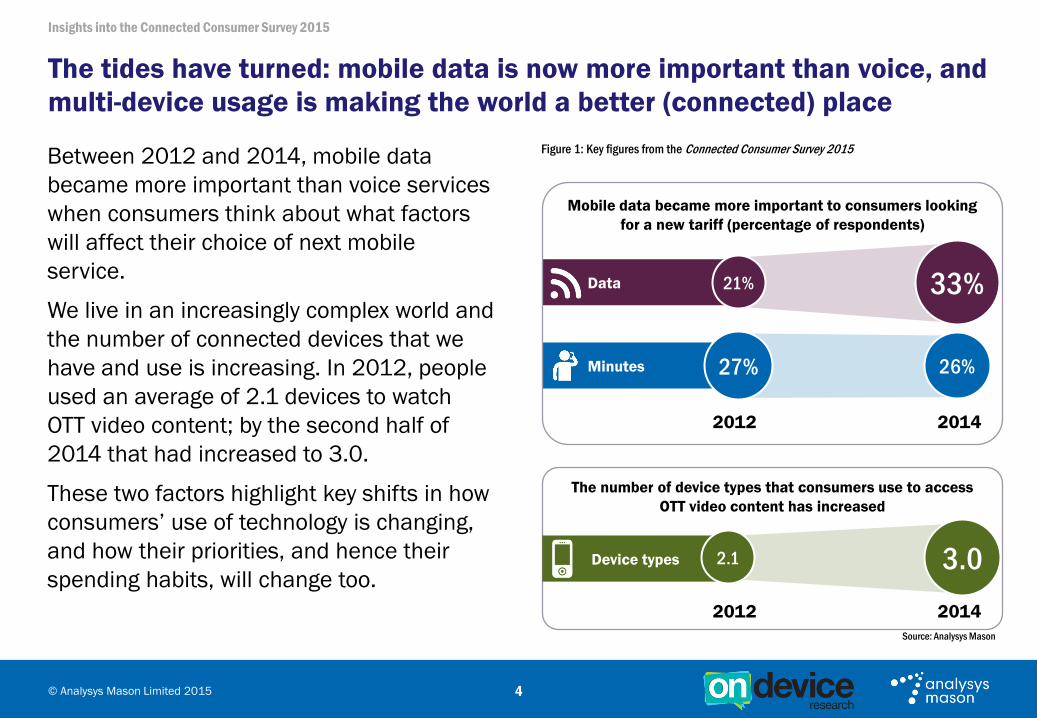
Figure 1: Key figures from the Connected Consumer Survey 2015
4
Between 2012 and 2014, mobile data
became more important than voice services
when consumers think about what factors
will affect their choice of next mobile
service.
We live in an increasingly complex world and
the number of connected devices that we
have and use is increasing. In 2012, people
used an average of 2.1 devices to watch
OTT video content; by the second half of
2014 that had increased to 3.0.
These two factors highlight key shifts in how
consumers’ use of technology is changing,
and how their priorities, and hence their
spending habits, will change too.
The tides have turned: mobile data is now more important than voice, and
multi-device usage is making the world a better (connected) place
Data
Minutes
21%
27%
33%
26%
Mobile data became more important to consumers looking
for a new tariff (percentage of respondents)
2012 2014
The number of device types that consumers use to access
OTT video content has increased
2012 2014
Device types 2.1 3.0
Source: Analysys Mason
Insights into the Connected Consumer Survey 2015
© Analysys Mason Limited 2015 5
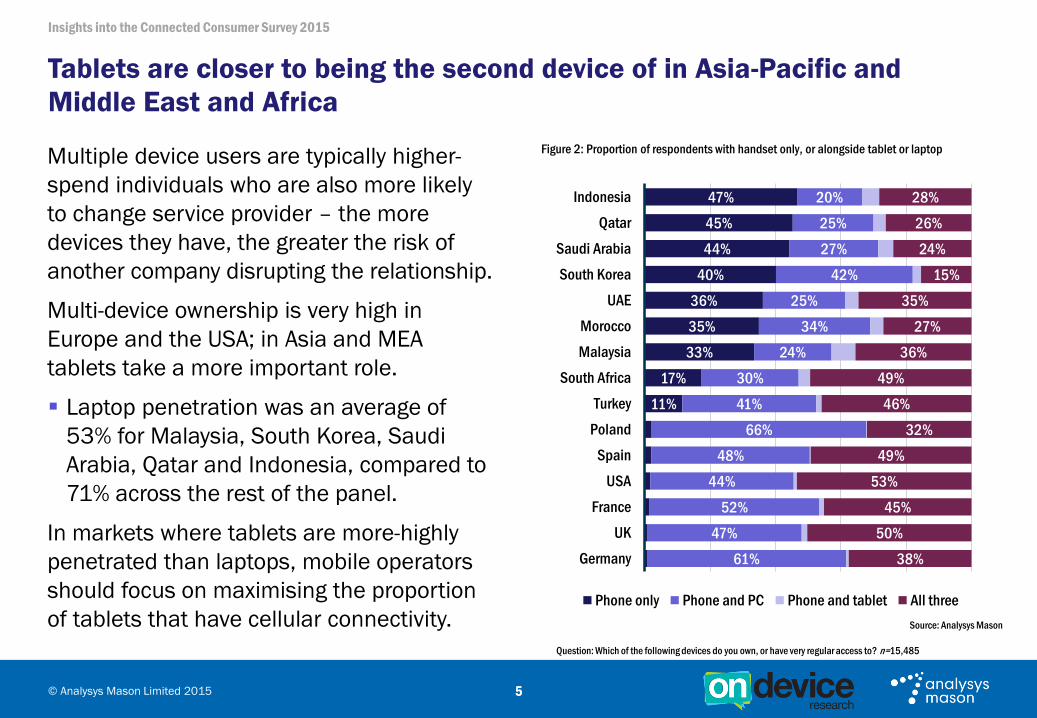
Multiple device users are typically higher-
spend individuals who are also more likely
to change service provider – the more
devices they have, the greater the risk of
another company disrupting the relationship.
Multi-device ownership is very high in
Europe and the USA; in Asia and MEA
tablets take a more important role.
Laptop penetration was an average of
53% for Malaysia, South Korea, Saudi
Arabia, Qatar and Indonesia, compared to
71% across the rest of the panel.
In markets where tablets are more-highly
penetrated than laptops, mobile operators
should focus on maximising the proportion
of tablets that have cellular connectivity.
Tablets are closer to being the second device of in Asia-Pacific and
Middle East and Africa
Figure 2: Proportion of respondents with handset only, or alongside tablet or laptop
Source: Analysys Mason
Question: Which of the following devices do you own, or have very regular access to? n=15,485
11%
17%
33%
35%
36%
40%
44%
45%
47%
61%
47%
52%
44%
48%
66%
41%
30%
24%
34%
25%
42%
27%
25%
20%
38%
50%
45%
53%
49%
32%
46%
49%
36%
27%
35%
15%
24%
26%
28%
Germany
UK
France
USA
Spain
Poland
Turkey
South Africa
Malaysia
Morocco
UAE
South Korea
Saudi Arabia
Qatar
Indonesia
Phone only Phone and PC Phone and tablet All three
Insights into the Connected Consumer Survey 2015
© Analysys Mason Limited 2015
iPhone
users
iPad
users
Laptop
users
Smartphone
users
Tablet
users
Laptop
users
8% of Apple
device owners use
all three devices
from Apple
2% of Samsung
device owners use
all three devices
from Samsung
2.43 hours
per day per Apple
device
2.03 hours
per day per
Samsung device
Source: Analysys Mason
Questions: Which of the following devices do you own, or have very regular access to? n=7,485
What is the manufacturer/brand of your most used phone? n=7,052
You stated earlier that you own or have access to a tablet. What is the brand of the tablet? n=3,344
What is the brand of your most-used laptop? n=5,705
6
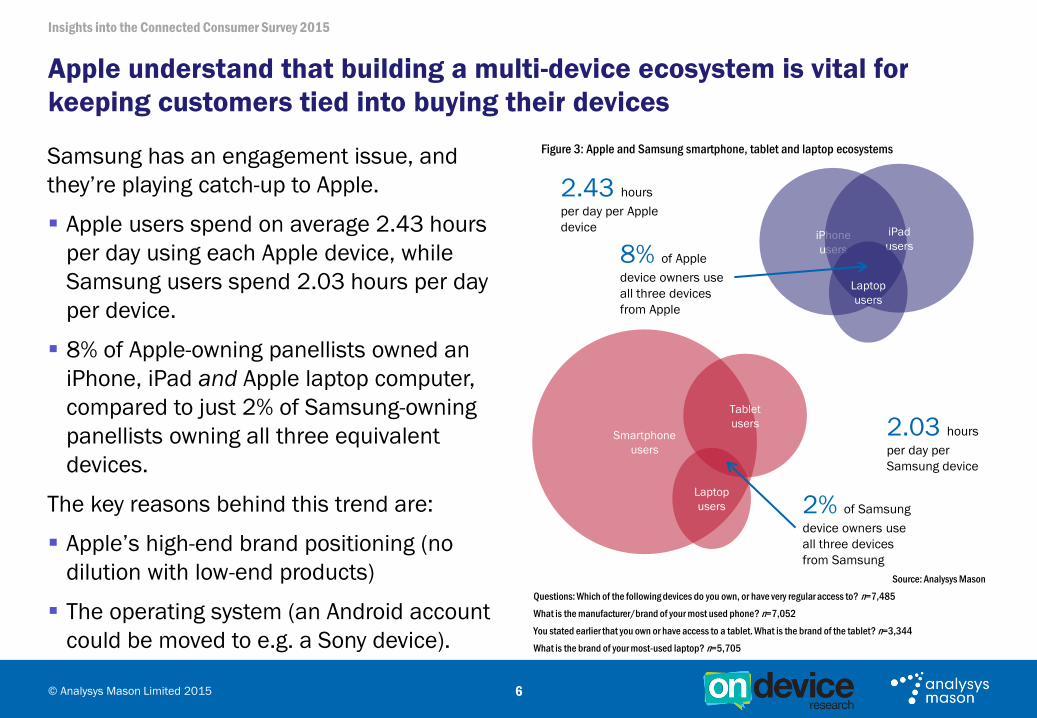
Samsung has an engagement issue, and
they’re playing catch-up to Apple.
Apple users spend on average 2.43 hours
per day using each Apple device, while
Samsung users spend 2.03 hours per day
per device.
8% of Apple-owning panellists owned an
iPhone, iPad and Apple laptop computer,
compared to just 2% of Samsung-owning
panellists owning all three equivalent
devices.
The key reasons behind this trend are:
Apple’s high-end brand positioning (no
dilution with low-end products)
The operating system (an Android account
could be moved to e.g. a Sony device).
Apple understand that building a multi-device ecosystem is vital for
keeping customers tied into buying their devices
Figure 3: Apple and Samsung smartphone, tablet and laptop ecosystems
Insights into the Connected Consumer Survey 2015
© Analysys Mason Limited 2015
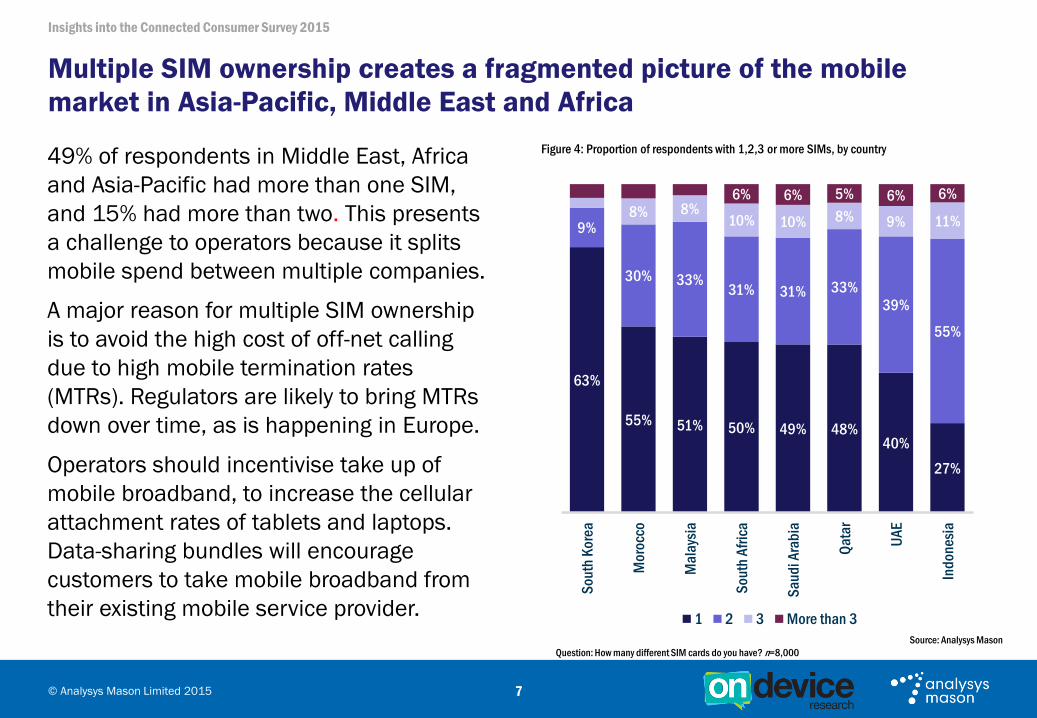
Figure 4: Proportion of respondents with 1,2,3 or more SIMs, by country
7
49% of respondents in Middle East, Africa
and Asia-Pacific had more than one SIM,
and 15% had more than two. This presents
a challenge to operators because it splits
mobile spend between multiple companies.
A major reason for multiple SIM ownership
is to avoid the high cost of off-net calling
due to high mobile termination rates
(MTRs). Regulators are likely to bring MTRs
down over time, as is happening in Europe.
Operators should incentivise take up of
mobile broadband, to increase the cellular
attachment rates of tablets and laptops.
Data-sharing bundles will encourage
customers to take mobile broadband from
their existing mobile service provider.
Multiple SIM ownership creates a fragmented picture of the mobile
market in Asia-Pacific, Middle East and Africa
Source: Analysys Mason
Question: How many different SIM cards do you have? n=8,000
63%
55% 51% 50% 49% 48%40%
27%
9%
30% 33%31% 31% 33%
39%
55%
8% 8%10% 10% 8% 9% 11%
6% 6% 5% 6% 6%
So
uth
Ko
rea
Mo
rocc
o
Ma
lays
ia
So
uth
Afr
ica
Sa
ud
i Ara
bia
Qa
tar
UA
E
Ind
on
esia
1 2 3 More than 3
Insights into the Connected Consumer Survey 2015
© Analysys Mason Limited 2015
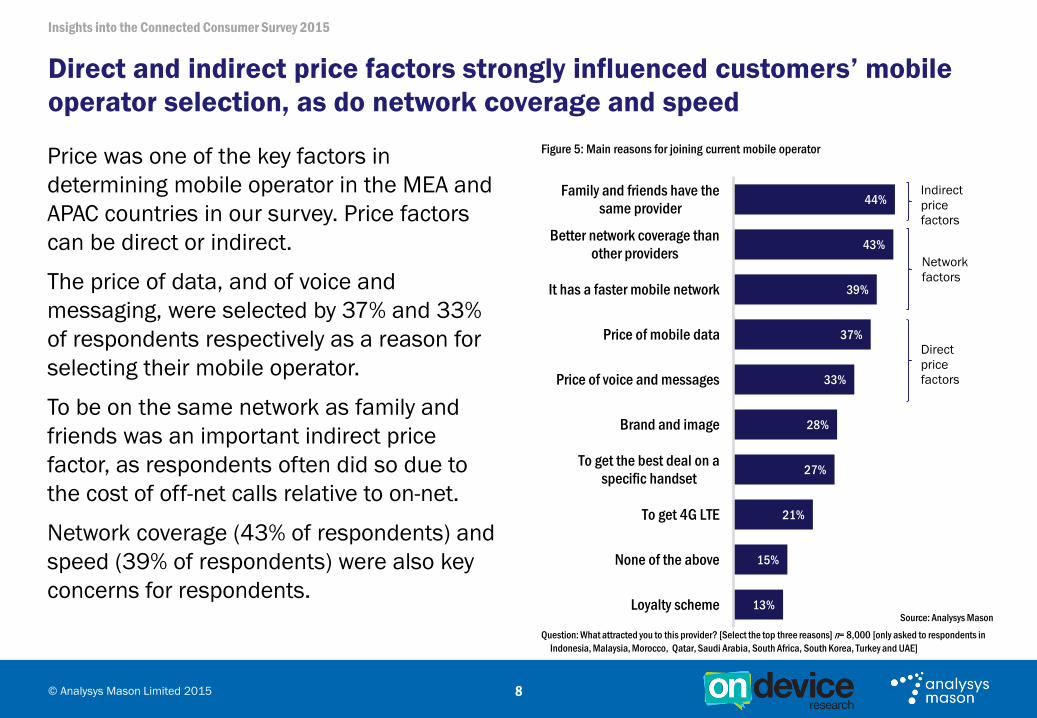
Figure 5: Main reasons for joining current mobile operator
8
Source: Analysys Mason
Question: What attracted you to this provider? [Select the top three reasons] n= 8,000 [only asked to respondents in
Indonesia, Malaysia, Morocco, Qatar, Saudi Arabia, South Africa, South Korea, Turkey and UAE]
Price was one of the key factors in
determining mobile operator in the MEA and
APAC countries in our survey. Price factors
can be direct or indirect.
The price of data, and of voice and
messaging, were selected by 37% and 33%
of respondents respectively as a reason for
selecting their mobile operator.
To be on the same network as family and
friends was an important indirect price
factor, as respondents often did so due to
the cost of off-net calls relative to on-net.
Network coverage (43% of respondents) and
speed (39% of respondents) were also key
concerns for respondents.
Direct and indirect price factors strongly influenced customers’ mobile
operator selection, as do network coverage and speed
13%
15%
21%
27%
28%
33%
37%
39%
43%
44%
Loyalty scheme
None of the above
To get 4G LTE
To get the best deal on a
specific handset
Brand and image
Price of voice and messages
Price of mobile data
It has a faster mobile network
Better network coverage than
other providers
Family and friends have the
same provider
Indirect
price
factors
Network
factors
Direct
price
factors
Insights into the Connected Consumer Survey 2015
© Analysys Mason Limited 2015
8%
9%
9%
10%
10%
11%
12%
13%
15%
15%
16%
17%
19%
20%
21%
Mobile Money SA (MTN)
MéditelCash
M-Pesa (Vodacom)
KT MoCa (KT)
eCash (Bank Mandiri)
M-Pesa (Vodafone)
Dompetku (Indosat)
AirCash (Celcom)
Paypin (SK Telecom)
M-Money (Maxis)
XL Tunai (XL Axiata)
MobiCash (Maroc Telecom)
Etisalat Mobile Commerce
T-Cash (Telkomsel)
Ooredoo Mobile Money
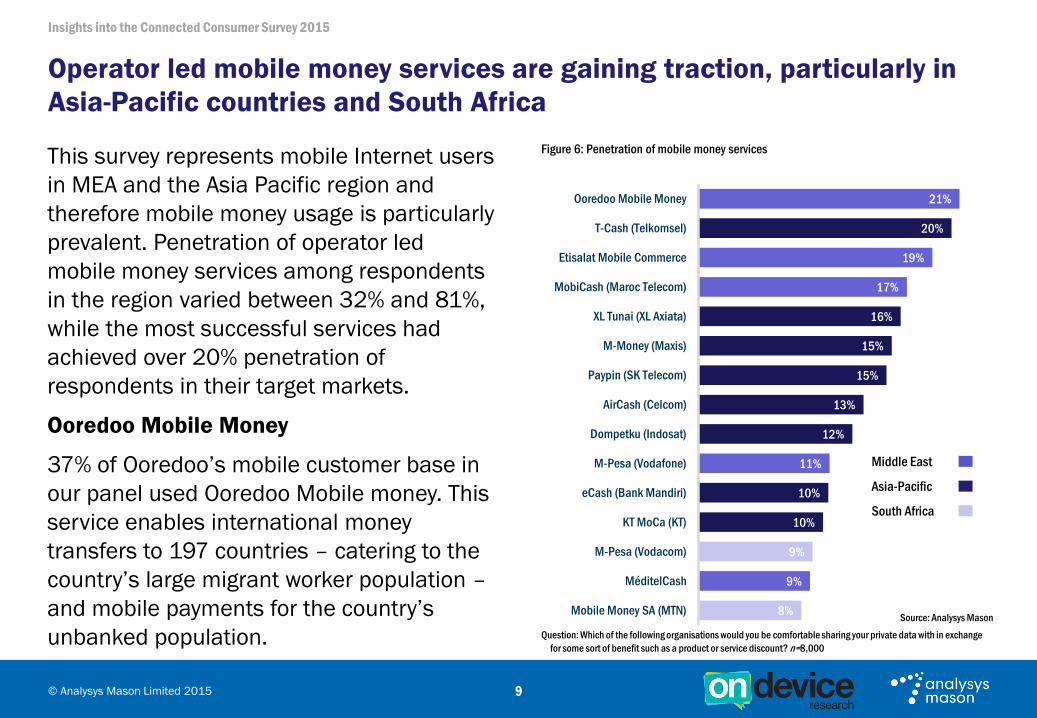
Figure 6: Penetration of mobile money services
9
Source: Analysys Mason
Question: Which of the following organisations would you be comfortable sharing your private data with in exchange
for some sort of benefit such as a product or service discount? n=8,000
This survey represents mobile Internet users
in MEA and the Asia Pacific region and
therefore mobile money usage is particularly
prevalent. Penetration of operator led
mobile money services among respondents
in the region varied between 32% and 81%,
while the most successful services had
achieved over 20% penetration of
respondents in their target markets.
Ooredoo Mobile Money
37% of Ooredoo’s mobile customer base in
our panel used Ooredoo Mobile money. This
service enables international money
transfers to 197 countries – catering to the
country’s large migrant worker population –
and mobile payments for the country’s
unbanked population.
Operator led mobile money services are gaining traction, particularly in
Asia-Pacific countries and South Africa
Middle East
Asia-Pacific
South Africa
Insights into the Connected Consumer Survey 2015
© Analysys Mason Limited 2015
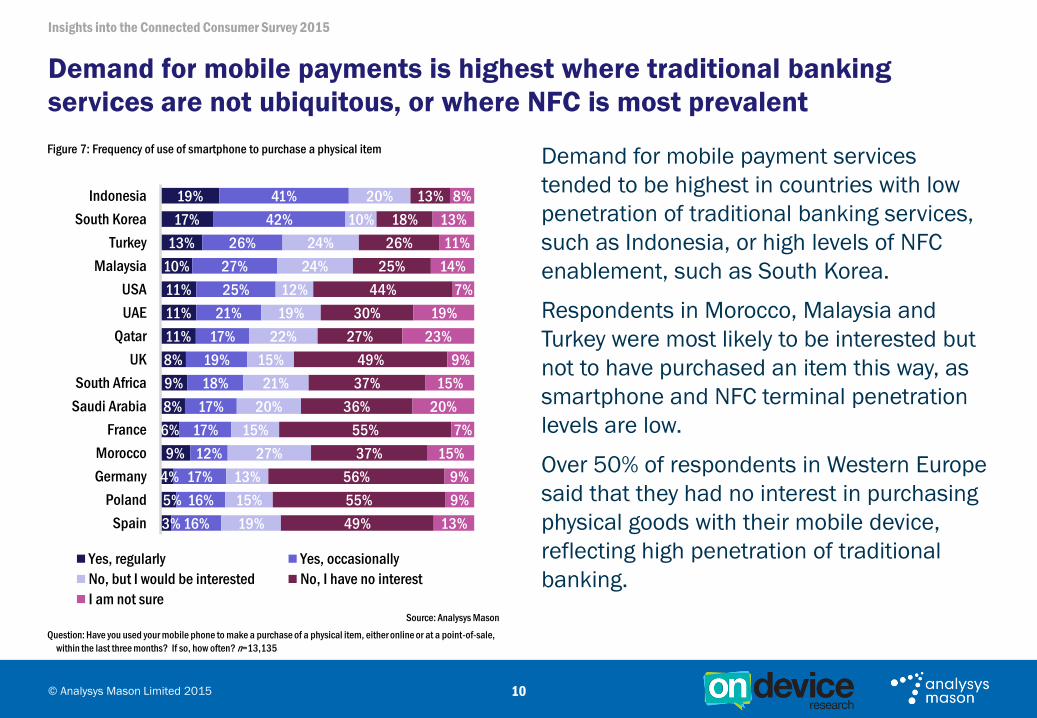
Figure 7: Frequency of use of smartphone to purchase a physical item
10
Source: Analysys Mason
Question: Have you used your mobile phone to make a purchase of a physical item, either online or at a point-of-sale,
within the last three months? If so, how often? n=13,135
Demand for mobile payment services
tended to be highest in countries with low
penetration of traditional banking services,
such as Indonesia, or high levels of NFC
enablement, such as South Korea.
Respondents in Morocco, Malaysia and
Turkey were most likely to be interested but
not to have purchased an item this way, as
smartphone and NFC terminal penetration
levels are low.
Over 50% of respondents in Western Europe
said that they had no interest in purchasing
physical goods with their mobile device,
reflecting high penetration of traditional
banking.
Demand for mobile payments is highest where traditional banking
services are not ubiquitous, or where NFC is most prevalent
3%
5%
4%
9%
6%
8%
9%
8%
11%
11%
11%
10%
13%
17%
19%
16%
16%
17%
12%
17%
17%
18%
19%
17%
21%
25%
27%
26%
42%
41%
19%
15%
13%
27%
15%
20%
21%
15%
22%
19%
12%
24%
24%
10%
20%
49%
55%
56%
37%
55%
36%
37%
49%
27%
30%
44%
25%
26%
18%
13%
13%
9%
9%
15%
7%
20%
15%
9%
23%
19%
7%
14%
11%
13%
8%
Spain
Poland
Germany
Morocco
France
Saudi Arabia
South Africa
UK
Qatar
UAE
USA
Malaysia
Turkey
South Korea
Indonesia
Yes, regularly Yes, occasionally
No, but I would be interested No, I have no interest
I am not sure
Insights into the Connected Consumer Survey 2015
© Analysys Mason Limited 2015
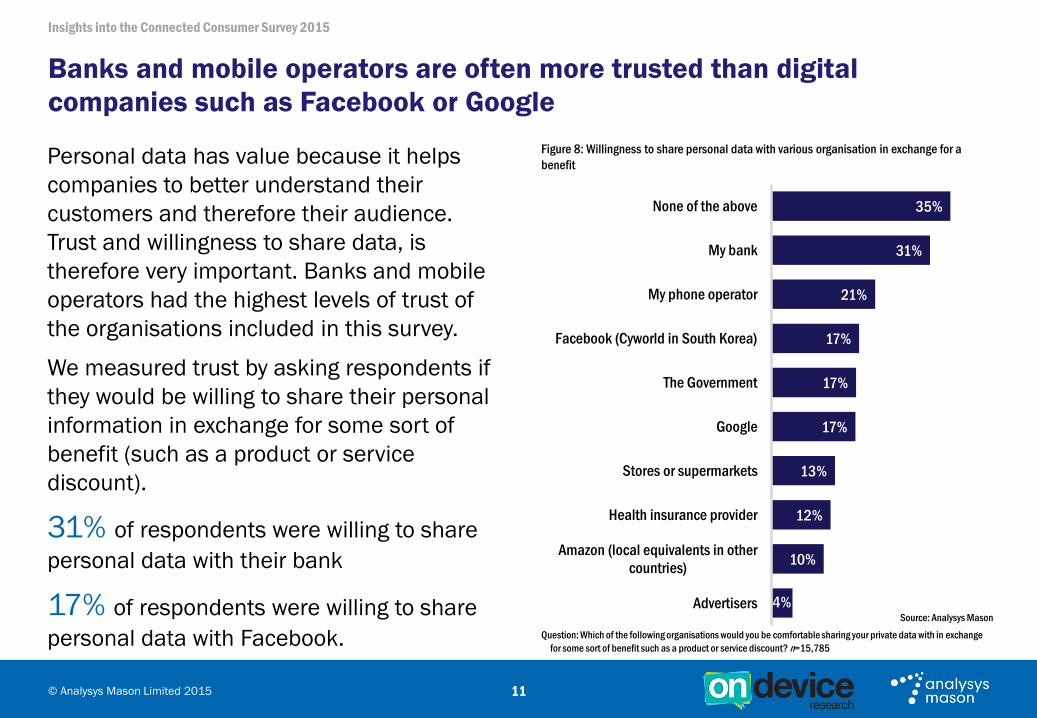
Figure 8: Willingness to share personal data with various organisation in exchange for a
benefit
11
Source: Analysys Mason
Question: Which of the following organisations would you be comfortable sharing your private data with in exchange
for some sort of benefit such as a product or service discount? n=15,785
Personal data has value because it helps
companies to better understand their
customers and therefore their audience.
Trust and willingness to share data, is
therefore very important. Banks and mobile
operators had the highest levels of trust of
the organisations included in this survey.
We measured trust by asking respondents if
they would be willing to share their personal
information in exchange for some sort of
benefit (such as a product or service
discount).
31% of respondents were willing to share
personal data with their bank
17% of respondents were willing to share
personal data with Facebook.
Banks and mobile operators are often more trusted than digital
companies such as Facebook or Google
4%
10%
12%
13%
17%
17%
17%
21%
31%
35%
Advertisers
Amazon (local equivalents in other
countries)
Health insurance provider
Stores or supermarkets
The Government
Facebook (Cyworld in South Korea)
My phone operator
My bank
None of the above
Insights into the Connected Consumer Survey 2015
© Analysys Mason Limited 2015
Published
The Connected Consumer Survey 2015. This report collates the ‘headline’ findings from the Connected Consumer Survey series, including the impact of factors on intention
to churn, customer retention strategies (with a focus on bundling strategies), and the impact of OTT communications and video streaming services on traditional mobile,
fixed-line and pay-TV businesses.
The Connected Consumer Survey 2015: mobile customer retention. This report provides insight into the attitudes and behaviours of mobile customers, including insight into the
drivers of churn, the impact of fixed-mobile convergent bundling, 4G and larger data allowances on customers’ intention to churn. This report also provides net promoter
scores (NPS) for major mobile operators in Europe and the USA.
The Connected Consumer Survey 2015: fixed broadband customer retention. This report addresses fixed broadband customers’ future intentions, and reasons for these, as well as
discussing strategies that AT&T, Iliad, Turkcell Superonline and Virgin Media have put in place to retain customers. We again address the impact of bundling on fixed
broadband customer retention, and analyse NPS for the major fixed broadband operators in each market.
The Connected Consumer Survey 2015: the Middle East and North Africa. In this report, we offer an insight into the of role of LTE to improve data monetisation prospects for
operators in the Middle East and North Africa, as well as OTT service and digital economy usage trends and the most critical levers for customer retention. We also
provide recommendations for operators as to how to address the OTT challenge, reduce churn and exploit opportunities in the digital economy.
Coming soon
The Connected Consumer Survey 2015: Pay-TV and OTT video services. Pay-TV operators have reached much of their addressable market, leaving little room for growth in
subscriber numbers. Meanwhile OTT video services are becoming increasingly popular and viewing habits are changing, as consumers view video content on multiple
devices.
The Connected Consumer Survey 2015: OTT communications services. OTT messaging and voice apps are widely adopted, and are disrupting mobile operators’ businesses.
Among respondents to our survey, OTT messaging apps have had the greatest impact, as they offer a differentiated user experience compared with SMS, while VoIP
apps have a less clear use case in most markets.
The Connected Consumer Survey 2015: Asia-Pacific . This report covers a diverse set of trends within consumer telecoms, focussing specifically on customer retention,
satisfaction, and drivers of churn; use of OTT communication services and consumer attitudes towards digital economy services such as mobile money and healthcare
specifically in the Asia-Pacific region.
The Connected Consumer Survey 2015: Digital economy services. This report will address consumer attitudes and behaviours with regard to digital economy services, specifically
mobile financial services (payments and commerce), mobile health and fitness, and smart homes.
12
Publications in the Connected Consumer Survey Series
Insights into the Connected Consumer Survey 2015
© Analysys Mason Limited 2015
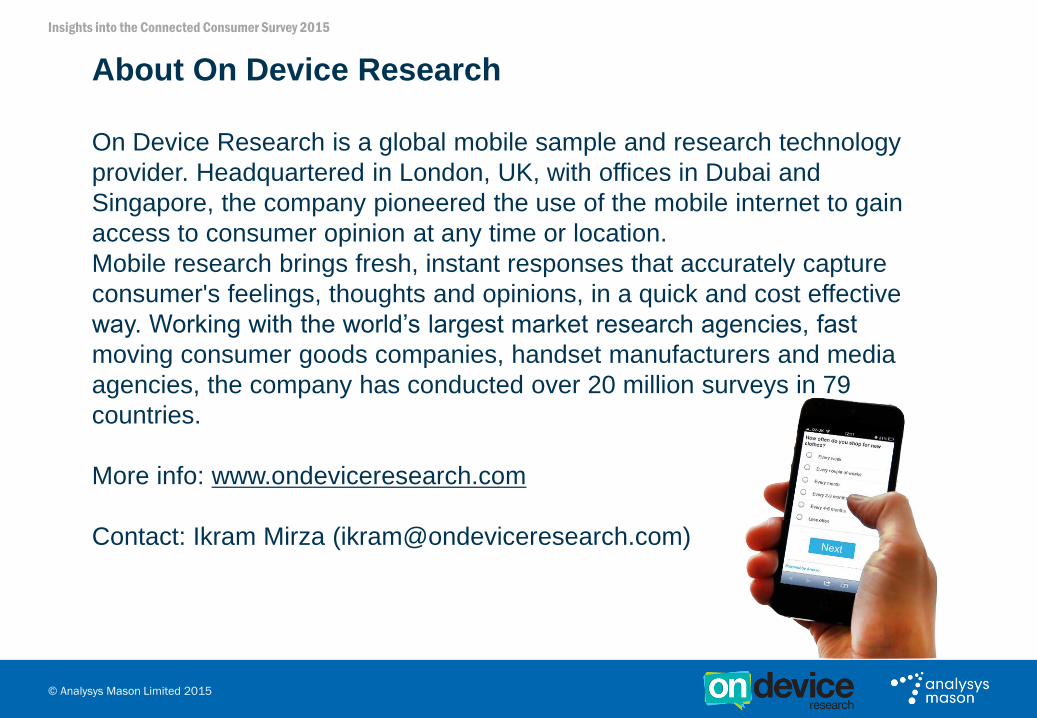
About On Device Research
On Device Research is a global mobile sample and research technology
provider. Headquartered in London, UK, with offices in Dubai and
Singapore, the company pioneered the use of the mobile internet to gain
access to consumer opinion at any time or location.
Mobile research brings fresh, instant responses that accurately capture
consumer's feelings, thoughts and opinions, in a quick and cost effective
way. Working with the world’s largest market research agencies, fast
moving consumer goods companies, handset manufacturers and media
agencies, the company has conducted over 20 million surveys in 79
countries.
More info: www.ondeviceresearch.com
Contact: Ikram Mirza ([email protected])
Insights into the Connected Consumer Survey 2015
© Analysys Mason Limited 2015
Surveys work on
any internet
connected device
Insights into the Connected Consumer Survey 2015
© Analysys Mason Limited 2015 15
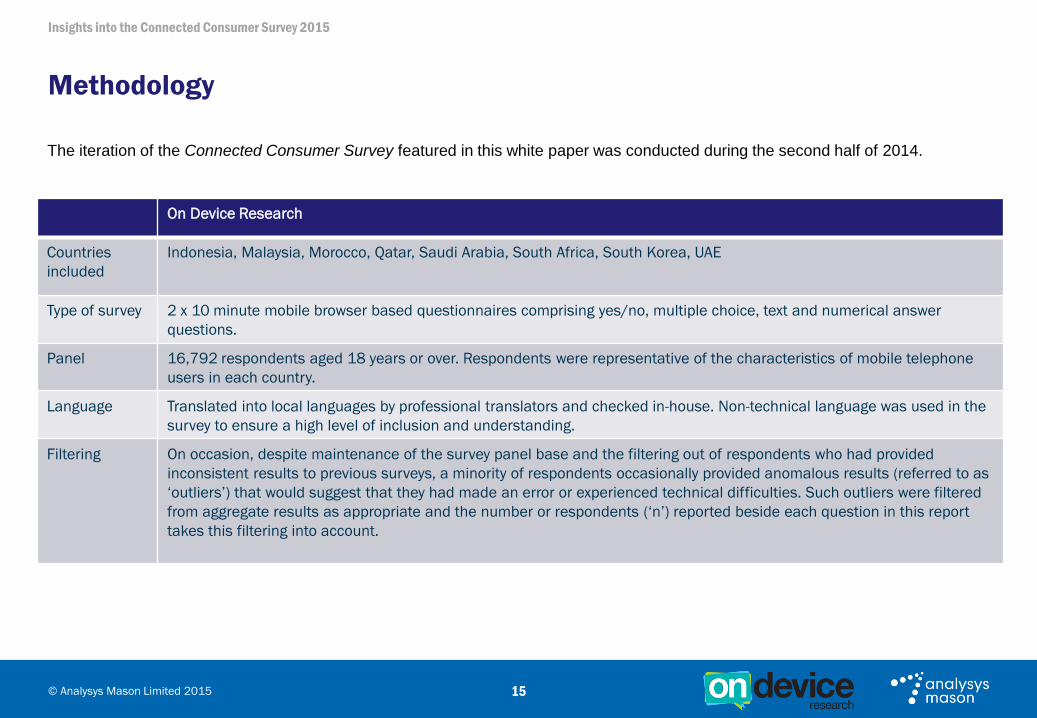
Methodology
The iteration of the Connected Consumer Survey featured in this white paper was conducted during the second half of 2014.
On Device Research
Countries
included
Indonesia, Malaysia, Morocco, Qatar, Saudi Arabia, South Africa, South Korea, UAE
Type of survey 2 x 10 minute mobile browser based questionnaires comprising yes/no, multiple choice, text and numerical answer
questions.
Panel 16,792 respondents aged 18 years or over. Respondents were representative of the characteristics of mobile telephone
users in each country.
Language Translated into local languages by professional translators and checked in-house. Non-technical language was used in the
survey to ensure a high level of inclusion and understanding.
Filtering On occasion, despite maintenance of the survey panel base and the filtering out of respondents who had provided
inconsistent results to previous surveys, a minority of respondents occasionally provided anomalous results (referred to as
‘outliers’) that would suggest that they had made an error or experienced technical difficulties. Such outliers were filtered
from aggregate results as appropriate and the number or respondents (‘n’) reported beside each question in this report
takes this filtering into account.
Insights into the Connected Consumer Survey 2015
© Analysys Mason Limited 2015 16
About the authors
Patrick Rusby (Analyst) is an analyst in Analysys Mason's Consumer Services research practice, focussing on mobile services markets,
MVNOs, LTE pricing, OTT communications services and fixed and mobile customer retention strategies. He contributes to the design, analysis
and write-up of the Analysys Mason's Connected Consumer Survey (a multi-year study of consumer behaviour relating to fixed and mobile
telecoms, TV and online services). He holds a Master’s degree in Contemporary British Politics from Goldsmiths College, University of London
and a Bachelor’s degree in Politics from the University of Southampton.
Martin Scott (Practice Head) leads Analysys Mason’s Consumer Services research practice, which includes the Fixed Broadband and Multi-
Play, Next-Generation Services, Mobile Services, Mobile Devices and Digital Economy research programmes. His primary areas of specialisation
include the bundling and pricing of multi-play services, including quadruple-play bundling, customer satisfaction and consumer-facing marketing
strategy. He also specialises in statistics, surveys and the analysis of primary research; he co-ordinates Analysys Mason's Connected Consumer
Survey and Consumer smartphone usage series of research.
Insights into the Connected Consumer Survey 2015
© Analysys Mason Limited 2015 17
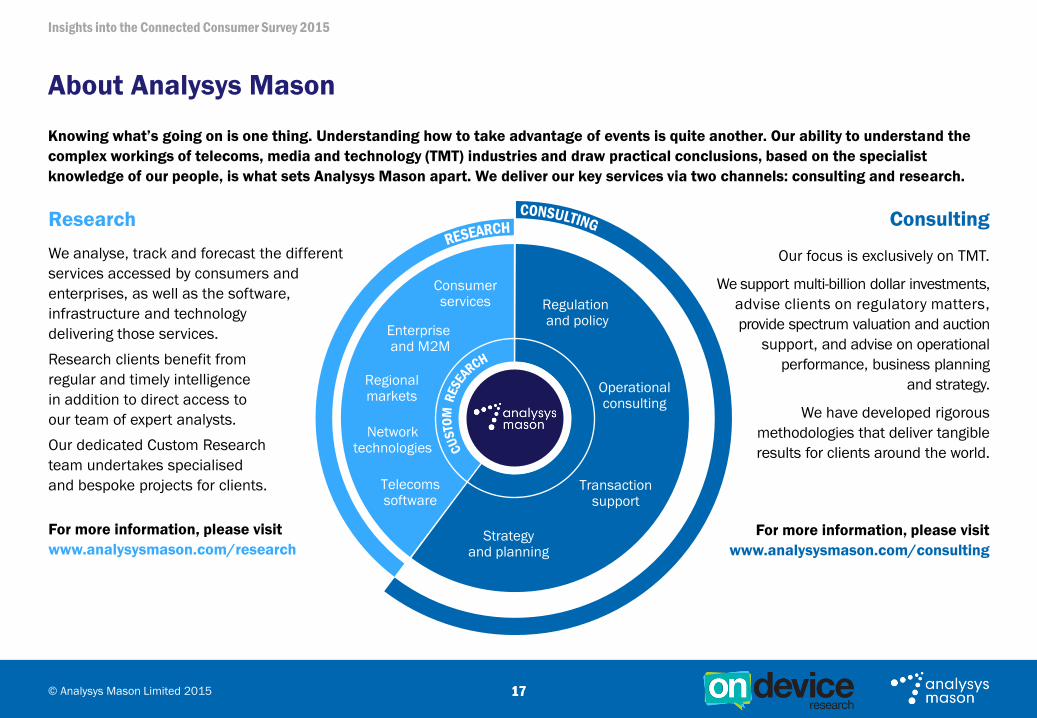
About Analysys Mason
Knowing what’s going on is one thing. Understanding how to take advantage of events is quite another. Our ability to understand the
complex workings of telecoms, media and technology (TMT) industries and draw practical conclusions, based on the specialist
knowledge of our people, is what sets Analysys Mason apart. We deliver our key services via two channels: consulting and research.
Consulting
Our focus is exclusively on TMT.
We support multi-billion dollar investments,
advise clients on regulatory matters,
provide spectrum valuation and auction
support, and advise on operational
performance, business planning
and strategy.
We have developed rigorous
methodologies that deliver tangible
results for clients around the world.
For more information, please visit
www.analysysmason.com/consulting
Research
We analyse, track and forecast the different
services accessed by consumers and
enterprises, as well as the software,
infrastructure and technology
delivering those services.
Research clients benefit from
regular and timely intelligence
in addition to direct access to
our team of expert analysts.
Our dedicated Custom Research
team undertakes specialised
and bespoke projects for clients.
For more information, please visit
www.analysysmason.com/research
17
Consumer services
Enterprise and M2M
Regional markets
Network technologies
Telecoms software
Strategy and planning
Transaction support
Operational consulting
Regulation and policy
Insights into the Connected Consumer Survey 2015
© Analysys Mason Limited 2015 18
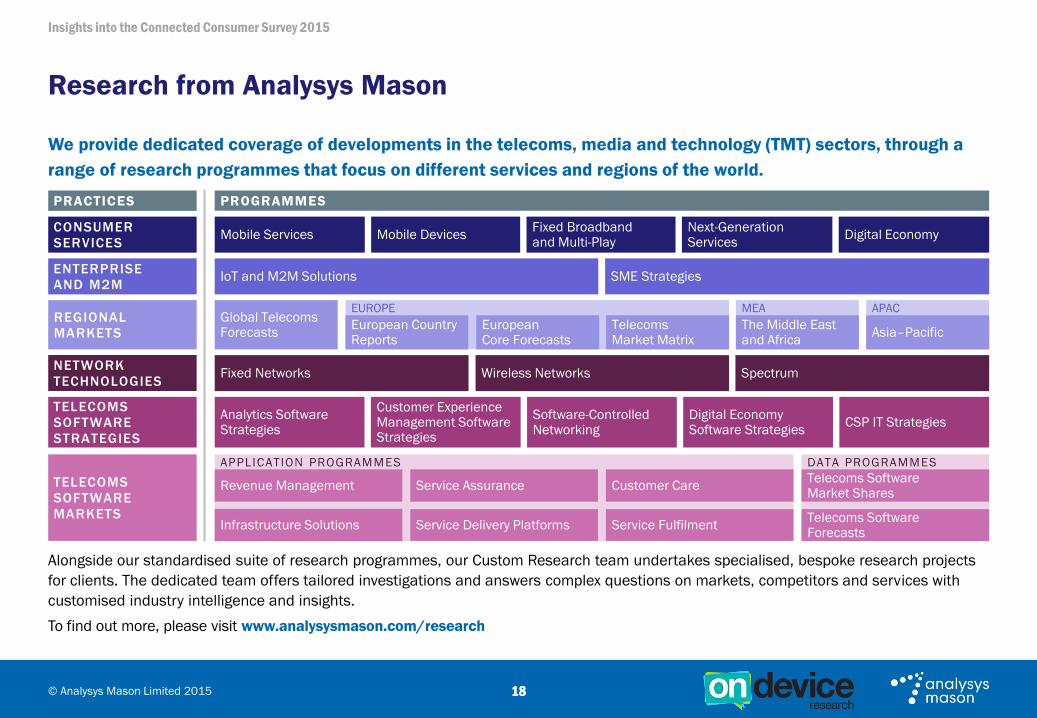
Research from Analysys Mason
We provide dedicated coverage of developments in the telecoms, media and technology (TMT) sectors, through a
range of research programmes that focus on different services and regions of the world.
Alongside our standardised suite of research programmes, our Custom Research team undertakes specialised, bespoke research projects
for clients. The dedicated team offers tailored investigations and answers complex questions on markets, competitors and services with
customised industry intelligence and insights.
To find out more, please visit www.analysysmason.com/research
18
NETWORK
TECHNOLOGIES
Spectrum Fixed Networks Wireless Networks
PRACTICES PROGRAMMES
CONSUMER
SERVICES
ENTERPRISE
AND M2M IoT and M2M Solutions SME Strategies
TELECOMS
SOFTWARE
STRATEGIES
DATA PROGRAMMES APPLICATION PROGRAMMES
Telecoms Software Forecasts
Service Assurance Telecoms Software Market Shares
Revenue Management
Infrastructure Solutions Service Fulfilment Service Delivery Platforms
Customer Care
MEA APAC REGIONAL
MARKETS
EUROPE
European Core Forecasts
Telecoms Market Matrix
European Country Reports
The Middle East and Africa
Asia–Pacific Global Telecoms Forecasts
TELECOMS
SOFTWARE
MARKETS
Customer Experience Management Software Strategies
Digital Economy Software Strategies
Analytics Software Strategies
Software-Controlled Networking
CSP IT Strategies
Mobile Services Mobile Devices Fixed Broadband and Multi-Play
Next-Generation Services
Digital Economy
Insights into the Connected Consumer Survey 2015
© Analysys Mason Limited 2015 19
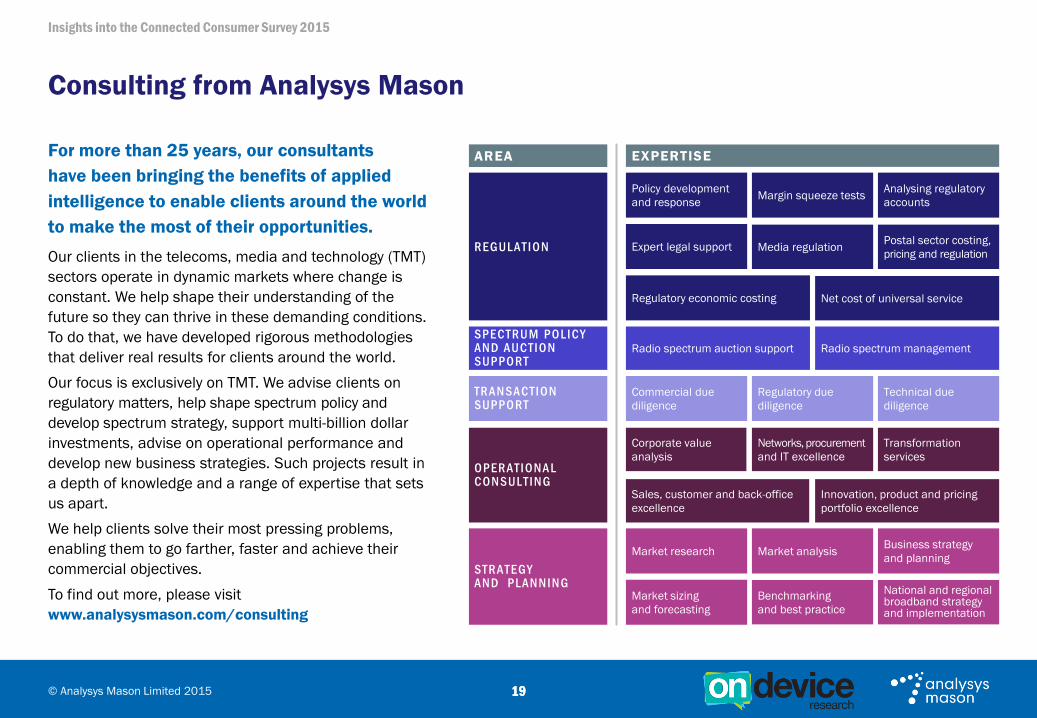
Consulting from Analysys Mason
For more than 25 years, our consultants
have been bringing the benefits of applied
intelligence to enable clients around the world
to make the most of their opportunities.
Our clients in the telecoms, media and technology (TMT)
sectors operate in dynamic markets where change is
constant. We help shape their understanding of the
future so they can thrive in these demanding conditions.
To do that, we have developed rigorous methodologies
that deliver real results for clients around the world.
Our focus is exclusively on TMT. We advise clients on
regulatory matters, help shape spectrum policy and
develop spectrum strategy, support multi-billion dollar
investments, advise on operational performance and
develop new business strategies. Such projects result in
a depth of knowledge and a range of expertise that sets
us apart.
We help clients solve their most pressing problems,
enabling them to go farther, faster and achieve their
commercial objectives.
To find out more, please visit
www.analysysmason.com/consulting
19
AREA Research programmes
EXPERTISE
T R A N SA C T I O N SUP P O R T
R EG UL A T I O N
SP EC T R U M P O L I C Y A N D A UC T I O N SUP P O R T
O P ER A T I O N A L C O N SUL T I N G
ST R A T EG Y A N D P L A N N I N G
Technical due
diligence
Commercial due
diligence
Regulatory due
diligence
Net cost of universal service
Margin squeeze tests
Regulatory economic costing
Policy development
and response
Expert legal support Postal sector costing,
pricing and regulation Media regulation
Analysing regulatory
accounts
Radio spectrum auction support Radio spectrum management
Corporate value
analysis
Networks, procurement
and IT excellence
Transformation
services
Sales, customer and back-office
excellence
Innovation, product and pricing
portfolio excellence
Market analysis Market research
Market sizing
and forecasting
National and regional broadband strategy and implementation
Benchmarking
and best practice
Business strategy
and planning

Insights into the Connected Consumer Survey 2015
© Analysys Mason Limited 2015
Published by Analysys Mason Limited • Bush House • North West Wing • Aldwych • London • WC2B 4PJ • UK
Tel: +44 (0)20 7395 9000 • Fax: +44 (0)20 7395 9001 • Email: [email protected] • www.analysysmason.com/research • Registered in England No. 5177472
© Analysys Mason Limited 2015. All rights reserved. No part of this publication may be reproduced, stored in a retrieval system or transmitted in any form or by any means – electronic,
mechanical, photocopying, recording or otherwise – without the prior written permission of the publisher.
Figures and projections contained in this report are based on publicly available information only and are produced by the Research Division of Analysys Mason Limited independently of any
client-specific work within Analysys Mason Limited. The opinions expressed are those of the stated authors only.
Analysys Mason Limited recognises that many terms appearing in this report are proprietary; all such trademarks are acknowledged and every effort has been made to indicate them by the
normal UK publishing practice of capitalisation. However, the presence of a term, in whatever form, does not affect its legal status as a trademark.
Analysys Mason Limited maintains that all reasonable care and skill have been used in the compilation of this publication. However, Analysys Mason Limited shall not be under any liability for
loss or damage (including consequential loss) whatsoever or howsoever arising as a result of the use of this publication by the customer, his servants, agents or any third party.


![Mobile and the Digital Economy [Analysys Mason, 2014]](https://img.pdfslide.net/doc/110x75/577cd0611a28ab9e78921a04/mobile-and-the-digital-economy-analysys-mason-2014.jpg)


