Embed Size (px)
Citation preview

AURALISATION OF DEEP CONVOLUTIONAL NEURAL NETWORKS:LISTENING TO LEARNED FEATURES
Keunwoo ChoiQueen Mary
University of [email protected],
Jeonghee KimNaver Labs,South Korea
George FazekasQueen Mary
University of [email protected]
Mark SandlerQueen Mary
University of [email protected]
ABSTRACT
Deep learning has been actively adopted in the field of mu-sic information retrieval, e.g. genre classification, mooddetection, and chord recognition. Deep convolutional neu-ral networks (CNNs), one of the most popular deep learn-ing approach, also have been used for these tasks. How-ever, the process of learning and prediction is little under-stood, particularly when it is applied to spectrograms. Weintroduce auralisation of CNNs to understand its underly-ing mechanism.
1. INTRODUCTION
In the field of computer vision, deep learning approachesbecome de facto standard after convolutional neural net-works (CNNs) showed break-through results in ImageNetcompetition in 2012 [3]. It rapidly became popular whilethe reason of success was not completely understood.
One effective way to understand and explain the CNNswas introduced in [5], where the features in deeper levelsare visualised by a method called deconvolution. By de-convolving and un-pooling layers, it enables people to seewhich part of the input image are focused on by each filter.
However, spectrograms have not been analysed by thisapproach. Moreover, it is not clear what can be understoodby deconvolving spectrograms. The information from ’see-ing’ a part of spectrograms can be extended by auralisingthe convolutional filters.
In this paper, we introduce the procedure and results ofdeconvolution of spectrograms. Furthermore, we proposeauralisastion of filters by extending it to time-domain re-construction. In Section 2, the background of CNNs anddeconvolution are explained. The proposed auralisationmethod is introduced in Section 3. The results are dis-cussed in Section 4.
2. BACKGROUND
The majority of research of CNNs on audio signal uses 2Dtime-frequency representation as input data, considering it
c© Keunwoo Choi, Jeonghee Kim, George Fazekas, MarkSandler. Licensed under a Creative Commons Attribution 4.0 Interna-tional License (CC BY 4.0). Attribution: Keunwoo Choi, JeongheeKim, George Fazekas, Mark Sandler. “Auralisation of Deep Convolu-tional Neural Networks: Listening to Learned Features”, 16th Interna-tional Society for Music Information Retrieval Conference, 2015.
Figure 1. Deconvolution of CNNs trained for image clas-sification. The filters’ response and a corresponding partin the input images are shown respectively on the left andright for each layer. Image courtesy of [5].
as an image. Various types of representations have beenused including Short-time Fourier transform (STFT), Mel-spectrogram and constant-Q transform (CQT). In [4], forexample, 80-by-15 (mel-band-by-frame) mel-spectrogramis used with 7-by-3 and 3-by-3 convolutions for onset de-tection and CQT is used with 5-by-25 and 5-by-13 convo-lutions for chord recognition in [2].
Visualisation of CNNs was introduced in [5], whichshowed how high-level features (postures/objects) are com-bined from low-level features (lines/curves), as illustratedin Figure 1. Visualisation of CNNs helps not only to un-derstand the process inside the black box model, but alsoto decide hyper-parameters of the networks. For exam-ple, redundancy or deficiency of the capacity of the net-works, which is limited by hyper-parameters such as thenumber of layers and filters, can be judged by inspectingthe learned filters. Network visualisation provides usefulinformation since fine tuning hyper-parameters is amongthe most crucial factors in designing CNNs, while it is acomputationally expensive process.
3. AURALISATION OF FILTERS
The spectrograms used in CNNs can be also deconvolvedas well. Unlike visual images however, a deconvolvedspectrogram does not generally facilitate an intuitive ex-planation. This is because, first, seeing a spectrogram doesnot necessarily provide clear intuition that is comparable toobserving an image. Second, detecting edges of a spectro-gram, which is known to happen at the first layer in CNNs,results in removing components of the spectrograms.
This paper has been supported by EPSRC Grant EP/L019981/1, Fus-ing Audio and Semantic Technologies for Intelligent Music Productionand Consumption.
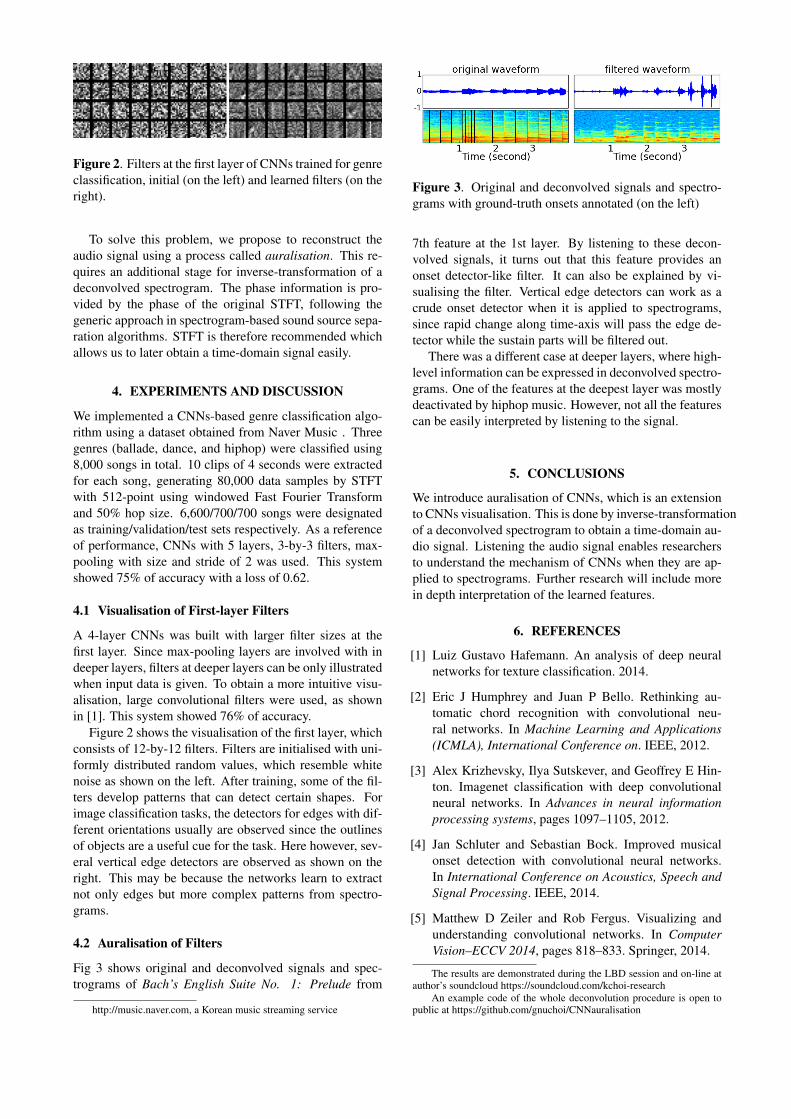
Figure 2. Filters at the first layer of CNNs trained for genreclassification, initial (on the left) and learned filters (on theright).
To solve this problem, we propose to reconstruct theaudio signal using a process called auralisation. This re-quires an additional stage for inverse-transformation of adeconvolved spectrogram. The phase information is pro-vided by the phase of the original STFT, following thegeneric approach in spectrogram-based sound source sepa-ration algorithms. STFT is therefore recommended whichallows us to later obtain a time-domain signal easily.
4. EXPERIMENTS AND DISCUSSION
We implemented a CNNs-based genre classification algo-rithm using a dataset obtained from Naver Music . Threegenres (ballade, dance, and hiphop) were classified using8,000 songs in total. 10 clips of 4 seconds were extractedfor each song, generating 80,000 data samples by STFTwith 512-point using windowed Fast Fourier Transformand 50% hop size. 6,600/700/700 songs were designatedas training/validation/test sets respectively. As a referenceof performance, CNNs with 5 layers, 3-by-3 filters, max-pooling with size and stride of 2 was used. This systemshowed 75% of accuracy with a loss of 0.62.
4.1 Visualisation of First-layer Filters
A 4-layer CNNs was built with larger filter sizes at thefirst layer. Since max-pooling layers are involved with indeeper layers, filters at deeper layers can be only illustratedwhen input data is given. To obtain a more intuitive visu-alisation, large convolutional filters were used, as shownin [1]. This system showed 76% of accuracy.
Figure 2 shows the visualisation of the first layer, whichconsists of 12-by-12 filters. Filters are initialised with uni-formly distributed random values, which resemble whitenoise as shown on the left. After training, some of the fil-ters develop patterns that can detect certain shapes. Forimage classification tasks, the detectors for edges with dif-ferent orientations usually are observed since the outlinesof objects are a useful cue for the task. Here however, sev-eral vertical edge detectors are observed as shown on theright. This may be because the networks learn to extractnot only edges but more complex patterns from spectro-grams.
4.2 Auralisation of Filters
Fig 3 shows original and deconvolved signals and spec-trograms of Bach’s English Suite No. 1: Prelude from
http://music.naver.com, a Korean music streaming service
Figure 3. Original and deconvolved signals and spectro-grams with ground-truth onsets annotated (on the left)
7th feature at the 1st layer. By listening to these decon-volved signals, it turns out that this feature provides anonset detector-like filter. It can also be explained by vi-sualising the filter. Vertical edge detectors can work as acrude onset detector when it is applied to spectrograms,since rapid change along time-axis will pass the edge de-tector while the sustain parts will be filtered out.
There was a different case at deeper layers, where high-level information can be expressed in deconvolved spectro-grams. One of the features at the deepest layer was mostlydeactivated by hiphop music. However, not all the featurescan be easily interpreted by listening to the signal.
5. CONCLUSIONS
We introduce auralisation of CNNs, which is an extensionto CNNs visualisation. This is done by inverse-transformationof a deconvolved spectrogram to obtain a time-domain au-dio signal. Listening the audio signal enables researchersto understand the mechanism of CNNs when they are ap-plied to spectrograms. Further research will include morein depth interpretation of the learned features.
6. REFERENCES
[1] Luiz Gustavo Hafemann. An analysis of deep neuralnetworks for texture classification. 2014.
[2] Eric J Humphrey and Juan P Bello. Rethinking au-tomatic chord recognition with convolutional neu-ral networks. In Machine Learning and Applications(ICMLA), International Conference on. IEEE, 2012.
[3] Alex Krizhevsky, Ilya Sutskever, and Geoffrey E Hin-ton. Imagenet classification with deep convolutionalneural networks. In Advances in neural informationprocessing systems, pages 1097–1105, 2012.
[4] Jan Schluter and Sebastian Bock. Improved musicalonset detection with convolutional neural networks.In International Conference on Acoustics, Speech andSignal Processing. IEEE, 2014.
[5] Matthew D Zeiler and Rob Fergus. Visualizing andunderstanding convolutional networks. In ComputerVision–ECCV 2014, pages 818–833. Springer, 2014.
The results are demonstrated during the LBD session and on-line atauthor’s soundcloud https://soundcloud.com/kchoi-research
An example code of the whole deconvolution procedure is open topublic at https://github.com/gnuchoi/CNNauralisation