Embed Size (px)
Citation preview
BIG DATA ANALYTICS
IN A HETEROGENEOUS WORLD
JOYDEEP DAS DIRECTOR, ANALYTICS PRODUCT MANAGEMENT SYBASE INC, AN SAP COMPANY FEBRUARY 16, 2012
AGENDA
The real world means business Change is afoot – Myriad solution trends
Building bridges across a heterogeneous world
Summary
BIG DATA ANALYTICS REAL WORLD MEANS BUSINESS
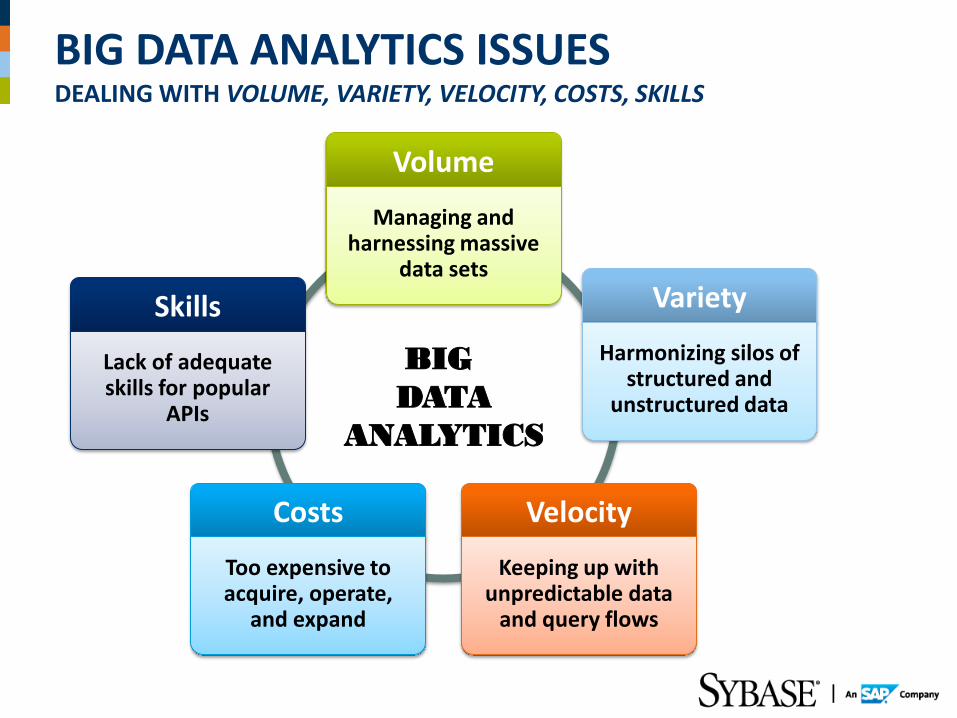
BIG DATA ANALYTICS ISSUES DEALING WITH VOLUME, VARIETY, VELOCITY, COSTS, SKILLS
Volume
Managing and harnessing massive
data sets
Skills
Lack of adequate skills for popular
APIs
Variety
Harmonizing silos of structured and
unstructured data
Velocity
Keeping up with unpredictable data
and query flows
Costs
Too expensive to acquire, operate,
and expand
BIG
DATA
ANALYTICS
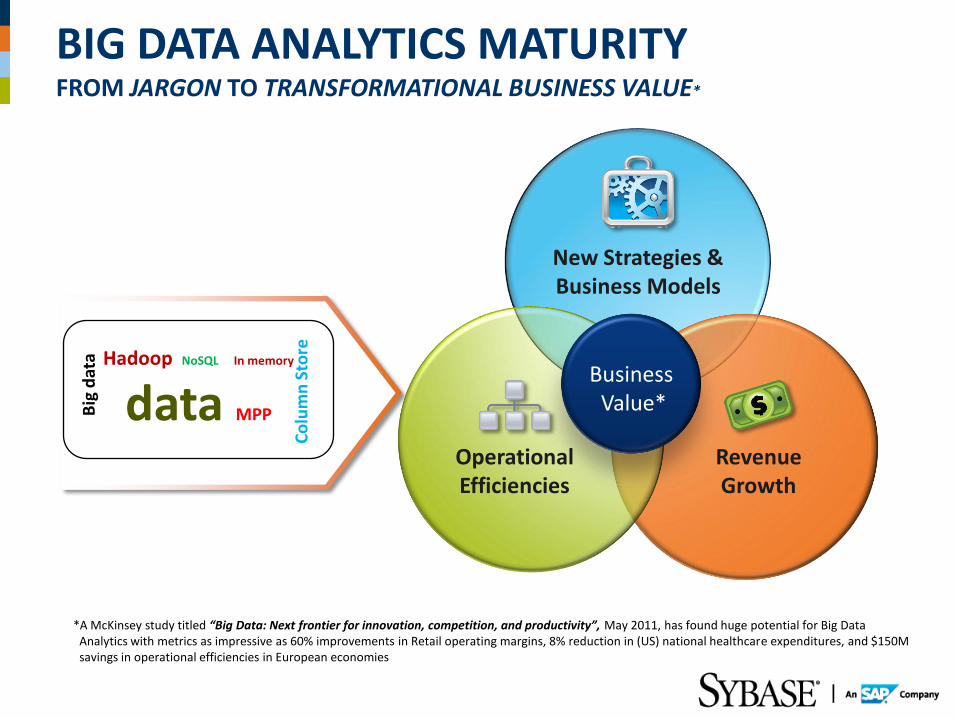
BIG DATA ANALYTICS MATURITY FROM JARGON TO TRANSFORMATIONAL BUSINESS VALUE*
Operational Efficiencies
Revenue Growth
New Strategies & Business Models
*A McKinsey study titled “Big Data: Next frontier for innovation, competition, and productivity”, May 2011, has found huge potential for Big Data Analytics with metrics as impressive as 60% improvements in Retail operating margins, 8% reduction in (US) national healthcare expenditures, and $150M savings in operational efficiencies in European economies
Business Value*
Hadoop NoSQL In memory
data MPP Big
dat
a
Co
lum
n S
tore
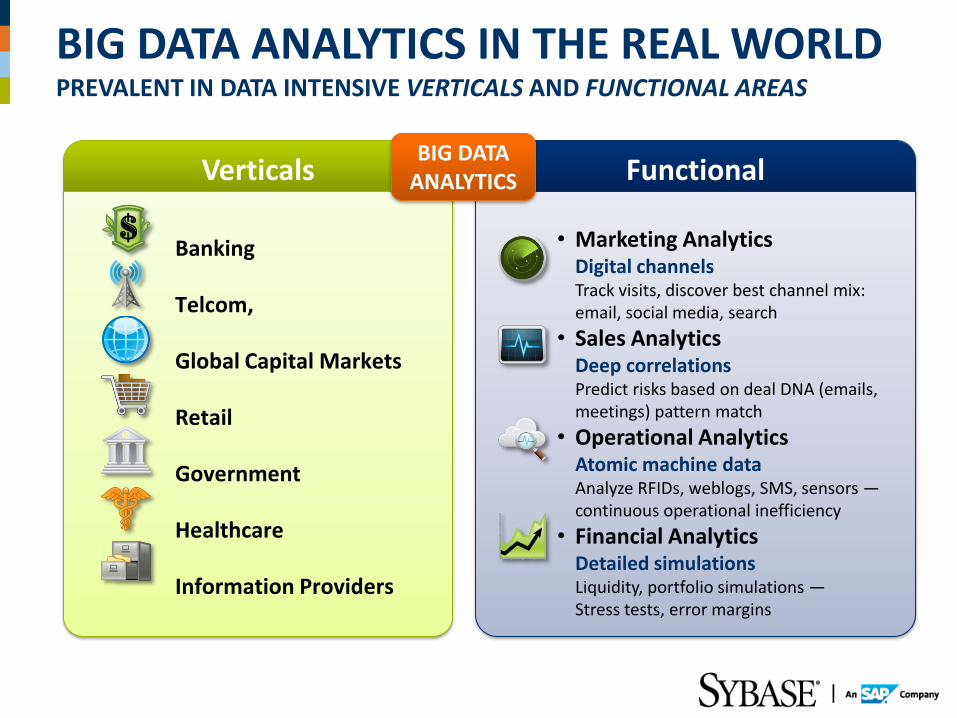
BIG DATA ANALYTICS IN THE REAL WORLD PREVALENT IN DATA INTENSIVE VERTICALS AND FUNCTIONAL AREAS
Verticals
Banking
Telcom,
Global Capital Markets
Retail
Government
Healthcare
Information Providers
Functional
• Marketing Analytics Digital channels Track visits, discover best channel mix: email, social media, search
• Sales Analytics Deep correlations Predict risks based on deal DNA (emails, meetings) pattern match
• Operational Analytics Atomic machine data Analyze RFIDs, weblogs, SMS, sensors — continuous operational inefficiency
• Financial Analytics Detailed simulations Liquidity, portfolio simulations — Stress tests, error margins
BIG DATA ANALYTICS
CHANGE IS AFOOT MYRIAD OF BIG DATA ANALYTICS SOLUTIONS
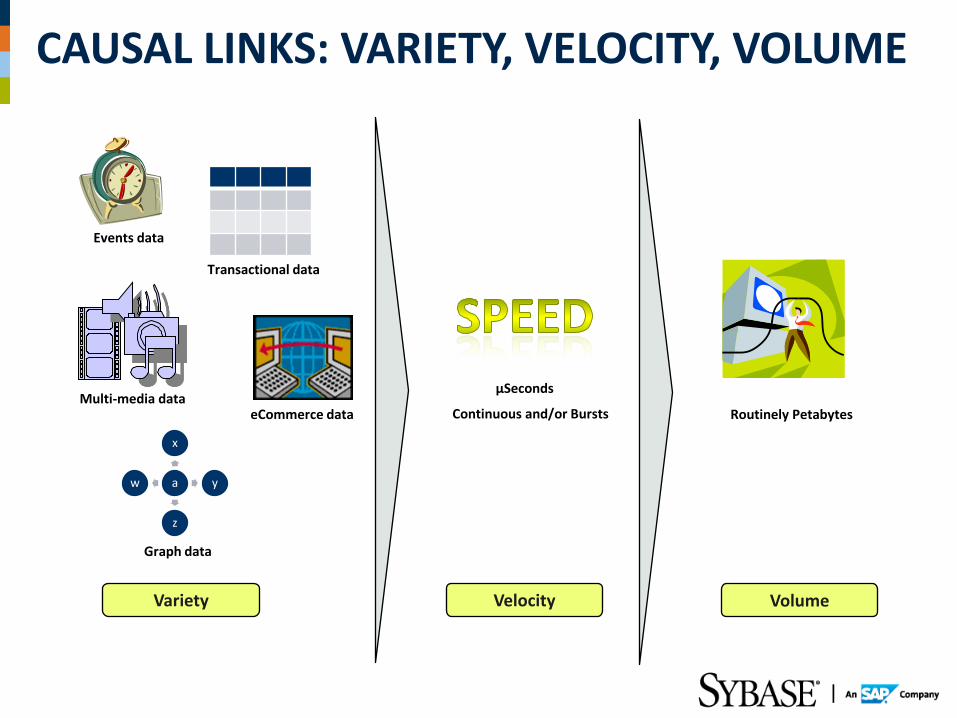
CAUSAL LINKS: VARIETY, VELOCITY, VOLUME
a
x
y
z
w
Graph data
Multi-media data eCommerce data
Transactional data
Events data
Routinely Petabytes
µSeconds
Continuous and/or Bursts
Variety Velocity Volume
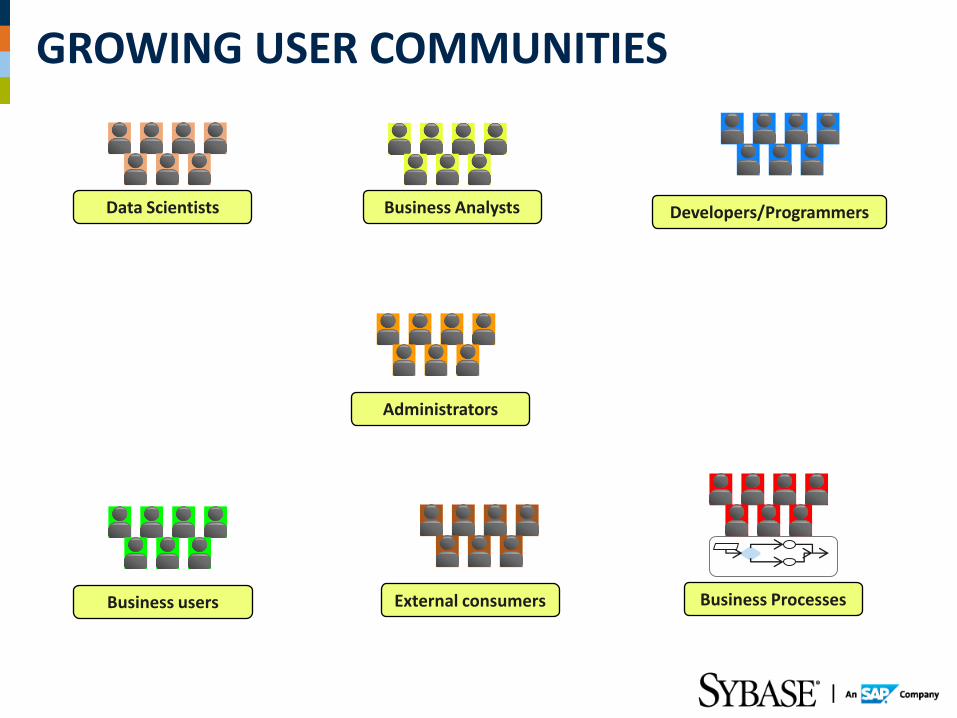
GROWING USER COMMUNITIES
Data Scientists Business Analysts Developers/Programmers
Administrators
Business users External consumers Business Processes
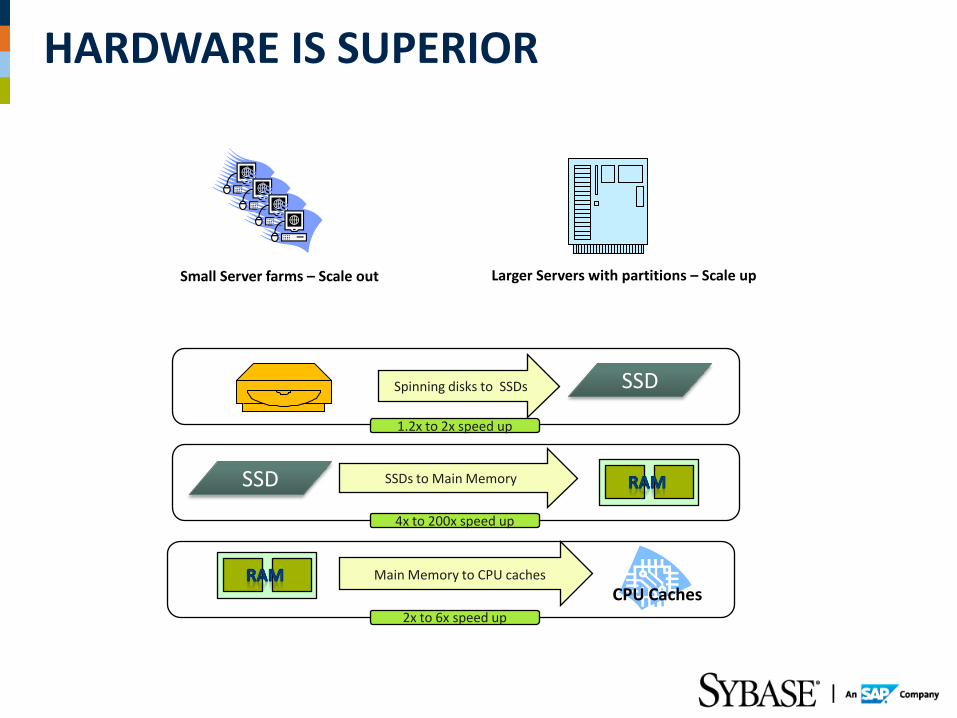
HARDWARE IS SUPERIOR
Spinning disks to SSDs
SSDs to Main Memory
Main Memory to CPU caches
1.2x to 2x speed up
4x to 200x speed up
2x to 6x speed up
Small Server farms – Scale out Larger Servers with partitions – Scale up
SSD
SSD
CPU Caches
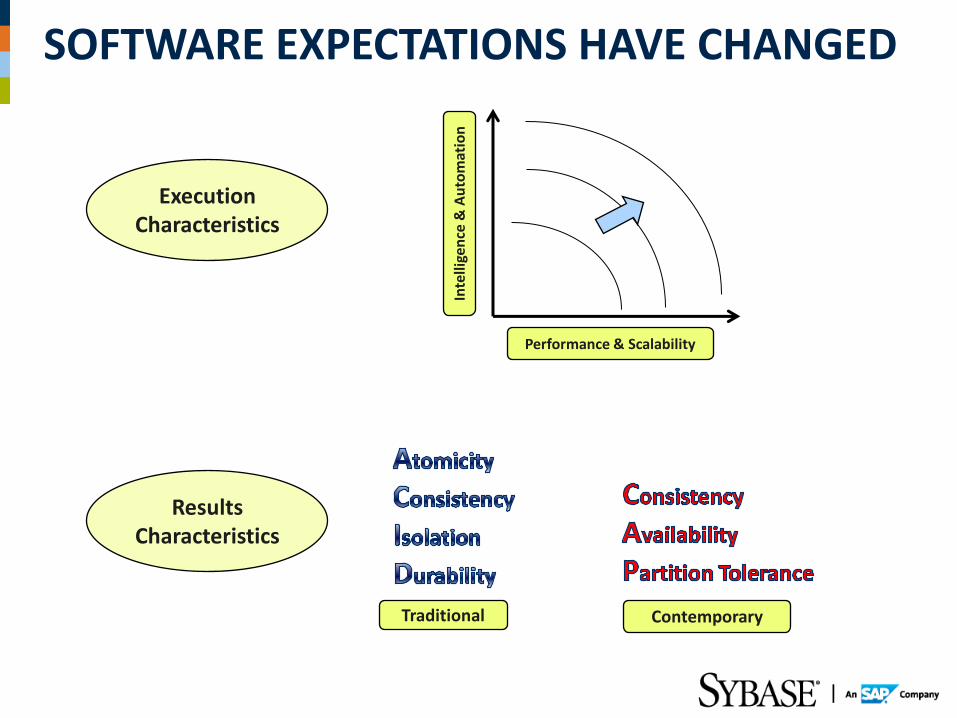
SOFTWARE EXPECTATIONS HAVE CHANGED
Execution Characteristics
Results Characteristics
Traditional Contemporary
Performance & Scalability
Inte
llige
nce
& A
uto
mat
ion
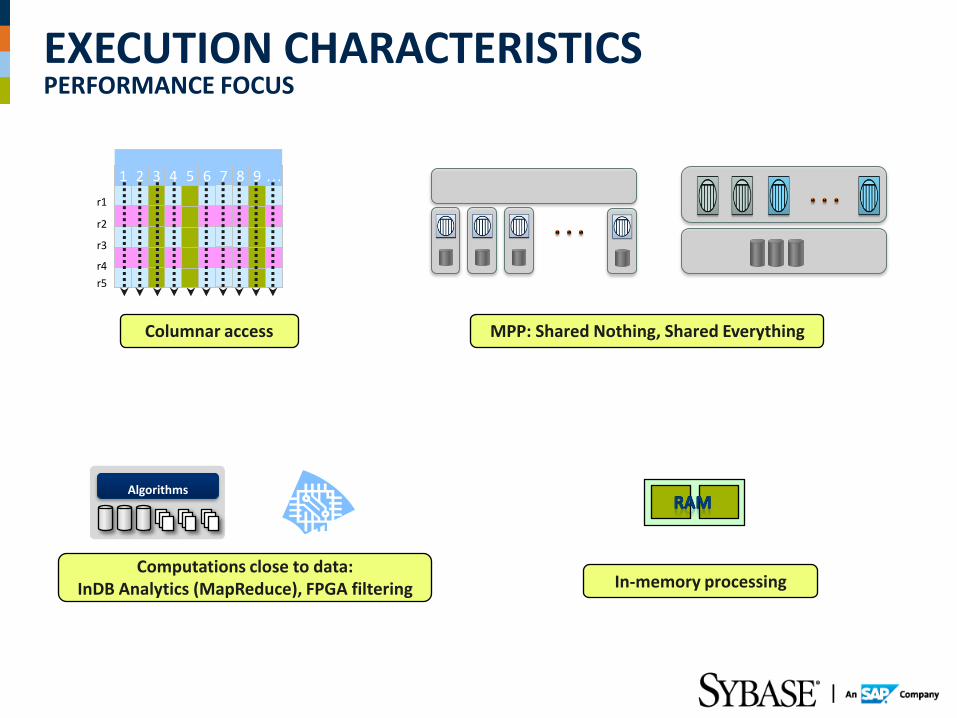
EXECUTION CHARACTERISTICS PERFORMANCE FOCUS
5
4
3
2
1
… 9 8 7 6
r1
r2
r3
r4
r5
Columnar access MPP: Shared Nothing, Shared Everything
In-memory processing Computations close to data:
InDB Analytics (MapReduce), FPGA filtering
Algorithms
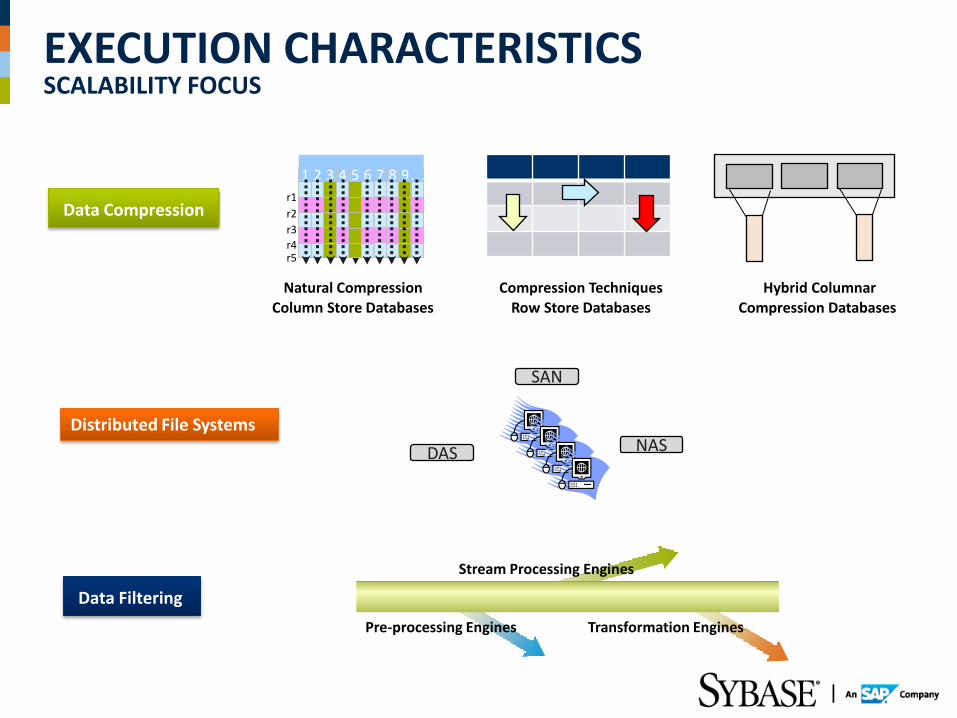
EXECUTION CHARACTERISTICS SCALABILITY FOCUS
Distributed File Systems
Data Compression
Natural Compression
Column Store Databases Compression Techniques
Row Store Databases Hybrid Columnar
Compression Databases
5
4
3
2
1
… 9 8 7 6
r1
r2
r3
r4 r5
DAS
SAN
NAS
Data Filtering
Pre-processing Engines
Stream Processing Engines
Transformation Engines
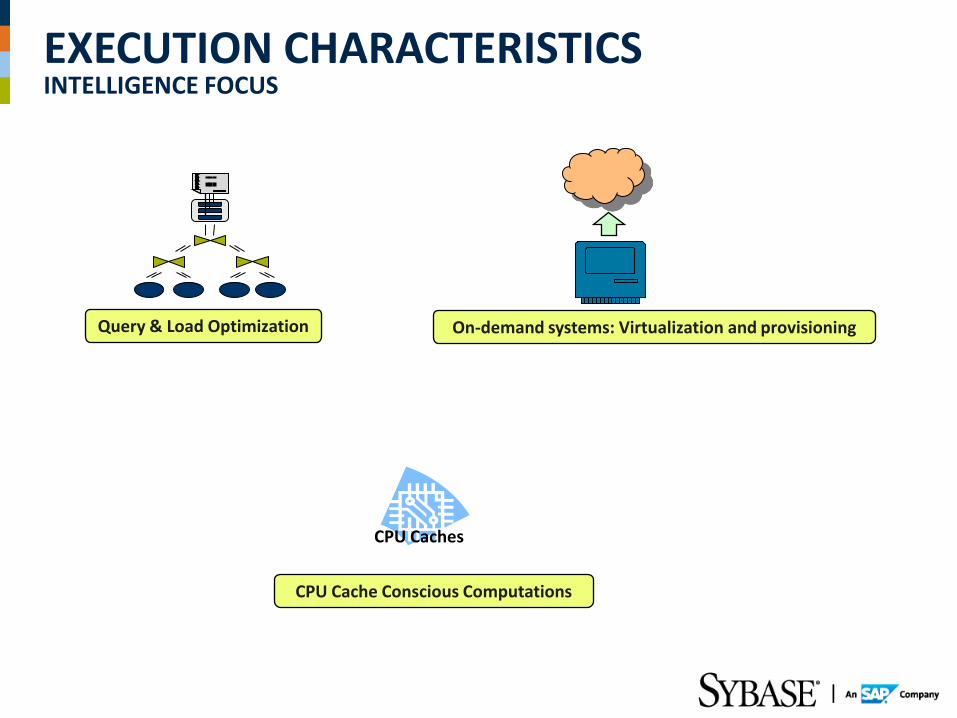
EXECUTION CHARACTERISTICS INTELLIGENCE FOCUS
Query & Load Optimization On-demand systems: Virtualization and provisioning
CPU Cache Conscious Computations
CPU Caches
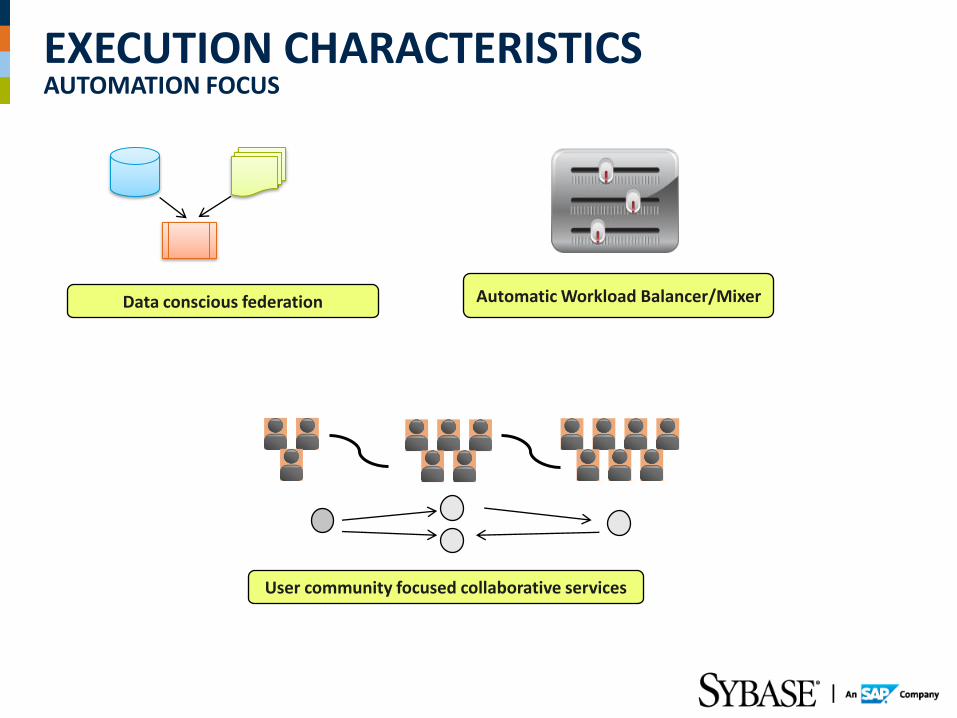
EXECUTION CHARACTERISTICS AUTOMATION FOCUS
Data conscious federation Automatic Workload Balancer/Mixer
User community focused collaborative services
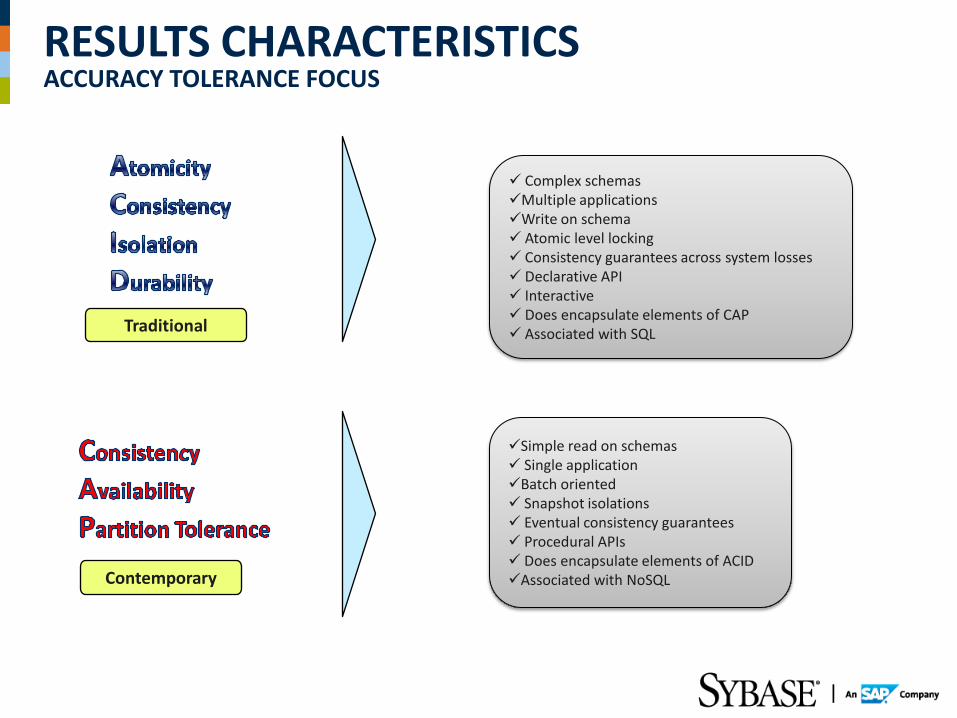
RESULTS CHARACTERISTICS ACCURACY TOLERANCE FOCUS
Complex schemas Multiple applications Write on schema Atomic level locking Consistency guarantees across system losses Declarative API Interactive Does encapsulate elements of CAP Associated with SQL Traditional
Contemporary
Simple read on schemas Single application Batch oriented Snapshot isolations Eventual consistency guarantees Procedural APIs Does encapsulate elements of ACID Associated with NoSQL
BUILDING BIG DATA BRIDGES ACROSS A HETEROGENEOUS WORLD
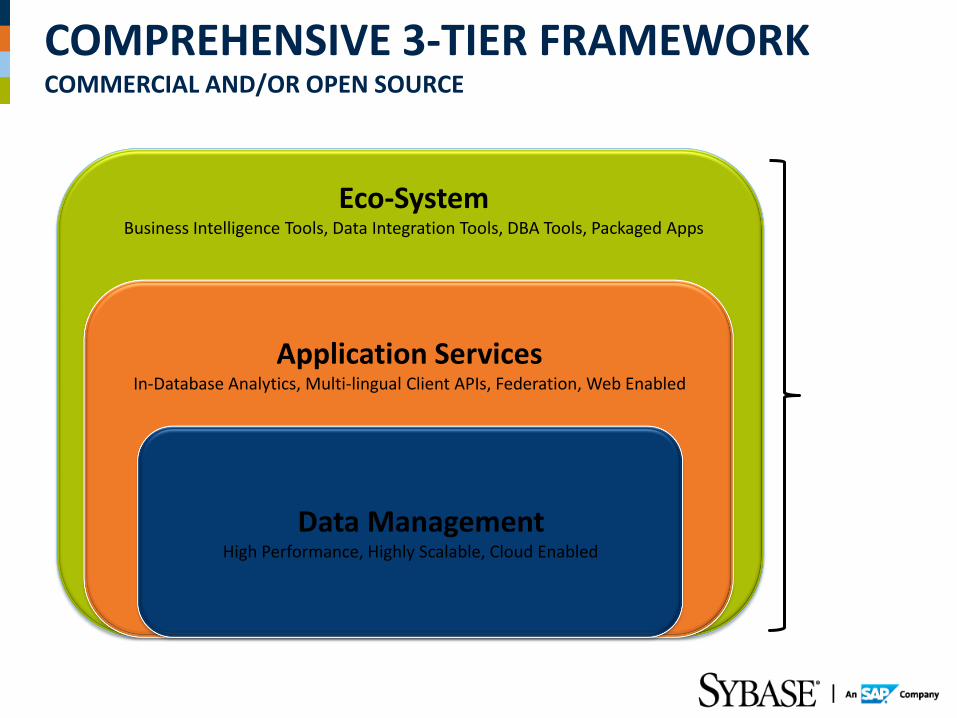
COMPREHENSIVE 3-TIER FRAMEWORK COMMERCIAL AND/OR OPEN SOURCE
Data Management High Performance, Highly Scalable, Cloud Enabled
Application Services In-Database Analytics, Multi-lingual Client APIs, Federation, Web Enabled
Eco-System Business Intelligence Tools, Data Integration Tools, DBA Tools, Packaged Apps
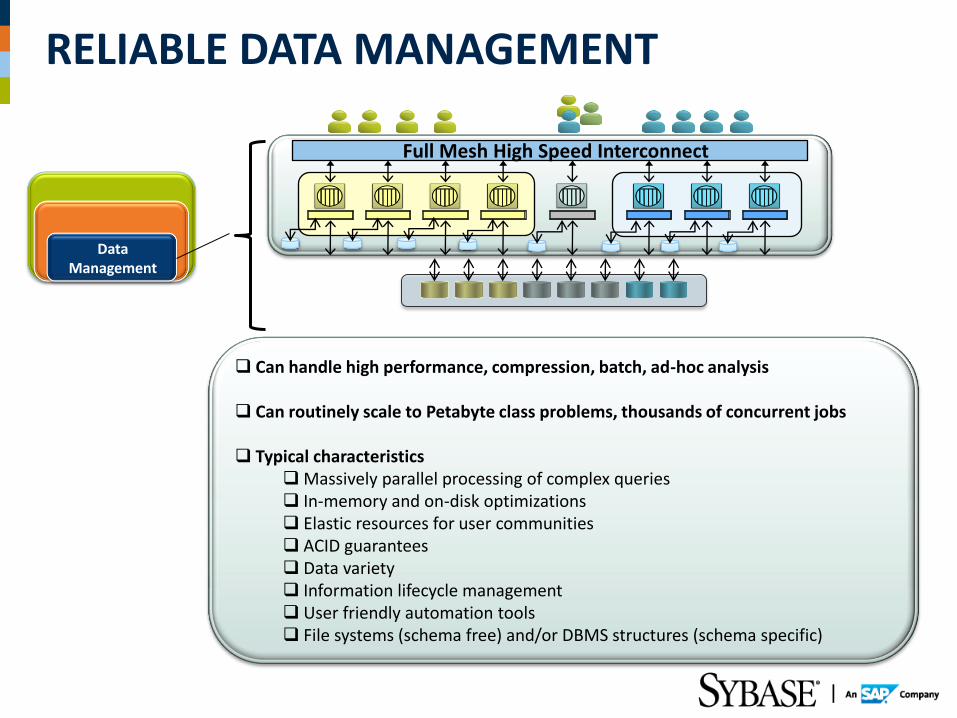
RELIABLE DATA MANAGEMENT
Full Mesh High Speed Interconnect
Data Management
Can handle high performance, compression, batch, ad-hoc analysis
Can routinely scale to Petabyte class problems, thousands of concurrent jobs Typical characteristics
Massively parallel processing of complex queries In-memory and on-disk optimizations Elastic resources for user communities ACID guarantees Data variety Information lifecycle management User friendly automation tools File systems (schema free) and/or DBMS structures (schema specific)
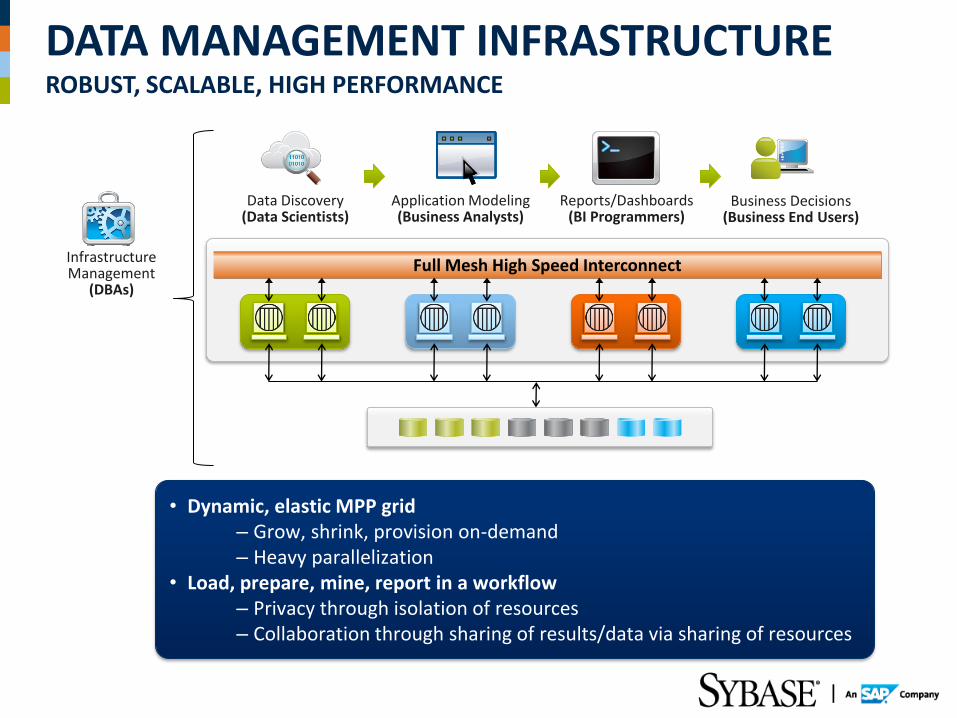
DATA MANAGEMENT INFRASTRUCTURE ROBUST, SCALABLE, HIGH PERFORMANCE
Data Discovery (Data Scientists)
Application Modeling (Business Analysts)
Reports/Dashboards (BI Programmers)
Business Decisions (Business End Users)
Infrastructure Management
(DBAs)
• Dynamic, elastic MPP grid – Grow, shrink, provision on-demand – Heavy parallelization
• Load, prepare, mine, report in a workflow – Privacy through isolation of resources – Collaboration through sharing of results/data via sharing of resources
Full Mesh High Speed Interconnect
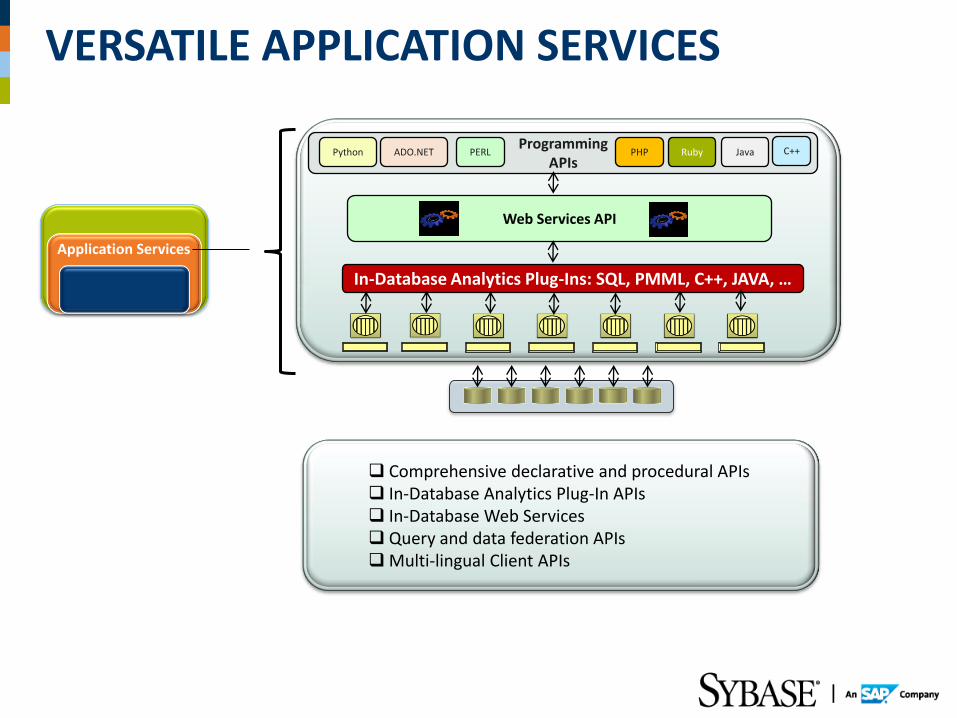
VERSATILE APPLICATION SERVICES
Comprehensive declarative and procedural APIs In-Database Analytics Plug-In APIs In-Database Web Services Query and data federation APIs Multi-lingual Client APIs
In-Database Analytics Plug-Ins: SQL, PMML, C++, JAVA, …
Web Services API
Programming APIs
Application Services
Python ADO.NET PERL PHP Ruby Java C++
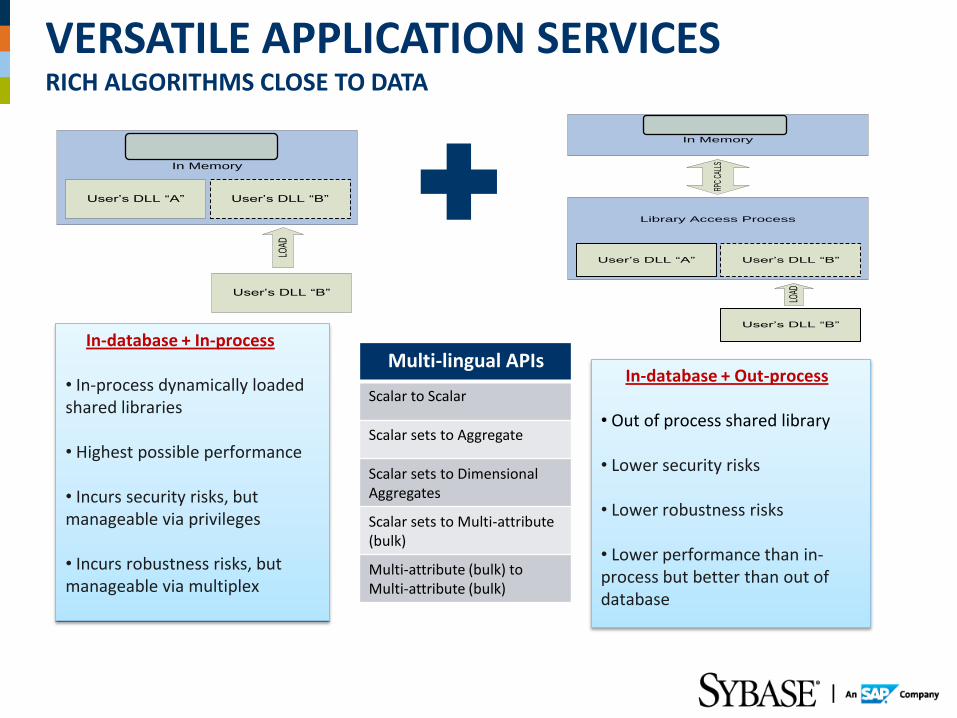
VERSATILE APPLICATION SERVICES RICH ALGORITHMS CLOSE TO DATA
Sybase IQ Process
In Memory
User’s DLL “A” User’s DLL “B”
User’s DLL “B”LO
AD
In-database + In-process • In-process dynamically loaded shared libraries
• Highest possible performance
• Incurs security risks, but manageable via privileges
• Incurs robustness risks, but manageable via multiplex
Sybase IQ Process
In Memory
LOAD
Library Access Process
RPC
CALL
S
User’s DLL “A”
User’s DLL “B”
User’s DLL “B”
In-database + Out-process • Out of process shared library
• Lower security risks
• Lower robustness risks
• Lower performance than in-process but better than out of database
Multi-lingual APIs
Scalar to Scalar
Scalar sets to Aggregate
Scalar sets to Dimensional Aggregates
Scalar sets to Multi-attribute (bulk)
Multi-attribute (bulk) to Multi-attribute (bulk)
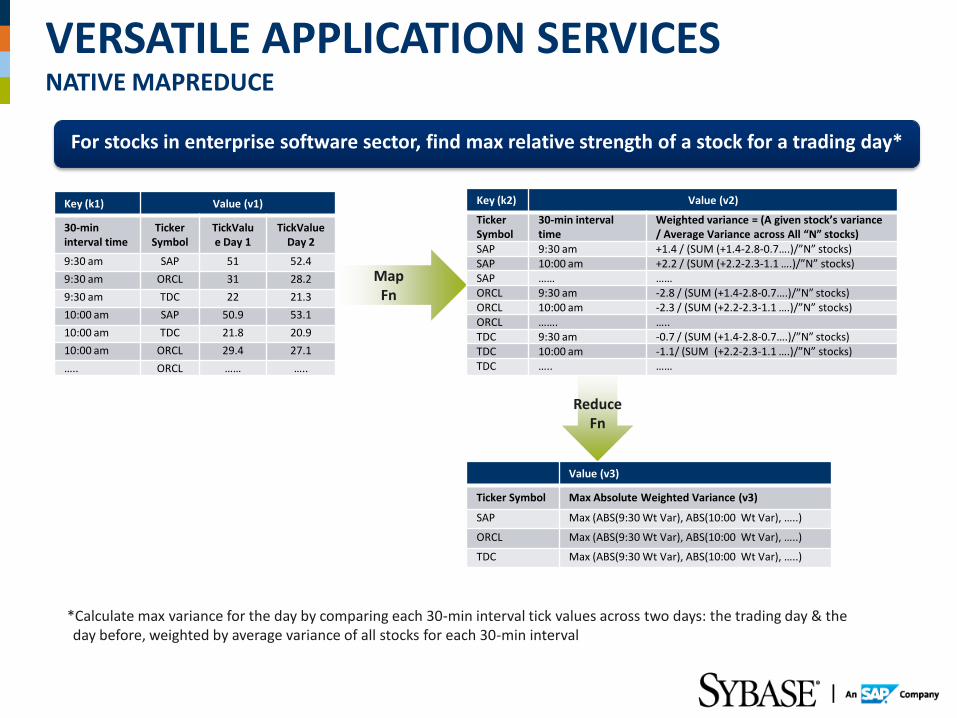
VERSATILE APPLICATION SERVICES NATIVE MAPREDUCE
Map Fn
For stocks in enterprise software sector, find max relative strength of a stock for a trading day*
Key (k1) Value (v1)
30-min interval time
Ticker Symbol
TickValue Day 1
TickValue Day 2
9:30 am SAP 51 52.4
9:30 am ORCL 31 28.2
9:30 am TDC 22 21.3
10:00 am SAP 50.9 53.1
10:00 am TDC 21.8 20.9
10:00 am ORCL 29.4 27.1
….. ORCL …… …..
Value (v3)
Ticker Symbol Max Absolute Weighted Variance (v3)
SAP Max (ABS(9:30 Wt Var), ABS(10:00 Wt Var), …..)
ORCL Max (ABS(9:30 Wt Var), ABS(10:00 Wt Var), …..)
TDC Max (ABS(9:30 Wt Var), ABS(10:00 Wt Var), …..)
*Calculate max variance for the day by comparing each 30-min interval tick values across two days: the trading day & the day before, weighted by average variance of all stocks for each 30-min interval
Key (k2) Value (v2)
Ticker Symbol
30-min interval time
Weighted variance = (A given stock’s variance / Average Variance across All “N” stocks)
SAP 9:30 am +1.4 / (SUM (+1.4-2.8-0.7….)/”N” stocks) SAP 10:00 am +2.2 / (SUM (+2.2-2.3-1.1 ….)/”N” stocks) SAP …… …… ORCL 9:30 am -2.8 / (SUM (+1.4-2.8-0.7….)/”N” stocks) ORCL 10:00 am -2.3 / (SUM (+2.2-2.3-1.1 ….)/”N” stocks) ORCL ……. ….. TDC 9:30 am -0.7 / (SUM (+1.4-2.8-0.7….)/”N” stocks) TDC 10:00 am -1.1/ (SUM (+2.2-2.3-1.1 ….)/”N” stocks) TDC ….. ……
Reduce Fn
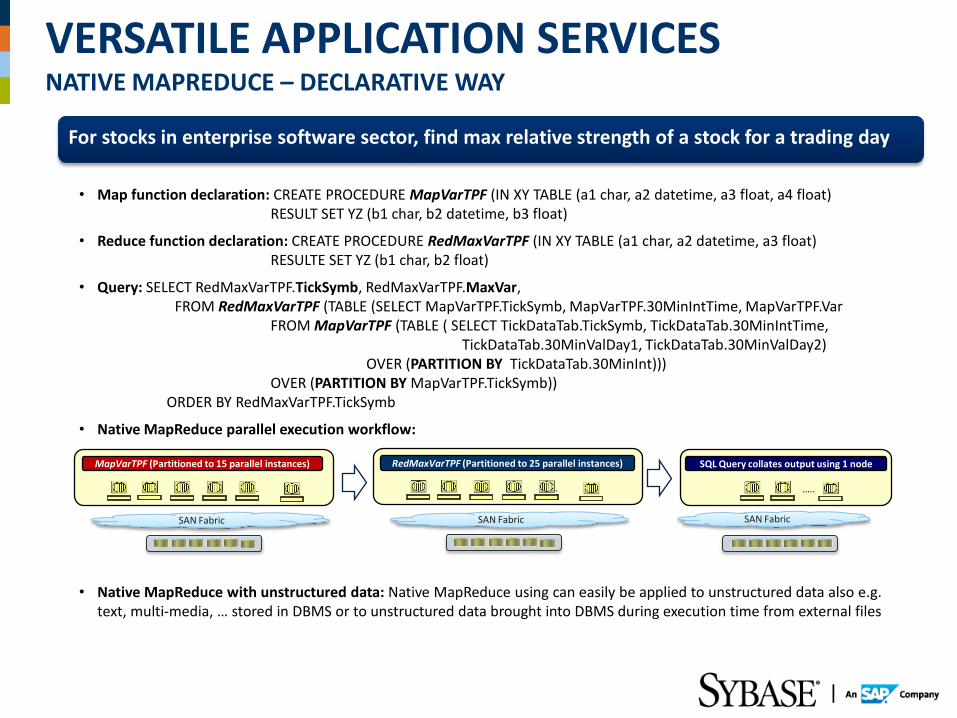
VERSATILE APPLICATION SERVICES NATIVE MAPREDUCE – DECLARATIVE WAY
…….
SAN Fabric
MapVarTPF (Partitioned to 15 parallel instances)
…..
SAN Fabric
SQL Query collates output using 1 node
…….
SAN Fabric
RedMaxVarTPF (Partitioned to 25 parallel instances)
For stocks in enterprise software sector, find max relative strength of a stock for a trading day
• Map function declaration: CREATE PROCEDURE MapVarTPF (IN XY TABLE (a1 char, a2 datetime, a3 float, a4 float) RESULT SET YZ (b1 char, b2 datetime, b3 float)
• Reduce function declaration: CREATE PROCEDURE RedMaxVarTPF (IN XY TABLE (a1 char, a2 datetime, a3 float) RESULTE SET YZ (b1 char, b2 float)
• Query: SELECT RedMaxVarTPF.TickSymb, RedMaxVarTPF.MaxVar, FROM RedMaxVarTPF (TABLE (SELECT MapVarTPF.TickSymb, MapVarTPF.30MinIntTime, MapVarTPF.Var FROM MapVarTPF (TABLE ( SELECT TickDataTab.TickSymb, TickDataTab.30MinIntTime, TickDataTab.30MinValDay1, TickDataTab.30MinValDay2) OVER (PARTITION BY TickDataTab.30MinInt))) OVER (PARTITION BY MapVarTPF.TickSymb))
ORDER BY RedMaxVarTPF.TickSymb
• Native MapReduce parallel execution workflow:
• Native MapReduce with unstructured data: Native MapReduce using can easily be applied to unstructured data also e.g. text, multi-media, … stored in DBMS or to unstructured data brought into DBMS during execution time from external files
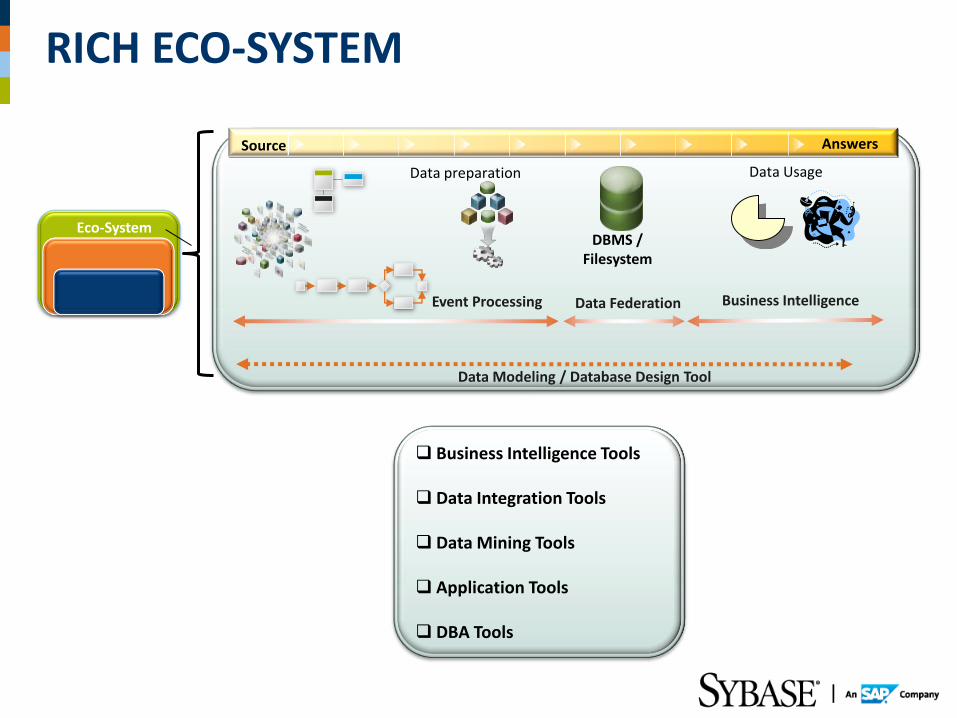
RICH ECO-SYSTEM
Business Intelligence Tools
Data Integration Tools
Data Mining Tools
Application Tools
DBA Tools
Answers
DBMS / Filesystem
Data Federation
Data preparation Data Usage
Data Modeling / Database Design Tool
Event Processing
Source
Eco-System
Business Intelligence
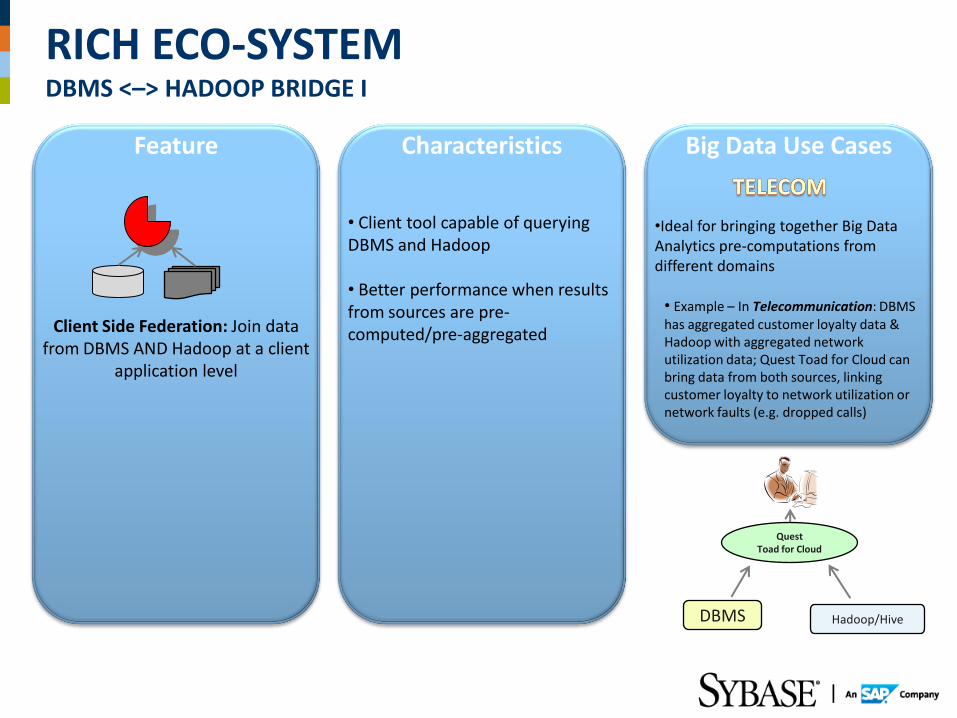
RICH ECO-SYSTEM DBMS <–> HADOOP BRIDGE I
Feature Characteristics Big Data Use Cases
Client Side Federation: Join data from DBMS AND Hadoop at a client
application level
• Client tool capable of querying DBMS and Hadoop
• Better performance when results from sources are pre-computed/pre-aggregated
•Ideal for bringing together Big Data Analytics pre-computations from different domains
• Example – In Telecommunication: DBMS has aggregated customer loyalty data & Hadoop with aggregated network utilization data; Quest Toad for Cloud can bring data from both sources, linking customer loyalty to network utilization or network faults (e.g. dropped calls)
DBMS
Quest Toad for Cloud
Hadoop/Hive
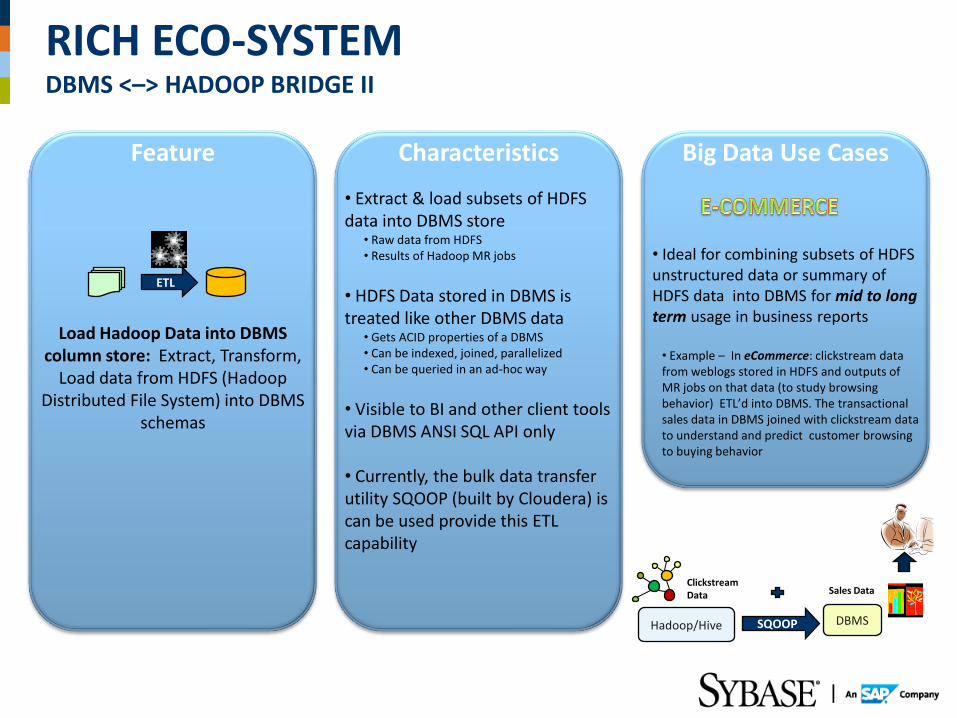
Feature Characteristics Big Data Use Cases
Load Hadoop Data into DBMS column store: Extract, Transform,
Load data from HDFS (Hadoop Distributed File System) into DBMS
schemas
• Extract & load subsets of HDFS data into DBMS store
• Raw data from HDFS • Results of Hadoop MR jobs
• HDFS Data stored in DBMS is treated like other DBMS data
• Gets ACID properties of a DBMS • Can be indexed, joined, parallelized • Can be queried in an ad-hoc way
• Visible to BI and other client tools via DBMS ANSI SQL API only
• Currently, the bulk data transfer utility SQOOP (built by Cloudera) is can be used provide this ETL capability
• Ideal for combining subsets of HDFS unstructured data or summary of HDFS data into DBMS for mid to long term usage in business reports
• Example – In eCommerce: clickstream data from weblogs stored in HDFS and outputs of MR jobs on that data (to study browsing behavior) ETL’d into DBMS. The transactional sales data in DBMS joined with clickstream data to understand and predict customer browsing to buying behavior
ETL
SQOOP
Clickstream Data Sales Data
DBMS
RICH ECO-SYSTEM DBMS <–> HADOOP BRIDGE II
Hadoop/Hive
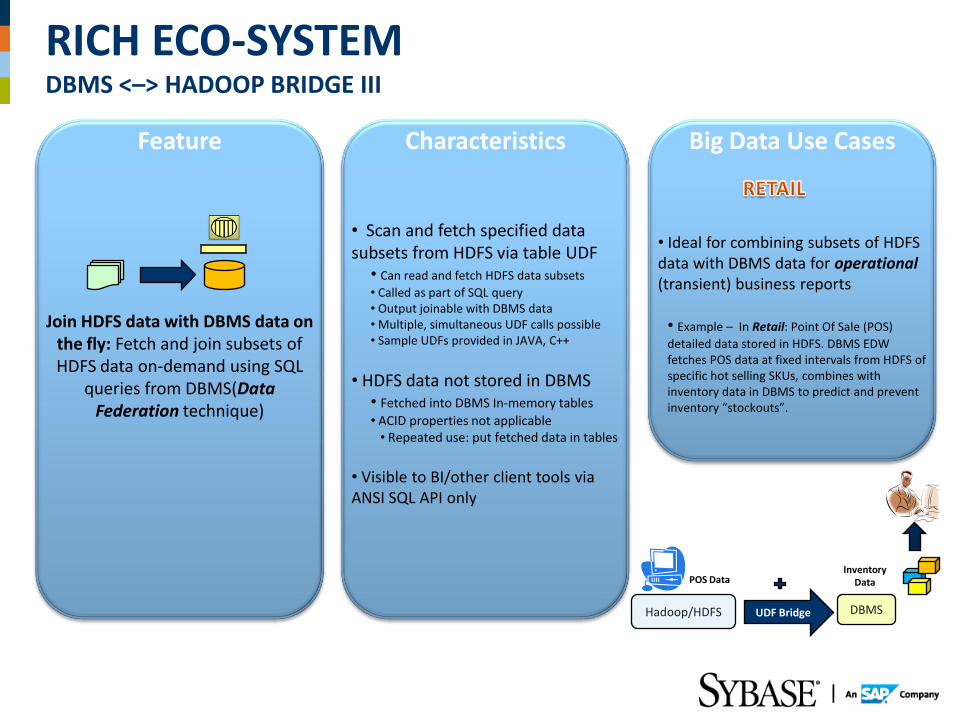
Feature Characteristics Big Data Use Cases
Join HDFS data with DBMS data on the fly: Fetch and join subsets of HDFS data on-demand using SQL
queries from DBMS(Data Federation technique)
• Scan and fetch specified data subsets from HDFS via table UDF
• Can read and fetch HDFS data subsets
• Called as part of SQL query • Output joinable with DBMS data • Multiple, simultaneous UDF calls possible • Sample UDFs provided in JAVA, C++
• HDFS data not stored in DBMS • Fetched into DBMS In-memory tables
• ACID properties not applicable • Repeated use: put fetched data in tables
• Visible to BI/other client tools via ANSI SQL API only
• Ideal for combining subsets of HDFS data with DBMS data for operational (transient) business reports • Example – In Retail: Point Of Sale (POS)
detailed data stored in HDFS. DBMS EDW fetches POS data at fixed intervals from HDFS of specific hot selling SKUs, combines with inventory data in DBMS to predict and prevent inventory “stockouts”.
UDF Bridge
POS Data Inventory
Data
DBMS
RICH ECO-SYSTEM DBMS <–> HADOOP BRIDGE III
Hadoop/HDFS
Feature Characteristics Big Data Use Cases
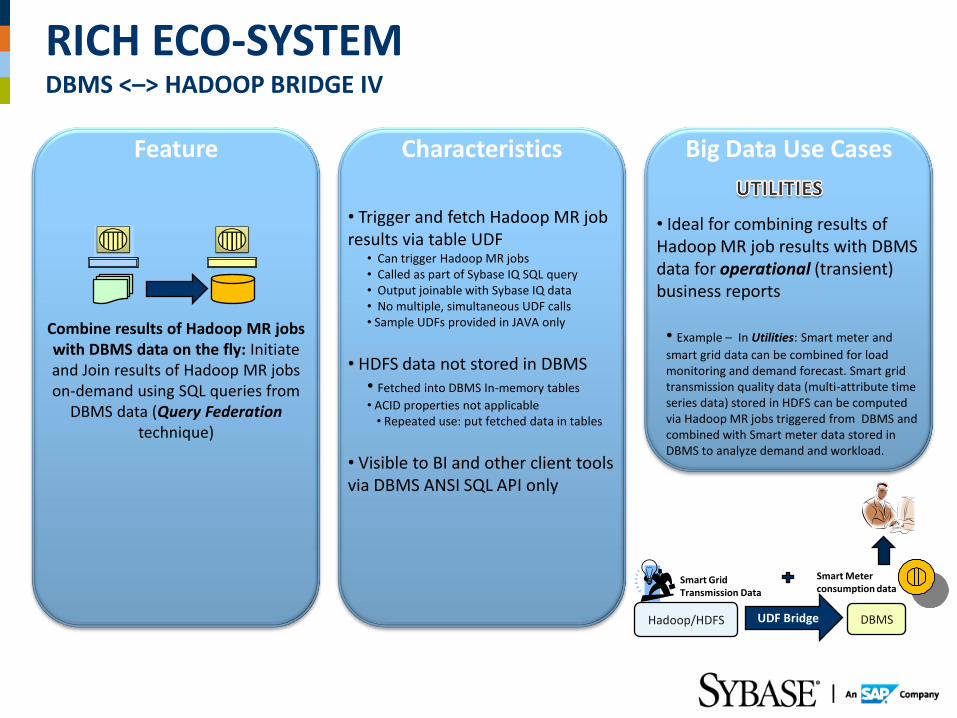
Combine results of Hadoop MR jobs with DBMS data on the fly: Initiate and Join results of Hadoop MR jobs on-demand using SQL queries from
DBMS data (Query Federation technique)
• Trigger and fetch Hadoop MR job results via table UDF
• Can trigger Hadoop MR jobs • Called as part of Sybase IQ SQL query • Output joinable with Sybase IQ data • No multiple, simultaneous UDF calls • Sample UDFs provided in JAVA only
• HDFS data not stored in DBMS
• Fetched into DBMS In-memory tables
• ACID properties not applicable • Repeated use: put fetched data in tables
• Visible to BI and other client tools via DBMS ANSI SQL API only
• Ideal for combining results of Hadoop MR job results with DBMS data for operational (transient) business reports • Example – In Utilities: Smart meter and
smart grid data can be combined for load monitoring and demand forecast. Smart grid transmission quality data (multi-attribute time series data) stored in HDFS can be computed via Hadoop MR jobs triggered from DBMS and combined with Smart meter data stored in DBMS to analyze demand and workload.
Smart Grid Transmission Data
Smart Meter consumption data
UDF Bridge DBMS
RICH ECO-SYSTEM DBMS <–> HADOOP BRIDGE IV
Hadoop/HDFS
Database Server DBMS
Applications
PMML (models)
PMML (models)
PMML (models)
PMML Preprocessor (convert & validate)
Universal Plug-In
SQL
Predictions
UD
Fs
Bridge
PM
ML
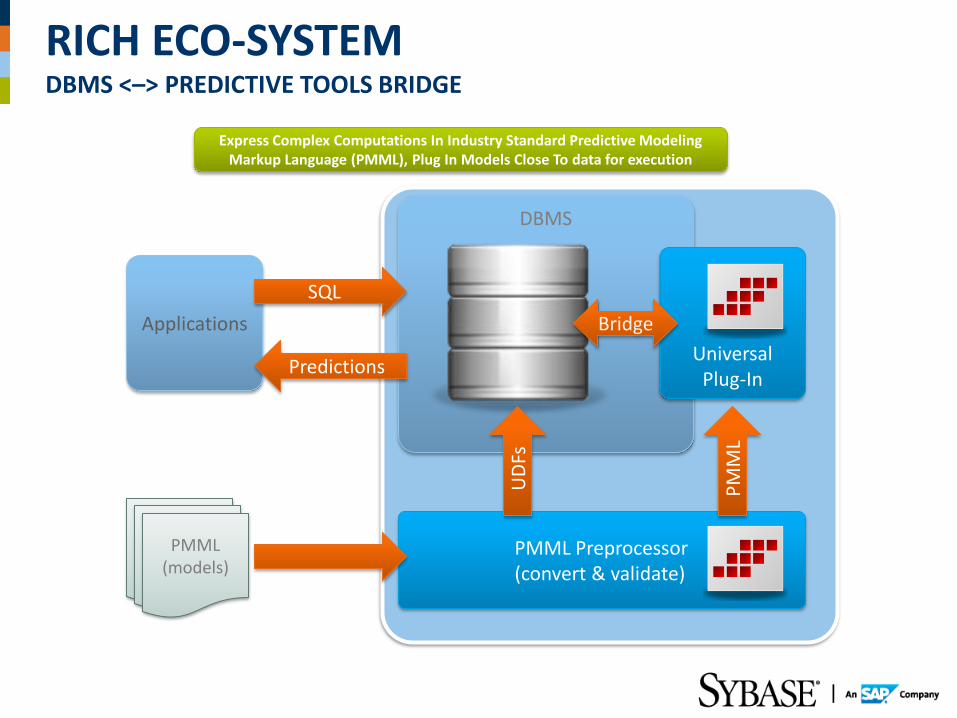
RICH ECO-SYSTEM DBMS <–> PREDICTIVE TOOLS BRIDGE
Express Complex Computations In Industry Standard Predictive Modeling Markup Language (PMML), Plug In Models Close To data for execution
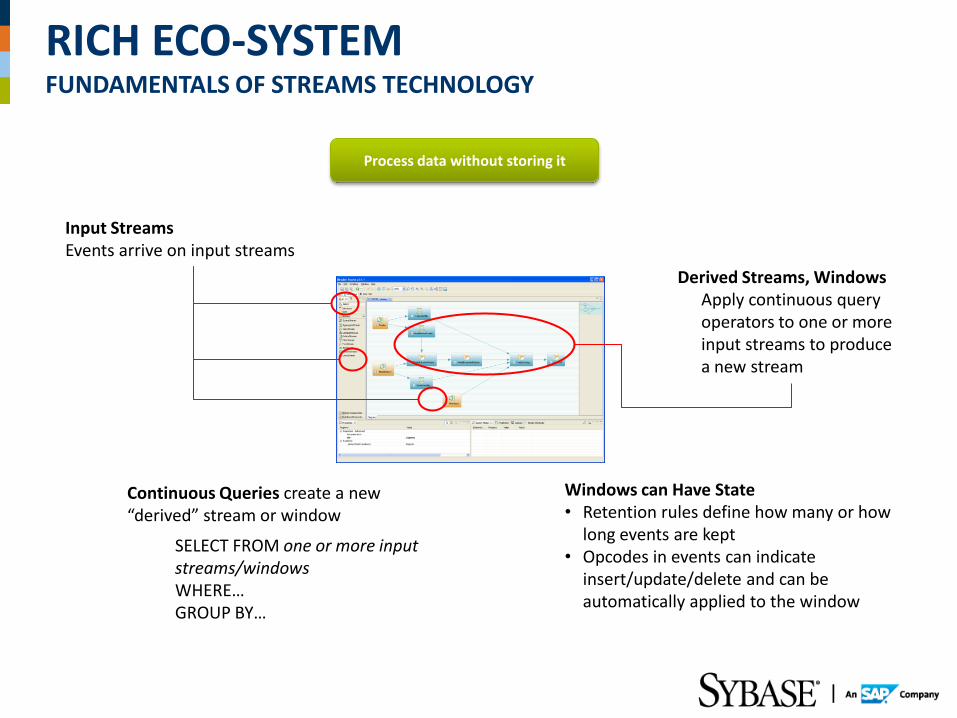
Input Streams Events arrive on input streams
Derived Streams, Windows Apply continuous query operators to one or more input streams to produce a new stream
Continuous Queries create a new “derived” stream or window
SELECT FROM one or more input streams/windows WHERE… GROUP BY…
Windows can Have State • Retention rules define how many or how
long events are kept • Opcodes in events can indicate
insert/update/delete and can be automatically applied to the window
RICH ECO-SYSTEM FUNDAMENTALS OF STREAMS TECHNOLOGY
Process data without storing it
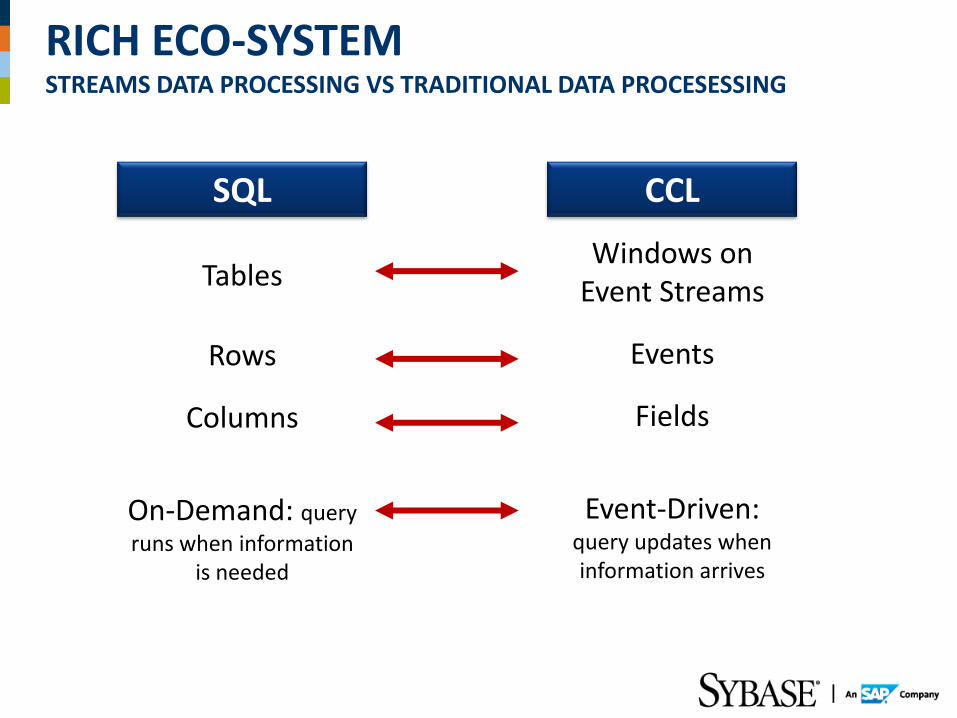
SQL CCL
Tables
Rows
Columns
On-Demand: query
runs when information is needed
Windows on Event Streams
Events
Fields
Event-Driven: query updates when information arrives
RICH ECO-SYSTEM STREAMS DATA PROCESSING VS TRADITIONAL DATA PROCESESSING
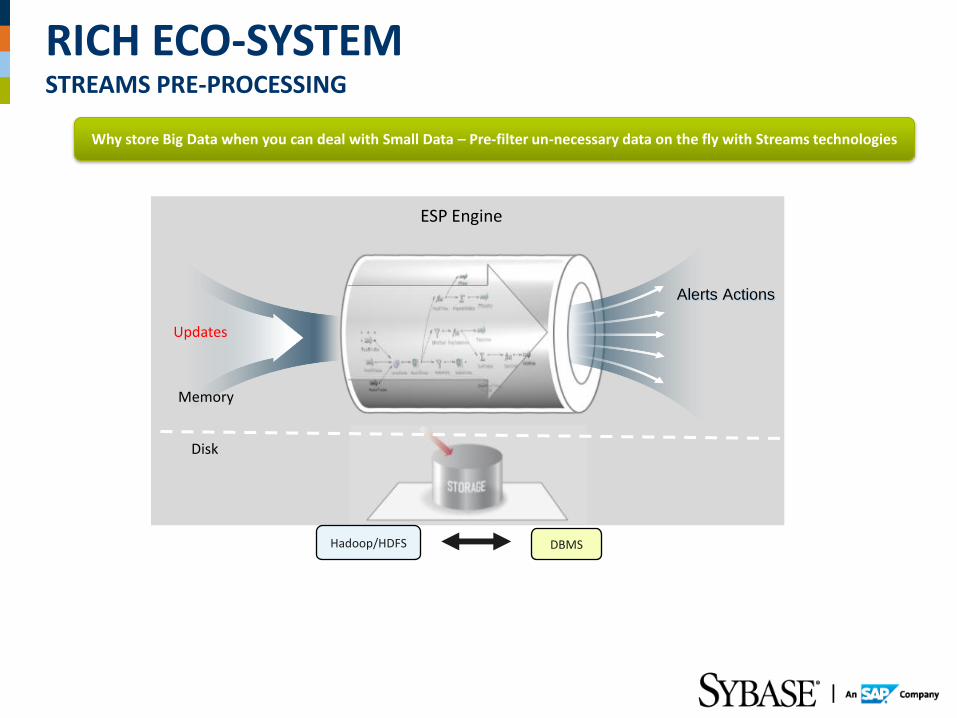
RICH ECO-SYSTEM STREAMS PRE-PROCESSING
Alerts Actions
ESP Engine
Memory
Disk
Updates
DBMS
Why store Big Data when you can deal with Small Data – Pre-filter un-necessary data on the fly with Streams technologies
Hadoop/HDFS
SUMMARY
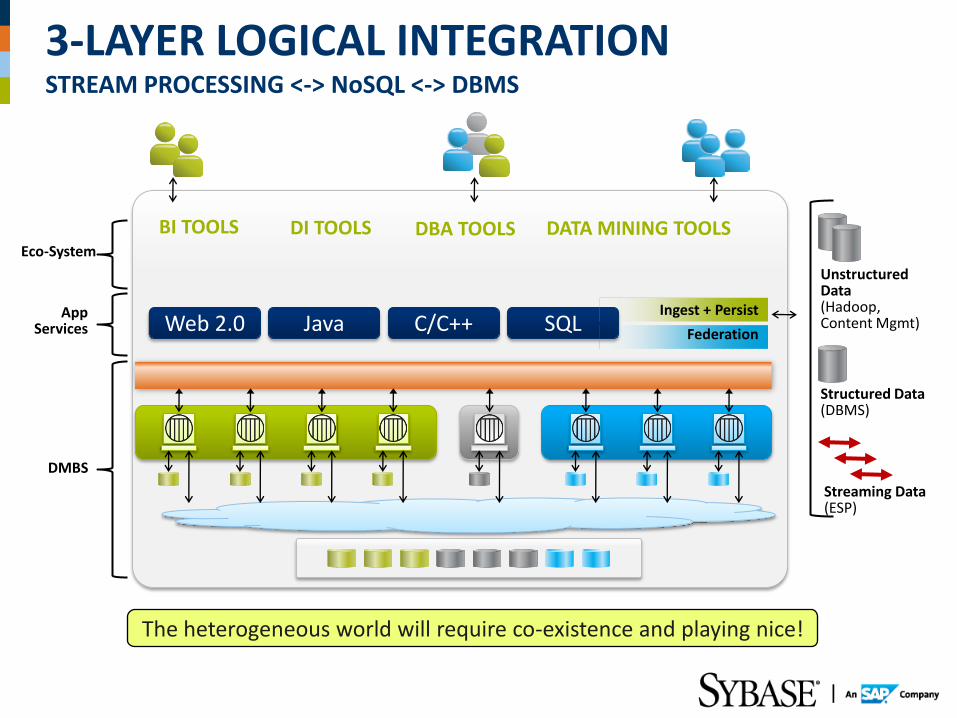
BI TOOLS DATA MINING TOOLS
Web 2.0 Java C/C++ SQL
DMBS
App Services
Eco-System
Unstructured Data (Hadoop, Content Mgmt)
Structured Data (DBMS)
Ingest + Persist
Federation
DI TOOLS DBA TOOLS
The heterogeneous world will require co-existence and playing nice!
Streaming Data (ESP)
3-LAYER LOGICAL INTEGRATION STREAM PROCESSING <-> NoSQL <-> DBMS
Q & A Learn More: http://www.sybase.com/sybaseiqbigdata
Contact: 1-800-SYBASE5 (792.2735)