Embed Size (px)
Citation preview

®
Big Data for Local Context
George Percivall OGC Chief Engineer, CTO
Location and Context 2015
3 November 2015
Copyright © 2015 Open Geospatial Consortium

OGC ®
Power of Location
• “Location targeting is holy grail for marketers” – Sir Martin Sorrell, CEO WPP at Mobile World Congress
• By measuring entropy of individual’s trajectory, we find 93% potential predictability in user mobility – Limits of Predictability in Human Mobility, Science 2010
• 1st law of geography: "Everything is related to everything else, but near things are more related than distant things.” – Waldo Tobler
© 2013 Open Geospatial Consortium 2

OGC ®
Commercial 39%
Government 27%
NGO 8%
Research 6%
University 20%
The Open Geospatial Consortium
Copyright © 2015 Open Geospatial Consortium
Not-for-profit, international voluntary consensus standards organization; leading development of geospatial standards • Founded in 1994.
• 515+ members and growing
• 48 standards
• Thousands of implementations
• Broad user community implementation worldwide
• Alliances and collaborative activities with ISO and many other SDO’s
Africa 4
Asia Pacific
86
Europe 209
Middle East 34
North America
182
South America
3

Contexts & Possibilities
PRESENT
Behaviors & Actuals
PAST
Predictions & Potentials
FUTURE
Source: Jon Spinney, Location Intelligence, Pitney Bowes

5
Marketing Automaton
Source: Jon Spinney, Location Intelligence, Pitney Bowes

6
By Analyzing Large Volumes of Historical Mobile Location Data Married with Place & Demographic Data, We Can Create Audience Segments and New Enriched Lifestyle Profiles for Targeting.
Source: Jon Spinney, Location Intelligence, Pitney Bowes

7
Risk Analysis
Source: Jon Spinney, Location Intelligence, Pitney Bowes

8
By Analyzing Large Volumes of Historical Travel Data coupled with Historical Accident Observations, and Present Observations, We Can Assign Estimated Risk & Associated Insurance Premiums to Auto Plans.
Source: Jon Spinney, Location Intelligence, Pitney Bowes

OGC ®
Geospatial Context via “Space Time Boxes”
Jeff Jonas, IBM Fellow. Chief Scientist, Context Computing Strata + Hadoop World 2015

OGC ®
Spatial Bins used for Local Context
Copyright © 2015 Open Geospatial Consortium
Canberra region with hexagon grid.

OGC ®
Discrete Global Grid Systems
Source: Matt Purss, Geoscience Australia
National Nested Grid
SCENZ-Grid
Earth System Spatial Grid
Snyder Grid

OGC ®
OGC Discrete Global Grid Systems (DGGS)
• Common criteria and terms for spatial grids • Facilitate interoperability and data fusion • Support marketplaces of spatial data
• Public comment period to begin next week
http://www.opengeospatial.org/projects/groups/dggsswg

OGC ®
Big Data Spatial Analytics - GeoWave
Copyright © 2015 Open Geospatial Consortium
Geographic objects and operators in Apache Accumulo Advanced support for OGC spatial types: 3D and temporal
GeoServer plugin for OGC Web Services http://ngageoint.github.io/geowave/

OGC ®
Detecting proximity and colocation in time
Copyright © 2013 Open Geospatial Consortium
time
Spatial plane
1 prism = 1 leaf + 1 sweep(&attribute)
End leaf of tracks
id=1
Id=2
11:11:20.835 11:11:26.215 11:11:28.021 11:11:30.127
(C)
(B)(D)
(A)
OGC Moving Features Standard implements ISO 19141

OGC ®
OGC Moving Features Encoding Standard
• "Moving features" data describes such things as vehicles, pedestrians, airplanes and ships. – This is Big Data – high volume, high velocity.
• CSV and XML encodings of ISO 19141
Copyright © 2015 Open Geospatial Consortium
OGC ®
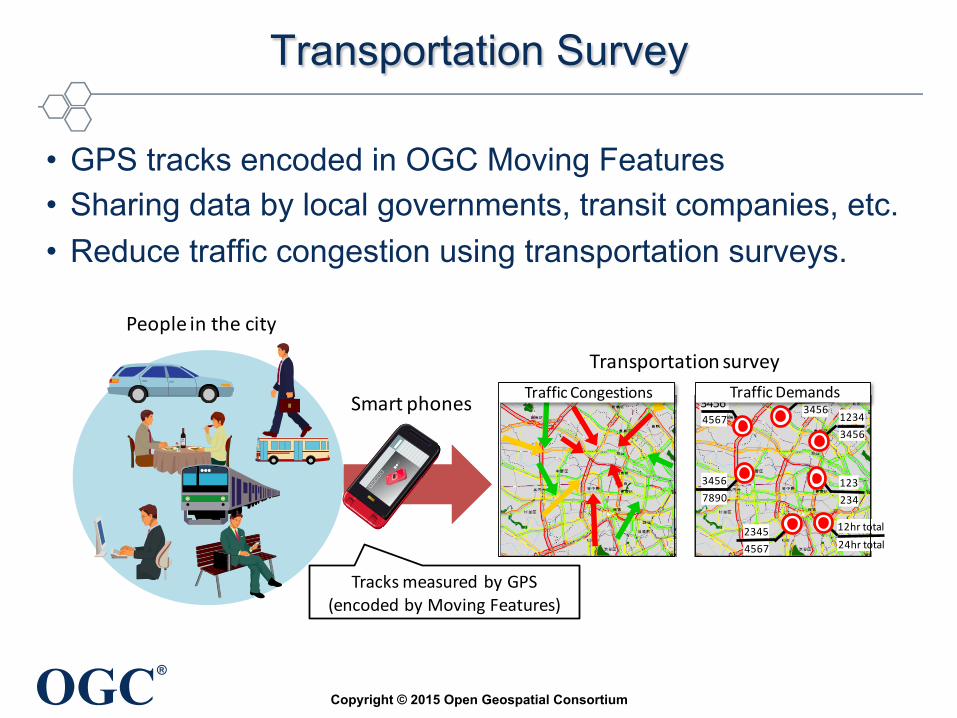
Transportation Survey
• GPS tracks encoded in OGC Moving Features • Sharing data by local governments, transit companies, etc. • Reduce traffic congestion using transportation surveys.
Copyright © 2015 Open Geospatial Consortium
Transportation survey
12343456
23454567
12343456
12hr total24hr total
123234
34564567
34567890
Traffic DemandsTraffic Congestions Smart phones
People in the city
Tracks measured by GPS(encoded by Moving Features)

OGC ®
Crime Pattern
• Predicting regions more vulnerable to crime based on Routine Activity Theory
Copyright © 2015 Open Geospatial Consortium

OGC ®
Layout design
Pedestrian-tracking to understand movements in facilities, e.g., shopping malls and transit terminals
Copyright © 2015 Open Geospatial Consortium

OGC ®
Indoor Geo-Portal
Indoor mCommerce
Emergency Control
Services for handicapped persons
Cruise Ship
Hospital
Indoor LBS
Indoor Security Indoor Robot
Indoor Location Application © 2015 Open Geospatial Consortium

OGC ®
Retail Location Analytics
Copyright © 2015 Open Geospatial Consortium
Source: HP Viewpoint paper - Retail location analytics
3
As an example, Figure 1 shows a department store that has been set up in a grid. Each square in the grid can be labeled with attributes that are significant to the retailer.
By tracking the frequency of visits and time spent in a particular department, the interests of a consumer can be determined. This information then provides a profile score revealing the fact that a consumer spends more time in a particular department, for example, tools versus cosmetics. Other data sources (like browsing behavior) can be combined with other profile information. This enables focused offers and promotions, taking into account users’ interests over long-term or short-term behavior.
Loyalty programs and “shoppers helper” applications Retailers are increasingly using loyalty programs to help retain consumers and analyze customer interests, looking for trends by demographic slices. As an example, Lowes keeps track of the paint mixtures that you use in your home. This enables you to match the paint in a room many years later by looking up the previously used color recipe. This not only helps the consumer, causing them to return to the store, but it also reveals important trends in decorating preferences
Shoppers helper smartphone applicationsA shoppers helper application on a smartphone helps shoppers in their quest for “the best deal.” It takes into account the type of products that the user is looking for, and then provides maps and indicators showing where the “best deals” are located in the local area. If a retail venue is equipped with indoor location functions, the shoppers helper can provide directions and maps to locate the products of interest in the store. While in the store, the application can also provide offers that may only appear while the shopper is inside the store itself.
By combining loyalty programs with these smartphone applications, and taking into account consumer interests and shopping lists, along with the indoor location functions, a smartphone shoppers helper app can aid consumers in locating “deals” on products they’re searching for. This applies whether it’s in a mall, department store, or even in a super-sized grocery store.
Augmented reality—AurasmaRetailers are starting to use augmented reality to produce interesting interactive and immersing marketing campaigns. One example is shown on Figure 2.
Viewpoint paper | Retail location analytics
Figure 1. Location grid

OGC ®
National Retail Federation
In-Store Use Cases • Marketing
– drive traffic to store – In-store targeting
• Customer Service – Locate a product in store – Shopping List - multi-channel – Request store associate
• Operations – Store setup – Stocking shelves
Copyright © 2015 Open Geospatial Consortium
ARTS Coordinate System & Insertion Points White Paper
Copyright ¤ 2013 NRF. All rights reserved.Page 11
Verbatim reproduction and distribution of this document is permitted in any medium, provided this notice is preserved.
Of Interest. The reverse is also true; an Area Of Interest can contain multiple Objects of Interest. This gives the flexibility to report the information in the most relevant format.
2.2 Recommended Coordinate System These different systems are in contention, so the recommendation presented in this best practices paper defines one common coordinate system, and one consistent origin system. Given that the ARTS Location Standard’s objective is to locate objects within a store as a whole, the recommended coordinate system has to apply across all ARTS standards. The floor-plan coordinate system is the recommendation as modified herein.
The origin is located at the bottom back left position of the object. This is the same origin used within planograms and the ARTS Video Analytics Standard.
This presents an interesting solution to a sloping shelf. The position of the origin of the shelf doesn’t change, since it is anchored at the back. If the bottom front left position was used, then when a shelf is sloped it would change the location of the origin, which would complicate the transformation algorithms. The following table highlights how existing system would be affected by adopting this standard:
Floor Plan System Planogram System
Origin Bottom Back Left of Fixture Bottom Back Left of Fixture
Coordinate System
Left-Hand Coordinate System Left-Hand Coordinate System
X axis Left to Right Left to Right
Y axis Front to Back Front to Back
Z axis Bottom to Top Bottom to Top
Graphics source: ARTS Coordinate System & Insertion Points Best Practices Version 1.0
ARTS Coordinate System & Insertion Points White Paper
Copyright ¤ 2013 NRF. All rights reserved.Page 1
Verbatim reproduction and distribution of this document is permitted in any medium, provided this notice is preserved.
ARTS Coordinate System & Insertion Points Best Practices
Version 1.0 November 29, 2013 – Last Call Working Draft
Chairman:
Dennis Blankenship Verizon
Phuc Do Toshiba
Members:
Graeme Shaw (Team Captain) Oracle
Curtis Philbrook JDA
Amit Chetal Cisco
Amnon Ribak IBM
Andy Mattice Access Via
Arun Hampapur IBM
Bart McGlothin Cisco
Marc MacDonald Epicor
Doug Wick Digby
Gordon Grant Pier House
Greg Demetri Click Click
Ian Auerbach Demandware
Josh Flippance Invatron
Krystal Kolodziej Aisle 411
In-store coordinate Reference Systems

OGC ®
CityGML and IndoorGML
1st layer: Topographic space model – building structure
– geometric-topological model
– network for route planning
2nd layer: Sensor space model – Radio/Beacon footprints – coverage of sensor areas – transition between sensor areas
• Builds on existing International standards CityGML and IFC
© 2015 Open Geospatial Consortium 22

} The ILA promotes the deployment of indoor location based services in mobile environment
} ILA and OGC working together on standards based architecture

OGC ®
Context Discovery across IoT Data Flow
Copyright © 2015 Open Geospatial Consortium
IEEE ACCESS 5
Data Archive
User
Smart Things
Sensors
Smart Wearable
Visualisation / Presentation / Recommendation
Cloud
Intermediary Communication and Processing
Devices
=Context Discovery
Real Time Processing
Fig. 6. Data Flow in IoT Solutions in High-level. Context can be discovers in different stages / phases in the data flow. A typical IoT solution may usesome part of the data flow architecture depending on the their intended functionalities.
First we introduce the name of the IoT solution in thecolumn (1) in Table II. We also provide the web page linkof the each product / solution. It is important to note that,these products does not have any related academic publication.Therefore, we believe that web page links are the most reliablereference to a given IoT solution. Such links allow readers tofollow further reading by using the product name along withweb link.
In column (2), we classify each product into five categories.Each category is denoted by a different colour: red (smartcity), yellow (smart environment), blue (smart enterprise),green (smart wearable), and purple (smart home). Somesolutions may belong to multiple categories. We divide the restof the columns into three section : Context-aware Tagging,Context Selection and Presentation, and Context execution.
1) Context-aware Tagging Section: Context-aware tagging,which is also called context augmentation and annotationrepresent the idea of sensing the environment and collectingprimary context information. We also believe that secondarycontext generation is also a part of context-aware taggingfeature. Primary context is any information retrieved withoutusing existing context and without performing any kind ofsensor data fusion operations [2]. For example, SenseAware(senseaware.com) is a solution developed to support real-timeshipment tracking. As illustrated in Figure 7, SenseAware
Fig. 7. SenseAware (senseaware.com) uses small smart devices that comprisesfive different built-in sensors with limited computational and communicationcapabilities. It reports the status of the packages in real time to the cloud.These smart devices comes in different sizes and form factors, as illustratedhere, in order to support different types of packaging methods (Two types ofsmart devices are shown in the figure)
collects and processes context information such as location,temperature, light, relative humidity and biometric pressurein order to enhance the visibility and transparency of thesupply chain. SenseAware uses both hardware and softwarecomponents in their sensor-based logistic solution. such datacollection allows different parties engage in supply chain tomonitor the movement of goods in real-time and accuratelyknow the quality of the transported goods and plan their pro-cesses effectively and efficiently. We list commonly acquiredprimary context information in column (3) in Table II.
Secondary context is any information that can be computedusing primary context. The secondary context can be com-puted by using sensor data fusion operations or data retrievaloperations such as web service calls (e.g. identify the distancebetween two sensors by applying sensor data fusion operationson two raw GPS sensor values). Further, retrieved context suchas phone numbers, addresses, email addresses, birthdays, listof friends from a contact information provider based on apersonal identity as the primary context can also be identifiedas secondary context. For example, Mimo (mimobaby.com)has built a smart nursery system, where parents learn newinsights about their baby through connected products like theMimo Smart Baby Monitor. In this product, turtle is the devicethat collects all primary context information. Then the datais transferred to an intermediary devices called lilypad. Suchresponsibility offloading strategy allows to reduce the turtle’sweight at minimum level and to increase the battery life. thecommunication and processing capabilities are offloaded to thelilypad device which can be easiy recharged when necessary.We can see Mimo Smart Baby Monitor usees some parts ofthe data flow architecture we presented in Figure II. Userinterface provided by Mimo and the data flow within thesolution is presented in Figure 8. Cloud services [34] performsthe additional processing and summarised data is pushedto the mobile devices for context presentation. In the userinterface, parents are presented mostly the secondary contextinformation such as baby movement or baby’s sleeping status.Accelerometer sensors are used to discover such secondarycontext information using pattern recognition techniques. Welist secondary context information generated by IoT solutions
Perera, C.; Liu, C.H.; Jayawardena, S.; Min Chen, "A Survey on Internet of Things From Industrial Market Perspective,”
Access, IEEE , vol.2, no., pp.1660-1679, 2014 doi: 10.1109/ACCESS.2015.2389854

OGC ®
OGC SensorThings API for IoT
• Builds on OGC Sensor Web Enablement (SWE) standards that are operational around the world
• Builds on Web protocols; easy-to-use RESTful style
• OGC candidate standard for open access to IoT devices
Copyright © 2015 Open Geospatial Consortium
Temperature: 29 C !Humidity: 29%!
Windspeed: 11 km/h!CO: 0.23 ppm!NO: 0.22 ppm!
Emergence of the Internet of Things
Temperature: 29 C !Humidity: 29%!
Windspeed: 11 km/h!CO: 0.23 ppm!NO: 0.22 ppm!
Temperature: 29 C !Humidity: 29%!
Windspeed: 11 km/h!CO: 0.23 ppm!NO: 0.22 ppm! Temperature: 29 C !
Humidity: 29%!Windspeed: 11 km/h!
CO: 0.23 ppm!NO: 0.22 ppm!
Temperature: 29 C !Humidity: 29%!
Windspeed: 11 km/h!CO: 0.23 ppm!NO: 0.22 ppm!Temperature: 29 C !
Humidity: 29%!Windspeed: 11 km/h!
CO: 0.23 ppm!NO: 0.22 ppm!
Temperature: 29 C !Humidity: 29%!
Windspeed: 11 km/h!CO: 0.23 ppm!NO: 0.22 ppm!
Temperature: 29 C !Humidity: 29%!
Windspeed: 11 km/h!CO: 0.23 ppm!NO: 0.22 ppm!
Graphic from Dr. Steve Liang Associate Professor / AITF-Microsoft Industry Chair"
OGC SensorThings SWG Chair
Temperature: 29 C !Humidity: 29%!
Windspeed: 11 km/h!CO: 0.23 ppm!NO: 0.22 ppm!
Temperature: 29 C !Humidity: 29%!
Windspeed: 11 km/h!CO: 0.23 ppm!NO: 0.22 ppm!
Temperature: 29 C !Humidity: 29%!
Windspeed: 11 km/h!CO: 0.23 ppm!NO: 0.22 ppm!
Temperature: 29 C !Humidity: 29%!
Windspeed: 11 km/h!CO: 0.23 ppm!NO: 0.22 ppm!
(Graphic source: Steve Liang, University of Calgary)

OGC ®
Region-Centric Geospatial Information
Feature-Centric Geospatial Information
Human-Centric Geospatial Information
Device-Centric Geospatial Information
1980s 1990s 2000s 2010s
Source of slide: Steve Liang, Univ. Calgary and chairman of OGC Sensor Web 4 IoT
Progression of geospatial information
© 2013 Open Geospatial Consortium, Inc. 26
èTowards Micro-geography

OGC ®
Scale of 1 to 1 by Lewis Carroll, 1893
Copyright © 2015 Open Geospatial Consortium
“And then came the grandest idea of all! We actually made a map of the country,
on the scale of a mile to the mile!”
“Have you used it much?” I enquired.
“It has never been spread out, yet. The farmers object: they said it would cover the whole country,
and shut out the sunlight!
So we now use the country itself, as its own map, and I assure you it does nearly as well.”

OGC ®
Join the OGC
Open Geospatial Consortium www.opengeospatial.org
OGC Standards - freely available www.opengeospatial.org/standards
OGC on YouTube http://www.youtube.com/user/ogcvideo
George Percivall [email protected]
Copyright © 2015 Open Geospatial Consortium