Embed Size (px)
Citation preview
BCWWAAnnual Conference
2013
CAPTURE, REDUCE AND REUSE
INTEGRATED WATER SYSTEMS MASTERPLANNING FOR A NEW COMMUNITY
Glen Shkurhan, P.Eng.April 2013
Presentation Goals
Describe unique integrated water systemsScenario’s and “What If’s?”Approach to analysis and assessmentPerformance variabilityAdaptive management
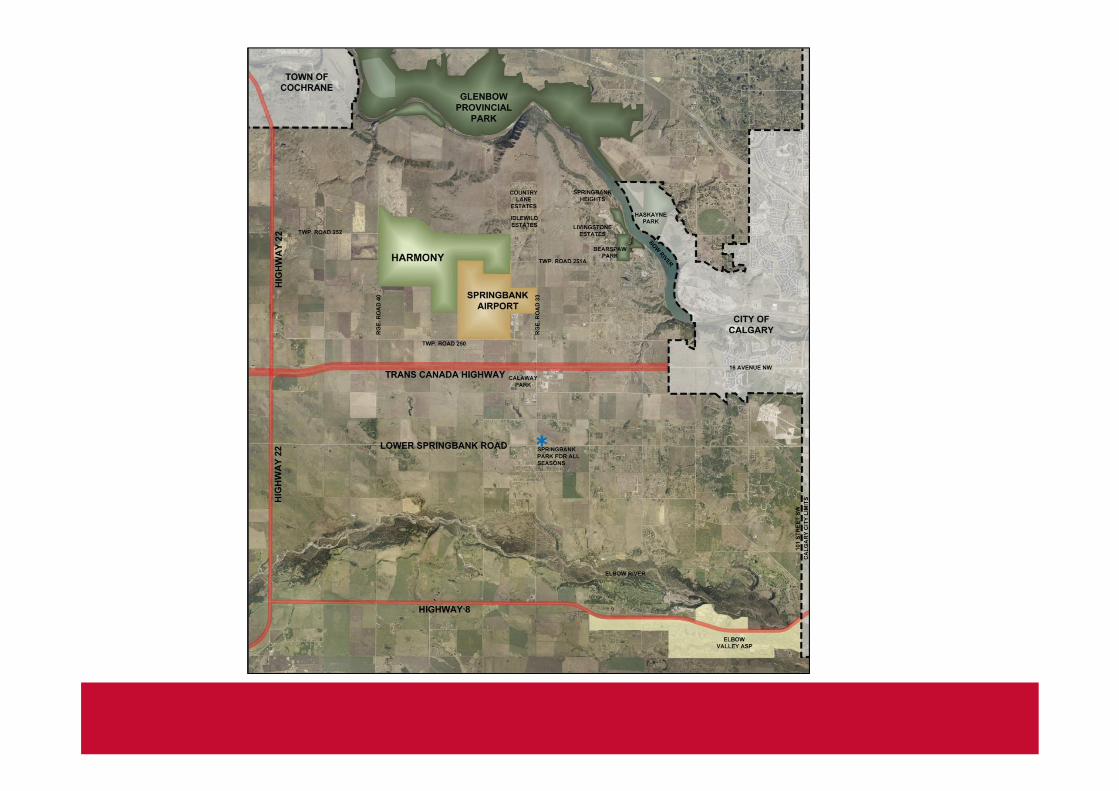
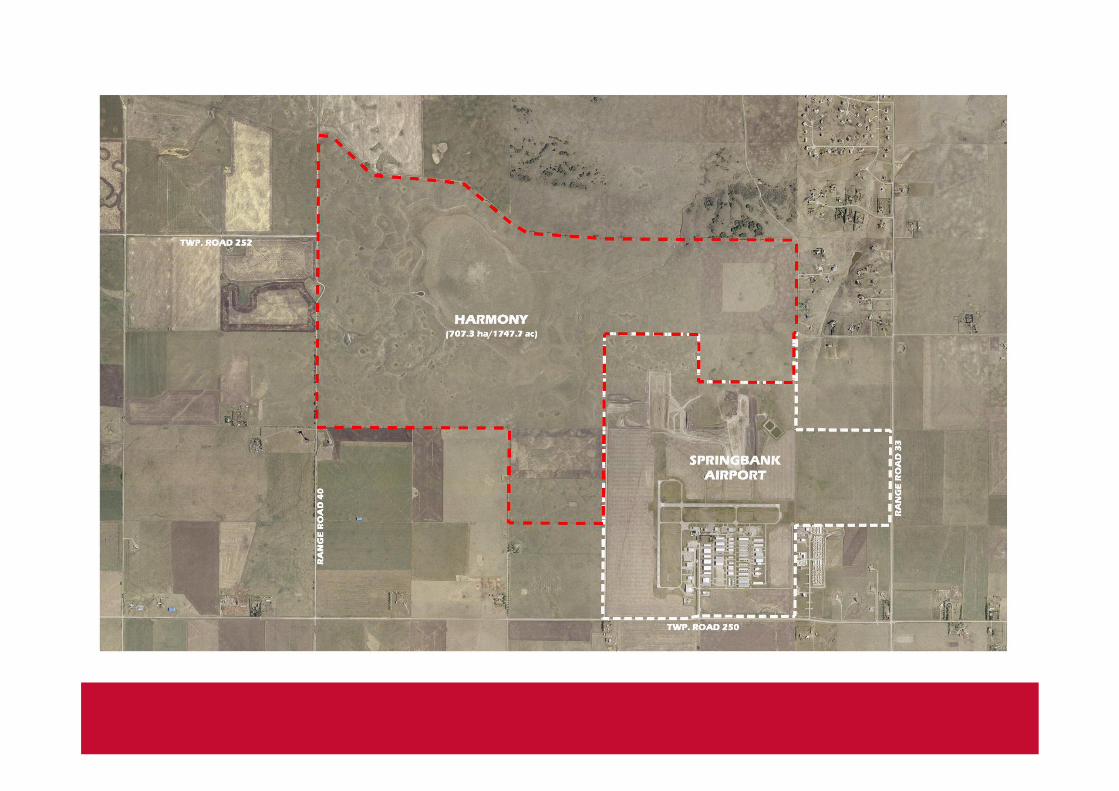
“Harmony”; guiding principles
“The provision of high quality water andwastewater services through responsible,sustainable, and innovative stewardship ofresources”.
“Smart Growth – effective use of resources”.
Water System Goals
CAPTURE
REDUCEREUSE

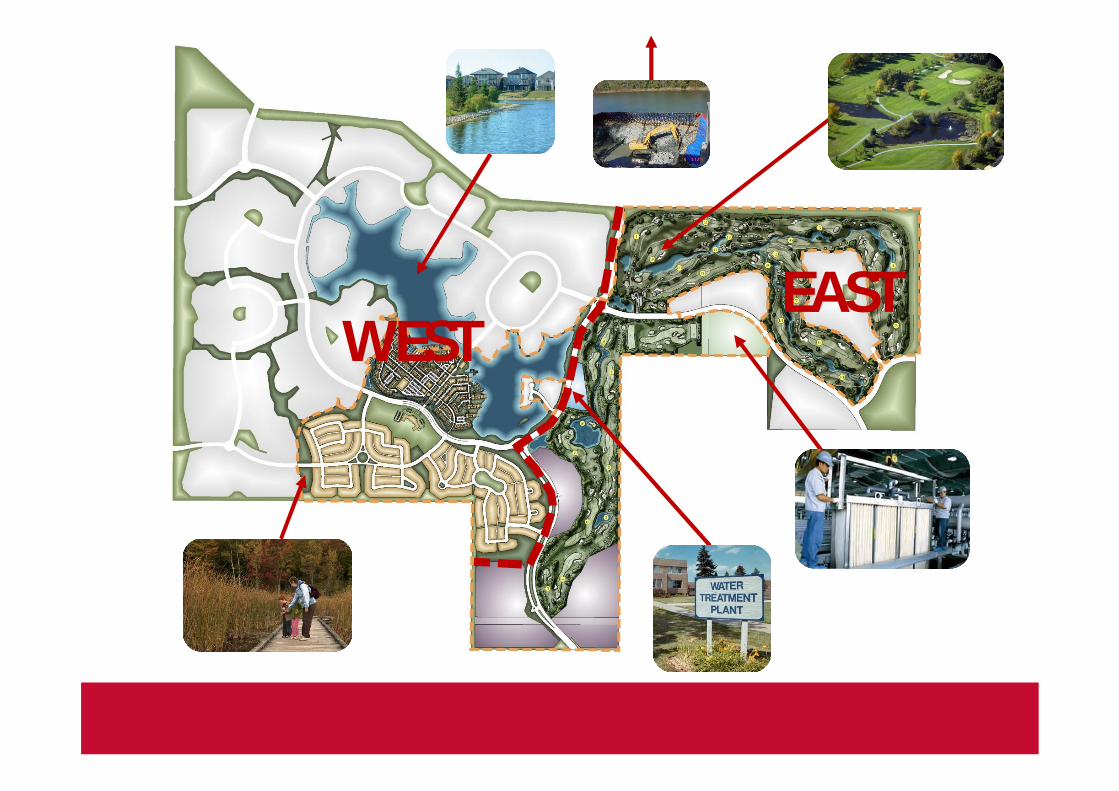
WESTEAST
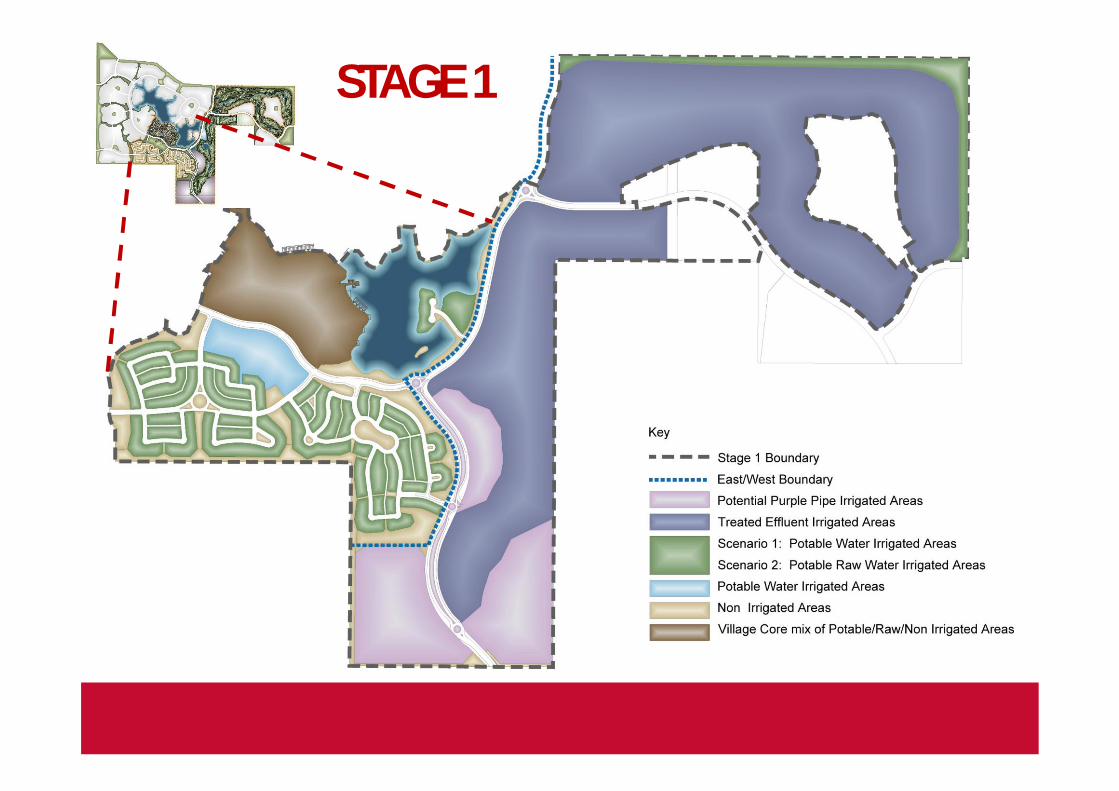
STAGE 1
SCENARIOS
• System Configuration, or Functional Condition• Time, or Stage of Development• Climatic Conditions
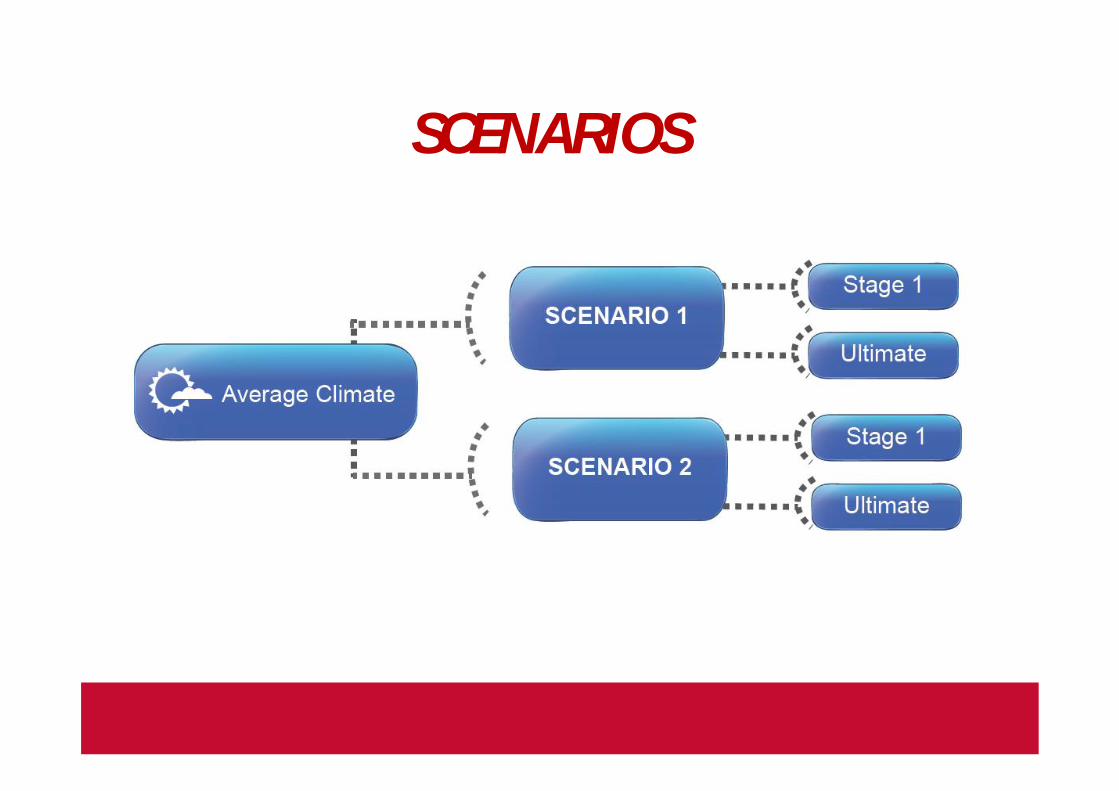
SCENARIOS
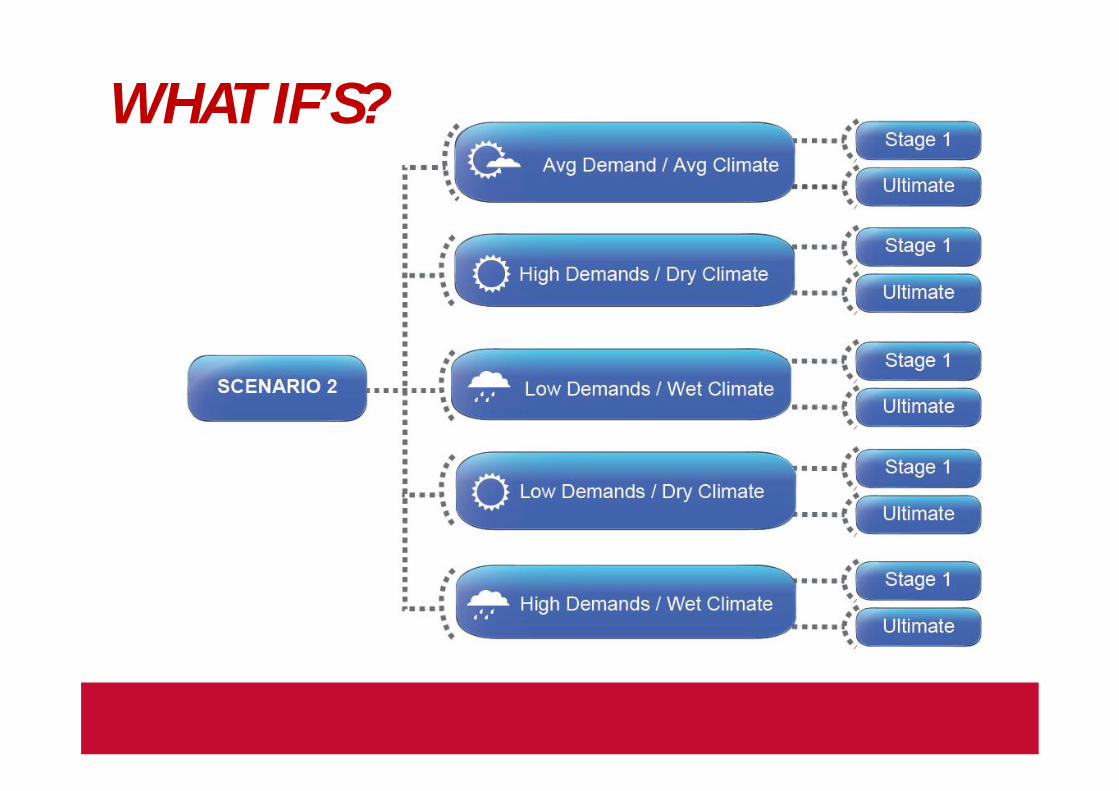
WHAT IF’S?
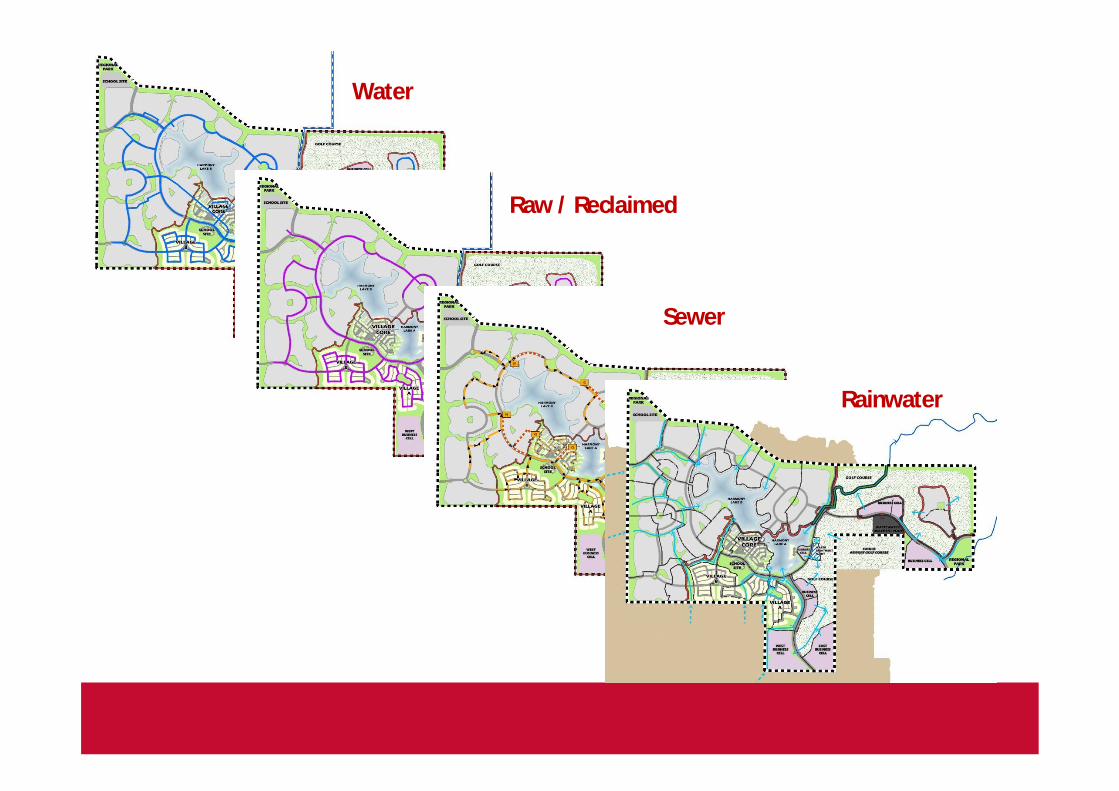
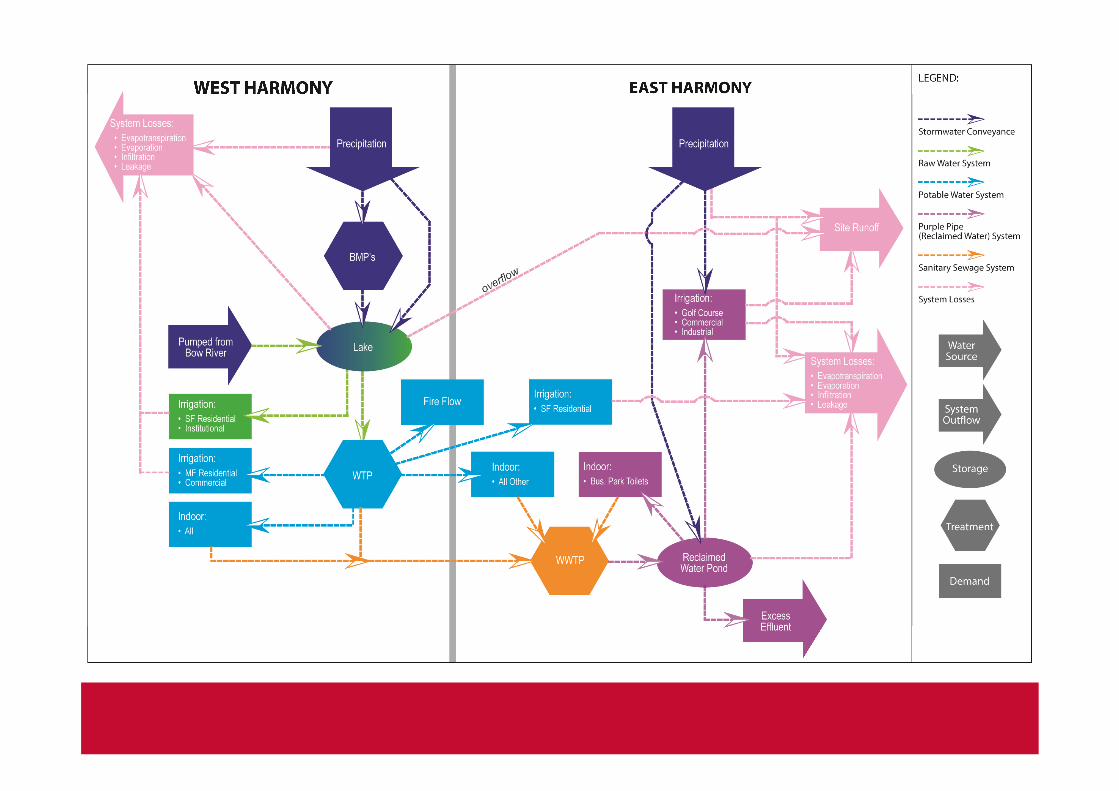
Water
Raw / Reclaimed
Sewer
Rainwater
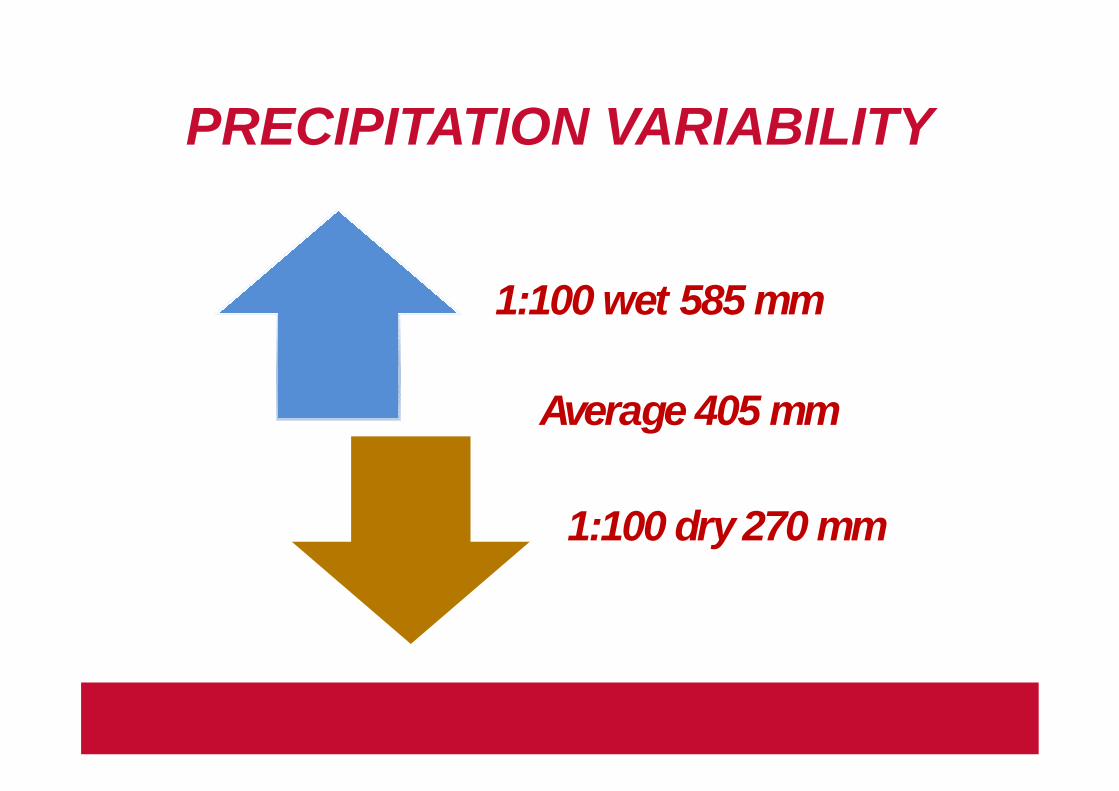
PRECIPITATION VARIABILITY
1:100 wet 585 mm
1:100 dry 270 mm
Average 405 mm
17
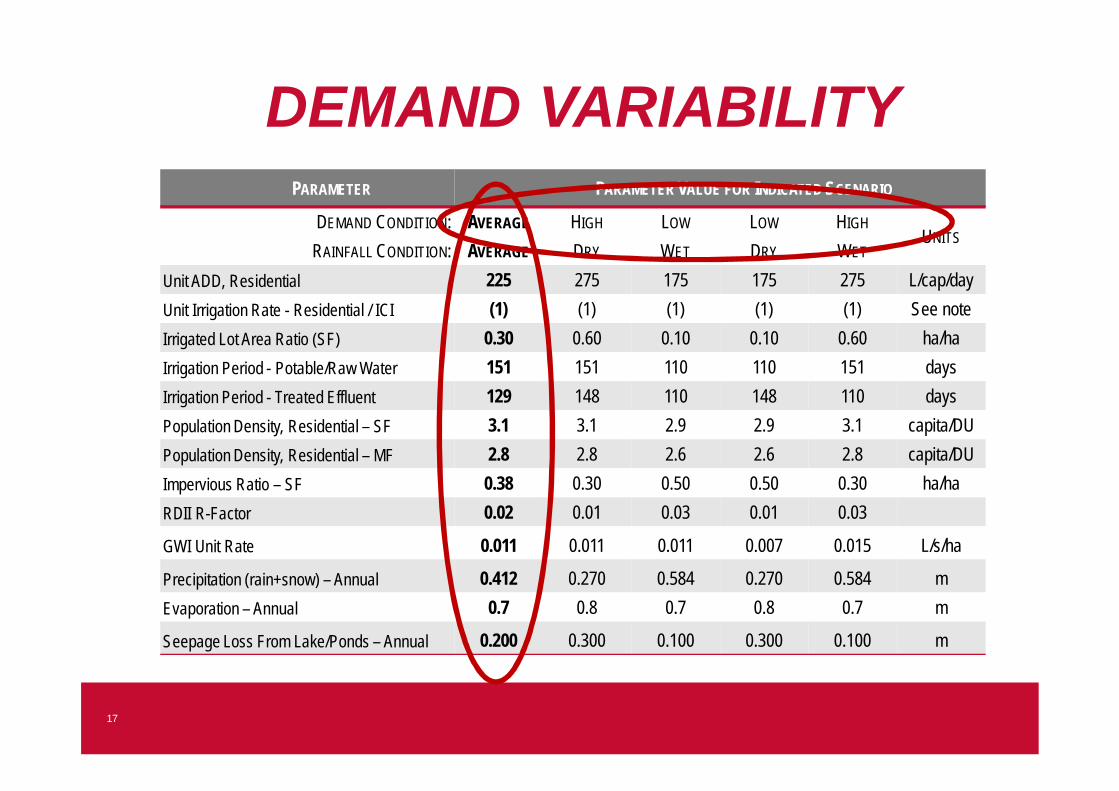
PARAMETER PARAMETER VALUE FOR INDICATED SCENARIO
DEMAND CONDITION: AVERAGE HIGH LOW LOW HIGHUNITS
RAINFALL CONDITION: AVERAGE DRY WET DRY WET
Unit ADD, Residential 225 275 175 175 275 L/cap/dayUnit Irrigation Rate - Residential / ICI (1) (1) (1) (1) (1) See noteIrrigated Lot Area Ratio (SF) 0.30 0.60 0.10 0.10 0.60 ha/haIrrigation Period - Potable/Raw Water 151 151 110 110 151 daysIrrigation Period - Treated Effluent 129 148 110 148 110 daysPopulation Density, Residential – SF 3.1 3.1 2.9 2.9 3.1 capita/DUPopulation Density, Residential – MF 2.8 2.8 2.6 2.6 2.8 capita/DUImpervious Ratio – SF 0.38 0.30 0.50 0.50 0.30 ha/haRDII R-Factor 0.02 0.01 0.03 0.01 0.03
GWI Unit Rate 0.011 0.011 0.011 0.007 0.015 L/s/ha
Precipitation (rain+snow) – Annual 0.412 0.270 0.584 0.270 0.584 mEvaporation – Annual 0.7 0.8 0.7 0.8 0.7 m
Seepage Loss From Lake/Ponds – Annual 0.200 0.300 0.100 0.300 0.100 m
DEMAND VARIABILITY
18
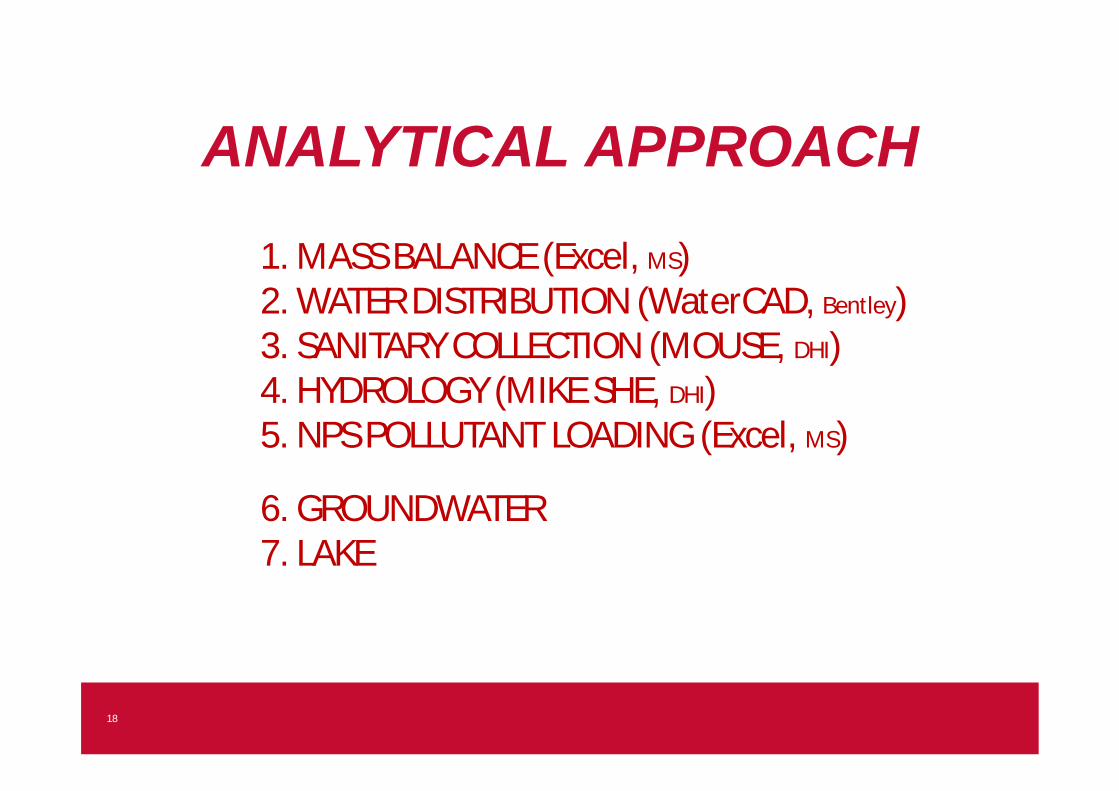
ANALYTICAL APPROACH
1. MASS BALANCE (Excel, MS)2. WATER DISTRIBUTION (WaterCAD, Bentley)3. SANITARY COLLECTION (MOUSE, DHI)4. HYDROLOGY (MIKE SHE, DHI)5. NPS POLLUTANT LOADING (Excel, MS)
6. GROUNDWATER7. LAKE
19
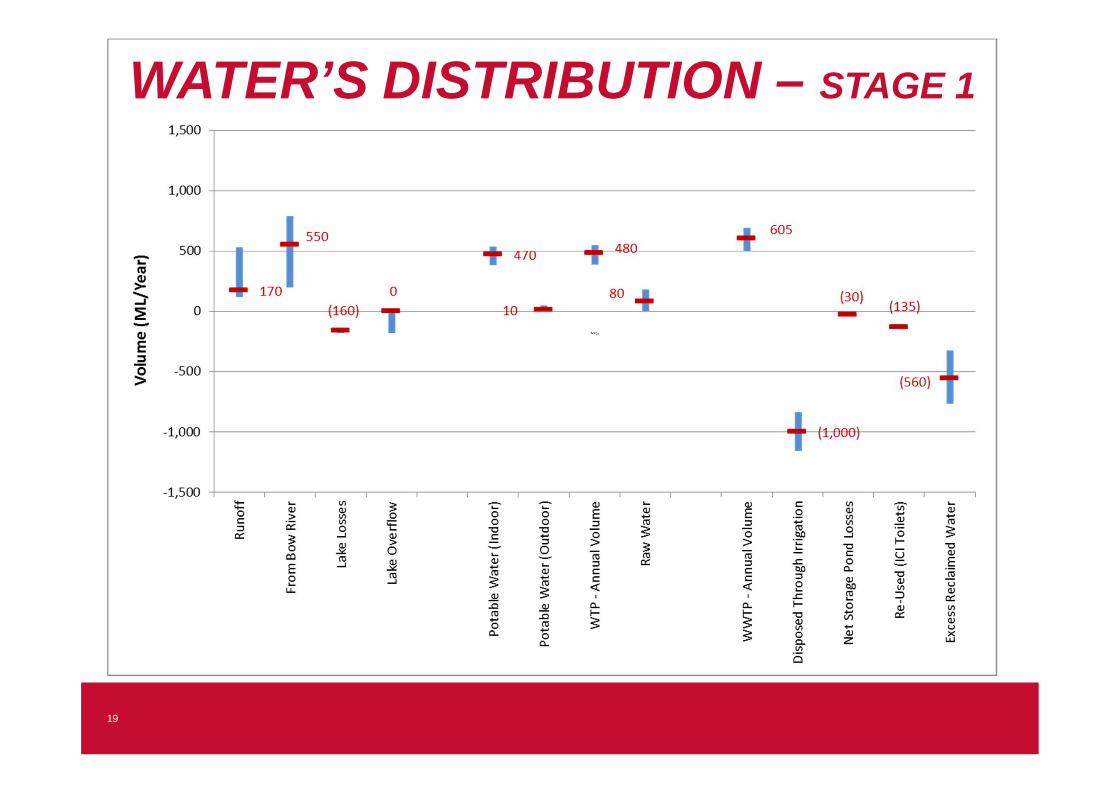
WATER’S DISTRIBUTION – STAGE 1
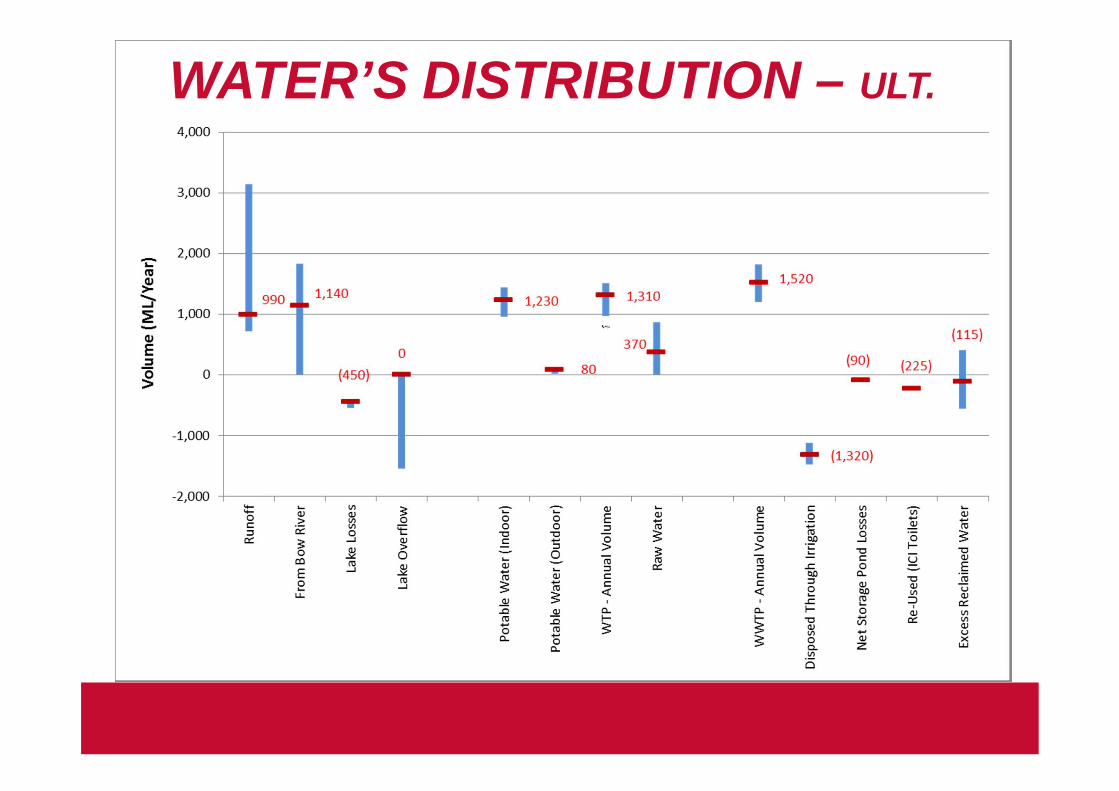
WATER’S DISTRIBUTION – ULT.
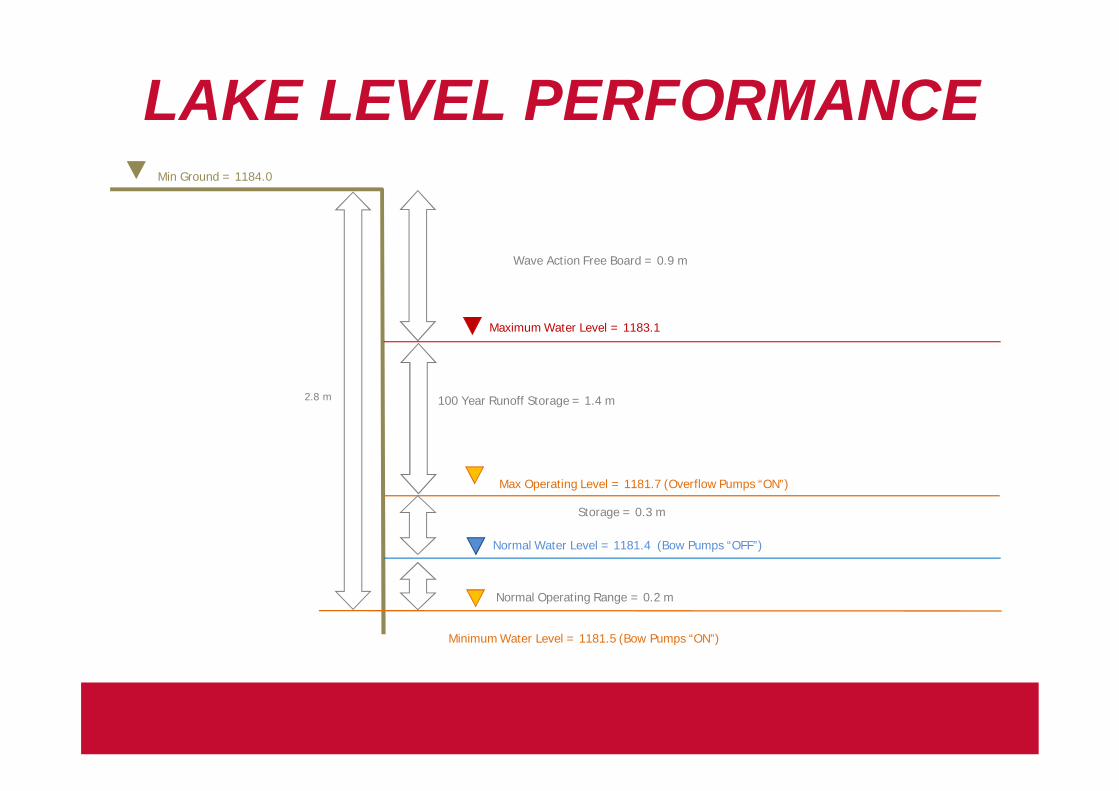
Max Operating Level = 1181.7 (Overflow Pumps “ON”)
Minimum Water Level = 1181.5 (Bow Pumps “ON”)
Normal Water Level = 1181.4 (Bow Pumps “OFF”)
Maximum Water Level = 1183.1
Wave Action Free Board = 0.9 m
Min Ground = 1184.0
100 Year Runoff Storage = 1.4 m2.8 m
Normal Operating Range = 0.2 m
Storage = 0.3 m
LAKE LEVEL PERFORMANCE
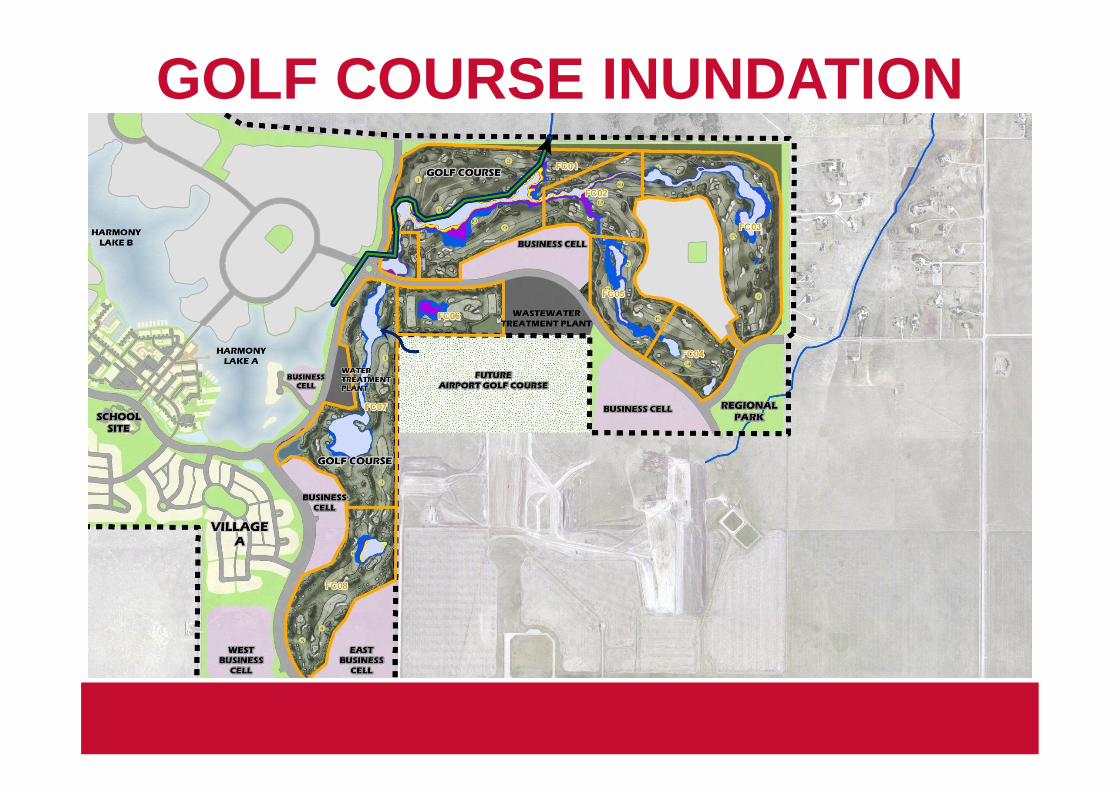
GOLF COURSE INUNDATION
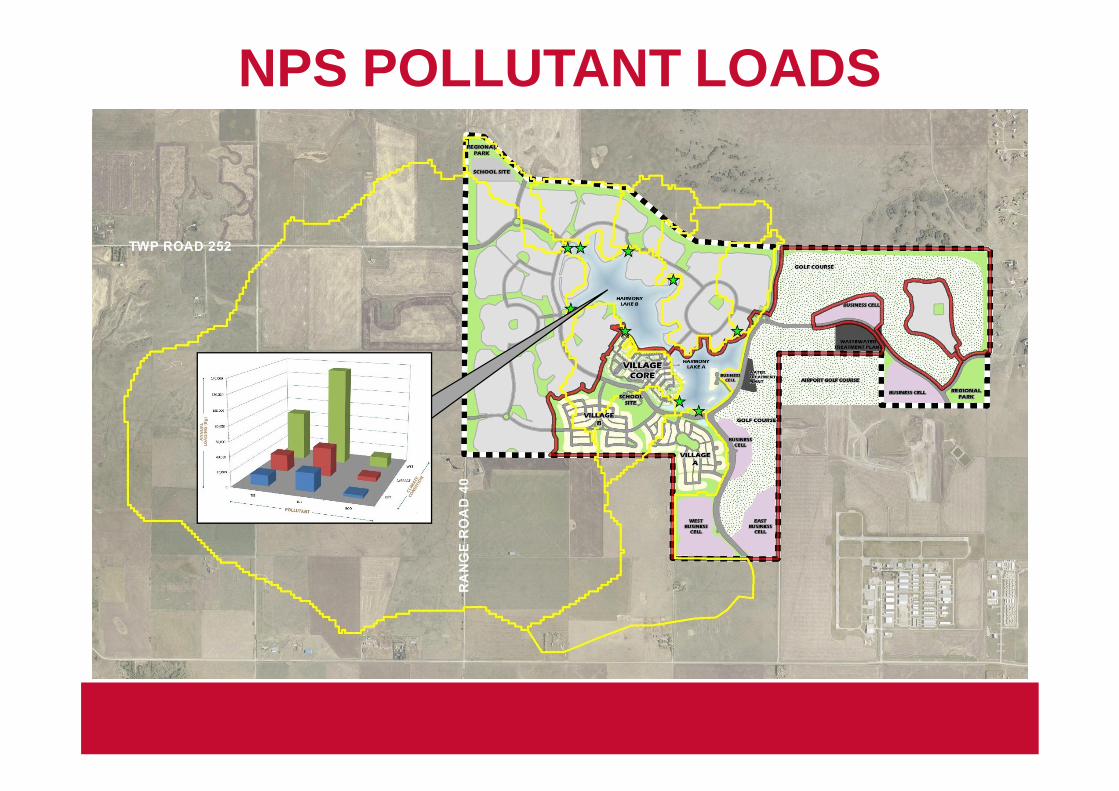
NPS POLLUTANT LOADS
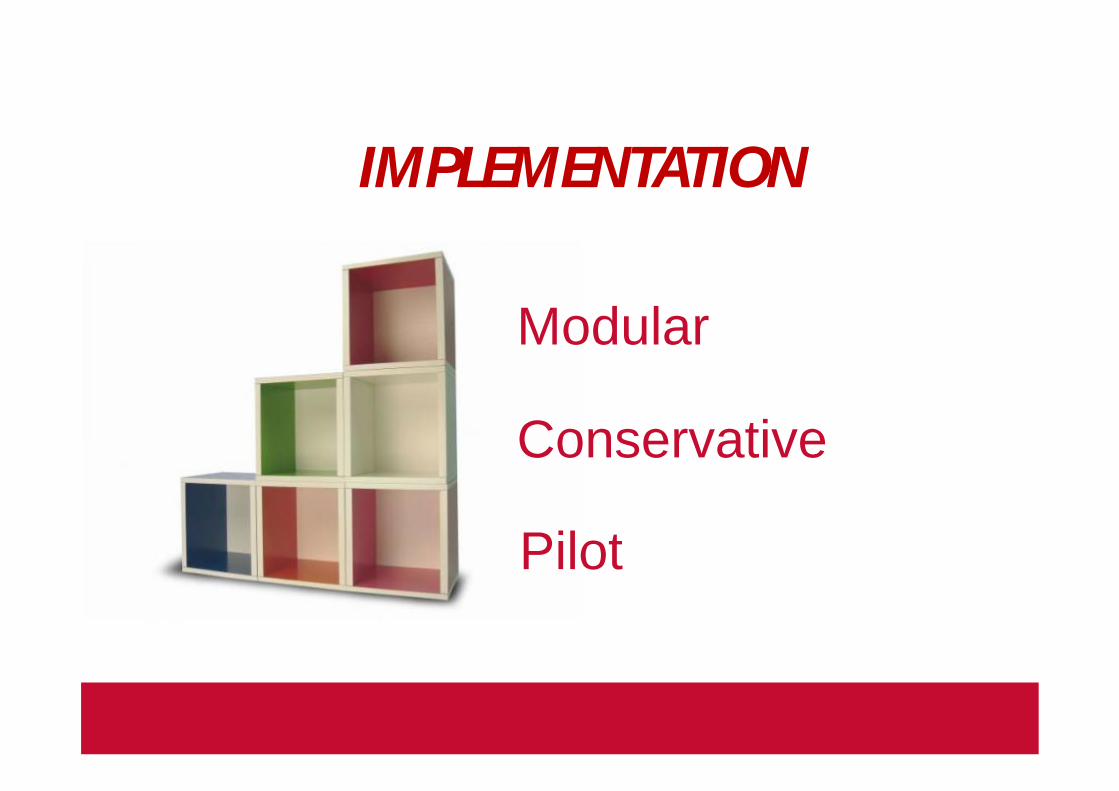
Modular
Conservative
Pilot
IMPLEMENTATION
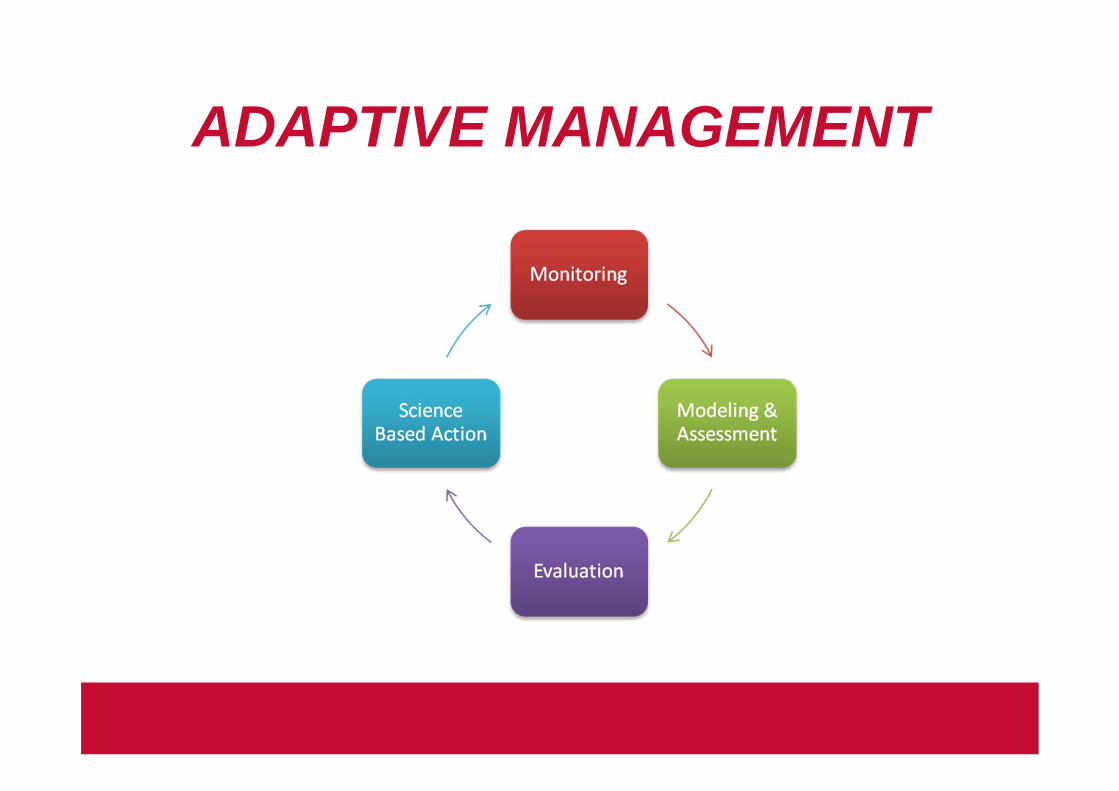
ADAPTIVE MANAGEMENT
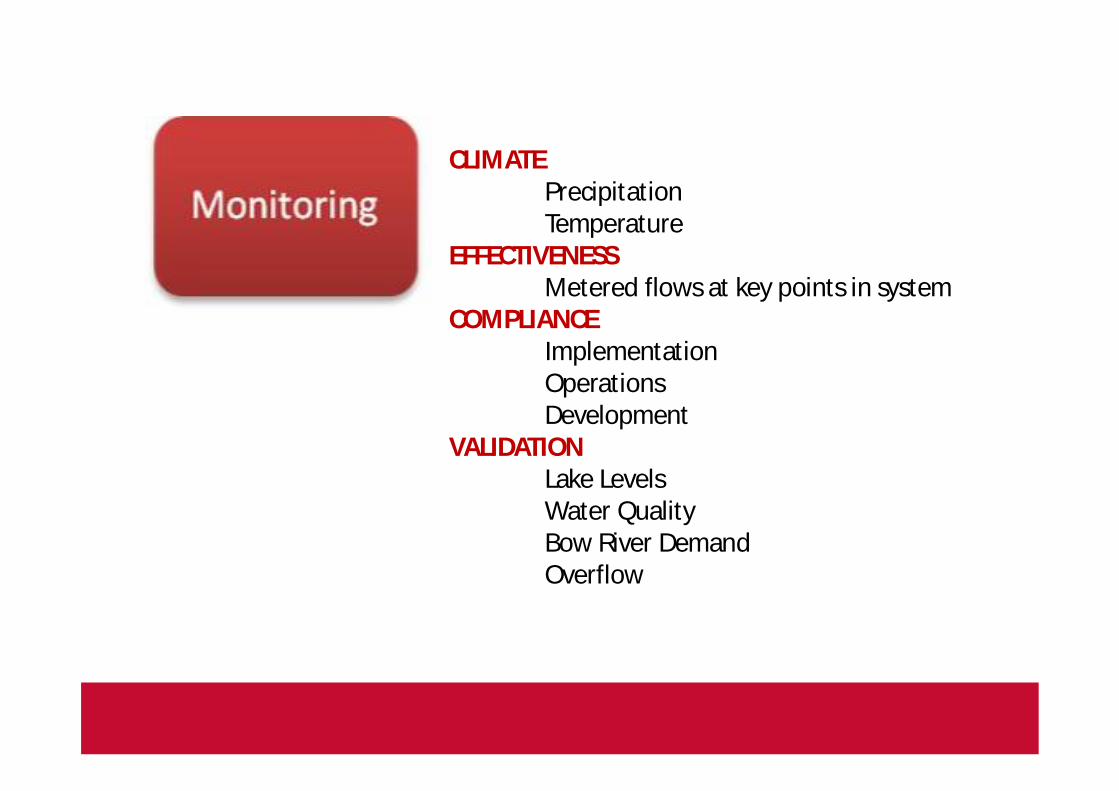
CLIMATEPrecipitationTemperature
EFFECTIVENESSMetered flows at key points in system
COMPLIANCEImplementationOperationsDevelopment
VALIDATIONLake LevelsWater QualityBow River DemandOverflow
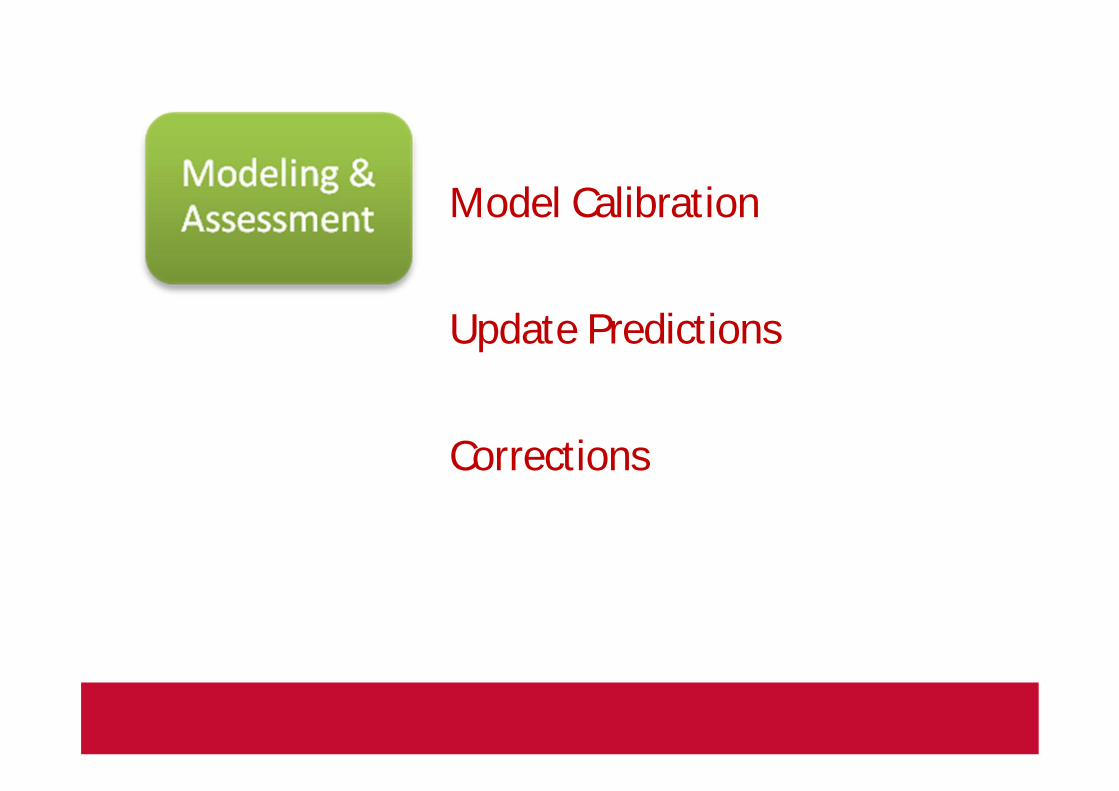
Model Calibration
Update Predictions
Corrections
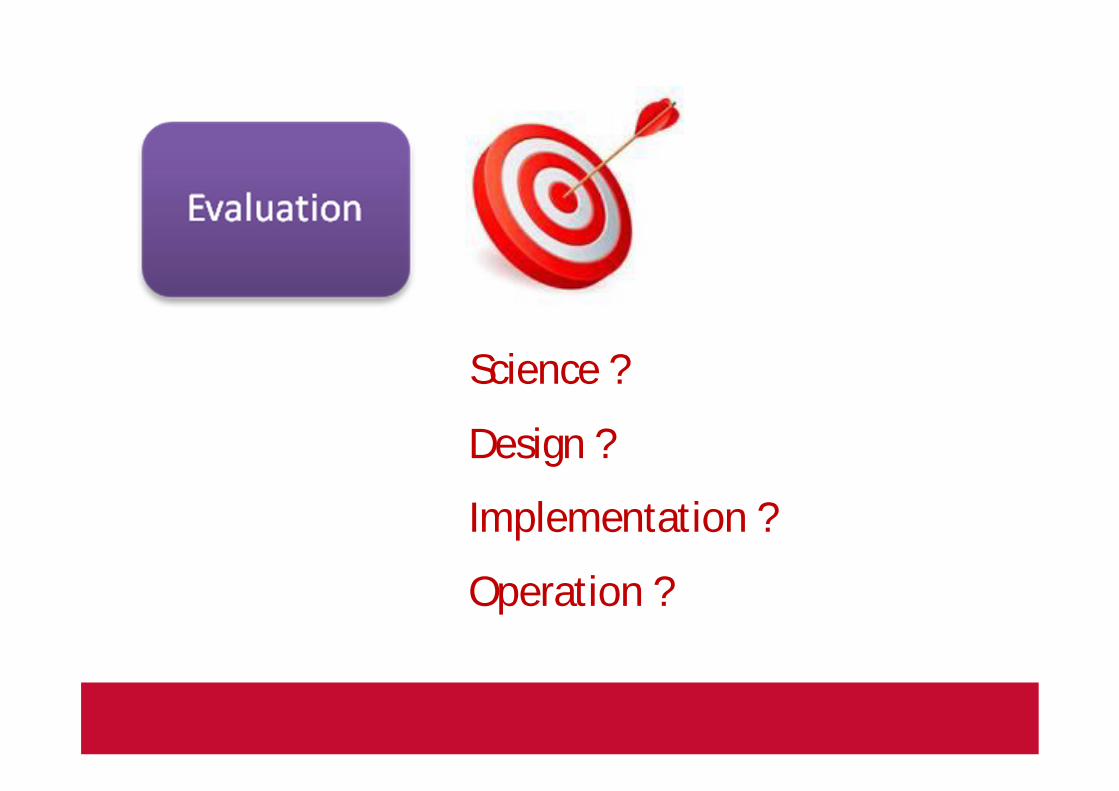
Science ?
Design ?
Implementation ?
Operation ?
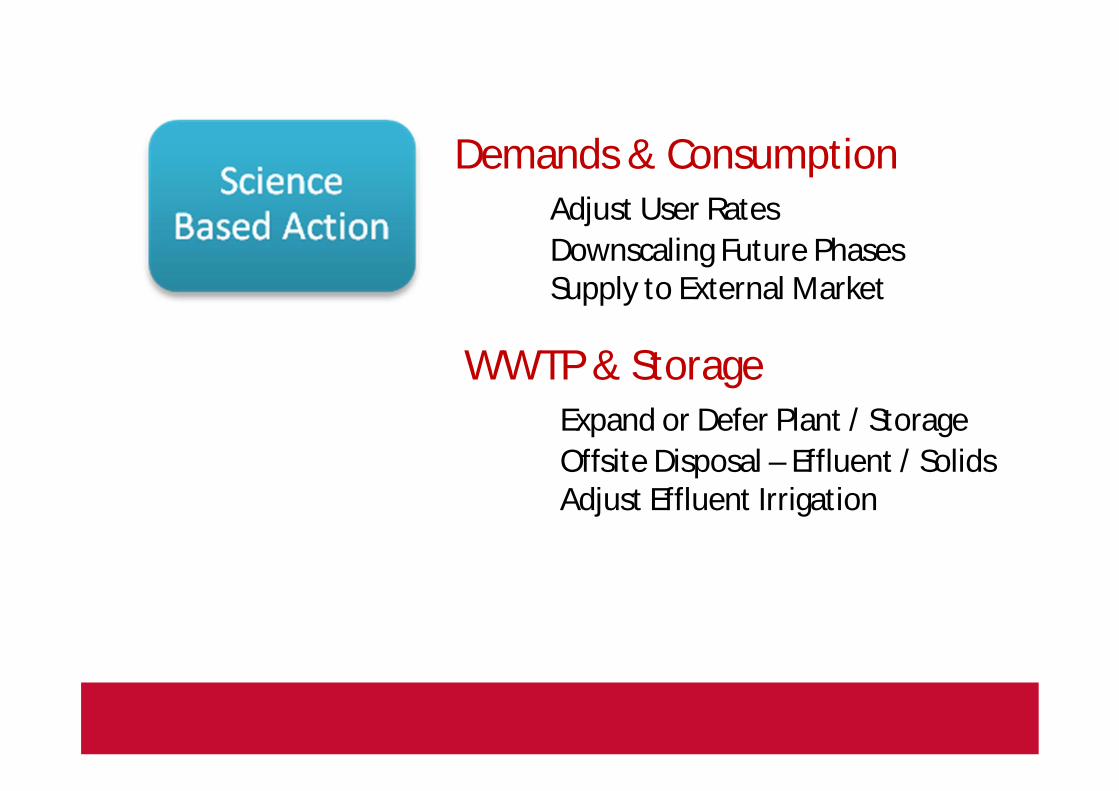
Demands & ConsumptionAdjust User RatesDownscaling Future PhasesSupply to External Market
WWTP & StorageExpand or Defer Plant / StorageOffsite Disposal – Effluent / SolidsAdjust Effluent Irrigation

WTPAdjust User RatesExpand or Defer Plant / StorageEmergency Lake Bypass
Lake & PondsAdjust Operational ProtocolsIncrease Pre-treatmentModified Discharge
CLOSING TAKEAWAYS
• Define Goals and Objectives• Identify Opportunities and Constraints• System Configuration and Interactions• Scenario’s and What If’s?• Analytical Approach and Tools• Variability, Risks, and Uncertainties• Implementation Strategy• Adaptive Management and Action Plan

Thank You