Embed Size (px)
DESCRIPTION
Citation preview

Census and Spatial Data in SQL Server 2008:
Designing Tools for Hazard
Mitigation and Analysis
� Scott Rae and David Raybuck
� North Central Texas Council of Governments

� 12,800 square miles
� 16 counties
� 225 cities
� 134 school districts
� 29 special districts
NCTCOG Region
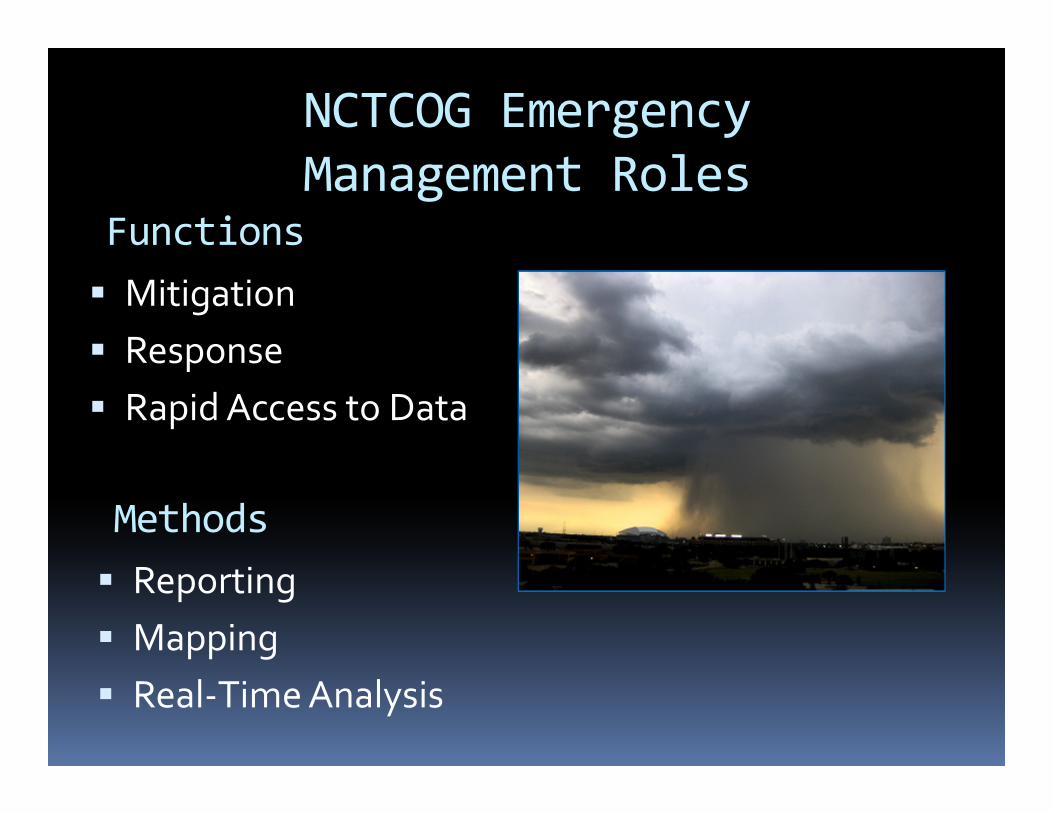
NCTCOG Emergency
Management Roles
� Mitigation
� Response
� Rapid Access to Data
� Reporting
� Mapping
� Real-Time Analysis
Functions
Methods

Data Issues
� Quality
� Reliability
� Efficiency to Build New Data Sets
� Efficiency to Maintain New Data Sets
� Dynamic Interaction
� Automation of Data Flow
� Speed

Data Needs
� Storm Events
� Flood Plains
� Earthquakes
� Drought
� Structure Values by Category
� Live Radar Data
� Live Storm Events
� Census

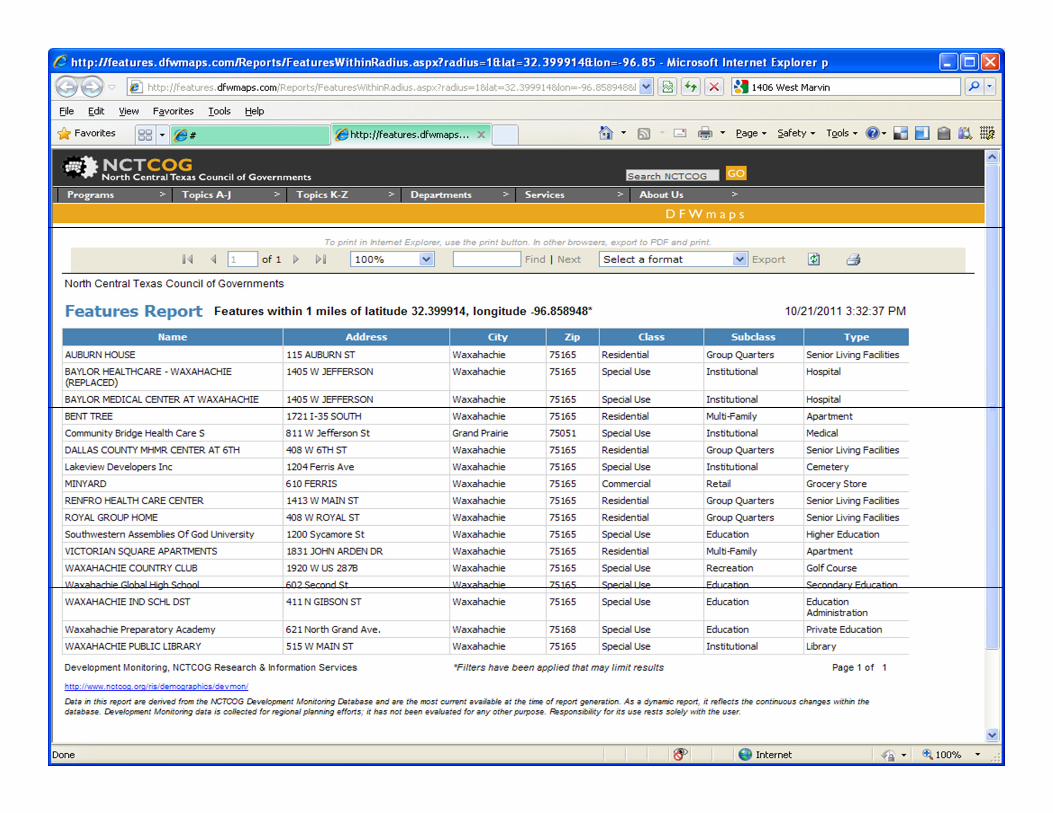
Radius Summaries (emeritus)
Circa 2001-2010
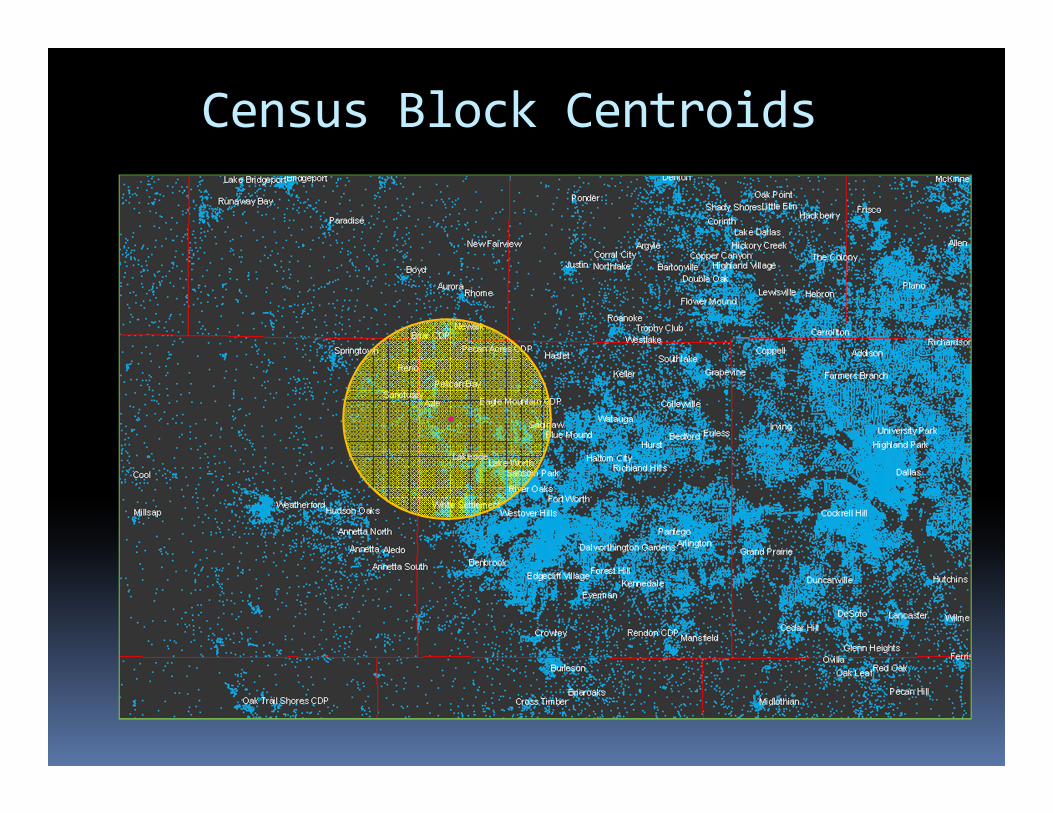
Census Block Centroids

Census Block Centroids

Radius Summary Antiques
� GIS Recordset (Loop Sum)
� GIS Constructed Query (Loop Query Build)
� SQL Algebra

Selecting by Circle using TSQL
� power((power(( @ptdx - [xcoord]),2) +
power((@ptdy -[ycoord]),2)),0.5) <
@bufferstring
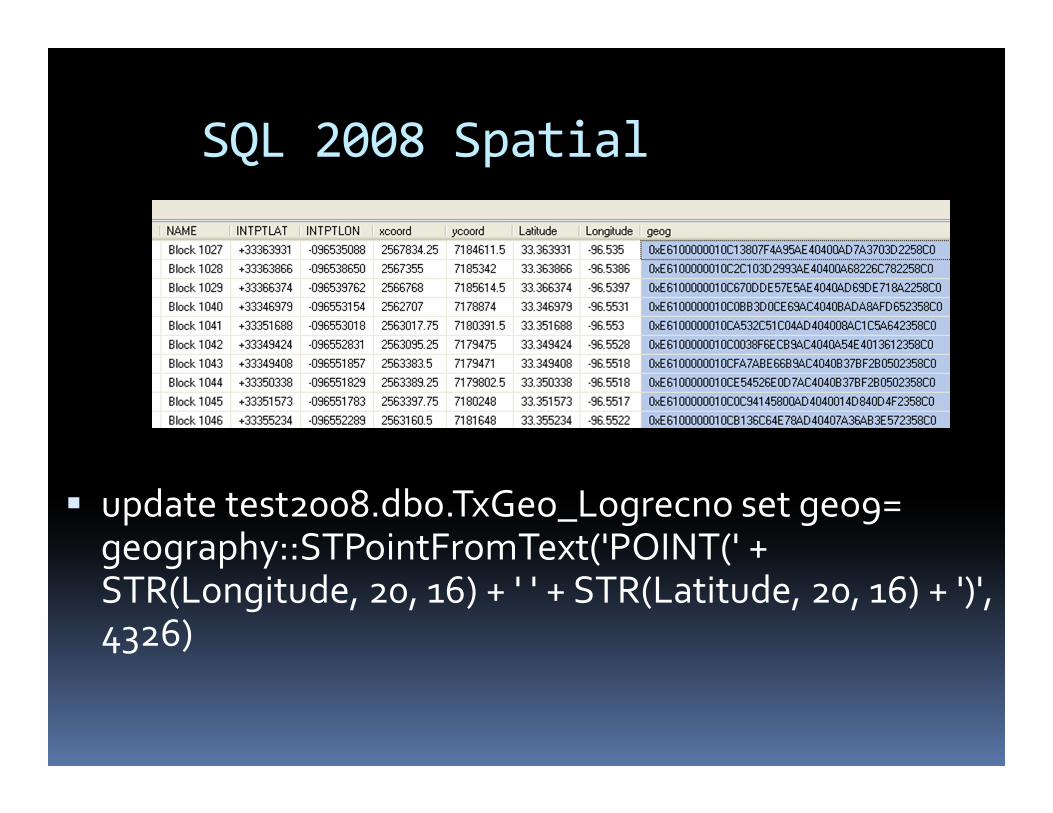
SQL 2008 Spatial
� update test2008.dbo.TxGeo_Logrecno set geo9= geography::STPointFromText('POINT(' + STR(Longitude, 20, 16) + ' ' + STR(Latitude, 20, 16) + ')', 4326)

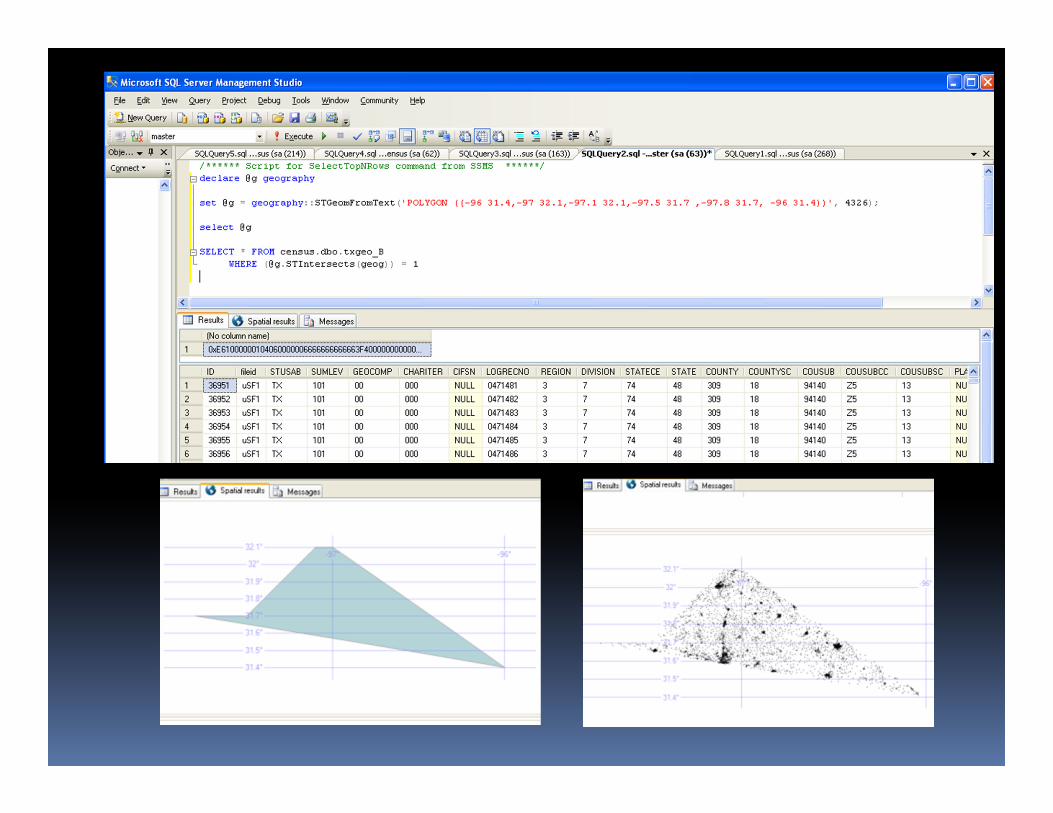
SQL 2008 Spatial
Selecting by Polygon
� set @g =
geography::STGeomFromText('POLYGON ((-
96 31.4,-97 32.1,-97.1 32.1,-97.5 31.7 ,-97.8
31.7, -96 31.4))', 4326);
� SELECT * FROM dbo.txgeo_B
WHERE (@g.STIntersects(geog)) = 1

Rapid On-the-Fly Reporting
Queries by Geometry
Queries by Attribute
SQL ServerWeb Users
SQL Reporting Services
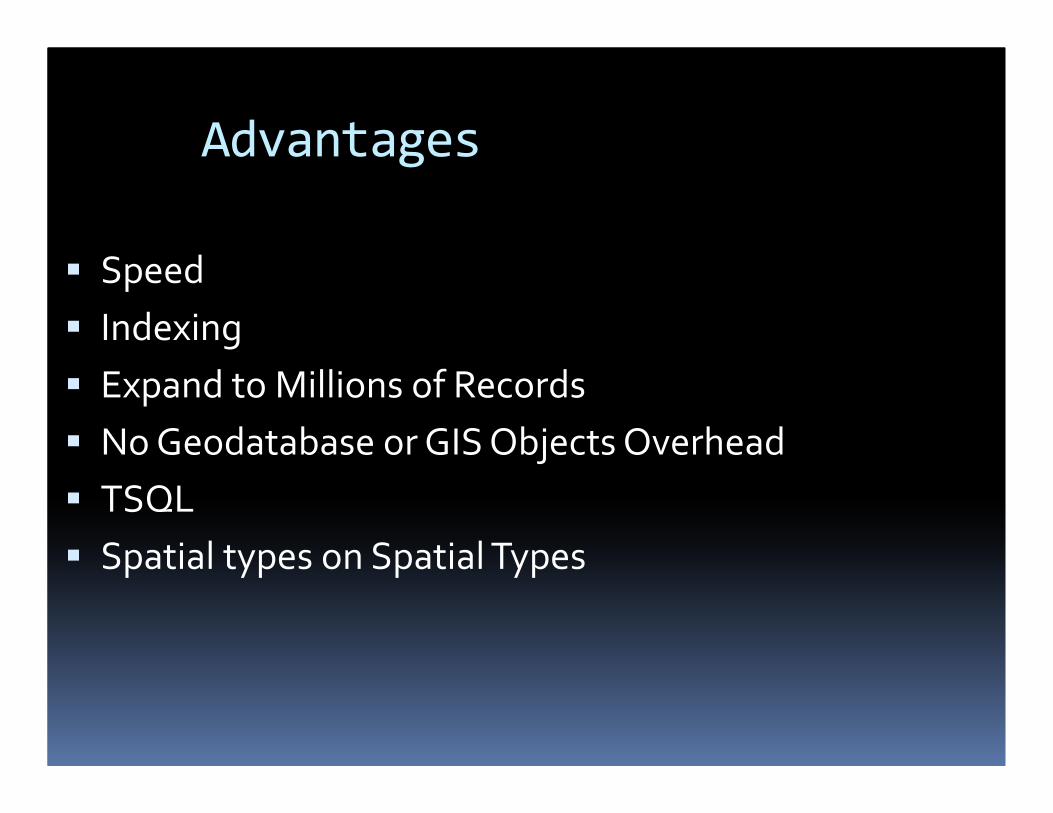
Advantages
� Speed
� Indexing
� Expand to Millions of Records
� No Geodatabase or GIS Objects Overhead
� TSQL
� Spatial types on Spatial Types
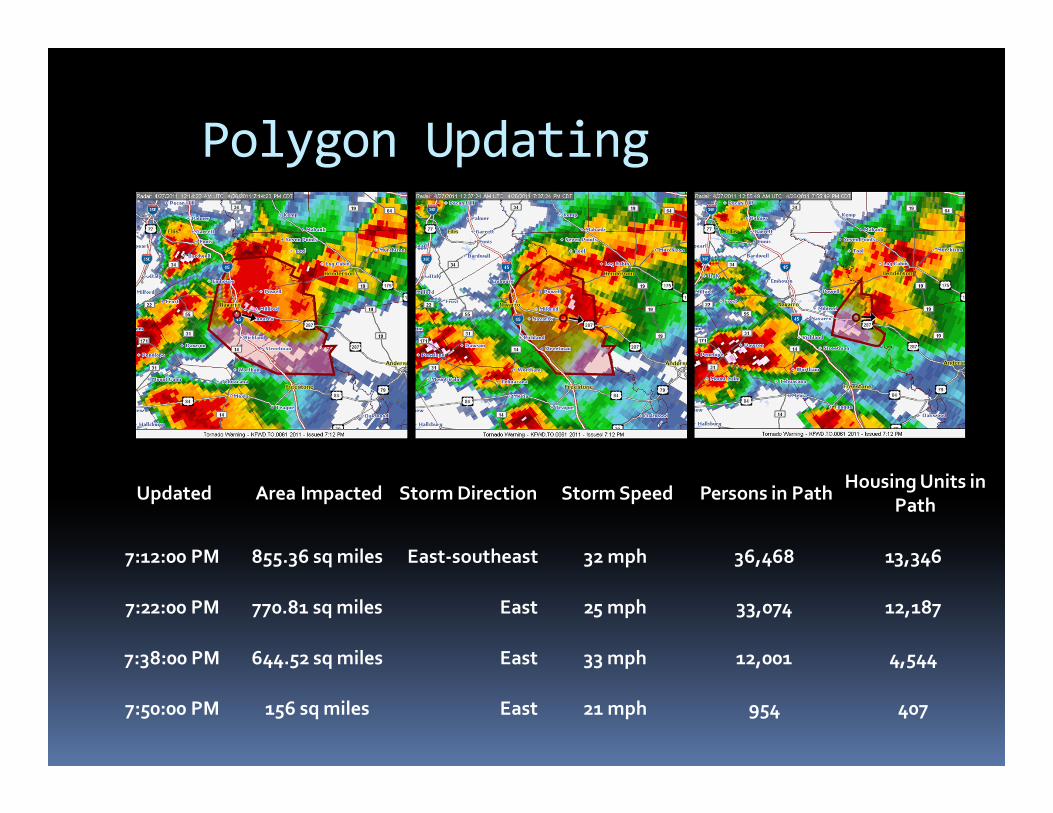
Polygon Updating
Updated Area Impacted Storm Direction Storm Speed Persons in PathHousing Units in
Path
7:12:00 PM 855.36 sq miles East-southeast 32 mph 36,468 13,346
7:22:00 PM 770.81 sq miles East 25 mph 33,074 12,187
7:38:00 PM 644.52 sq miles East 33 mph 12,001 4,544
7:50:00 PM 156 sq miles East 21 mph 954 407

Managing Data Flows into SQL 2008
SQL 2008
XML/HTTP
.NET/TSQL
FME Workbench
Partner Servers
Programmers
.NET/TSQL
Web Editors
.NET/TSQL
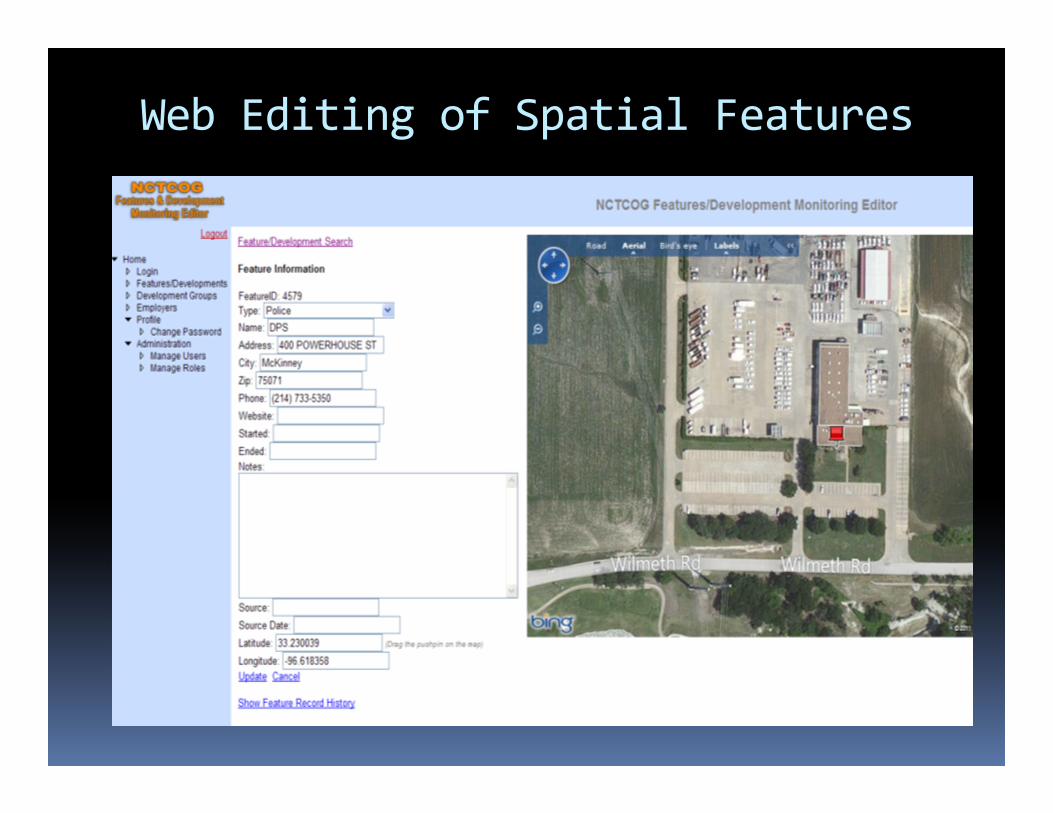
Web Editing of Spatial Features


The Logic
Inferring numeric polygon values from
another polygon layer
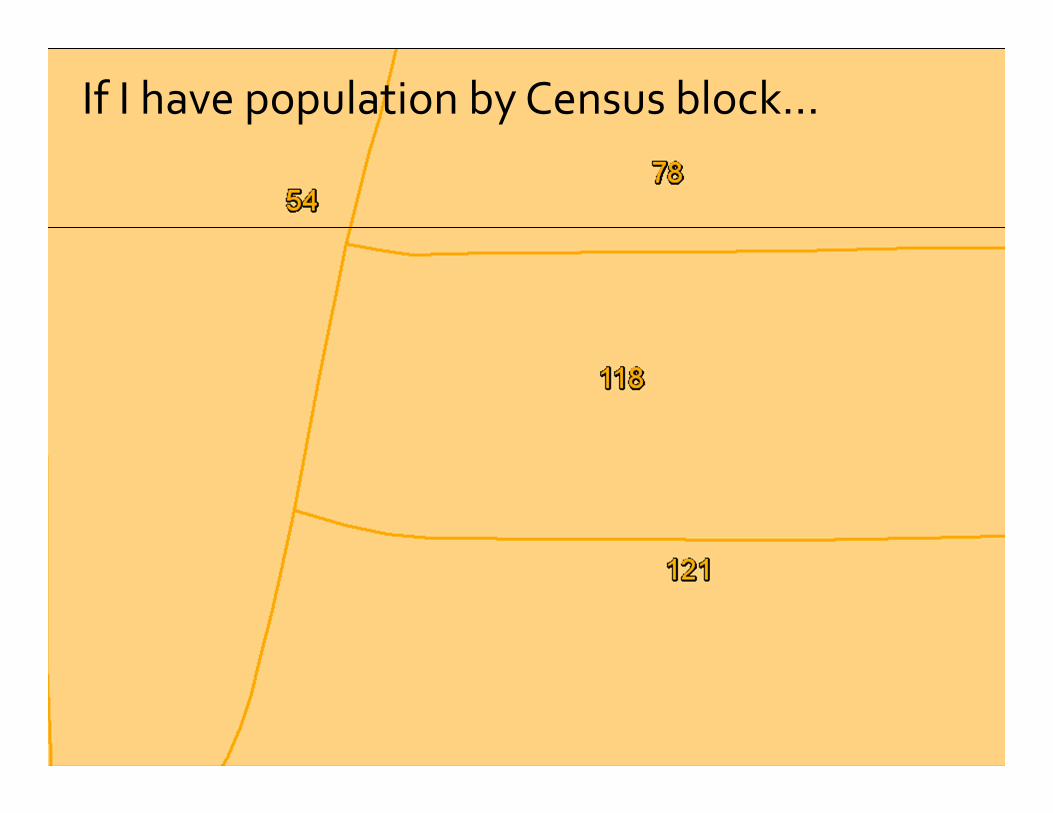
If I have population by Census block…
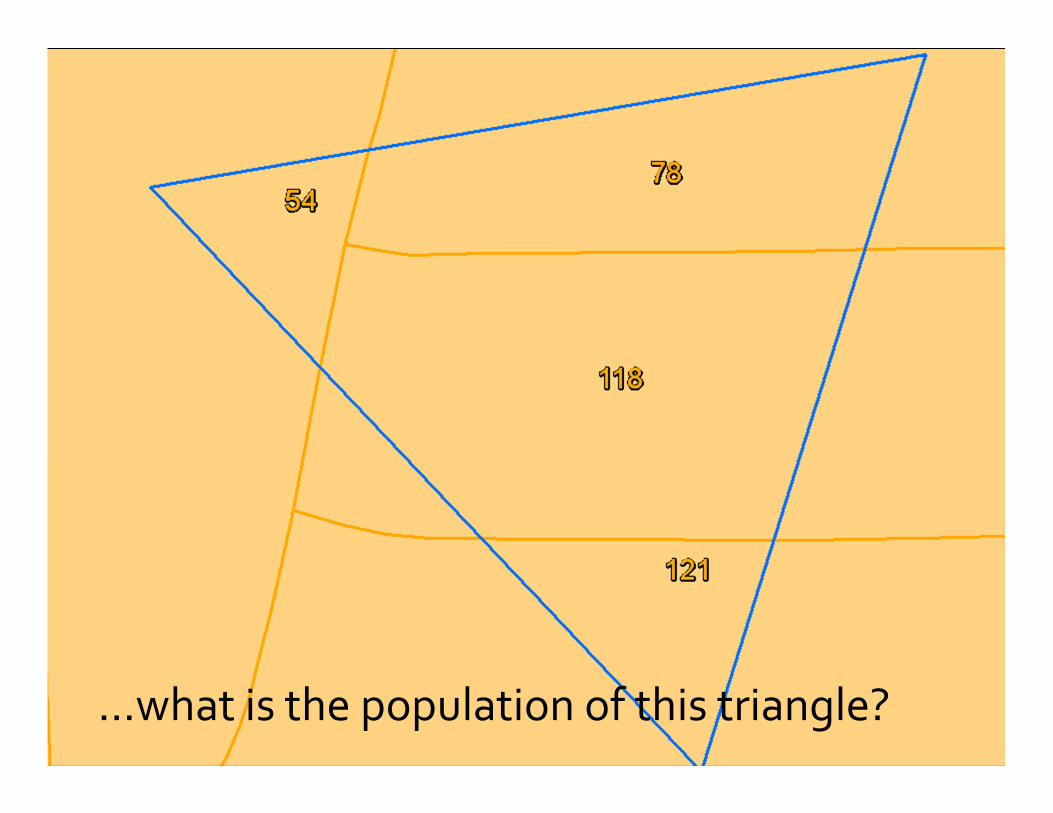
…what is the population of this triangle?
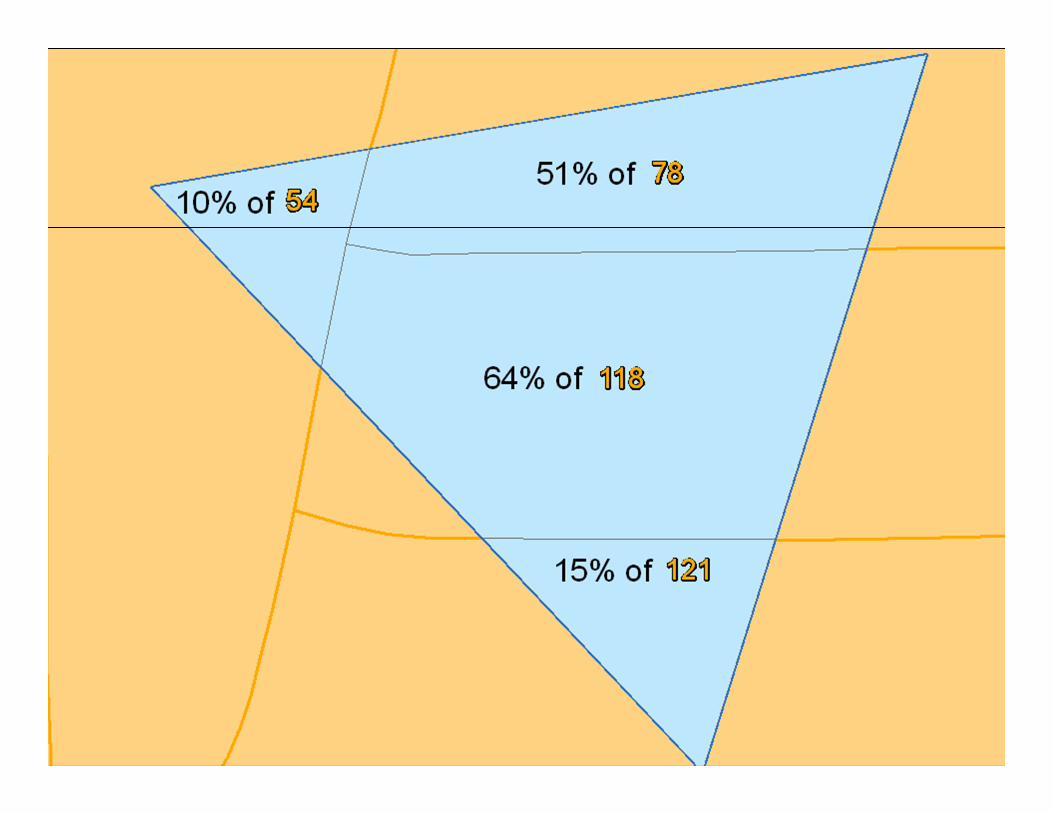
The ArcGIS Way
1. Calculate original area into source field
2. ArcToolbox�Intersect source with target
3. Calculate new area into result field
4. Calculate overlap % (result area / original area)
5. Multiply this % by value(s) to infer
6. Summary Statistics�Sum (group by Unique ID of target)

The SQL Server 2008 Way
SELECT Target.UniqueID, SUM(PercentOfTarget
* SourceValue) FROM
(
SELECT Source.UniqueID, Target.UniqueID,
Source.SourceValue,
Source.geom.STIntersection(Target.geom).ST
Area() / Target.geom.STArea() AS
PercentOfTarget FROM Target INNER JOIN
Source on
Source.geom.STIntersects(Target.geom) = 1
)
GROUP BY Target.UniqueID

The Grid
Optimizing for the web

Bing Maps Tile Quadkeys
� Length of the key in digits indicates the level of detail (aka zoom level)
� Each quadkey starts with the quadkey of the parent grid (the next largest square containing it)