Embed Size (px)
Citation preview

Copyright © 2015 Rockwell Automation, Inc. All Rights Reserved. Rockwell Automation TechED 2015 @ROKTechED #ROKTechED
PUBLIC INFORMATION
PR23 Control Station PID Control Loops and Process Optimization

Copyright © 2015 Rockwell Automation, Inc. All Rights Reserved. Rockwell Automation TechED 2015 @ROKTechED #ROKTechED
AGENDA
PR23 - Control Station: PID Control Loops and Process Optimization:
Capitalize on What Your Plant is Telling You
Identify controller tuning, mechanical and process architecture issues
using your plant’s existing process data.
Use advanced forensics to isolate root-causes.
Industrial case studies highlight enhancements to production
throughput and efficiency.

Copyright © 2015 Rockwell Automation, Inc. All Rights Reserved. Rockwell Automation TechED 2015 @ROKTechED #ROKTechED
Economic Drivers
Process Automation: A State-of-the-State Assessment
The Amazing Problem-Free Plant
Michael Brown Control Engineering
20% of control systems are not properly configured to meet their objectives
30% of PID control loops are operated in manual mode
65% of controllers are poorly tuned to mask control-related problems
85% of controllers perform inefficiently when operated in automatic mode

Copyright © 2015 Rockwell Automation, Inc. All Rights Reserved. Rockwell Automation TechED 2015 @ROKTechED #ROKTechED
Economic Drivers
Top Line and Bottom Line Benefits
Production
Throughput
Production
Yield
Energy
Consumption
Production
Defects
2 – 5%
5 – 15% 25 – 50%
5 – 10%
Invest in Control – Payback in Profits
Carbon Trust

Copyright © 2015 Rockwell Automation, Inc. All Rights Reserved. Rockwell Automation TechED 2015 @ROKTechED #ROKTechED
Does Tuning Really Save Money?
Previously Unmonitored Temperature Loop
No Complaints from Production!
Controls Cooling Liquid to Part Quench Bath
Just the numbers
Before tuning,
Average temperature was 54°C,
Average controller output was 8.64%
After tuning,
Average temperature is 55°C (at set-point)
Average Controller output is now 7.53%
1% Less Cooling, with more opportunity through Set-Point Adjustments
~1% Less Cooling for Every 1 Degree Increase in Set-Point

Copyright © 2015 Rockwell Automation, Inc. All Rights Reserved. Rockwell Automation TechED 2015 @ROKTechED #ROKTechED
What Your Plant is Telling You
Overall Loop Health
Stiction
Average Absolute Error
PV Noise
Tuning Recommendations
Oscillation Likelihood
Distribution
Controller Mode
Metrics Focus on
General Loop Performance
Controller Tuning Issues
Valve/Mechanical Issues
Interaction Analysis

Copyright © 2015 Rockwell Automation, Inc. All Rights Reserved. Rockwell Automation TechED 2015 @ROKTechED #ROKTechED
Simple Performance Metrics
Overall Health
The overall health
provides a single
performance factor to identify
controller performance
issues.
Noise Band
This is an estimation of the amount of high frequency noise present in the process
variable. Increases in noise could
indicate potential
sensor failure.
PV & SP Distribution
This metric can be used to
understand how well
sensors or processes are
sized.
PV & SP Travel
The process variable travel can indicate if your process
is operating at steady-state or is consistently moving around
PV & SP Average
The Average Variable is a measure of the typical
value of the process
variable and set-point signal.
PV & SP Variance
The Variable Variance is a measure of
the spread of the Variable
value. A tighter
variance is desirable as it shows a well
controlled process.

Copyright © 2015 Rockwell Automation, Inc. All Rights Reserved. Rockwell Automation TechED 2015 @ROKTechED #ROKTechED
Controller Performance Metrics
Tuning Deviation
Track changes in process data and
calculate PID Tuning Values. How far are the
tuning parameters from optimal
Oscillation
This is the likelihood that the process variable is oscillating. It is the amount of the
power of the dominant
frequency divided by the total power from the spectral
analysis.
AAE
The AAE measures the
difference between the Set
Point and the measured
Process Variable. This metric is
used to track how well the controller is able to maintain
its set-point.
Mode Changes
This metric tracks the number of
changes (i.e. auto vs manual) in
order to highlight potential
problems.
Percent Time In Normal
This metric tracks the percentage of time the controller
spends in each available
controller mode (i.e. auto vs
manual) in order to highlight potential
problems.

Copyright © 2015 Rockwell Automation, Inc. All Rights Reserved. Rockwell Automation TechED 2015 @ROKTechED #ROKTechED
Everyday Output Changes
Output Changes a Source of Suitable Data For Analysis
Including SP Changes, Manual Bump Tests
No configuration required for setting noise limits, minimum step size or window length
Model Fits are Generated using Non Steady State (NSS) Modeling Innovation
Tuning Parameters Generated for each loop based on the criteria specified by the user
Slider Bar (Fast/Slow) or Specific Closed Loop Response Time
Metrics based on Deviation from Recommended Tunings

Copyright © 2015 Rockwell Automation, Inc. All Rights Reserved. Rockwell Automation TechED 2015 @ROKTechED #ROKTechED
Everyday Output Changes
Users can quickly review all recent
model fits and alter the automatic
model fit starring
Review Model Fits

Copyright © 2015 Rockwell Automation, Inc. All Rights Reserved. Rockwell Automation TechED 2015 @ROKTechED #ROKTechED
Everyday Output Changes
When a single loop is selected, the model parameters for all of the fits are
displayed in as a histogram.
The recommended tunings are based on the configuration specified for
each loop

Copyright © 2015 Rockwell Automation, Inc. All Rights Reserved. Rockwell Automation TechED 2015 @ROKTechED #ROKTechED
Everyday Output Changes
Quickly Identify When Tunings
Need to be Adjusted
Existing Tunings are compared to
recommended tunings
Distribution of tunings based on
available model fits
Alerts based on number of
standard deviations outside of
recommended range.

Copyright © 2015 Rockwell Automation, Inc. All Rights Reserved. Rockwell Automation TechED 2015 @ROKTechED #ROKTechED
Everyday Output Changes
Analyze and Tune Rockwell PID
Controllers
Import Data from Historian or
Connect to FactoryTalk Gateway
or RSLinx for High Speed Data
Bro
wse
Col
lect
M
odel
Tun
e R
epor
t

Copyright © 2015 Rockwell Automation, Inc. All Rights Reserved. Rockwell Automation TechED 2015 @ROKTechED #ROKTechED
Mechanical Performance Metrics
Output Distribution
The output distribution identifies
areas where the Final Control
Element is spending its
time.
Output Travel
Output Travel gives
us insight into how
much effort by the Final
Control Elements
required to maintain control.
Stiction
This metric returns the likelihood
and amount of stiction present in
control valves.
Output Reversals
A high number of
output reversals suggests
that excessive wear and
tear on the Final Control
Element.
Output Variance
Output Variance is a measure of the spread of Controller
Output values.
Output Average
Average Controller Output is a measure of the typical
value of the Controller
Output signal.

Copyright © 2015 Rockwell Automation, Inc. All Rights Reserved. Rockwell Automation TechED 2015 @ROKTechED #ROKTechED
Stiction Analysis
The mechanical elements
associated with moving a valve or
damper can wear over time. As
these linkages or other parts start
to wear down, there ability to
consistently move the valve stem
or damper degrades.

Copyright © 2015 Rockwell Automation, Inc. All Rights Reserved. Rockwell Automation TechED 2015 @ROKTechED #ROKTechED
Controller Interaction Analysis
Power Spectrum
Power Spectrum is a method of evaluating interactions
among and between control loops A Power Spectrum plot
graphically reveals loop interaction by showcasing
common or shared frequency peaks.
Cross Correlation
Correlation analysis measures the similarity of two signals as
a function of a time-shift applied to one of the signals.
This tool can find relationships between signals and identify
the time delay, or lag, between the two.
Copyright © 2015 Rockwell Automation, Inc. All Rights Reserved. Rockwell Automation TechED 2015 @ROKTechED #ROKTechED
Power Spectrum Analysis
Measures frequency and
magnitude of change in a signal
Especially good for identifying
oscillating behavior
Different signals may have
something in common if spectrum
peaks coincide
Think of it as a Disturbance
Fingerprint
5 10 15 20 25 30 35
period of oscillation (min)17
no
rma
lize
d p
ow
er
0
0.2
0.4
0.6
0.8
1.0D
PV
Power Spectrum (Spectral Density) Clearly Connects
Disturbance (D) to PV Behavior
disturbance (D) oscillates at a
frequency of 17 minutes.
Process Under PI Control
Copyright © 2015 Rockwell Automation, Inc. All Rights Reserved. Rockwell Automation TechED 2015 @ROKTechED #ROKTechED
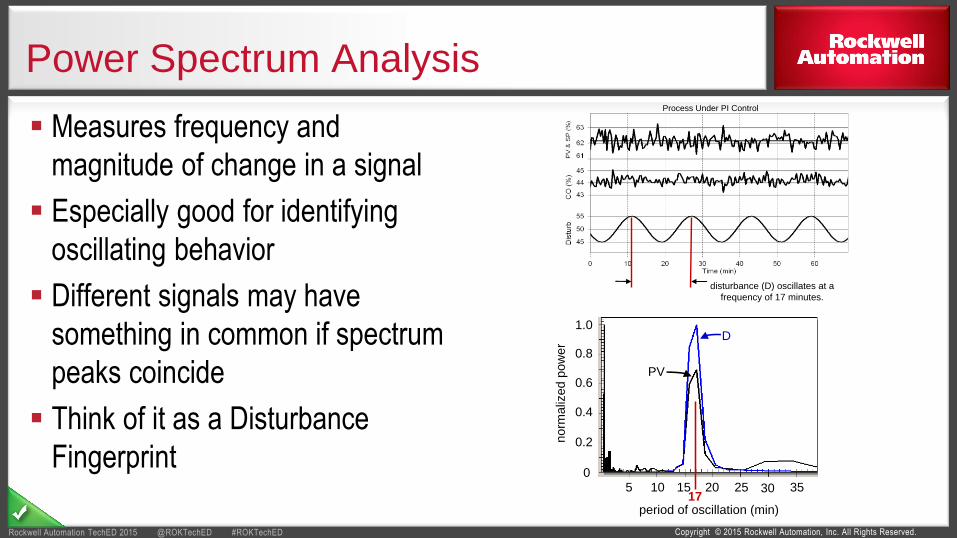
Power Spectrum Analysis
Group and Sort by any Frequency
Shaded regions represent strong power
Overlay several loops or view loop details

Copyright © 2015 Rockwell Automation, Inc. All Rights Reserved. Rockwell Automation TechED 2015 @ROKTechED #ROKTechED 19
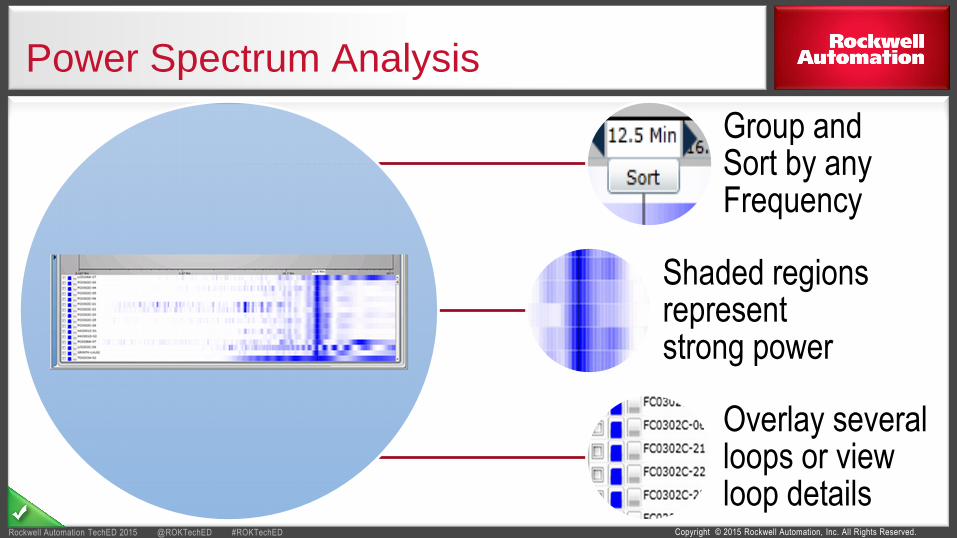
Cross Correlation Analysis
Copyright © 2015 Rockwell Automation, Inc. All Rights Reserved. Rockwell Automation TechED 2015 @ROKTechED #ROKTechED
Cross Correlation Analysis
loops are arranged in a matrix
blue is used to denote lagging loops whereas red used to denote leading loops
If users want more information on the lead-lag relationship, they can click on the box to open an expanded view. A bar will be displayed showing where the specific interaction is occurring.

Copyright © 2015 Rockwell Automation, Inc. All Rights Reserved. Rockwell Automation TechED 2015 @ROKTechED #ROKTechED
Different Metrics Used by Different Users
Corporate Engineers
Similar Loop Comparison
APC/Constraint Report
Plant Manager Reports
Loop Condition Daily Count
7-day Average Unit Health Trend
Summarized Unit Level Metrics
Control Engineer
Oscillations
Tuning Deviation
Controller Utilization (Normal)
Reliability Engineer/Manager
Valve Metrics
Valve Distribution (Sizing)
PV Noise
Process Operator
Overall Loop Health
Controller Mode

Copyright © 2015 Rockwell Automation, Inc. All Rights Reserved. Rockwell Automation TechED 2015 @ROKTechED #ROKTechED
Typical Use Cases
• Focus on comparing process performance across several locations
Corporate
• Basic Overview of how their assets are being utilized
• Which areas of their facility are operating efficiently and track improvements
Plant Manager
• Provide Troubleshooting and Root Cause Analysis
• Metrics Focusing on Controller Tuning, Controller Utilization, and Process Variability
Process/Control Engineer
• Provide Information on Valve Health (Stiction/Saturation)
• Provide information related to instrumentation noise.
Reliability Engineer/Manager
• Simple Indicators and Alerts to highlight controller performance issues
Process Operators

Copyright © 2015 Rockwell Automation, Inc. All Rights Reserved. Rockwell Automation TechED 2015 @ROKTechED #ROKTechED
Corporate
Generates reports compare metrics across similar loops
Corporate engineers use these reports to compare performance at different plants
Case Study:
Dryer Performance Across Different Lines and Locations
Similar loop comparison report used to compare
temperature controllers across identical dryers to
identify performance outliers.

Copyright © 2015 Rockwell Automation, Inc. All Rights Reserved. Rockwell Automation TechED 2015 @ROKTechED #ROKTechED
Plant Manager
Reports provide high level plant health overview to Plant Manager:
Loop Condition Daily Count
7 Day Average Unit Health Trend
Unit Status
Plant Managers use reports to:
Gauge current plant performance and health
Compare performance to previous performance

Copyright © 2015 Rockwell Automation, Inc. All Rights Reserved. Rockwell Automation TechED 2015 @ROKTechED #ROKTechED
Process Control Engineer
Reports provide control loop
performance analysis, for example:
Oscillation Report, Tuning Deviation
Control loop issues are also
identified via: Troublemakers, Alerts
Once an issue is identified, metrics
and process data can be used to
perform root cause analysis
Example Use Cases:
Interactions Analysis

Copyright © 2015 Rockwell Automation, Inc. All Rights Reserved. Rockwell Automation TechED 2015 @ROKTechED #ROKTechED
Process Control Engineer
Spectral analysis tool used to identify an oscillation in the steam quality
Correlation showed that steam quality lagging behind the oxygen trim controller
Power Spectrum and Cross Correlation identified the O2 trim controller as the cause of the steam quality oscillations.
Further Investigation identified Stiction on the O2 Control Valve

Copyright © 2015 Rockwell Automation, Inc. All Rights Reserved. Rockwell Automation TechED 2015 @ROKTechED #ROKTechED
Reliability Engineer / Maintenance
Metrics which can point to maintenance issues:
Valve metrics
Valve sizing (Average CO valve near constraints)
PV noise
Saturation reports
Case Studies:
Stiction Report
Output Distribution

Copyright © 2015 Rockwell Automation, Inc. All Rights Reserved. Rockwell Automation TechED 2015 @ROKTechED #ROKTechED 28
Reliability Engineer / Maintenance

Copyright © 2015 Rockwell Automation, Inc. All Rights Reserved. Rockwell Automation TechED 2015 @ROKTechED #ROKTechED
Reliability Engineer / Maintenance
Metrics identified decreasing controller output distribution (ie: Average CO drops)
Investigation showed excessive valve seat wear allowing more liquid to pass, liquid was even passing while valve was fully closed.

Copyright © 2015 Rockwell Automation, Inc. All Rights Reserved. Rockwell Automation TechED 2015 @ROKTechED #ROKTechED
Process Operators
Focus on metrics that summarize
controller health and controller
mode
Operates use alerts to indicate
when a loop metric exceeds its
benchmark for a set period of
time
Copyright © 2015 Rockwell Automation, Inc. All Rights Reserved. Rockwell Automation TechED 2015 @ROKTechED #ROKTechED
What Do You Need?
Data Tools Ownership

Copyright © 2015 Rockwell Automation, Inc. All Rights Reserved. Rockwell Automation TechED 2015 @ROKTechED #ROKTechED
QUESTIONS?
PR23 - Control Station: PID Control Loops and Process Optimization: Capitalize on What Your Plant is Telling You
Identify controller tuning, mechanical and process architecture issues using your plant’s existing process data.
Use advanced forensics to isolate their root-causes.
Industrial case studies highlight enhancements to production throughput and efficiency.
Your Plant is Constantly Communicating…
Metrics and Reports Provide the Translation…
Listen to Your Plant!
Contact Info:
Bob Rice


![sem 14 Process Control & Instrumentation part IV Control loops · B.T.S FEE [D. Bord lycée St Michel – 54] sem 14 Process Control & Instrumentation part IV Control loops This chapter](https://img.pdfslide.net/doc/110x75/5e8805758ec81924512801e6/sem-14-process-control-instrumentation-part-iv-control-loops-bts-fee-d.jpg)