Embed Size (px)
Citation preview
Correlational ResearchBy Sheila Wilson,
Bonnie Dompierre, andDarrell Lewis
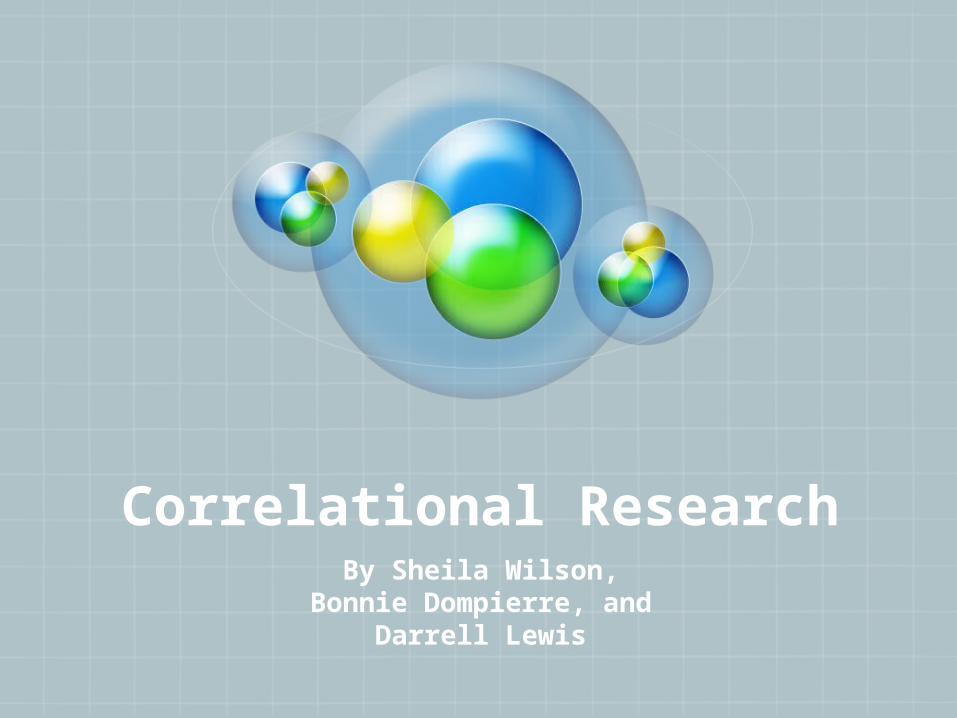
What is Correlational Research?
Correlational research involves
collecting data
relation exists
between two or more
variables.
to determine whether, and to what
degree a
The degree of relation is expressed as a correlation coefficient.P. 216 Textbook
These are not cause and effect relationships!
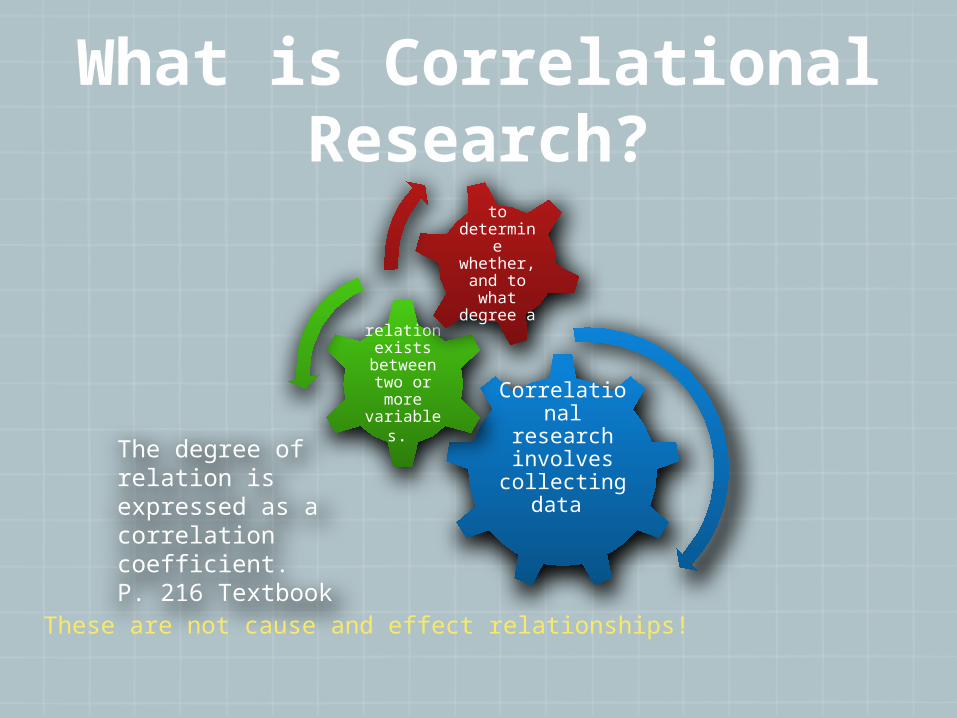
What is the process of
Correlational Research?
Low intelligence test score
=
Low grade point average.
High intelligence test score.
=
High grade point average
Example: Intelligence and academic achievement are related. Individuals with high scores on intelligence tests tend to have high grade point averages, while individuals with low scores on intelligence tests tend to have low grade point averages.
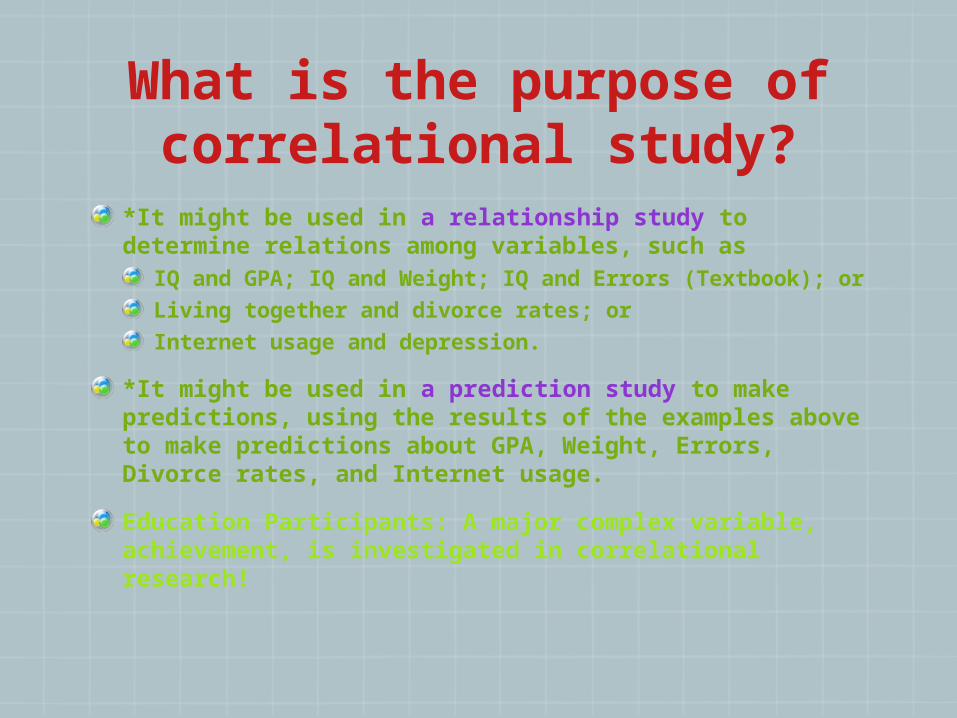
What is the purpose of correlational study?
*It might be used in a relationship study to determine relations among variables, such as
IQ and GPA; IQ and Weight; IQ and Errors (Textbook); or
Living together and divorce rates; or
Internet usage and depression.
*It might be used in a prediction study to make predictions, using the results of the examples above to make predictions about GPA, Weight, Errors, Divorce rates, and Internet usage.
Education Participants: A major complex variable, achievement, is investigated in correlational research!
Variables that are not highly related can be dropped.
Variables that are highly related can be examined closer to determine the nature of the relations.
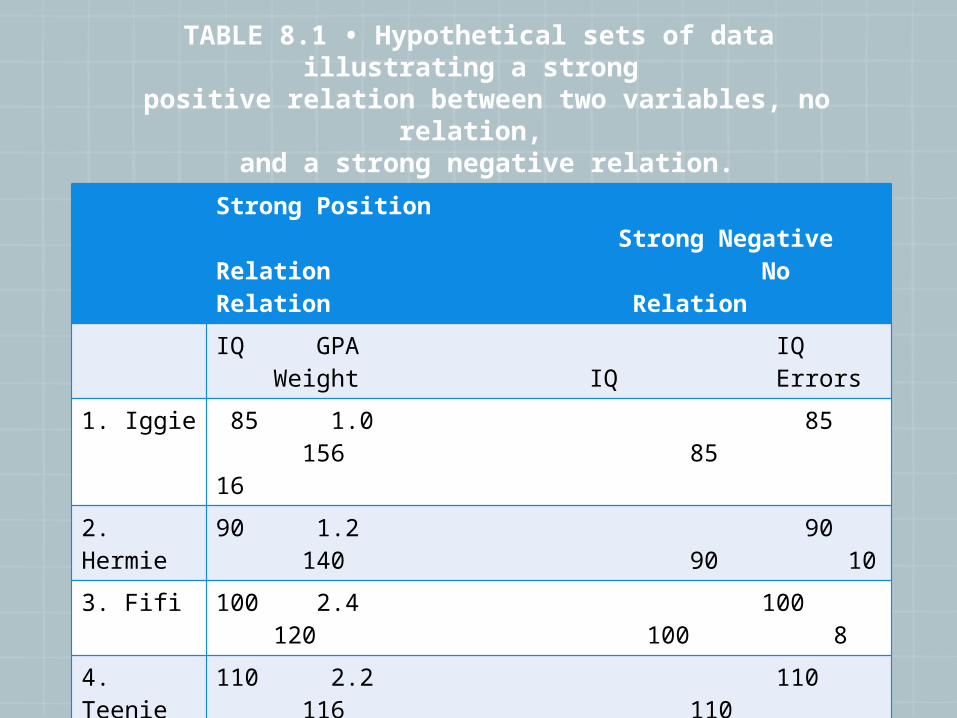
TABLE 8.1 • Hypothetical sets of data illustrating a strong
positive relation between two variables, no relation,
and a strong negative relation.
Strong Position Strong NegativeRelation No Relation Relation
IQ GPA IQ Weight IQ Errors
1. Iggie 85 1.0 85 156 85 16
2. Hermie
90 1.2 90 140 90 10
3. Fifi 100 2.4 100 120 100 8
4. Teenie 110 2.2 110 116 110 5
5. Tiny 120 2.8 120 160 120 9
6. Tillie 130 3.4 130 110 130 3
7. Millie 135 3.2 135 140 135 2
8. Jane 140 3.8 140 166 140 1
Correlation
r = + .95 r = + .13 r = -.89
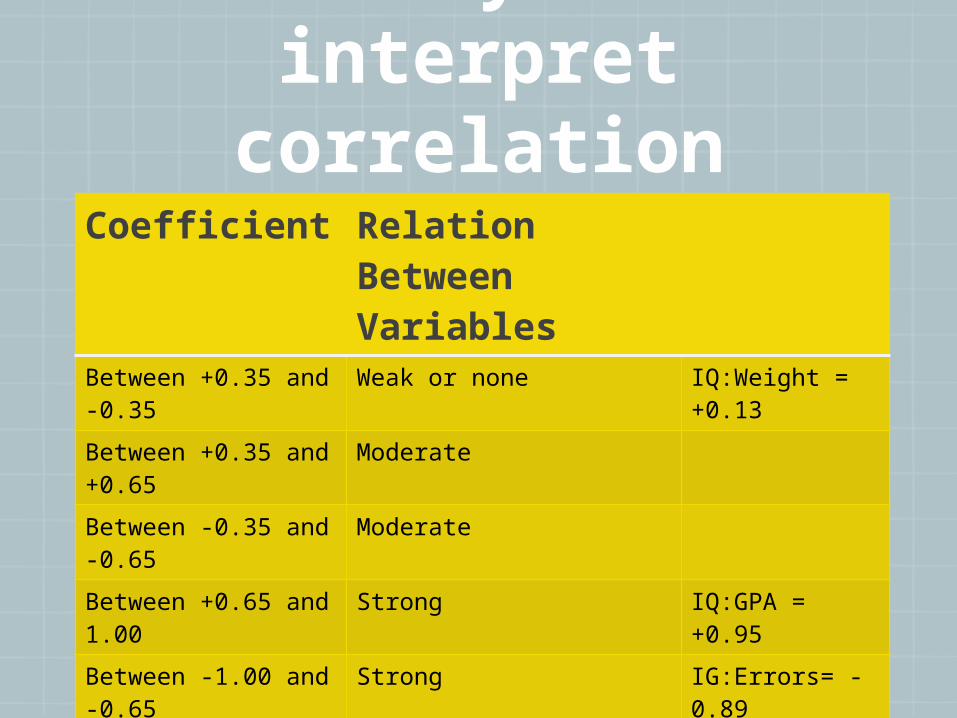
A way to interpret correlation coefficients:Coefficient Relation
Between Variables
Between +0.35 and -0.35
Weak or none IQ:Weight = +0.13
Between +0.35 and +0.65
Moderate
Between -0.35 and -0.65
Moderate
Between +0.65 and 1.00
Strong IQ:GPA = +0.95
Between -1.00 and -0.65
Strong IG:Errors= -0.89
Common new researcher mistakes, and the shared variance is the
variation of the variable.
The Process:Problem Selection:
A)
B)
Choose logical variables. onlyhdwallpapers.com
Use theoretical basis.www.mediacamp.com
PARTICIPANT AND INSTRUMENT SELECTION
SAMPLE IS 30 OR > 30. NO LESS THAN 30LARGER SAMPLE IF VALIDITY AND RELIABILITY ARE LOW.
VALIDITY IS MAKING SURE THAT THE RIGHT INSTRUMENT IS USED TO CARRY OUT THE STUDY; OR THAT THE VARIABLES BEING STUDIED ARE APPROPRIATE
RELIABILITY IS DETERMINED BY THE ABILITY TO REPEAT A STUDY WITH THE SAME RESULTS. THE MORE TIMES A STUDY IS REPEATED WITH THE SAME RESULTS THE HIGHER THE RELIABILITY.
INSTRUMENTS MUST REFLECT VARIABLES!
USING ACHIEVEMENT IN MATH AS A PREDICTOR OF ACHIEVEMENT IN PHYSICS COULD RESULTS IN A WEAK CORRELATION SINCE MATH IS ONLY ONE PART OF PHYSICS (TEXT BOOK, PAGE 205)
IN THIS EXAMPLE AN ADDITIONAL VARIABLE MIGHT NEED TO BE INCLUDED TO ACCURATELY PREDICT ACHIEVEMENT IN PHYSICS, SUCH AS CHEMISTRY
Design and Procedure
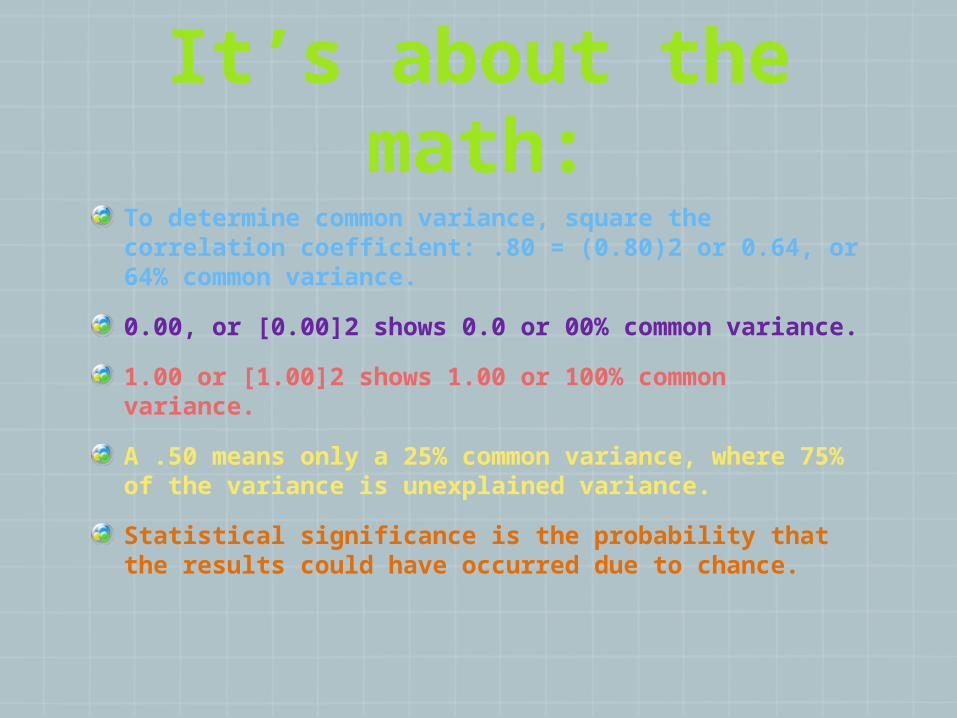
To determine common variance, square the correlation coefficient: .80 = (0.80)2 or 0.64, or 64% common variance.
0.00, or [0.00]2 shows 0.0 or 00% common variance.
1.00 or [1.00]2 shows 1.00 or 100% common variance.
A .50 means only a 25% common variance, where 75% of the variance is unexplained variance.
Statistical significance is the probability that the results could have occurred due to chance.
It’s about the math:
Types of Correlational Research:
Relationship Study – A researcher attempts to gain insight into variables that are related to a complex variable.
Academic achievement vs. Socioeconomic status
Prediction Studies – A researcher uses two highly related variables to predict scores on other variables.
High GPA and IQ as a predictor of success in college.
In a Relationship (Study)
• Researchers gain insight to variables or factors that are related to a complex variable.
• In Educational Research:
a) academic achievement
b) motivation
c) self-concept
Data CollectionFirst: Identify the variables to be related.
Ex: Academic Achievement vs. Socioeconomic Status
Next, identify appropriate population to sample.
www.istockphoto.com
Data Analysis and Interpretation of a Relationship
StudyPearson r is the most common technique.
Spearman rho is a rank correlation coefficient.
Others: phi coefficient (gender based, political affiliation, smoking status, educational status), Kendall’s tau, Biserial, Point biserial, Tetrachonic, Intraclass, and Correlation ratio, or eta.
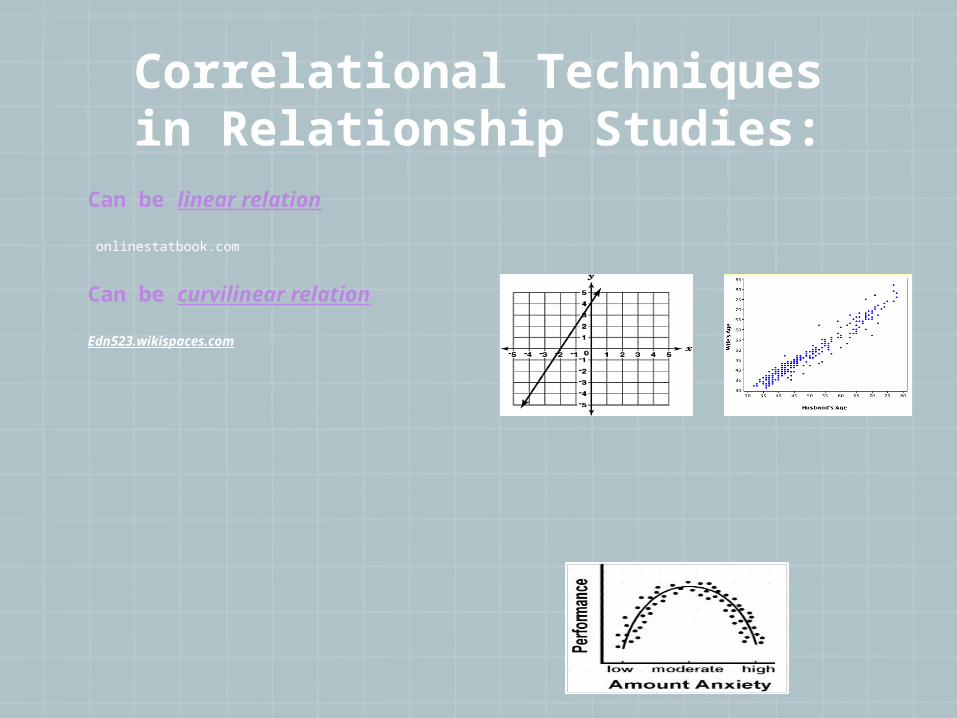
Correlational Techniques in Relationship Studies:
Can be linear relation
onlinestatbook.com
Can be curvilinear relation
Edn523.wikispaces.com
Prediction Studies and Data
collection:
Definition: An attempt to determine which number or variables are most highly relatedto criterion variable.
Data collection requires participants to provide desired data and to be available to the researcher.
Shrinkage occurs when the second predictor group has less accurate data than the first predictor group.
Cross-validation should occur if one-of-a-kind circumstances in one group result.
Data Analysis and Interpretation of
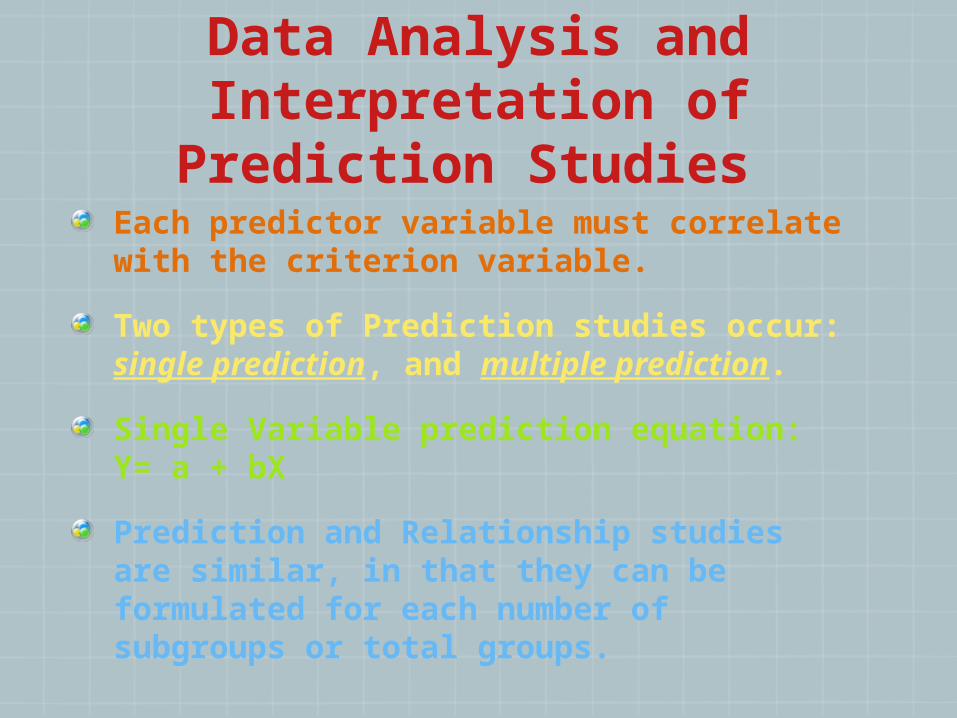
Prediction Studies Each predictor variable must correlate with the criterion variable.
Two types of Prediction studies occur: single prediction, and multiple prediction.
Single Variable prediction equation: Y= a + bX
Prediction and Relationship studies are similar, in that they can be formulated for each number of subgroups or total groups.
FYI • Many sophisticated statistical analyses
are based on correlation data:• Multiple Regression• Discriminate Function Analysis• Canonical Analysis• Path Analysis• Structural Equation Modeling, AKA
LISREL• Factor Analysis
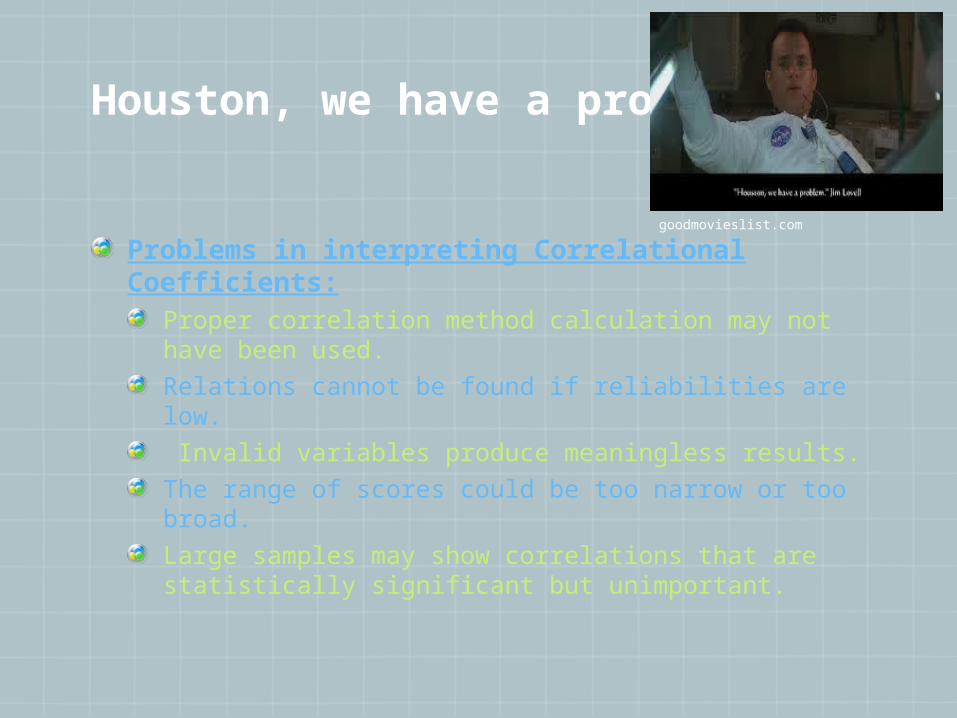
Houston, we have a problem…
Problems in interpreting Correlational Coefficients:
Proper correlation method calculation may not have been used.
Relations cannot be found if reliabilities are low.
Invalid variables produce meaningless results.
The range of scores could be too narrow or too broad.
Large samples may show correlations that are statistically significant but unimportant.
goodmovieslist.com


![Correlational Research - Article[1]](https://img.pdfslide.net/doc/110x75/577d2ba41a28ab4e1eaaf991/correlational-research-article1.jpg)