Embed Size (px)
Citation preview

Costing Methodologies for I f i T h lInformation Technology
Tennessee IT SymposiumApril 21, 2008April 21, 2008
Th D f dThomas DanfordChief Information OfficerTennessee Board of Regents

SCIENCE APPLICATIONS INTERNATIONALCORPORATION (SAIC) ORLANDO, FL
Cost Analyst: Developed baseline cost estimates acquisition cost estimates budgetaryCost Analyst: Developed baseline cost estimates, acquisition cost estimates, budgetary proposals, and other cost/budget related studies for a variety of Department of Defense programs. Program assignments included: The Conduct of Fire Trainer (COFT), for use by the US Army in the training of M1, M1A1, M60, and Bradley Fighting Vehicle crews. The Main Tank Gun/Weapon Effects Signature Simulator (MTG/WESS), a battlefield simulator for use in force-
f i i b h d i f h l GUARDFIST I & II i i id di kon-force training by the armor and infantry schools. GUARDFIST I & II, interactive videodisk trainers for Army National Guard armor units. Chemical Warfare Oxygen Generator (CWOG), a device designed to produce therapeutic oxygen while operating in a CW environment, and other cost studies relating to military training and simulation requirements. These assignments involved the analysis of life cycle cost, budget/contract requirements, cost benefit, o ed t e a a ys s o e cyc e cost, budget/co t act equ e e ts, cost be e t,contingency, sensitivity and trade-off.

Goals, Objectives, and Ground Goa s, Object es, a d G ou dRules
Discussion of Current Budgetary ClimateOverview of Cost Estimating Tools and Methodologies Used in ITMethodologies Used in ITThe Role of Costing in Determining Better Resource Allocation DecisionsResource Allocation DecisionsNo Math/Accounting Lessons or Review!All Examples Presented are for IllustrativeAll Examples Presented are for Illustrative Purposes Only!Focus on Quantitative not Qualitative
Cost Estimate vs. Cost Cost st ate s CostMethodology vs. Cost Model
What is A Cost Estimate?The analysis of all cost elements of a project proposal or on-going work. It includes verification of cost data, determination and evaluation of all elements of costs and projection of these data to determine the effect onelements of costs, and projection of these data to determine the effect on price.
What Is A Cost Methodology?A i d d t d t f ti l id tiAn organized, documented set of practical ideas, proven practices, procedures and guidelines used for determining one or more cost elements of a cost analysis.
What is A Cost Model?A set of mathematical relationships arranged in a systematic sequence to incorporate/formulate a cost methodology(ies) in which cost estimates are deri ed from inp ts T picall a cost model is in the form of a comp terderived from inputs. Typically a cost model is in the form of a computer program or spreadsheet.

Types of Cost Estimates
Order of Magnitude EstimatesBudgetary Estimatesg yDefinitive (Detailed) Estimates

Cost MethodologiesCost Methodologies(Appropriate & Popular in IT Costing)
ParametricCost Estimating Relationships (CERs)Cost Estimating Relationships (CERs)Learning CurveRegressionRegression
Design to Specification “Bottom-up”D i t B d t “T d ”Design to Budget “Top-down” Ratios
Parametric Methods
Cost Estimating Relationships (CERs)B d hi i l d d i iBased upon historical data and statisticsIndustry/use specificSt ti ti ll i bl (F & T St ti ti )Statistically viable (F & T Statistic)
Learning Curve (Slide Follows)Regression (Slide Follows)

CERCERs
Home GrownHome GrownAvg. HD Requests/Business Day: 7.68
Avg. Time (Hrs) to Resolution/Request: 3.25
A R t /Y 1 896Approx. Requests/Year: 1,896
Approx. Person Hours/Year: 6,162
FTEs Required for SMO Requests: 4
Industry “Accepted”System Project Management (SPM)
General & Administrative (G&A)
Average Change Traffic (ACT)

Learning Curve
70
80
90
100s
30
40
50
60
Labo
r Hou
rs
0
10
20
0 20 40 60 80 100 120
A sample 90% learning curve. The first time the task is performed requires 100 hours of labor to complete and as the number of times the task is repeated, the labor hours required
Task Repetition
to complete and as the number of times the task is repeated, the labor hours required decreases due to learning. After the 50th time in performing the task however, the reduction in labor hours from learning diminishes.
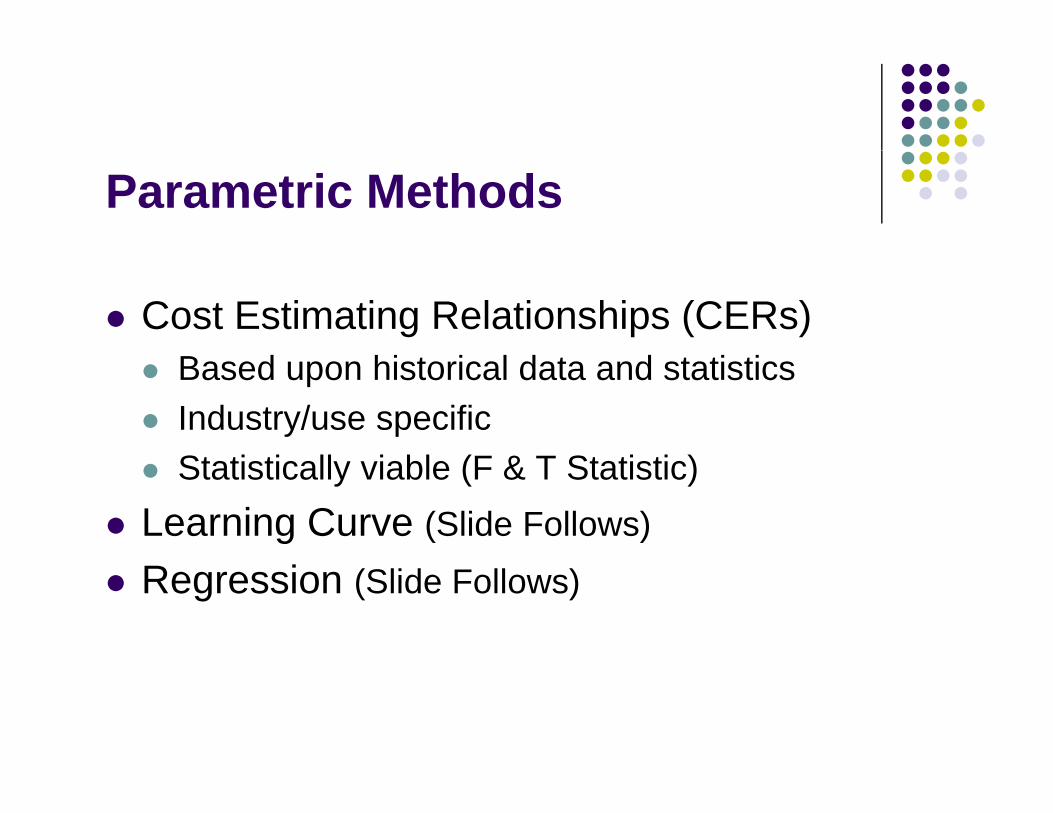
RegressionLEAP Conversion Cost Estimates
(Standalone by Tier)
7 0
8.0
4.0
5.0
6.0
7.0
ost (
in $
M)
0.0
1.0
2.0
3.0
II III IV V VI
Co
II III IV V VI
SunGard Licensing Tier Best FitKnow n LEAP Conversions
A “best fit” curve for calculating approximate costs of “stand alone” ERP implementations of all HEP Tiers.
Bottom-up vs. Top-down
Both require extensive analysis of direct and (as much as possible) indirect costsmuch as possible) indirect costsDirect & indirect costs are identified/established through the work breakdown structure (WBS)May utilize/incorporate parametric methodologiesBottom-up is requirements driven whereas Top-down is funding driven

S l WBS
1.0 Hardware Costs
1.1 Servers
1.2 Storage
1.3 Network Equipment
Sample WBSElements will vary by project …
1.4 Backup
1.5 De-installation/disposal fees
2.0 Software Costs
2.1 Applications
2 2 OS
Note on Indirect Costs: When expenses are shared among projects/departments such as legal services security
2.2 OS
2.3 Middleware
2.4 Security (NMS, access, etc.)
2.5 Media conversion (tapes)
3.0 Professional servicessuch as legal services, security, accounting, purchasing, payables, and the like, they are defined as indirect costs. Identifying and accounting for
3.1 Project Management
3.2 Consulting
3.3 Training
3.4 Expenses (travel & per diem)
4.0 Site preparation and implementation
these costs are among the biggest challenges for cost estimating.
Indirect costs inevitably benefit (or
4.0 Site preparation and implementation
4.1 AC power cabling
4.2 HVAC
4.3 Racking
4.4 Network cablingIndirect costs inevitably benefit (or burden) all projects and since calculating the full cost of a project is required for true discounted cash flow analysis, every
5.0 Recurring
5.1 Personnel
5.2 Hardware maintenance
5.3 Software maintenance
5.4 AC power & HVAC
effort should be made to identify them as much as possible or determine a burden rate.
5.5 Insurance
6.0 Miscellaneous
6.1 Parallel operations (maintenance, backfill, etc.)
6.2 Indirect cost burden

Total Cost of Ownership (TCO) vs.Total Cost of Ownership (TCO) vs. Total Cost of Acquisition (TCA)
TCO can and usually does vary dramatically i t TCAagainst TCA
TCO is more relevant in determining the i bilit f it l i t tviability of any capital investment
Vendors typically focus on either acquisition i t t b t th t t bor maintenance costs but the two must be
considered together

Life Cycle Costing – The Time e Cyc e Cost g e eValue of Money
Research & Development ProductionProductionFielding (1-3 yrs)Sustainment (over the useful life)Sustainment (over the useful life)

Cost Benefit Analysis
The discounted value of a project’s life cycle benefits is compared to the discounted value pof its life cycle costsQualitative vs. QuantitativeQualitative vs. QuantitativeDiscounted Cash-flow (DCF) Methods
Net Present Value (NPV)Net Present Value (NPV)Internal Rate-of-return (IRR)
Revenue Neutral Projects - NPVRevenue Neutral Projects - NPV

NPV AnalysisNPV of Two Technologies/Methodologies
$3,000,000
$3,500,000
$1,500,000
$2,000,000
$2,500,000
$0
$500,000
$1,000,000
Year #1 Year #2 Year #3 Year #4 Year #5
§ 49-7-1___(a)(2)(A) Costs § 49-7-1___(a)(2)(B) Costs
5 Year Cumulative Costs for TCA Title 49, Chapter 7, Part 1 Amendment (Residential Only)
Year #1 Year #2 Year #3 Year #4 Year #5 NPV
§ 49-7-1___(a)(2)(A) Costs 697,500 1,274,100 1,861,767 2,460,722 3,071,192 2,817,244
§ 49-7-1___(a)(2)(B) Costs 1,365,000 1,569,750 1,774,500 1,979,250 2,184,000 2,064,151

Return on Investment (ROI)
Ratio of resources gained or lost on a project l ti t th t f i t drelative to the amount of resources invested
Choice of investment alternatives can be ti l t hi h ROIessential to high ROI
Leveraging Economies of Scale Results in a G t ROIGreater ROIAppreciating vs. Depreciating ROI

ROI
Distance Education Programs
Campus Delivered vs. Collaborative Online
Campus Collaborative
Program Program
Course Development Costs $3,000 -$6,000
Online Fee/Course 40 40
Reimbursement Rate/Course 30% 30%Reimbursement Rate/Course 30% 30%
Number of Students 20 100
Marginal Return/Course $12 $12
Total Revenue $240 $1,200
ROI -92% 120%
Many Indirect Cost Savings-24x7 Helpdesk
-Library
-Hosting
-Professional Development

Applications of Cost-Benefit & pp cat o s o Cost e e t &ROI Analysis in IT
Whether or not to pursue a projectSelect among alternatives with different benefitsSelect among competing projects in ITSelect among competing projects in and outside of IT

Cost–Benefit & ROICost–Benefit & ROITips for a Better Analysis
Don’t start with a predetermined conclusionClearly define problem with realistic baseline, allClearly define problem with realistic baseline, all reasonable alternatives, and benefits and costs measuresMonetize benefits and costs as much as possibleUse credible dataDeal appropriately with risk and uncertainty

Parametric Cost Models
COnstructive COst MOdel (COCOMO) –Long History & Open Sourceg y pSEER-SEM – Galorath Inc.PRICE-SPRICE-SSoftware Cost Modeling System (COSMOS)
ETSU– ETSU

COCOMO(PH)AM = (ACT)(PH)DEV( ) ( )( )
Contract Modifications OnlySunGard SMO Staff Only(PH)AM : Annual Maintenance in Person Hours 2,347(PH)DEV : Development Effort in Person Hours 8,094ACT : Fraction of software that undergoes change during a year 29.00%TBR SMO Staff Only(PH)AM : Annual Maintenance in Person Hours 809(PH)DEV : Development Effort in Person Hours 8,094ACT : Fraction of software that undergoes change during a year 10.00%All Modifications To DateSunGard SMO Staff Only( )(PH)AM : Annual Maintenance in Person Hours 6,891(PH)DEV : Development Effort in Person Hours 23,763ACT : Fraction of software that undergoes change during a year 29.00%TBR SMO Staff Only(PH)AM A l M i i P H 2 3 6(PH)AM : Annual Maintenance in Person Hours 2,376(PH)DEV : Development Effort in Person Hours 23,763ACT : Fraction of software that undergoes change during a year 10.00%

Ratios – Comparison of “similar” requirements with different approaches (E.g. ERP vs. 3GL)
Integrated Commercial RDBMS ERP (StudentIntegrated Commercial RDBMS ERP (Student, HR/Payroll, Finance)
FTEs - 15Total Annual Personnel Cost = $755KManagement Ratio = 16%
Best of Breed/Home Grown 3GL System (Student, HR/Payroll, Finance)
FTEs - 27FTEs - 27Total Annual Personnel Cost = $1.3MManagement Ratio = 33%
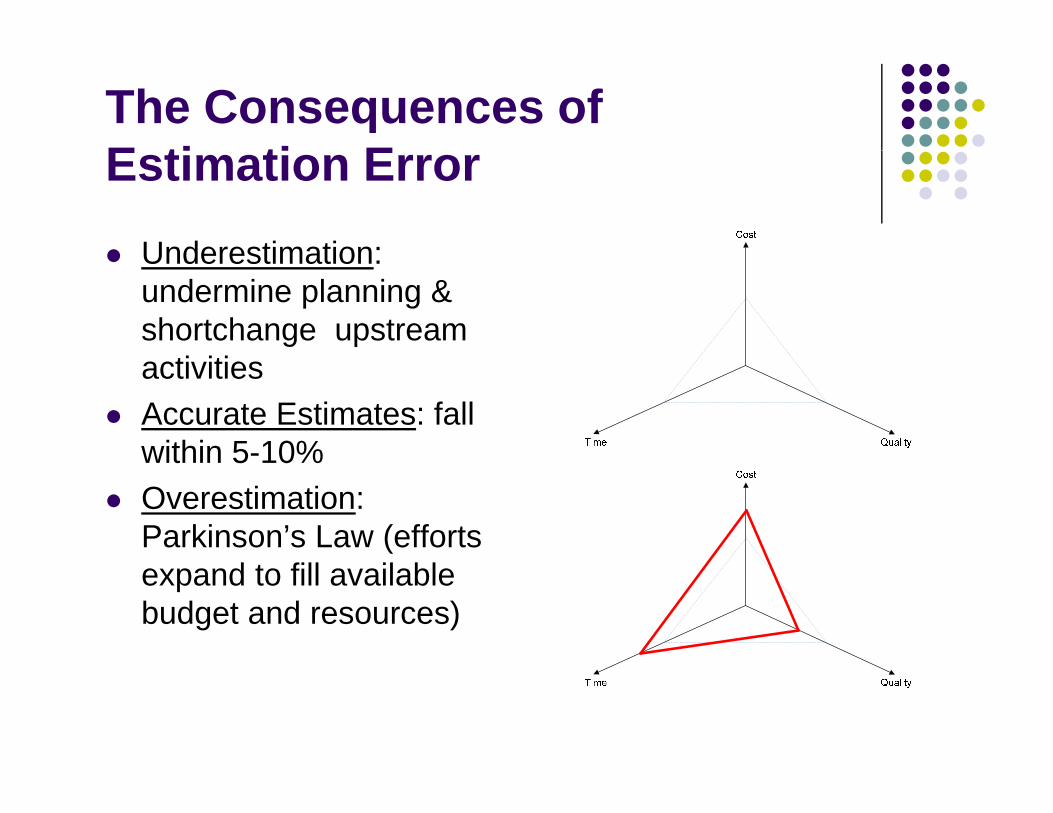
The Consequences of E ti ti EEstimation Error
Underestimation:Underestimation: undermine planning & shortchange upstream activitiesAccurate Estimates: fall within 5-10%within 5 10%Overestimation: Parkinson’s Law (efforts expand to fill available budget and resources)

Summary & Few Caveats
Business Case Requires Cost AnalysisJudgmentOptimism BiasStrategic MisrepresentationQualitative Issues Accompany CostQ p yRisk Needs to be Evaluated
RESOURCES
The Society of Cost Estimating and Analysis http://www sceaonline net/http://www.sceaonline.net/
The International Society of Parametric Analysts http://www ispa cost org/Analysts http://www.ispa-cost.org/
Data & Analysis Center for Software https://www.thedacs.com/databases/url/key/4/152https://www.thedacs.com/databases/url/key/4/152
Thanks for joining me today!!