Embed Size (px)
Citation preview
1
9th Australian Wind Energy
Conference
Craig Oakeshott
Director – Wholesale Markets Branch
Australian Energy Regulator
18 November 2013
Outlook for the National
Electricity Market
2
Outline - Outlook for the NEM
• Very Brief Background
• Factors impacting on wholesale market prices – Changes in electricity consumption patterns
• impact of high delivered electricity costs;
• efficiency improvements;
• solar; and
• economic growth.
• Intermittent nature of wind generation – Impacts on spot price volatility and existing thermal
generators
• Industry at a Crossroads
• NOTE these are my interpretations and not necessarily the official position of the AER
3
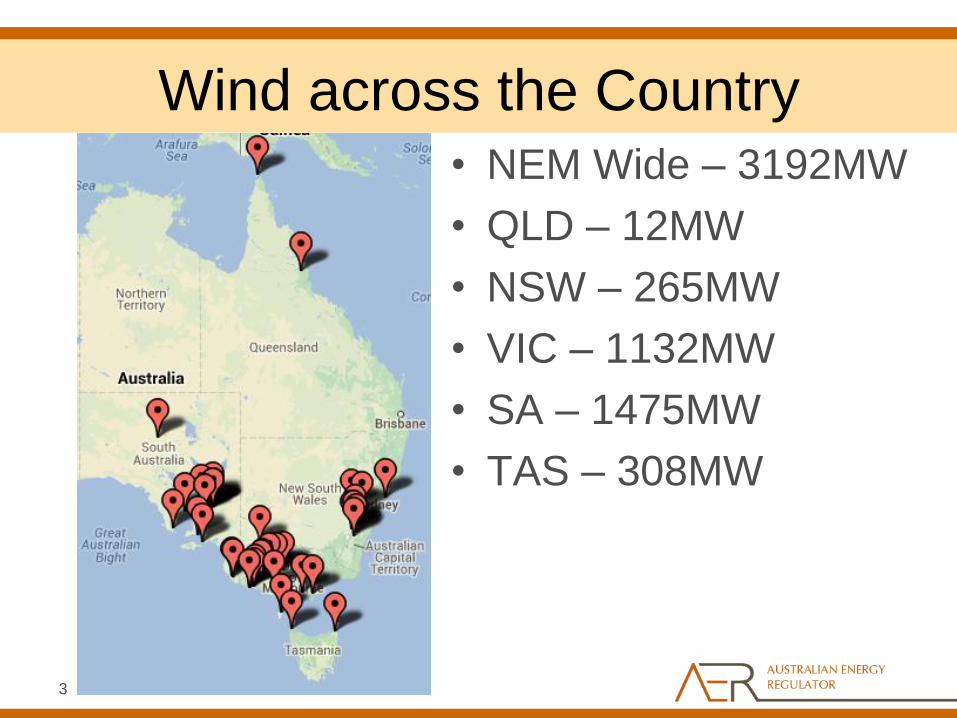
Wind across the Country • NEM Wide – 3192MW
• QLD – 12MW
• NSW – 265MW
• VIC – 1132MW
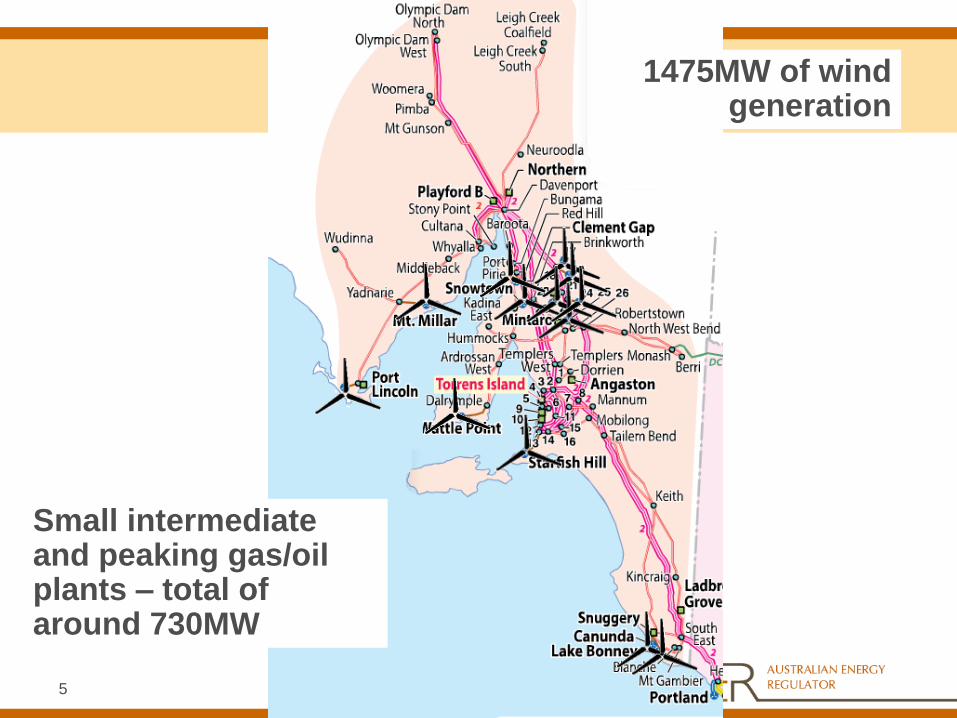
• SA – 1475MW
• TAS – 308MW
4
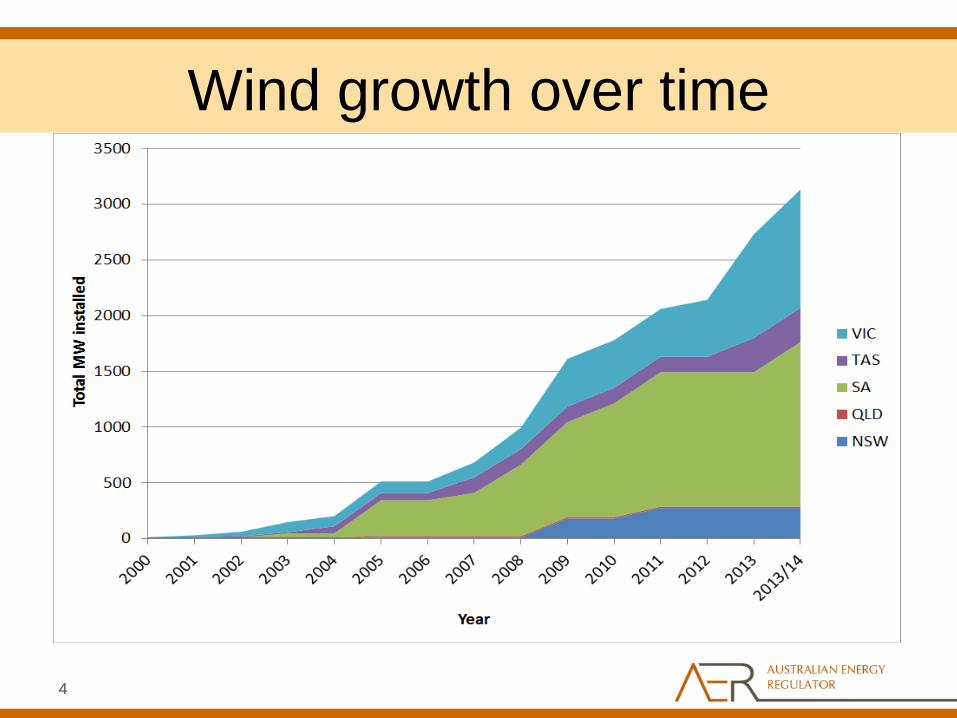
Wind growth over time
5
1475MW of wind generation
Small intermediate and peaking gas/oil plants – total of around 730MW

6
Factors impacting on
wholesale market prices
7
Demand
• Customer demand forecasts are flat in all states
– many other places in the world
• Delivered electricity prices have risen noticeably
• Causes are not actually black and white
– Economic conditions – some big customer failures
– High prices have encouraged domestic conservation
– Rooftop PV with FiTs • Eaten into the load profile
• But intermittent not firm
• But what about at a wholesale market level?
8
Market Prices
0
20
40
60
80
100
120
140
160
180
2003–04 2004–05 2005–06 2006–07 2007–08 2008-09 2009–10 2010-11 2011-12 2012-13
Co
un
t o
f n
eg
ativ
e p
ric
es
Qld NSW Vic SA
0
20
40
60
80
100
120
140
160
180
0-100 100-200 200-300 300-400 400-500 500-600 600-700 700-800 >800
Av
era
ge
Sp
ot
Pri
ce (
$M
Wh
)
Wind ouput (MW)
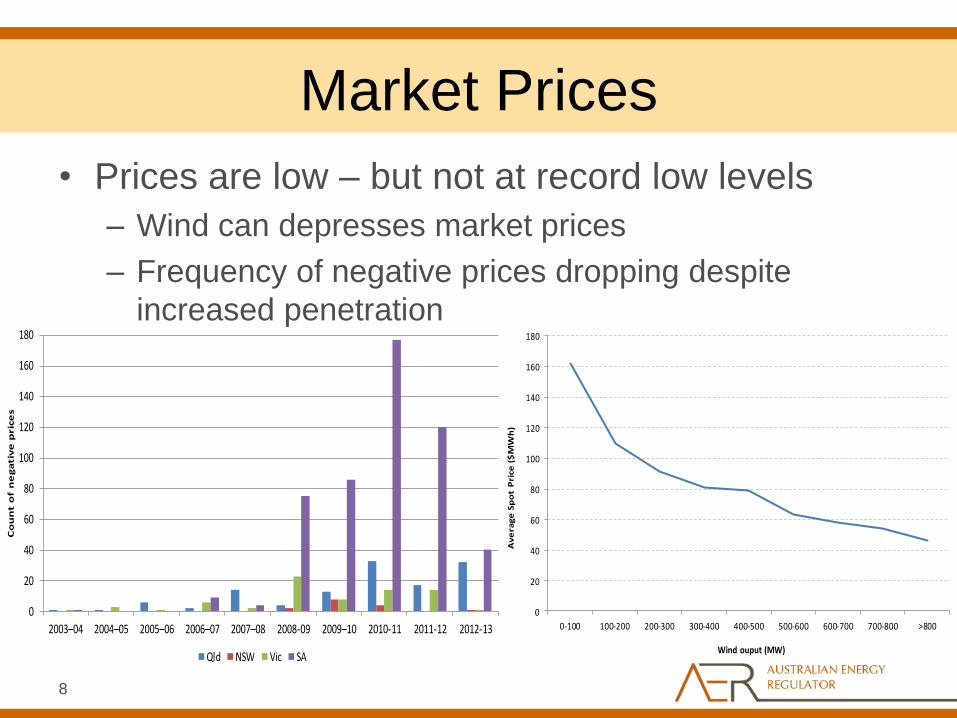
• Prices are low – but not at record low levels
– Wind can depresses market prices
– Frequency of negative prices dropping despite
increased penetration
9
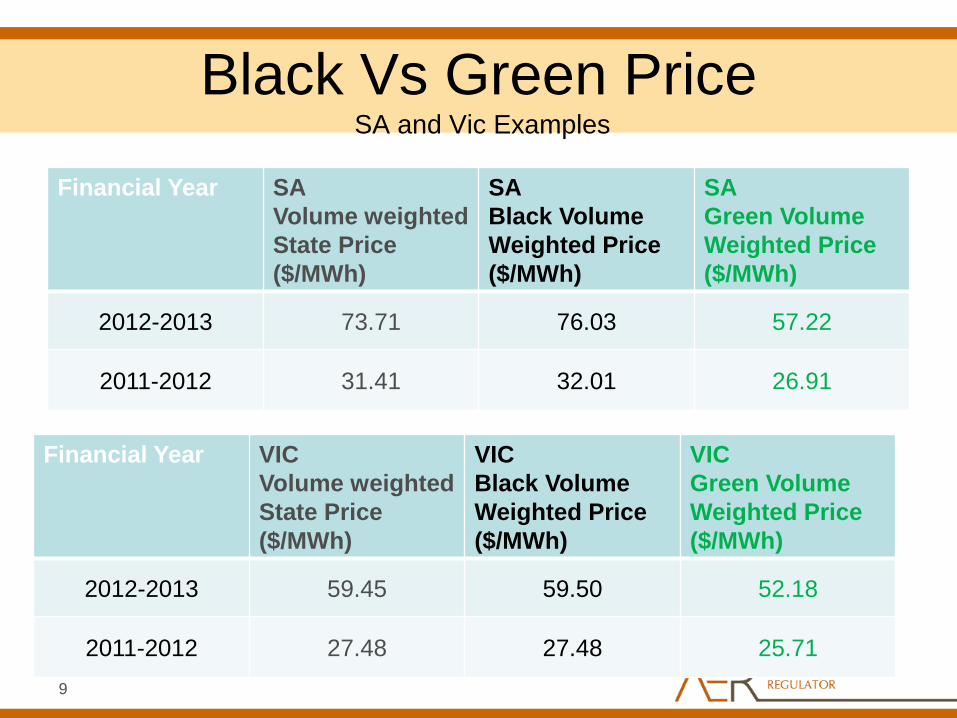
Black Vs Green Price SA and Vic Examples
Financial Year SA
Volume weighted
State Price
($/MWh)
SA
Black Volume
Weighted Price
($/MWh)
SA
Green Volume
Weighted Price
($/MWh)
2012-2013 73.71 76.03 57.22
2011-2012 31.41 32.01 26.91
Financial Year VIC
Volume weighted
State Price
($/MWh)
VIC
Black Volume
Weighted Price
($/MWh)
VIC
Green Volume
Weighted Price
($/MWh)
2012-2013 59.45 59.50 52.18
2011-2012 27.48 27.48 25.71
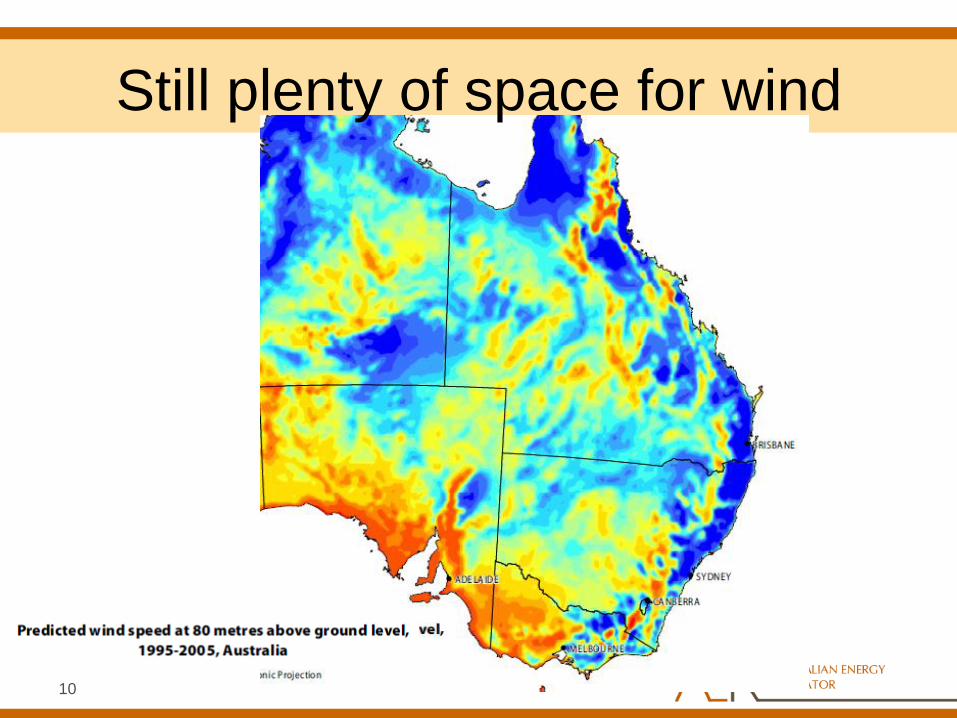
10
Still plenty of space for wind
11
Other factors affecting spot
prices • Transmission pricing and congestion
– ElectraNet outcome
– Connection and congestion is still an issue
– Market design is to deliver power to customers
– Affects all generators equally
• Uncertainty about 2014 RET review
• Short and long term future of Carbon
• New technologies advancing
• Potential future Gas price hikes
12
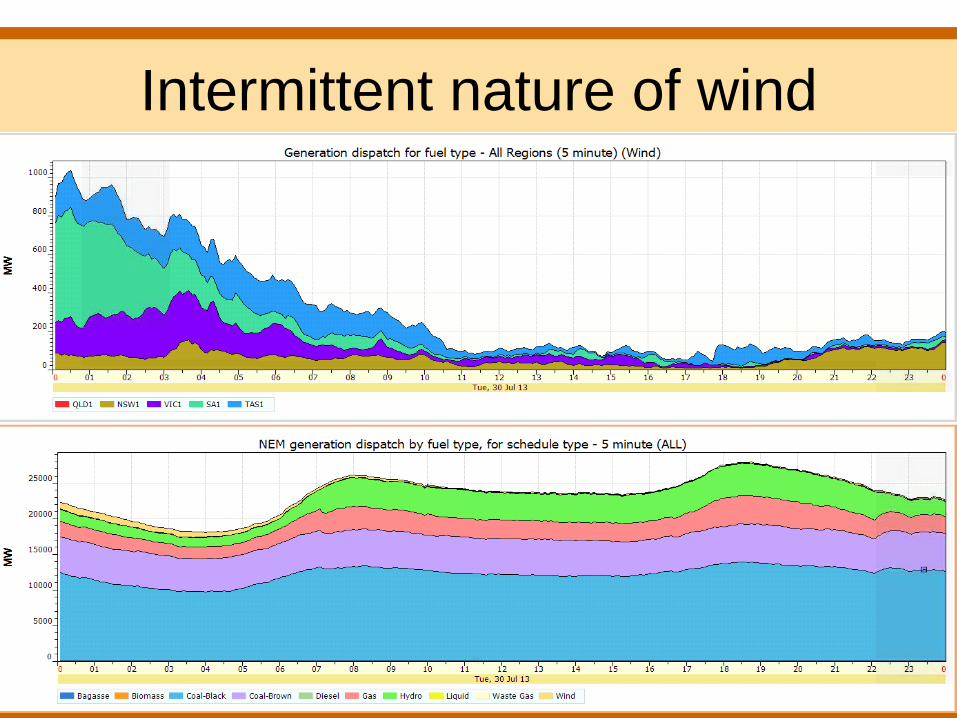
Intermittent nature of wind
13
Intermittent nature of wind
• Despite distribution of farms, output can be correlated.
• Worst case if wind drops as demand is increasing
• Output variability over short term and long term
• Longer term problem is– AEMO’s
• Shorter term may be Wind farms – causer pays FCAS
• Low and negative prices
14
Intermittent nature of wind
15
0
500
1000
1500
2000
2500
0
100
200
300
400
500
4:0
5 P
M
4:1
0 P
M
4:1
5 P
M
4:2
0 P
M
4:2
5 P
M
4:3
0 P
M
4:3
5 P
M
4:4
0 P
M
4:4
5 P
M
4:5
0 P
M
4:5
5 P
M
5:0
0 P
M
5:0
5 P
M
5:1
0 P
M
5:1
5 P
M
5:2
0 P
M
5:2
5 P
M
5:3
0 P
M
5:3
5 P
M
5:4
0 P
M
5:4
5 P
M
5:5
0 P
M
5:5
5 P
M
6:0
0 P
M
$/M
Wh
MW
Bluff Clements Gap Hallett 1 Hallett 2 North Brown Hill Snowtown Waterloo 5 min price
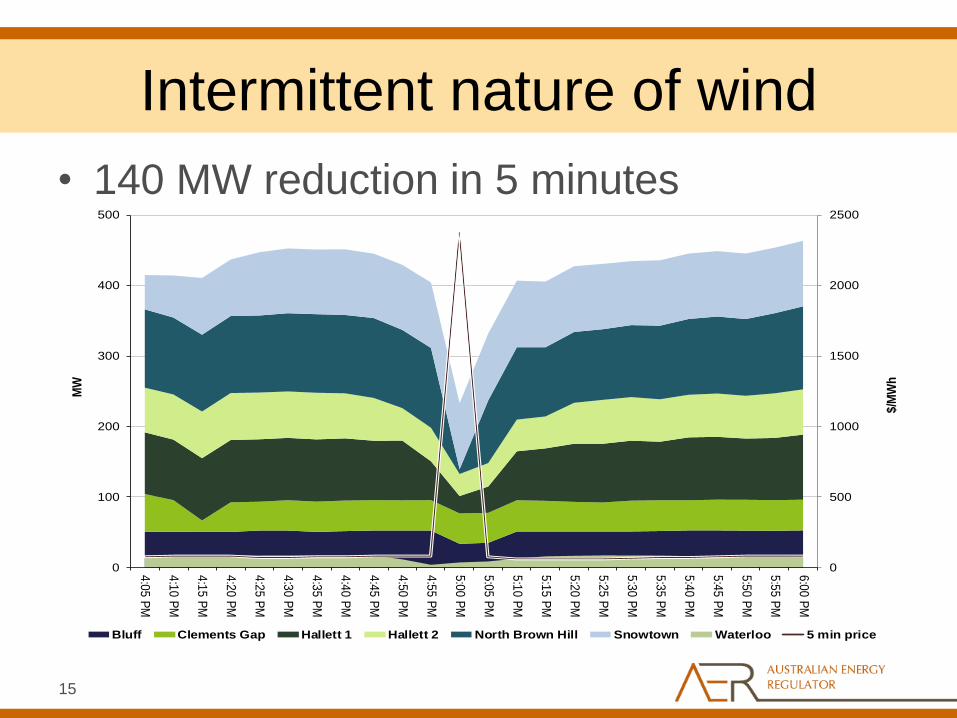
Intermittent nature of wind
• 140 MW reduction in 5 minutes

16
With whom is wind competing
• Wind offers at the bottom of the bid stack
– Normally a price taker not a price setter
– Amongst the other “determined to stay on”
generators
• So as wind increase what changed ?
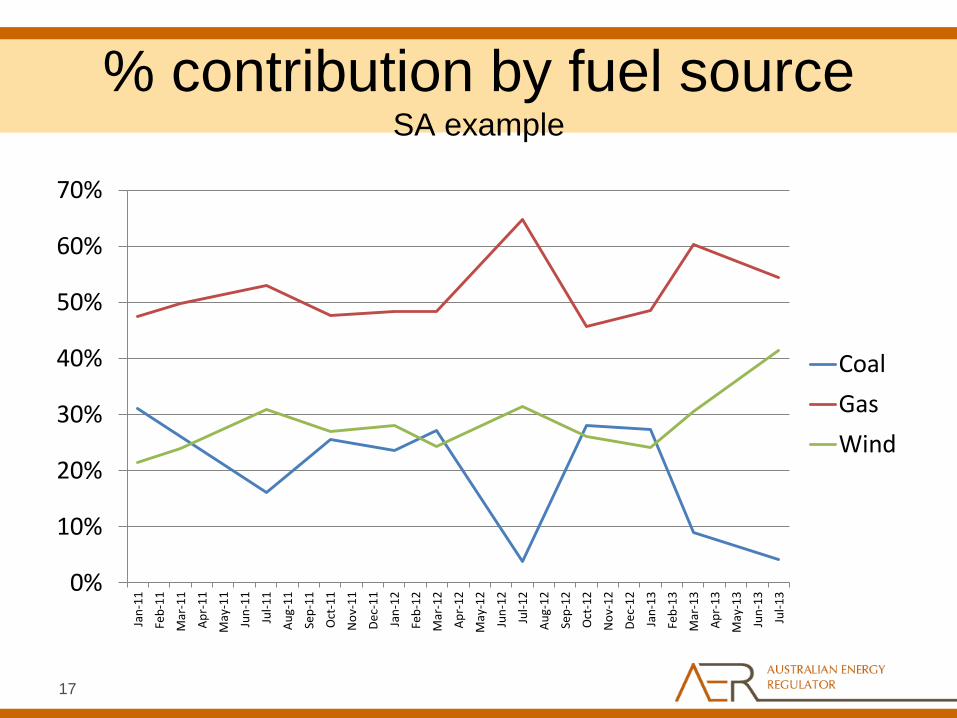
17
% contribution by fuel source SA example
0%
10%
20%
30%
40%
50%
60%
70%
Jan
-11
Feb
-11
Mar
-11
Ap
r-1
1
May
-11
Jun
-11
Jul-
11
Au
g-1
1
Sep
-11
Oct
-11
No
v-1
1
De
c-1
1
Jan
-12
Feb
-12
Mar
-12
Ap
r-1
2
May
-12
Jun
-12
Jul-
12
Au
g-1
2
Sep
-12
Oct
-12
No
v-1
2
De
c-1
2
Jan
-13
Feb
-13
Mar
-13
Ap
r-1
3
May
-13
Jun
-13
Jul-
13
Coal
Gas
Wind
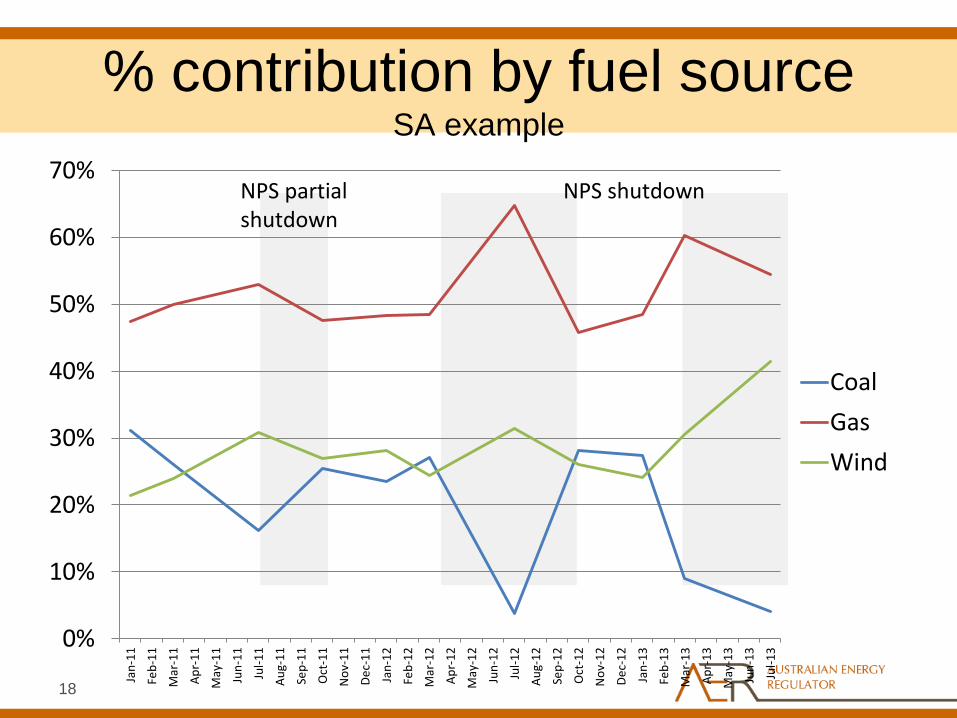
18
% contribution by fuel source SA example
0%
10%
20%
30%
40%
50%
60%
70%
Jan
-11
Feb
-11
Mar
-11
Ap
r-1
1
May
-11
Jun
-11
Jul-
11
Au
g-1
1
Sep
-11
Oct
-11
No
v-1
1
De
c-1
1
Jan
-12
Feb
-12
Mar
-12
Ap
r-1
2
May
-12
Jun
-12
Jul-
12
Au
g-1
2
Sep
-12
Oct
-12
No
v-1
2
De
c-1
2
Jan
-13
Feb
-13
Mar
-13
Ap
r-1
3
May
-13
Jun
-13
Jul-
13
Coal
Gas
Wind
NPS shutdown NPS partial shutdown
19
Industry at a Cross Roads
• SO Where to from here?
20
Industry at a Cross Roads
• Lean.….
21
Industry at a Cross Roads
• Lean.….Green
22
Industry at a Cross Roads
• Lean.….Green…..Gas Dream
23
Industry at a Cross Roads
• Lean.….Green…..Gas Dream…..Storage
24
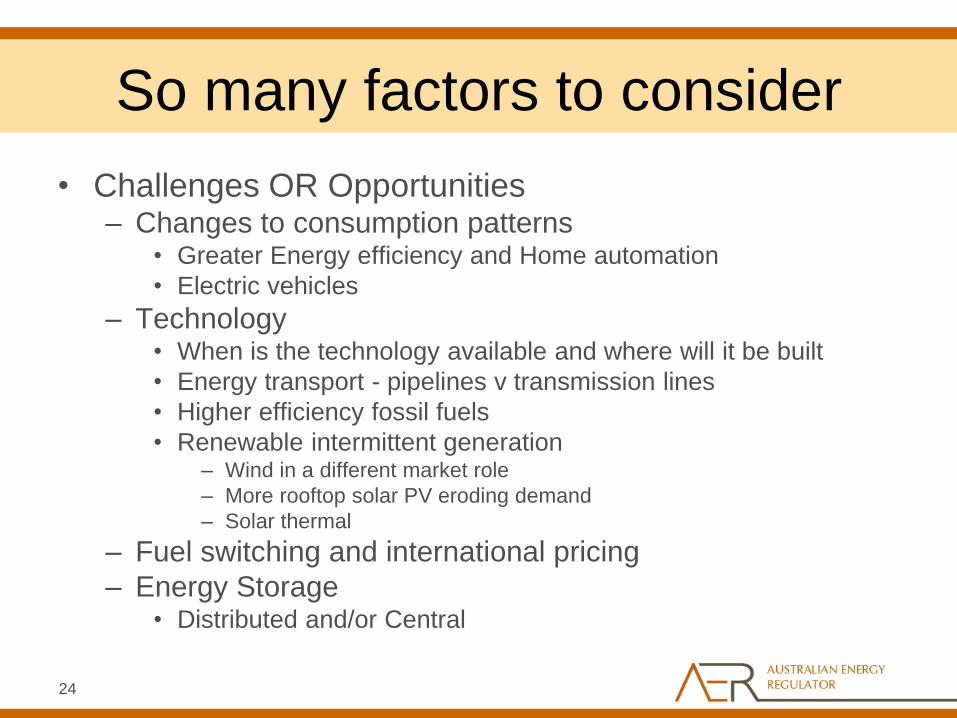
So many factors to consider
• Challenges OR Opportunities – Changes to consumption patterns
• Greater Energy efficiency and Home automation
• Electric vehicles
– Technology • When is the technology available and where will it be built
• Energy transport - pipelines v transmission lines
• Higher efficiency fossil fuels
• Renewable intermittent generation – Wind in a different market role
– More rooftop solar PV eroding demand
– Solar thermal
– Fuel switching and international pricing
– Energy Storage • Distributed and/or Central
25
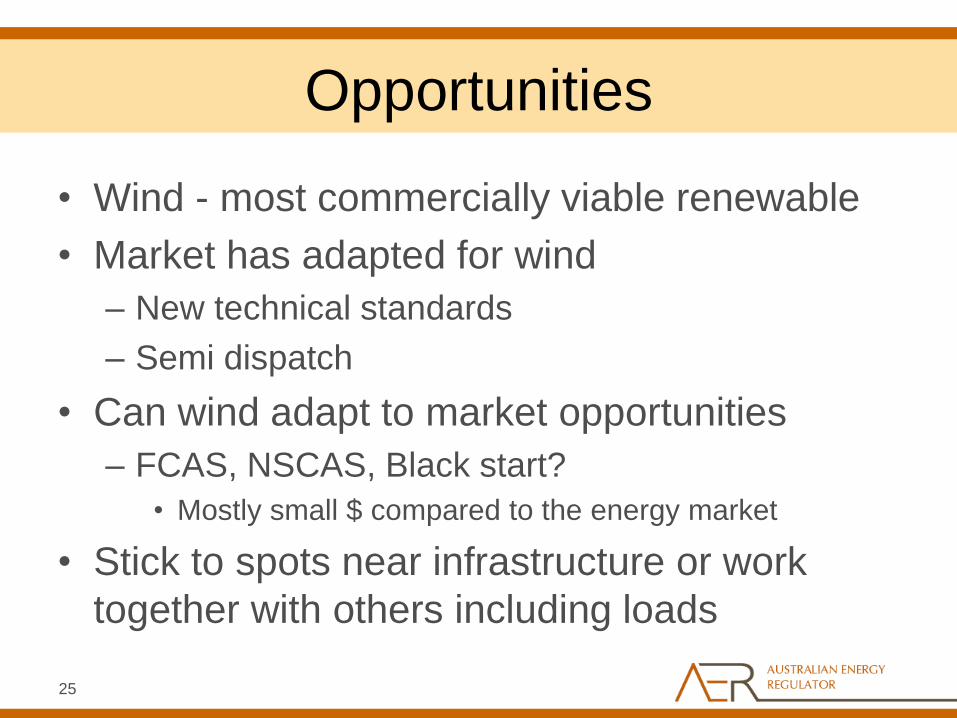
Opportunities
• Wind - most commercially viable renewable
• Market has adapted for wind
– New technical standards
– Semi dispatch
• Can wind adapt to market opportunities
– FCAS, NSCAS, Black start?
• Mostly small $ compared to the energy market
• Stick to spots near infrastructure or work
together with others including loads
26
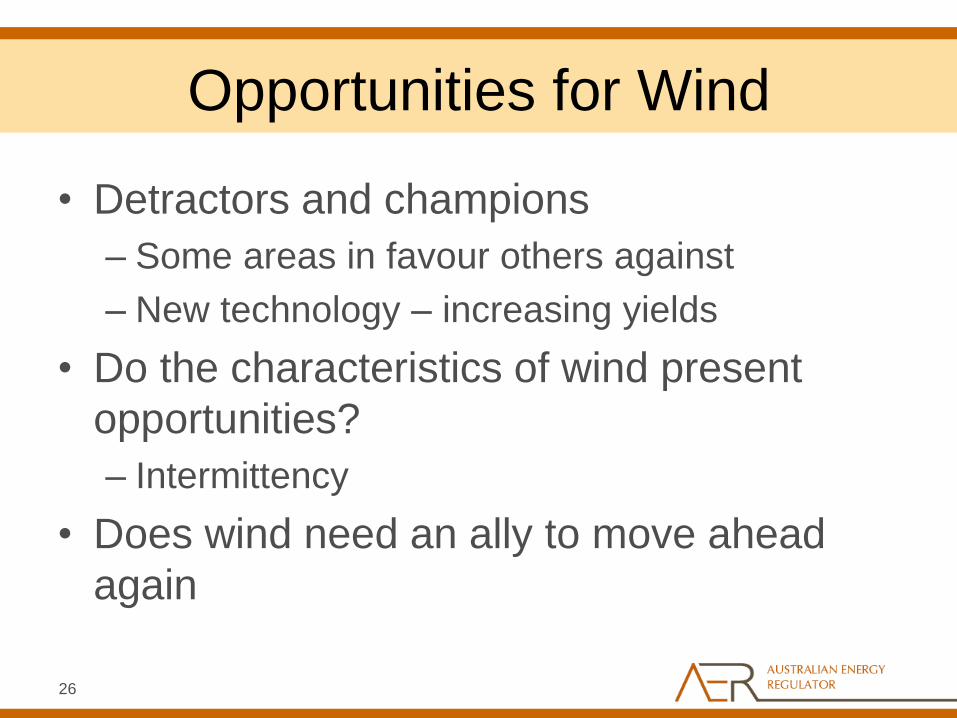
Opportunities for Wind
• Detractors and champions
– Some areas in favour others against
– New technology – increasing yields
• Do the characteristics of wind present
opportunities?
– Intermittency
• Does wind need an ally to move ahead
again
27
New players & alliances ?
• Who else will enter?
– financial institutions in or out?
– Telco’s could be facilitators
• NBN
• Home automation – IApps
• Distributors and transmission companies
28
Invert the paradigm
• Don’t generate to meet demand make demand match available generation
– Telco carries market signals and pricing to domestic customers
– Distributors and transmission companies manage storage to maximise their asset lives
– Integrating intermittency into constraints
– Work with others to optimise renewable value • Storage - hydro, chemical and thermal
• Equipment manufacturers
29
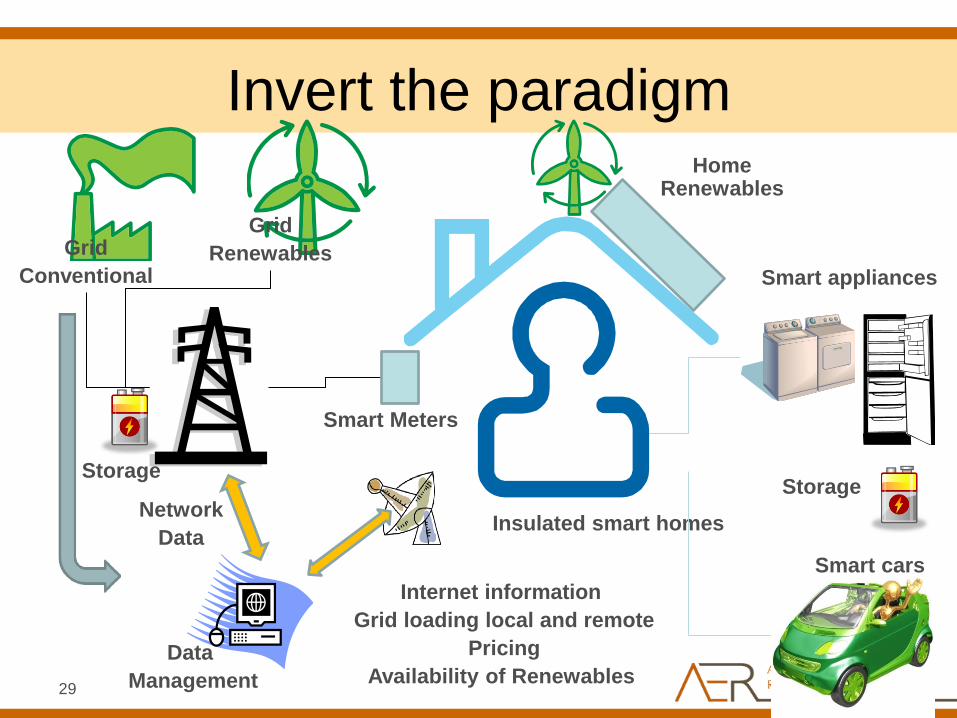
Invert the paradigm
Smart appliances
Smart cars
Network
Data
Home Renewables
Insulated smart homes
Smart Meters
Data
Management
Grid
Renewables Grid
Conventional
Internet information
Grid loading local and remote
Pricing
Availability of Renewables
Storage Storage
30
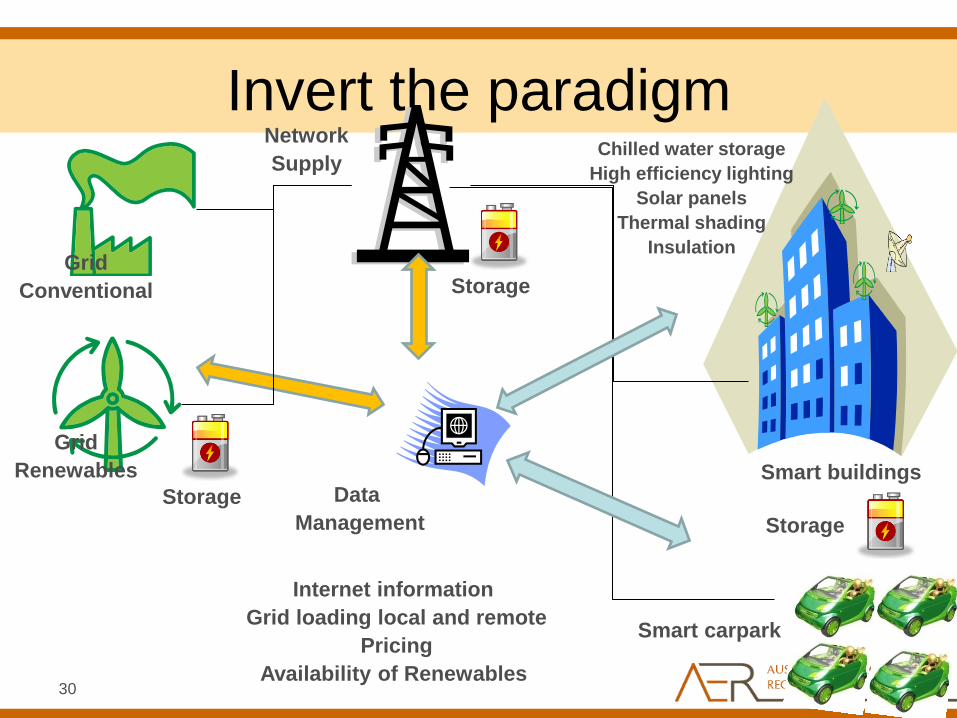
Invert the paradigm
Smart carpark
Network
Supply
Data
Management
Grid
Renewables
Grid
Conventional
Internet information
Grid loading local and remote
Pricing
Availability of Renewables
Smart buildings
Chilled water storage
High efficiency lighting
Solar panels
Thermal shading
Insulation
Storage
Storage
Storage
31
Thank You


![[Terry Nardin] the Philosophy of Michael Oakeshott(Bookos.org)](https://img.pdfslide.net/doc/110x75/5460c5f8b1af9f04598b55d2/terry-nardin-the-philosophy-of-michael-oakeshottbookosorg.jpg)


![[Scherma] - Ewart Oakeshott - Sword in the Age of Chivalry](https://img.pdfslide.net/doc/110x75/55cf9bf4550346d033a800d4/scherma-ewart-oakeshott-sword-in-the-age-of-chivalry.jpg)


![Ser Conservador [Michael Oakeshott]](https://img.pdfslide.net/doc/110x75/568bd9701a28ab2034a711aa/ser-conservador-michael-oakeshott.jpg)


![INGLES- OAKESHOTT Hobbes on Civil Association [1975].pdf](https://img.pdfslide.net/doc/110x75/577cdadc1a28ab9e78a6ba63/ingles-oakeshott-hobbes-on-civil-association-1975pdf.jpg)

