Embed Size (px)
Citation preview

Sponsored by
Machinery Manufacturing Research Report

Sponsored by
The Current State of America’s Machinery Manufacturing Market
MASHBURN REPORT
January 2015
Machinery Manufacturing Research Report 1

About the AuthorLee Mashburn is an accomplished business-to-business marketing and product management executive who has helped companies like SAP, SSA Global, and Honeywell to transform and grow into market leadership positions.
Currently, Lee is Vice president of Global Marketing for Spinnaker Support, a leading provider of third-party maintenance and managed services for SAP and Oracle software applications.
Lee has captained numerous corporate-wide strategic and marketing planning processes. Leveraging available market research data, Lee and his teams have astutely analyzed to uncover the optimal market targets to attack.
Lee has developed his “Mashburn Report” series in order to provide a more insightful and cost-effective product for business professionals and investors who wish to supplement the market data they have traditionally used - in order to make more informed, confident, and timely business decisions.
The Mashburn Reports are available for:‣ Durable Goods Manufacturing Overview Report‣ Primary Metals Manufacturing‣ Fabricated Metals Manufacturing‣ Machinery Manufacturing‣ Computer & Electronic Product Manufacturing‣ Electrical Equipment Manufacturing‣ Transportation Equipment Manufacturing
‣ Nondurable Goods Manufacturing Overview Report‣ Food Product Manufacturing‣ Beverage & Tobacco Product Manufacturing‣ Paper Product Manufacturing‣ Petroleum & Coal Product Manufacturing‣ Chemical Product Manufacturing‣ Plastics & Rubber Product Manufacturing
Machinery Manufacturing Research Report 2
Machinery Manufacturing Research Report 3
Introduction
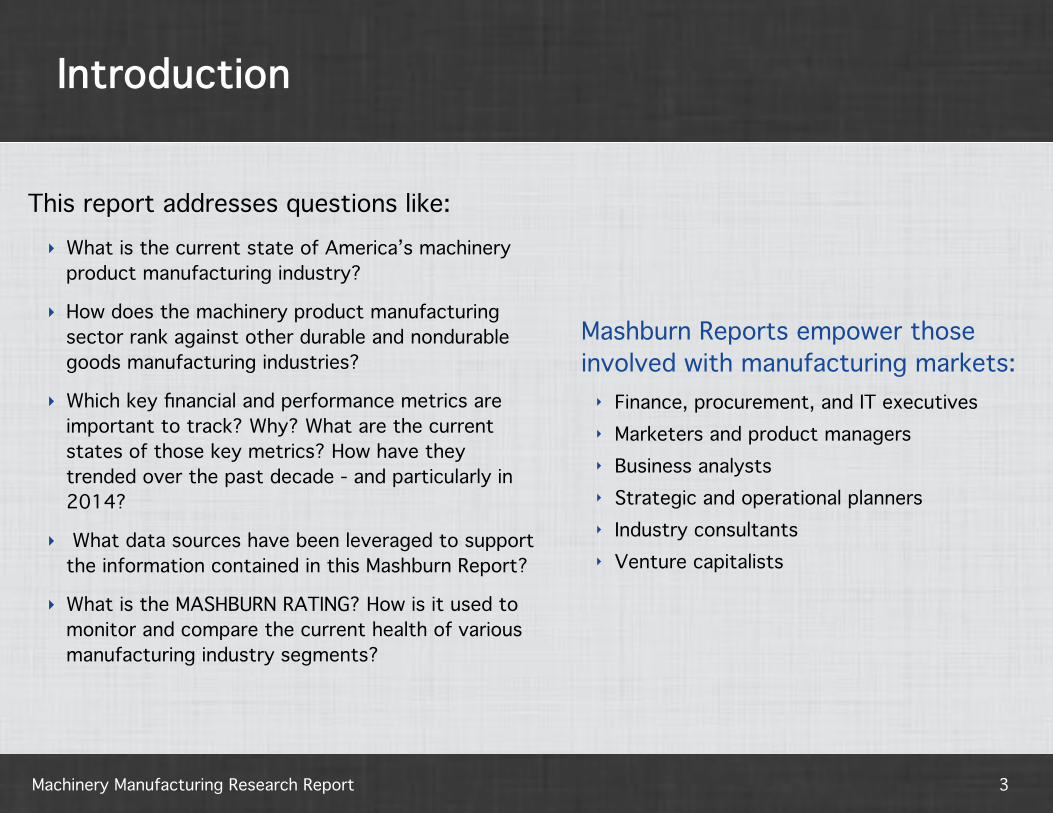
This report addresses questions like:‣ What is the current state of America’s machinery
product manufacturing industry?
‣ How does the machinery product manufacturing sector rank against other durable and nondurable goods manufacturing industries?
‣ Which key financial and performance metrics are important to track? Why? What are the current states of those key metrics? How have they trended over the past decade - and particularly in 2014?
‣ What data sources have been leveraged to support the information contained in this Mashburn Report?
‣ What is the MASHBURN RATING? How is it used to monitor and compare the current health of various manufacturing industry segments?
Mashburn Reports empower those involved with manufacturing markets:‣ Finance, procurement, and IT executives‣ Marketers and product managers‣ Business analysts‣ Strategic and operational planners‣ Industry consultants‣ Venture capitalists

Machinery Manufacturing Research Report 4
WHOLESALE TRADE RETAIL TRADEMANUFACTURING
Merchant, Durable Goods•Motor Vehicles, Parts, & Supplies•Furniture & Home Furnishing•Lumber & Construction Materials•Pro & Commercial Equipment•Metal & Mineral•Household Appliances & Electronics•Hardware, Plumbing, & Heating•Machinery Equipment & Supplies•Miscellaneous
Merchant, Nondurable Goods• Paper & Paper Products• Drugs, Druggists, Sundries• Apparel, Piece Goods, Notions• Grocery & Related Products• Farm Product Raw Material• Chemical & Allied Products• Petroleum, Petroleum Products• Alcoholic Beverage• Miscellaneous
Wholesale, Electronic Market•Business-to-Business•Trade Agents & Brokers
Durable Goods•Wood•Nonmetallic Mineral•Primary Metals•Fabricated Metals
•Machinery•Computer & Electronics•Electric Equipment, Appliances•Transportation•Furniture•Miscellaneous
In-Store•Motor Vehicles, Parts, & Supplies•Furniture & Home Furnishing•Electronics & Appliances•Building & Garden Equipment•Food & Beverage•Health & Personal Care•Gasoline Stations•Clothing & Clothing Accessories•Sporting Goods, Hobbies, Games•General Merchandise•Miscellaneous
Non-Store•Electronic Shopping•Mail Order Houses•Vending Machine Operators•Direct Selling Fuel Dealers
Nondurable Goods•Food•Beverage & Tobacco•Textile Mills & Products•Apparel•Leather•Paper•Printing•Petroleum & Coal•Chemical•Plastics & Rubber

Sample of Data Sources
‣Manufacturers’ Shipments, Inventories, and Orders (M3)
‣Quarterly Financial Report (QFR)
‣Employment Situation Report
‣Job Openings and Labor Turnover
‣Producer Price Index
‣Consumer Price Index
‣Labor Productivity and Cost
‣ Import/Export Price Index
‣Gross Domestic Product
‣Personal income
‣ Industrial Production
‣Capacity Utilization
Machinery Manufacturing Research Report 5
Performance Indicators Tracked
Machinery Manufacturing Research Report 6
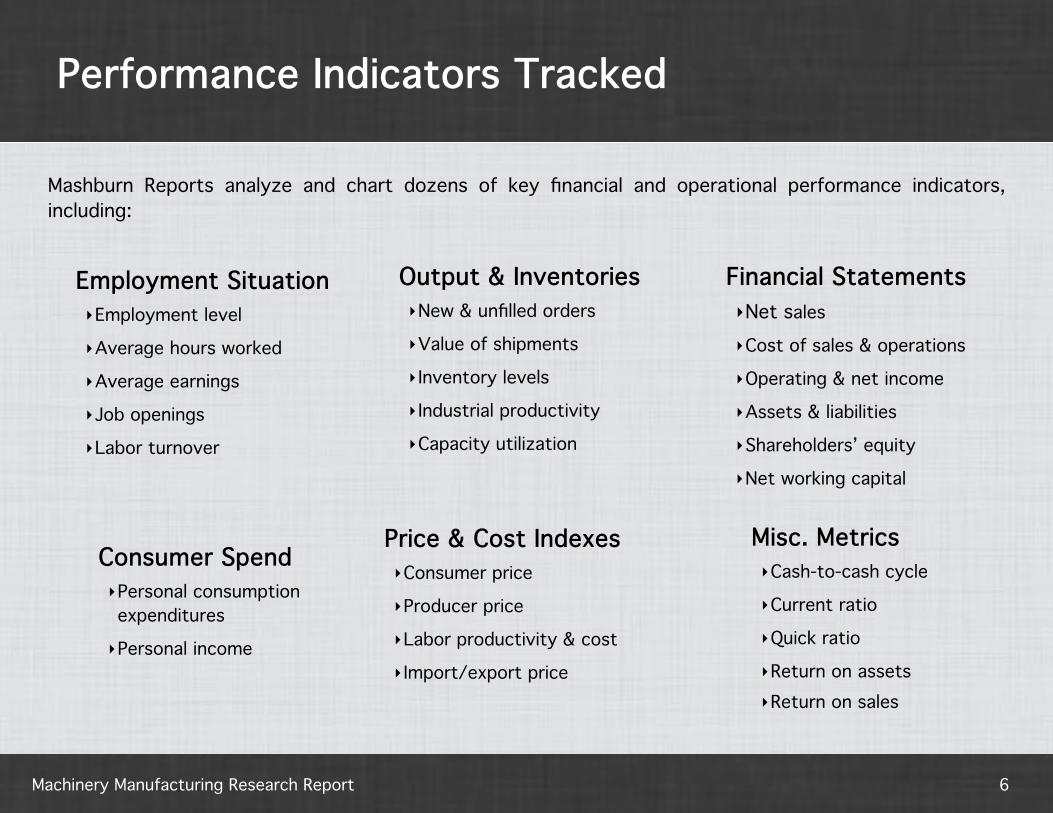
Mashburn Reports analyze and chart dozens of key financial and operational performance indicators, including:
Employment Situation‣Employment level
‣Average hours worked
‣Average earnings
‣Job openings
‣Labor turnover
Consumer Spend‣Personal consumption expenditures
‣Personal income
Output & Inventories‣New & unfilled orders
‣Value of shipments
‣ Inventory levels
‣ Industrial productivity
‣Capacity utilization
Financial Statements‣Net sales
‣Cost of sales & operations
‣Operating & net income
‣Assets & liabilities
‣Shareholders’ equity
‣Net working capital
Price & Cost Indexes‣Consumer price
‣Producer price
‣Labor productivity & cost
‣ Import/export price
Misc. Metrics‣Cash-to-cash cycle
‣Current ratio
‣Quick ratio
‣Return on assets‣Return on sales

Sponsored by
Brief Overview of America’s Manufacturing Market
MASHBURN REPORT
January 2015
Machinery Manufacturing Research Report 7

America’s Manufacturing Market Size, 2014
Machinery Manufacturing Research Report 8
Durable Goods48.3%
Nondurable Goods48.3%
By Value of Shipmentsper the M3 report
$5.98 trillion2.5% y-o-y growth
Durable Goods47.8%
Nondurable Goods52.2%
By Total Salesper the QFR report
$6.90 trillion2.7% y-o-y growth
By Employee Levelper the BLS employment report
12.24 million1.5% y-o-y growth
Durable Goods63.4%
Nondurable Goods36.6%

Sub-market NAICS2014 Shareper value of shipments
Key words
Wood Products 321 3.3% sawmills, veneer, truss, wood containers, pre-fab
Nonmetallic Mineral Products 327 3.7% clay, pottery, glass, cement, gypsum
Primary Metals 331 11.2% iron and steel mills, aluminum, foundries
Fabricated Metal Products 332 12.4% forging, stamping, cutlery, hand tools, boilers, tanks
Machinery 333 15.0% agriculture, mining, industrial
Computer & Electronic Products 334 12.0% computer, peripheral, communications, audio, video
Electrical Equipment & Appliances 335 4.3% lighting, household appliance, electrical equipment
Transportation 336 29.5% motor vehicle and parts, aerospace, railroad, ships
Furniture & Related Products 337 2.4% household and office furniture, kitchen cabinets, window treatments
Miscellaneous 339 6.1% medical equipment and supplies, jewelry, silverware, sporting goods
Durable Goods Manufacturing Market
Machinery Manufacturing Research Report 9
Durable goods are products designed to last at least three years; bigger ticket items like automobiles, televisions, and refrigerators. These products account for roughly 15% of consumer spending.
Nondurable Goods Manufacturing Market
Machinery Manufacturing Research Report 10
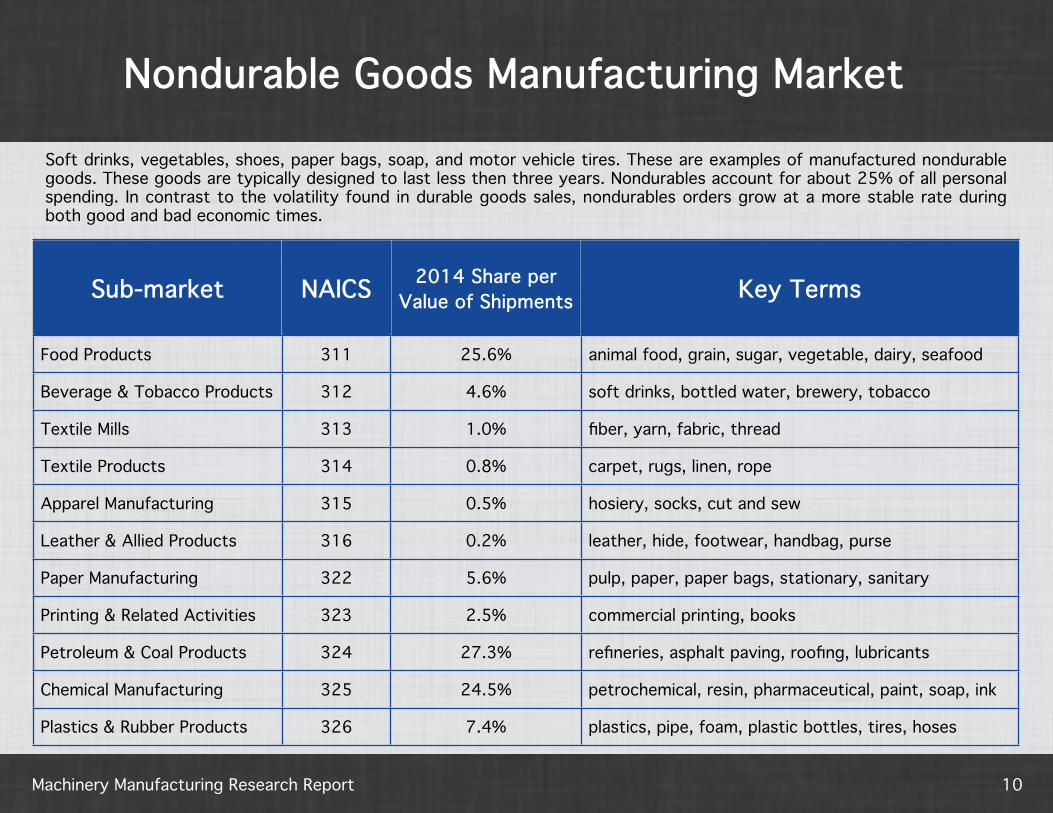
Soft drinks, vegetables, shoes, paper bags, soap, and motor vehicle tires. These are examples of manufactured nondurable goods. These goods are typically designed to last less then three years. Nondurables account for about 25% of all personal spending. In contrast to the volatility found in durable goods sales, nondurables orders grow at a more stable rate during both good and bad economic times.
Sub-market NAICS 2014 Share per Value of Shipments Key Terms
Food Products 311 25.6% animal food, grain, sugar, vegetable, dairy, seafood
Beverage & Tobacco Products 312 4.6% soft drinks, bottled water, brewery, tobacco
Textile Mills 313 1.0% fiber, yarn, fabric, thread
Textile Products 314 0.8% carpet, rugs, linen, rope
Apparel Manufacturing 315 0.5% hosiery, socks, cut and sew
Leather & Allied Products 316 0.2% leather, hide, footwear, handbag, purse
Paper Manufacturing 322 5.6% pulp, paper, paper bags, stationary, sanitary
Printing & Related Activities 323 2.5% commercial printing, books
Petroleum & Coal Products 324 27.3% refineries, asphalt paving, roofing, lubricants
Chemical Manufacturing 325 24.5% petrochemical, resin, pharmaceutical, paint, soap, ink
Plastics & Rubber Products 326 7.4% plastics, pipe, foam, plastic bottles, tires, hoses
Machinery Manufacturing Research Report
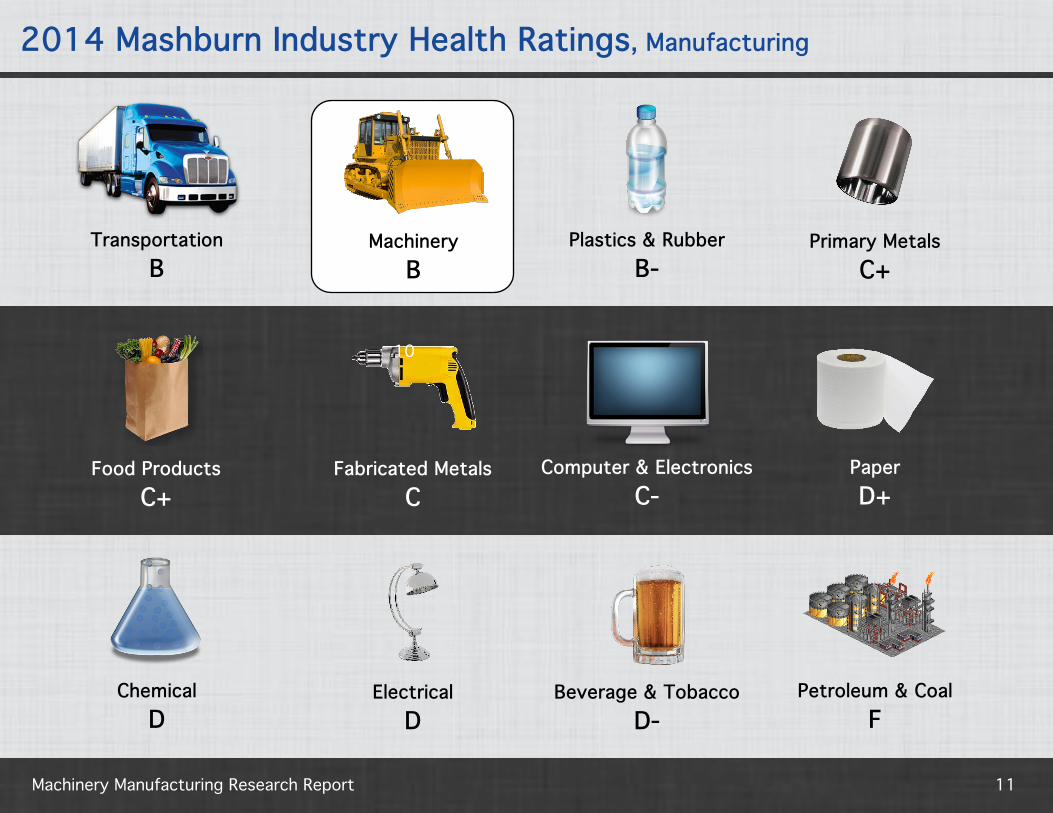
TransportationB
MachineryB
Primary MetalsC+
Plastics & RubberB-
Food ProductsC+
Fabricated MetalsC
Computer & ElectronicsC-
PaperD+
ChemicalD
ElectricalD
Petroleum & CoalF
Beverage & TobaccoD-
2014 Mashburn Industry Health Ratings, Manufacturing
10
11
Machinery Manufacturing Research Report
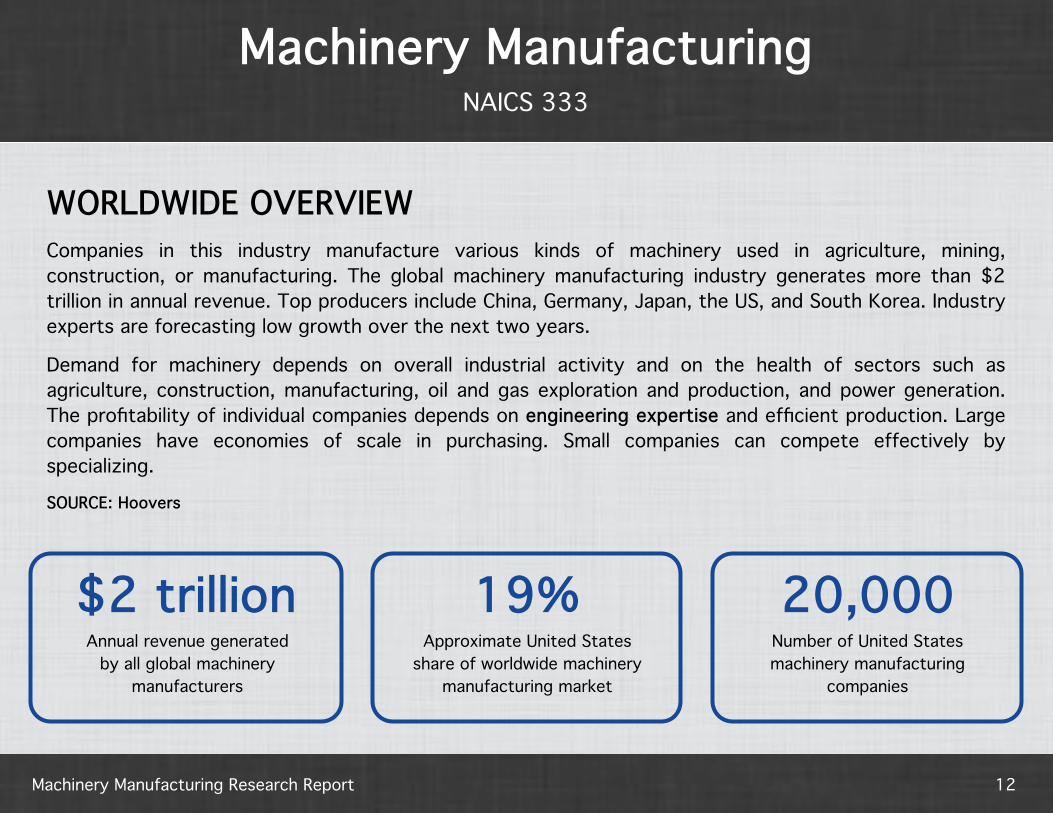
Machinery ManufacturingNAICS 333
WORLDWIDE OVERVIEWCompanies in this industry manufacture various kinds of machinery used in agriculture, mining, construction, or manufacturing. The global machinery manufacturing industry generates more than $2 trillion in annual revenue. Top producers include China, Germany, Japan, the US, and South Korea. Industry experts are forecasting low growth over the next two years.
Demand for machinery depends on overall industrial activity and on the health of sectors such as agriculture, construction, manufacturing, oil and gas exploration and production, and power generation. The profitability of individual companies depends on engineering expertise and efficient production. Large companies have economies of scale in purchasing. Small companies can compete effectively by specializing.
SOURCE: Hoovers
$2 trillionAnnual revenue generated
by all global machinery manufacturers
19%Approximate United States
share of worldwide machinery manufacturing market
20,000Number of United States machinery manufacturing
companies
12
Machinery Manufacturing Research Report
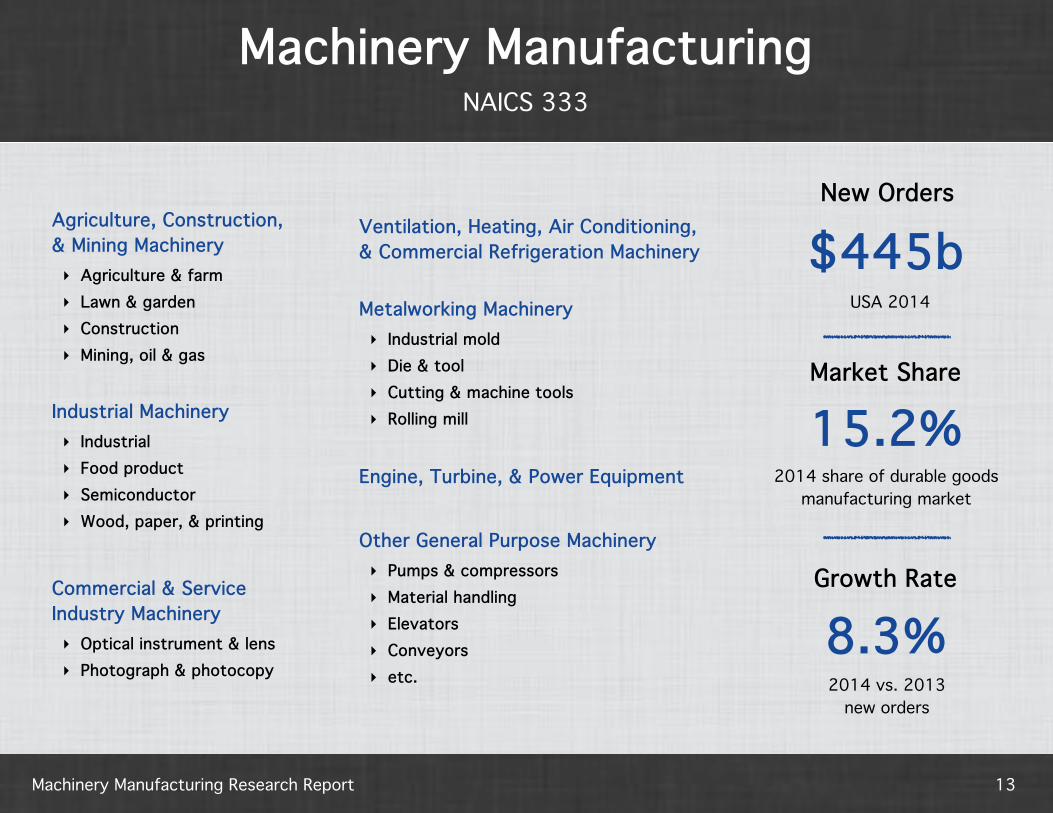
Machinery ManufacturingNAICS 333
Agriculture, Construction, & Mining Machinery‣ Agriculture & farm‣ Lawn & garden‣ Construction‣ Mining, oil & gas
Industrial Machinery‣ Industrial‣ Food product‣ Semiconductor‣ Wood, paper, & printing
Commercial & Service Industry Machinery‣ Optical instrument & lens‣ Photograph & photocopy
Ventilation, Heating, Air Conditioning, & Commercial Refrigeration Machinery
Engine, Turbine, & Power Equipment
Metalworking Machinery‣ Industrial mold‣ Die & tool‣ Cutting & machine tools‣ Rolling mill
Other General Purpose Machinery‣ Pumps & compressors‣ Material handling‣ Elevators‣ Conveyors‣ etc.
8.3%
$445bUSA 2014
15.2%2014 share of durable goods
manufacturing market
2014 vs. 2013new orders
New Orders
Market Share
Growth Rate
13

Machinery Manufacturing Research Report 14
Machinery ManufacturingNAICS 333
All Other Machinery!
Industrial!
Construction!
Power Transmission!
Ventilation, Heating, & Air!
Metalworking!
Material Handling!
Mining, Oil, & Gas!
Farm!
Relative share of machinery manufacturing market by value of 2014 shipments

15
Industry Health Dashboard Key
-18.7% 10.1%
Operating Profit Growth Rate
Performance MetricCurrent Health Status
Trend Indicator and Last Reported Value
10-year High10-year Low
Grade F D C B A
recent trend is neutral
recent trend is positive
recent trend is negative
Machinery Manufacturing Research Report

Machinery Manufacturing Research Report 16
Machinery ManufacturingMashburn Ranking: 2/12
B 84%
-18.7% 10.1%
Operating Profit Growth Rate
1.16 1.55
Net Working Capital Ratio
0.74 1.11
Quick Ratio
2.1% 12.7%
Return on Sales
96.2 73.9
Cash Conversion Cycle
0.8% 6.2%
Return on Assets
74 111
Industrial Production
62% 83%
Capacity Utilization

Machinery Manufacturing Research Report 17
Machinery ManufacturingMashburn Ranking: 2/12
B 84%
$227k $383k
Value of Shipment per Employee
$43.2k $57.3k
Average Annual Employee Earnings
0.98 1.03
Export/Import Ratio
$219k $393k
Total Sales per Employee
2.16 1.66
Inventory to Shipment Ratio
100 131
Producer Price Index
975m 1,198m
Employment Level
Unfilled Order to Shipment Ratio
2.22 4.60

Machinery Manufacturing Research Report 18
Raw data extracted from the Sept 2014 Quarterly Financial Report, produced by the U.S. Census Bureau
Machinery Manufacturing USA
Financial StatementsKey Takeaways
The U.S. Census Bureau collects and publishes quarterly aggregate statistics on the financial results and position of U.S. machinery manufacturers - via a report entitled Quarterly Financial Report (QFR). The QFR provides insight into industry health and exposes trends that are useful for benchmarking the performance of individual manufacturers.
The U.S. machinery manufacturing industry grew sales by only 0.6% in 2014 but yielded a 9.3% operating profit. Net profit margin before taxes increased slightly from 2013 - primarily due to a jump in non-operating income.
The industry aggregate balance sheet is strong except for a couple of red flags. Total cash and securities on hand have decreased from 2013. Inventory expanded, which negatively impacted the quick ratio. Stockholder equity was essentially flat year-over-year.
From 2013, the net working capital ratio is stronger, debt has been reduced, and return on assets are improving.

Machinery Manufacturing Research Report 19
Machinery ManufacturingEmployment Situation, Index Comparison
Jan 2006 to Dec 2014+3.1%
-0.4%CAGR since Dec ’05
+0.1%
Employee Level
Weekly Hours
Hourly Earnings
CAGR since Dec ’05
CAGR since Dec ’05
Emp Level! Hourly Earnings! Weekly Hours!

Machinery Manufacturing Research Report 20
Machinery ManufacturingM3 Report
25,000!
27,000!
29,000!
31,000!
33,000!
35,000!
37,000!
39,000!
USD,
in m
illion
s!
New Orders!
Jan 2012 to Dec 2014
25,000!
27,000!
29,000!
31,000!
33,000!
35,000!
37,000!
39,000!
USD,
in m
illion
s!
Value of Shipments!
85,000!
90,000!
95,000!
100,000!
105,000!
110,000!
115,000!
120,000!
125,000!
USD,
in m
illion
s!
Unfilled Orders!
60,000!
62,000!
64,000!
66,000!
68,000!
USD,
in m
illion
s!
Total Inventories!
Jan 2012 to Dec 2014
Jan 2012 to Dec 2014 Jan 2012 to Dec 2014

Machinery Manufacturing Research Report 21
Machinery ManufacturingIncome State, Index Comparison
Mar 2006 to Sep 2014+7.6%
+3.4%CAGR since Dec ’05
+6.0%
Net Sales
Op Income
Net Income
CAGR since Dec ’05
CAGR since Dec ’05
Net Sales! Op Income! Net Income!
Machinery Manufacturing Research Report 22
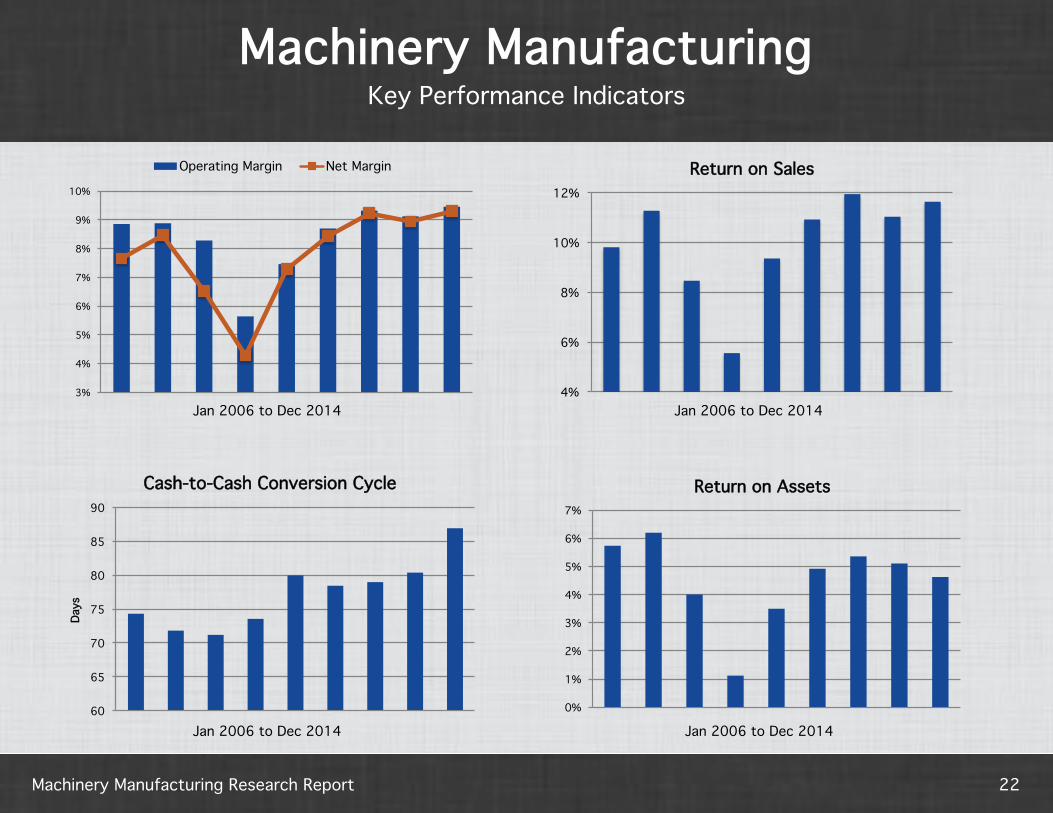
Machinery ManufacturingKey Performance Indicators
3%!
4%!
5%!
6%!
7%!
8%!
9%!
10%!
Operating Margin! Net Margin!
Jan 2006 to Dec 20144%!
6%!
8%!
10%!
12%!Return on Sales!
Jan 2006 to Dec 2014
60!
65!
70!
75!
80!
85!
90!
Days
!
Cash-to-Cash Conversion Cycle!
Jan 2006 to Dec 20140%!
1%!
2%!
3%!
4%!
5%!
6%!
7%!
Return on Assets!
Jan 2006 to Dec 2014
Machinery Manufacturing Research Report 23
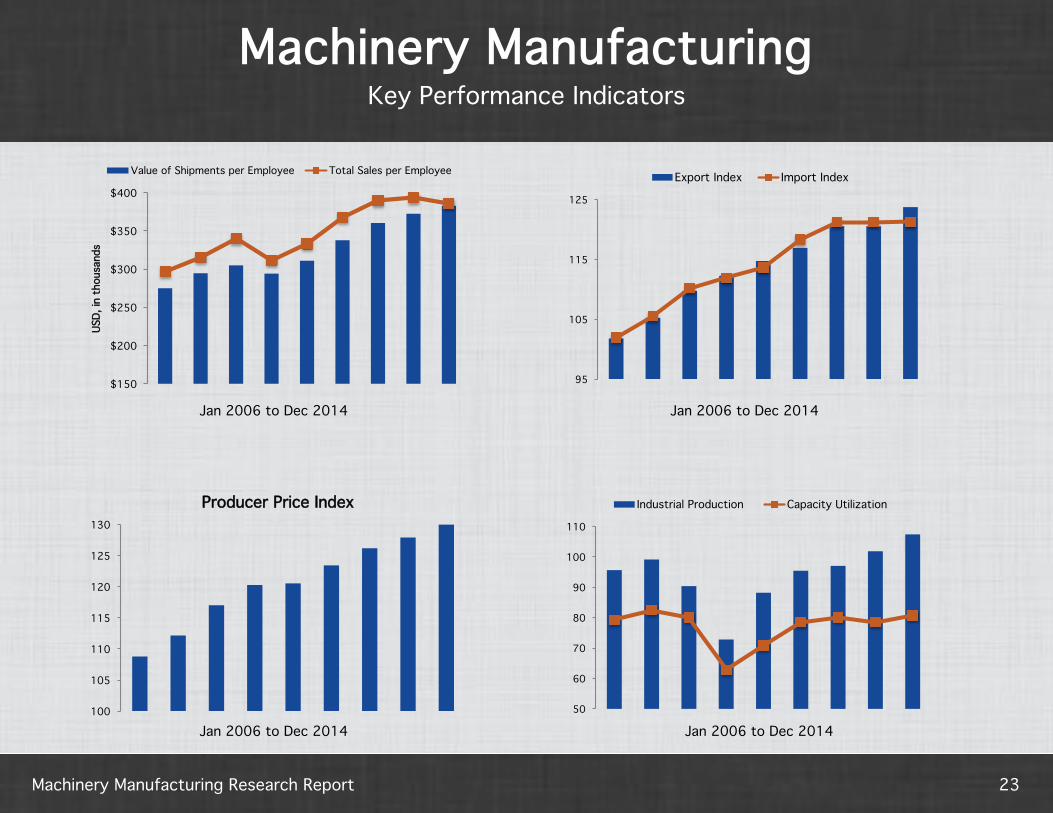
Machinery ManufacturingKey Performance Indicators
$150!
$200!
$250!
$300!
$350!
$400!
USD,
in th
ousa
nds!
Value of Shipments per Employee! Total Sales per Employee!
Jan 2006 to Dec 2014 Jan 2006 to Dec 2014
95!
105!
115!
125!
Export Index! Import Index!
100!
105!
110!
115!
120!
125!
130!
Producer Price Index!
Jan 2006 to Dec 201450!
60!
70!
80!
90!
100!
110!
Industrial Production! Capacity Utilization!
Jan 2006 to Dec 2014

Machinery Manufacturing Research Report
ABOUT SPINNAKER SUPPORTSpinnaker Support delivers third-party maintenance, managed services, and consulting for organizations that use SAP and/or Oracle enterprise software applications. Over 400 global clients depend on Spinnaker Support services to help reduce IT and other costs, boost operational and financial performance, and to ensure productive enterprise software applications that stay aligned with business objectives. A small sampling of our machinery manufacturing clients is displayed below.
24

APPENDIX
25Machinery Manufacturing Research Report

26
Metric DefinitionsOperating income: equals sales (or revenue) minus cost of goods sold, labor, and other day-to-day expenses.
Operating margin: a measure of profitability. It indicates how much of each dollar of revenues is left over after both costs of goods sold and operating expenses are considered. Calculated as, Operating Margin = Operating income / Sales
Return on sales: a metric used to evaluate a company’s operational efficiency; provides insight into how much profit is being produced per dollar of sales. Calculated as Net Income before Taxes divided by Net Sales.
Working capital: a measure of both a company’s efficiency and its short-term financial health. Calculated as Current Assets minus Current Liabilities.
Working capital ratio : indicates whether a company has enough short-term assets to cover its short-term debt. Calculated as Current Assets divided by Current Liabilities. Anything below 1 indicates negative W/C (working capital). While anything over 2 means that the company is not investing excess assets. Most believe that a ratio between 1.2 and 2.0 is sufficient.
Quick ratio: measures a company’s ability to meet its short-term obligations with its most liquid assets. The higher the quick
ratio, the better the company's liquidity position. Calculated as (Current Assets minus Inventories) divided by Current Liabilities.
Cash conversion cycle: a financial metric that measures the length of time required for a company to convert cash invested in its operations to cash received as a result of its operations. Calculated as (Average inventory processing period plus average receivables collection period) minus average payables payment period.
Inventory to shipment ratio: a key measure of the time, in months, that would be required to exhaust inventories if shipments were to remain at their current level.
Return on assets: the ratio of annual net income to average total assets of a business during a financial year. It is a profitability ratio.
Industrial production index: measures the amount of output from the manufacturing, mining, electric and gas industries. The reference year for the index is 2002 and a level of 100. If the IPI is growing month-over-month for a particular industry, this is a sign that the companies in the industry are performing well.
Capacity utilization: Extent or level to which the productive capacity of a plant, firm, or country is being used in generation of goods and services.
Producer price index: measures the average change over time in the selling prices received by domestic producers for their output.
Export and Import Price Index: Indexes that monitor the prices of goods purchased out of the country but produced in the U.S. (exports) and the prices of goods purchased in the U.S. but produced outside of U.S. (imports).
Machinery Manufacturing Research Report

The purpose of the Manufacturers' Shipments, Inventories, and Orders (M3) survey is to provide broad-based monthly statistical data on current economic conditions and indications of future production commitments in the manufacturing sector. The Manufacturers’ Shipments, Inventories, and Orders (M3) Report is released in two stages each month. An advance report, for just durable goods manufacturing, is available about 18 working days after each reporting month. Durable goods, by definition, are products that last for three or more years such as aircraft, automobiles, machinery, and computers. The full M3 report follows about 5 working days later.The M3 is among the most anticipated reports released each month, particularly the advance durable goods portion. It contains nuggets (like new orders for factory goods figures) that provide clues about what might occur in the future. An increase in new orders signals production that will take place in the months ahead, keeping factories and employees busy to satisfy customer demand. A persistent decline in new orders can lead to factory slowdowns, possible employee layoffs, or even build-up of excess inventory. The M3 is based upon data reported from manufacturing establishments with $500 million or more in annual shipments. Units may be divisions of diversified large companies, large homogenous companies, or single-unit manufacturers in 89 industry categories. Survey respondents report four different data sets:
• Value of shipments - Products that have been ordered that are now being delivered. Shipments are a good measure of what’s going on in the economy right now, and this figure is used to help calculate GDP. Calculated after factoring out discounts and before freight charges and excise taxes are added.
• New orders - Qualifies for M3 report if the new order comes with a legally binding agreement to purchase a product for immediate or future delivery.
• Unfilled orders - A favorite measure for economists in that a backlog of unfilled orders typically means that factories will stay busy going forward and can suggest an increase in new jobs and greater spending on capital equipment that factories need to boost output. However, there can be negative consequences to a backlog of unfilled orders as well.
• Total inventories - The M3 report considers all stages of inventory at current cost or market value.
New durable goods orders reflect the very latest demand for U.S.-made products across the world. The volume of new orders can swing dramatically from month to month, primarily due to large transportation or defense orders. A single large military or aircraft order can inflate total new orders and can mislead analysts about the economy’s underlying strength. This is precisely why the Census Bureau reports new orders in total, total excluding transportation orders, and total excluding defense orders.
27
What is the M3 Report?
Machinery Manufacturing Research Report
28
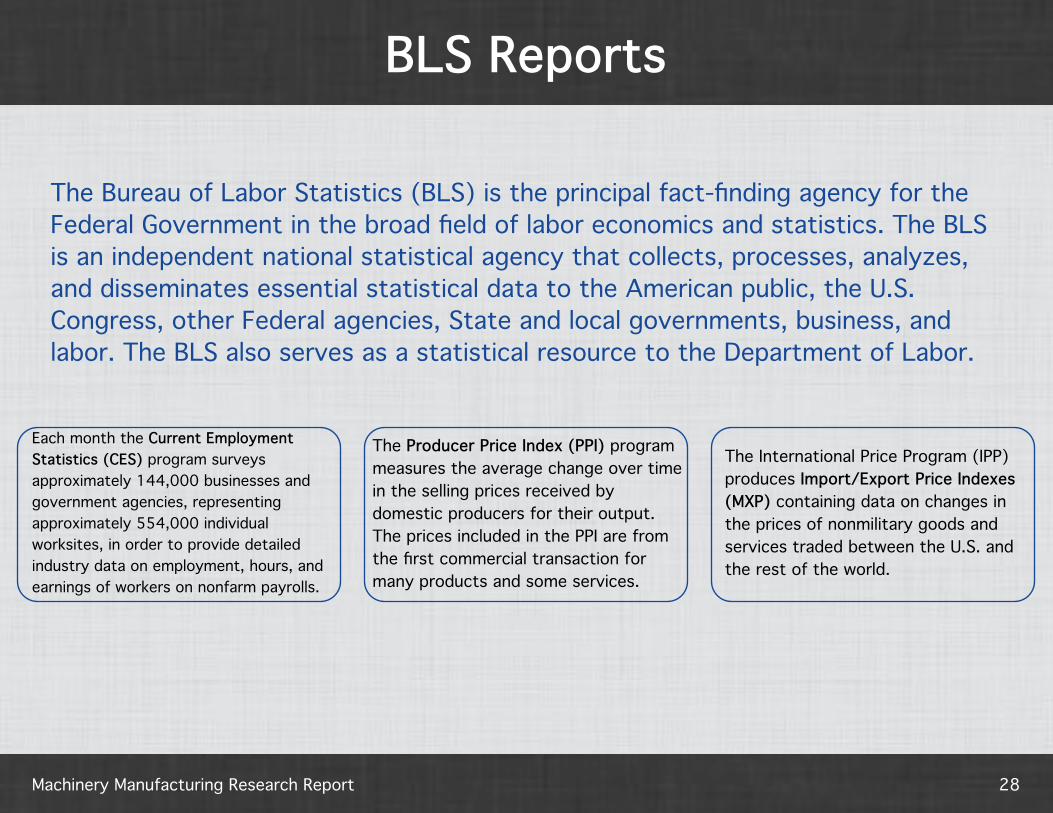
BLS Reports
The Bureau of Labor Statistics (BLS) is the principal fact-finding agency for the Federal Government in the broad field of labor economics and statistics. The BLS is an independent national statistical agency that collects, processes, analyzes, and disseminates essential statistical data to the American public, the U.S. Congress, other Federal agencies, State and local governments, business, and labor. The BLS also serves as a statistical resource to the Department of Labor.
Each month the Current Employment Statistics (CES) program surveys approximately 144,000 businesses and government agencies, representing approximately 554,000 individual worksites, in order to provide detailed industry data on employment, hours, and earnings of workers on nonfarm payrolls.
The Producer Price Index (PPI) program measures the average change over time in the selling prices received by domestic producers for their output. The prices included in the PPI are from the first commercial transaction for many products and some services.
The International Price Program (IPP) produces Import/Export Price Indexes (MXP) containing data on changes in the prices of nonmilitary goods and services traded between the U.S. and the rest of the world.
Machinery Manufacturing Research Report