Embed Size (px)
Citation preview
Does Insurance Improve Resilience?
Research: Jennifer Denno Cissé Presented by: Joanna Upton
Academic Workshop on Mobile Pastoralism, Index Insurance, Computational Sustainability and Policy Innovations for the ASALs of
East Africa
June 10, 2015

Outline• Background on Development
Resilience
• Data
• Insurance and Household Resilience
• Insurance and Aggregate Resilience
• Conclusion
Intro/Background Data Identification Aggregation Conclusion
Introduction

Barrett & Constas (2014)• Proposes a theoretical framework
for “development resilience”
• Implications for measurement:Recommends a moments-based, probabilistic approach
Intro/Background Data Identification Aggregation Conclusion
Development Resilience

Cissé & Barrett (in production)• Empirical implementation of B&C
theory of development resilience
• Builds on poverty measurement, poverty dynamics, poverty traps, and vulnerability literatures
• Resilient = a high probability of maintaining acceptable level of well-being
Intro/Background Data Identification Aggregation Conclusion
Development Resilience

Insurance & Resilience• Use a development resilience
approach to evaluate impact of IBLI on well-being
• Explore household-level impacts of insurance
• Construct aggregable FGT-type measure to explore resilience by subgroup
Intro/Background Data Identification Aggregation Conclusion
Contribution

Data
Intro/Background Data Identification Aggregation Conclusion
IBLI• 5 rounds of panel data
(Marsabit)
• 800+ households
• HH demographics, livestock accounting, income, consumption
• 2011 drought (before R3)

Data
Intro/Background Data Identification Aggregation Conclusion
Constructed Variable• Shock (drought dummy) = 1 if
predicted livestock mortality > 15%
Instrumental Variables
• Insurance Coupon
• Coupon * Predicted Livestock
Data
Intro/Background Data Identification Aggregation Conclusion
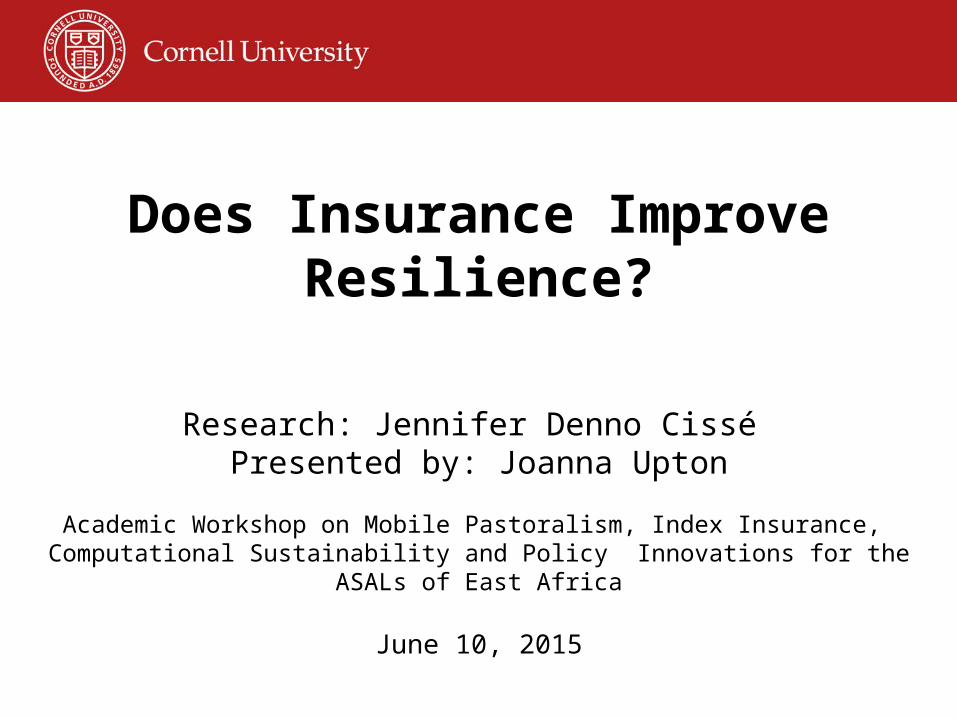
Outcome Variables
• Mid-Upper Arm Circumference (MUAC) in cm
• Tropical Livestock Units (TLU):1 TLU = 1 cow, 0.7 camel, 10 sheep, or 10 goats
Data
Intro/Background Data Identification Aggregation Conclusion
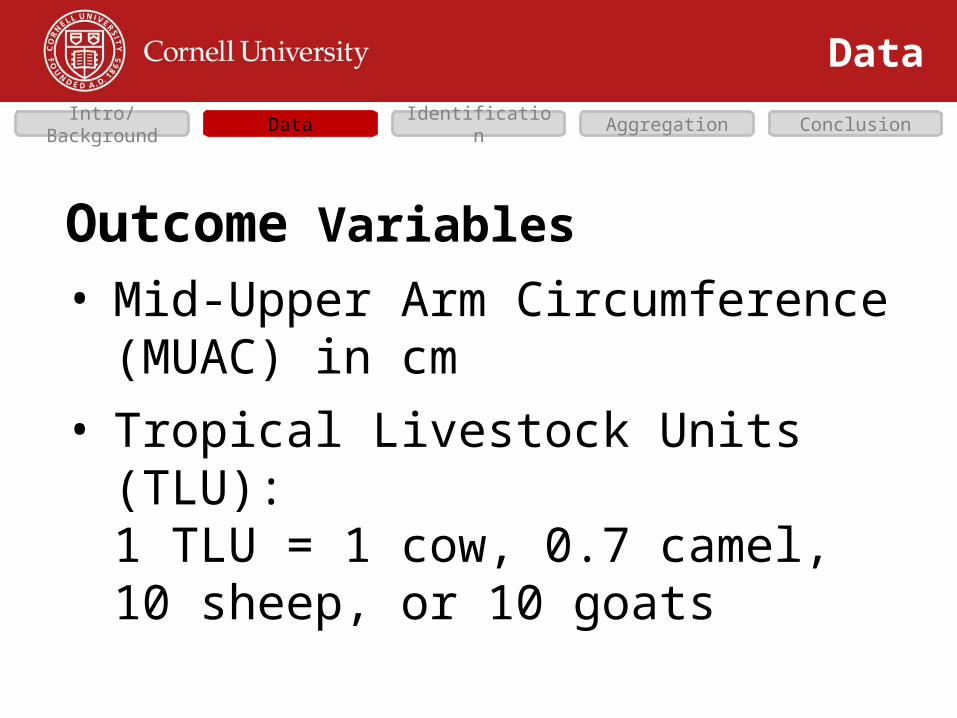
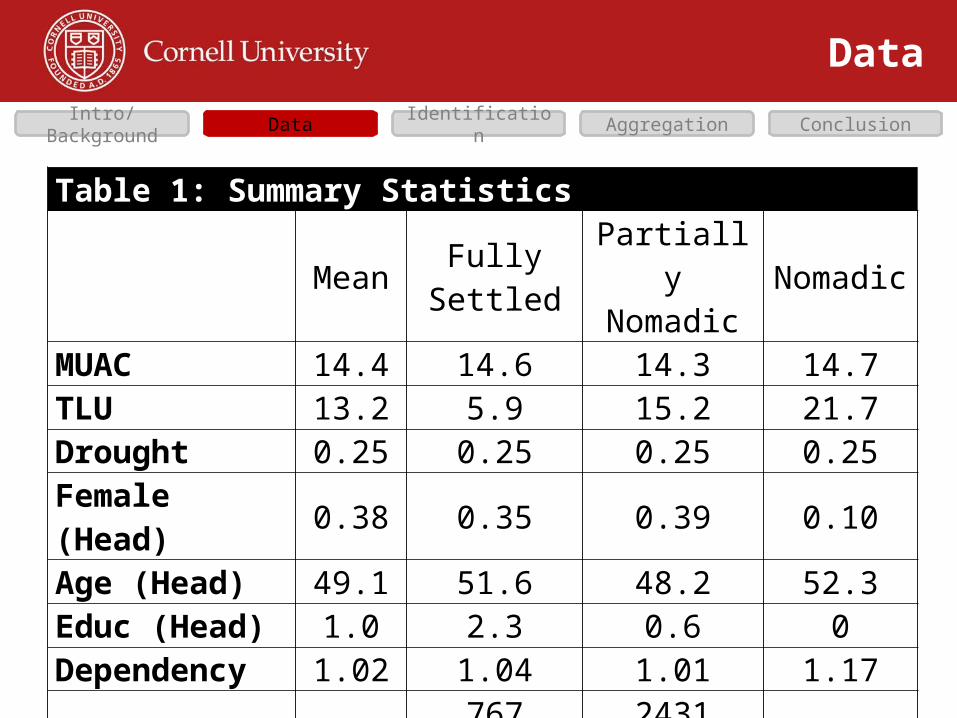
Table 1: Summary Statistics
Mean FullySettled
PartiallyNomadic Nomadic
MUAC 14.4 14.6 14.3 14.7TLU 13.2 5.9 15.2 21.7Drought 0.25 0.25 0.25 0.25Female (Head) 0.38 0.35 0.39 0.10Age (Head) 49.1 51.6 48.2 52.3Educ (Head) 1.0 2.3 0.6 0Dependency 1.02 1.04 1.01 1.17
N 3278 767 (23%) 2431 (74%) 80 (2%)Rounds 4 4 4 4

Impact of Insurance
Data Identification Aggregation ConclusionIntro/Background
2SLS model for well-being
With well-being () a function of lagged (here cubic polynomial), shocks (), insurance holdings (), interaction term (), HH characteristics (), & a disturbance ().

Impact of Insurance
Data Identification Aggregation ConclusionIntro/Background
Following Antle (1986)
Parameters for our distribution

Data Identification Aggregation ConclusionIntro/Background
Impact of Insurance
Table 2: Pooled 2SLS Estimates of Well-being (A) (B) (D) (E)
VARIABLES TLU V(TLU) MUAC V(MUAC)W_lag 0.970*** 10.19*** -6.227** -0.936
W_lag2 -0.00383** -0.0728 0.444** 0.00559W_lag3 7.04e-06 0.000786*** -0.00981** 0.00138Shock -5.613*** -1.664e-30 -0.192* -0.477**
Insured TLU 0.424 1.026e-29 0.202* -0.184Shock*Insrd 2.429 -5.250e-30 -0.0616 0.599**
Path dynamics of well-being.Negative Impact of Shocks.No impact of insurance or interaction on TLU well-being. Slight impact on MUAC well-being.
Mixed impacts on variance. Appears to be some heteroskedasticity.
Data Identification Aggregation ConclusionIntro/Background
Identification
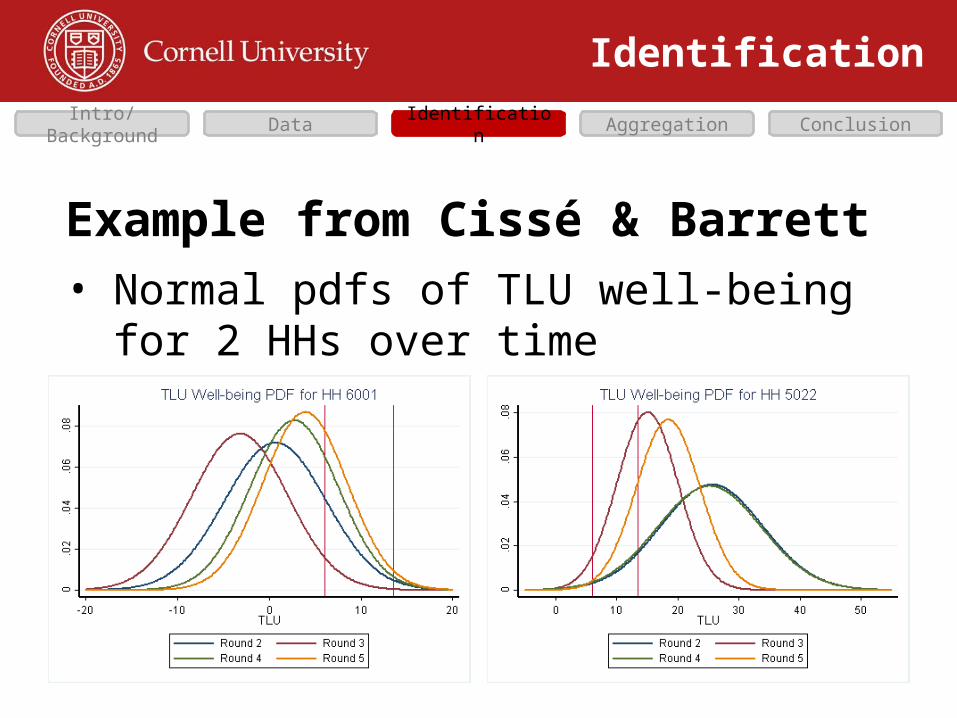
Example from Cissé & Barrett• Normal pdfs of TLU well-being for
2 HHs over time

Impact of Insurance
Data Identification Aggregation ConclusionIntro/Background
Normally distributed well-being Resilience Model

Data Identification Aggregation ConclusionIntro/Background
Identification
Table 2: Pooled 2SLS Estimates of Well-being (C) (F)
VARIABLES TLU Resilience MUAC ResilienceW_lag 0.0285*** -2.070***
W_lag2 -0.00026*** 0.145***W_lag3 5.06e-07*** -0.00323***Shock -0.173*** -0.109***
Insured TLU 0.0212* 0.0795***Shock*Insured 0.0545* -0.00455
Strong path dynamics with resilience.Negative impact of shock on resilience.Combining mean & variance allows us to see positive impact of insurance on resilience, even in non-shock years.
Having insurance during a drought years further increase TLU resilience (not significant for MUAC).

Aggregation
TLU Example (Pooled)• (i.e., headcount)
Data Identification Aggregation ConclusionIntro/Background

Data Identification Aggregation ConclusionIntro/Background
Aggregation
2 3 4 50
0.1
0.2
0.3
0.4
0.5
0.6
0.7
0.8
TLU Resilience Headcount(α=0, P=0.8)
NomadicPartially NomadicFully Settled
Round
Res
ilie
nce
Hea
dco
un
t
Data Identification Aggregation ConclusionIntro/Background
Aggregation
2 3 4 50
0.1
0.2
0.3
0.4
0.5
0.6
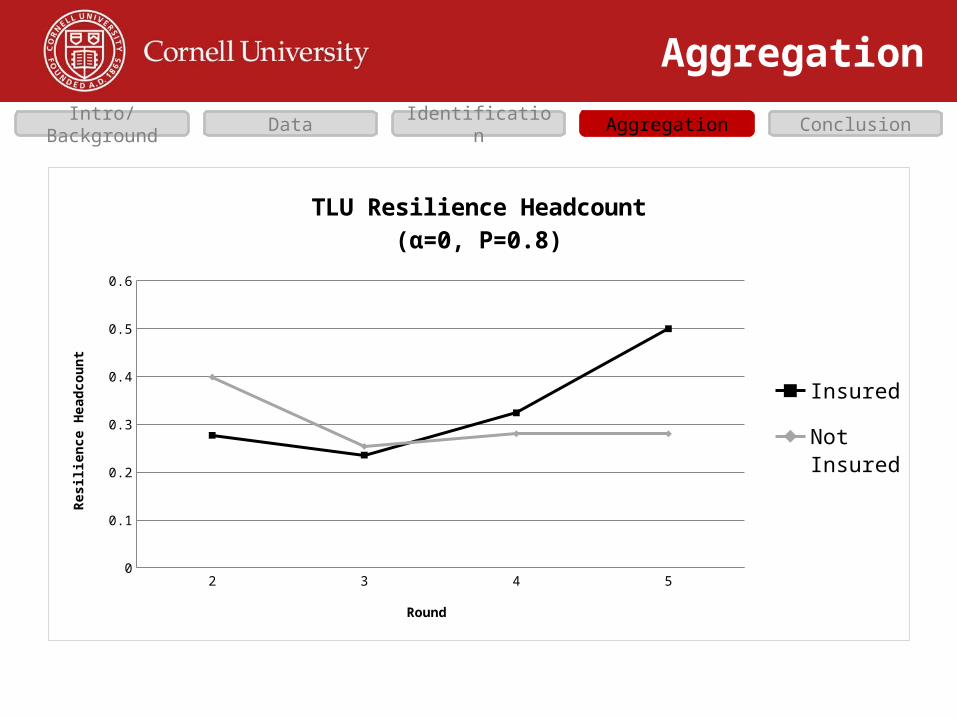
TLU Resilience Headcount(α=0, P=0.8)
Insured
Not In-sured
Round
Res
ilie
nce
Hea
dco
un
t

Conclusion
Current Work• Resilience Measurement (Cisse &
Barrett)
• Food Security Measurement using a Development Resilience Approach
Future Directions• Dynamic Optimization, Complex
Socioecological Systems
Data Identification Aggregation ConclusionIntro/Background