Embed Size (px)
Citation preview

Driver Productivity: Where the Rubber Meets the Road
James Wee, Vice President - Sales,
Descartes Systems Group
P r o p r i e t a r y a n d C o p y r i g h t o f T h e D e s c a r t e s S y s t e m s G r o u p I n c . A l l r i g h t s r e s e r v e d .
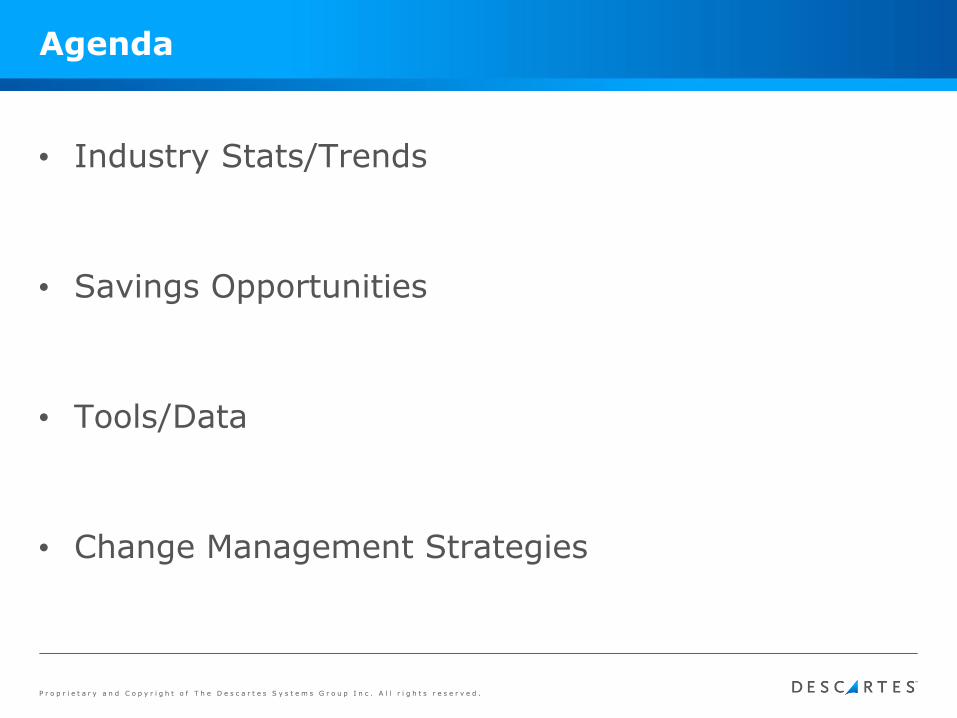
Agenda
• Industry Stats/Trends
• Savings Opportunities
• Tools/Data
• Change Management Strategies
P r o p r i e t a r y a n d C o p y r i g h t o f T h e D e s c a r t e s S y s t e m s G r o u p I n c . A l l r i g h t s r e s e r v e d .
Concerns for Fleet Operators
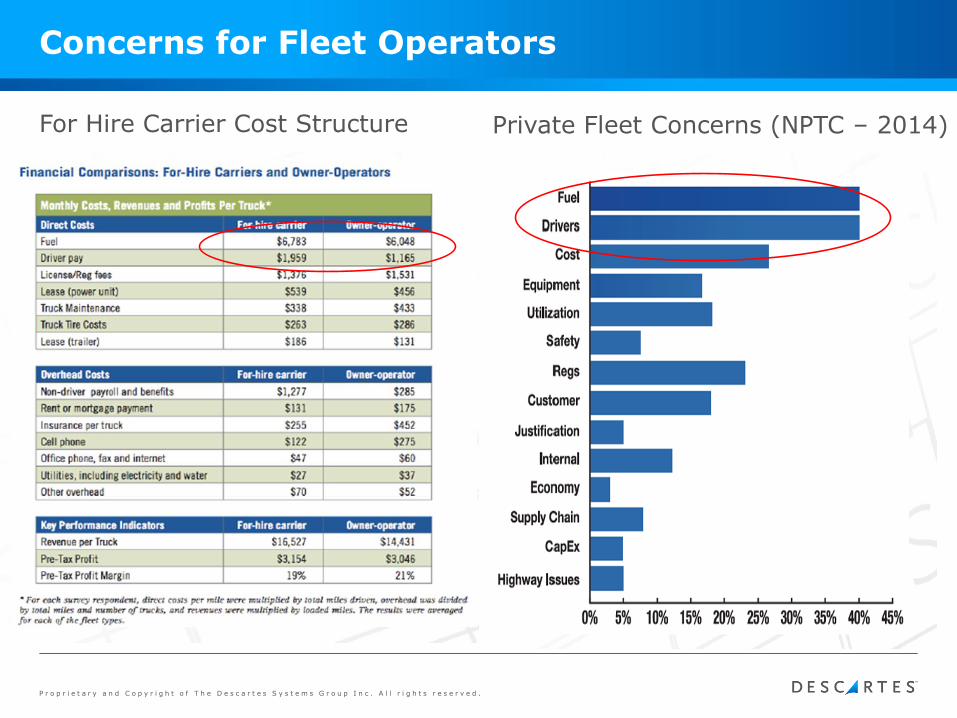
Private Fleet Concerns (NPTC – 2014)For Hire Carrier Cost Structure
P r o p r i e t a r y a n d C o p y r i g h t o f T h e D e s c a r t e s S y s t e m s G r o u p I n c . A l l r i g h t s r e s e r v e d .
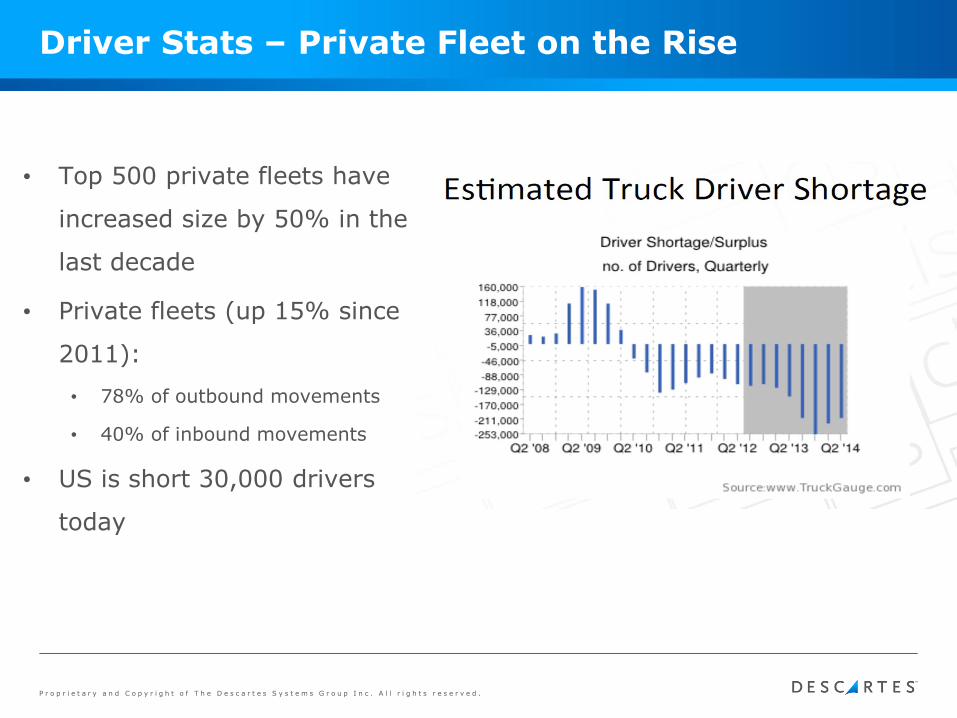
Driver Stats – Private Fleet on the Rise
• Top 500 private fleets have
increased size by 50% in the
last decade
• Private fleets (up 15% since
2011):
• 78% of outbound movements
• 40% of inbound movements
• US is short 30,000 drivers
today
P r o p r i e t a r y a n d C o p y r i g h t o f T h e D e s c a r t e s S y s t e m s G r o u p I n c . A l l r i g h t s r e s e r v e d .
Savings Opportunities
P r o p r i e t a r y a n d C o p y r i g h t o f T h e D e s c a r t e s S y s t e m s G r o u p I n c . A l l r i g h t s r e s e r v e d .
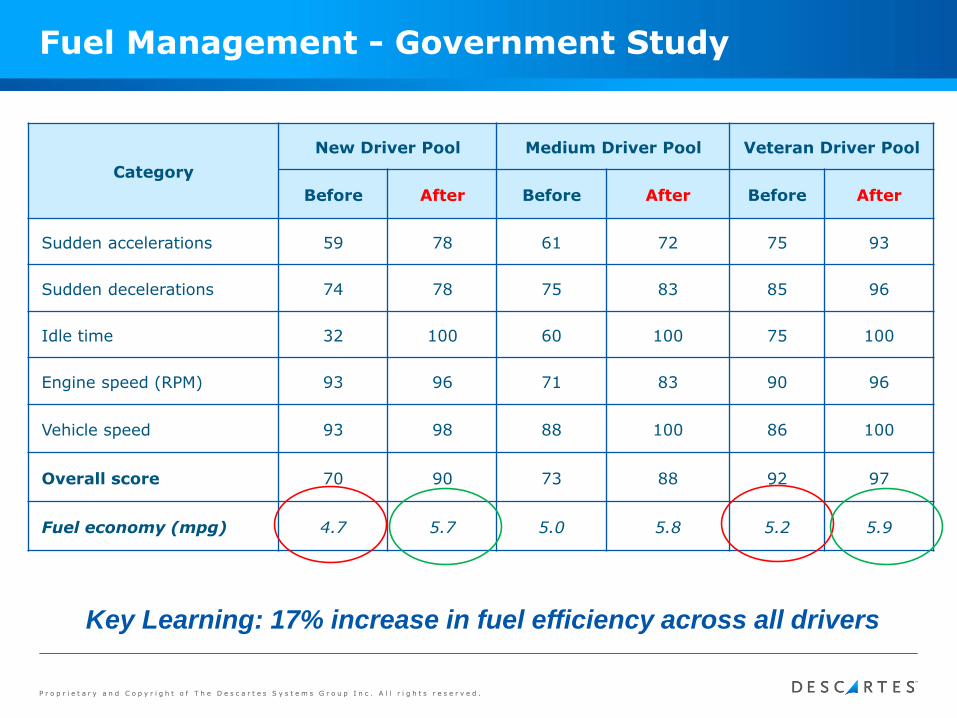
Fuel Management - Government Study
Category
New Driver Pool Medium Driver Pool Veteran Driver Pool
Before After Before After Before After
Sudden accelerations 59 78 61 72 75 93
Sudden decelerations 74 78 75 83 85 96
Idle time 32 100 60 100 75 100
Engine speed (RPM) 93 96 71 83 90 96
Vehicle speed 93 98 88 100 86 100
Overall score 70 90 73 88 92 97
Fuel economy (mpg) 4.7 5.7 5.0 5.8 5.2 5.9
Key Learning: 17% increase in fuel efficiency across all drivers
P r o p r i e t a r y a n d C o p y r i g h t o f T h e D e s c a r t e s S y s t e m s G r o u p I n c . A l l r i g h t s r e s e r v e d .
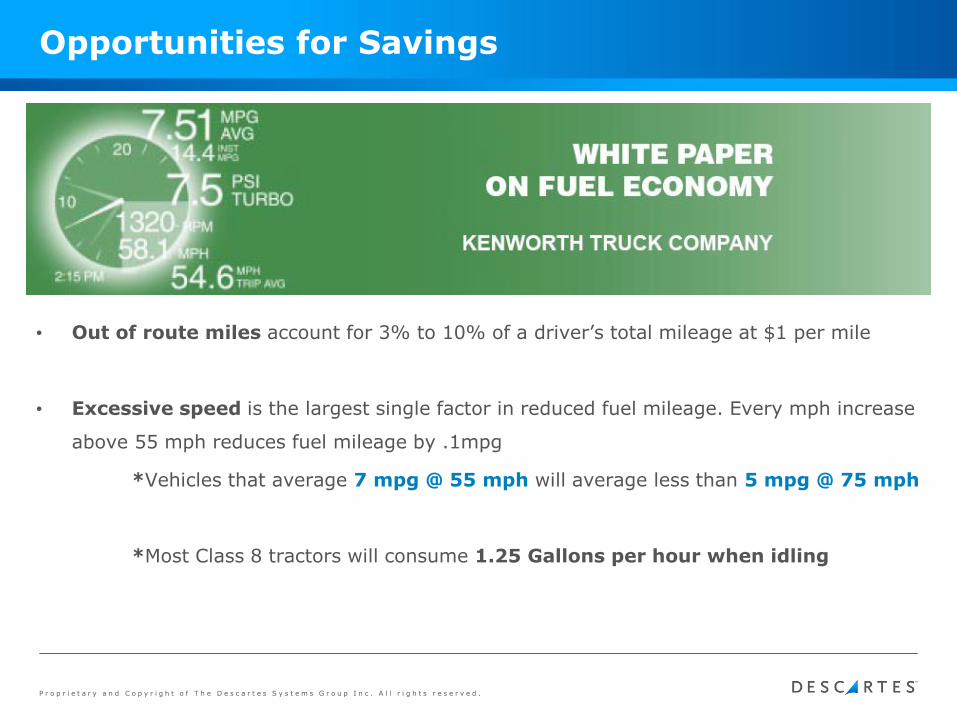
Opportunities for Savings
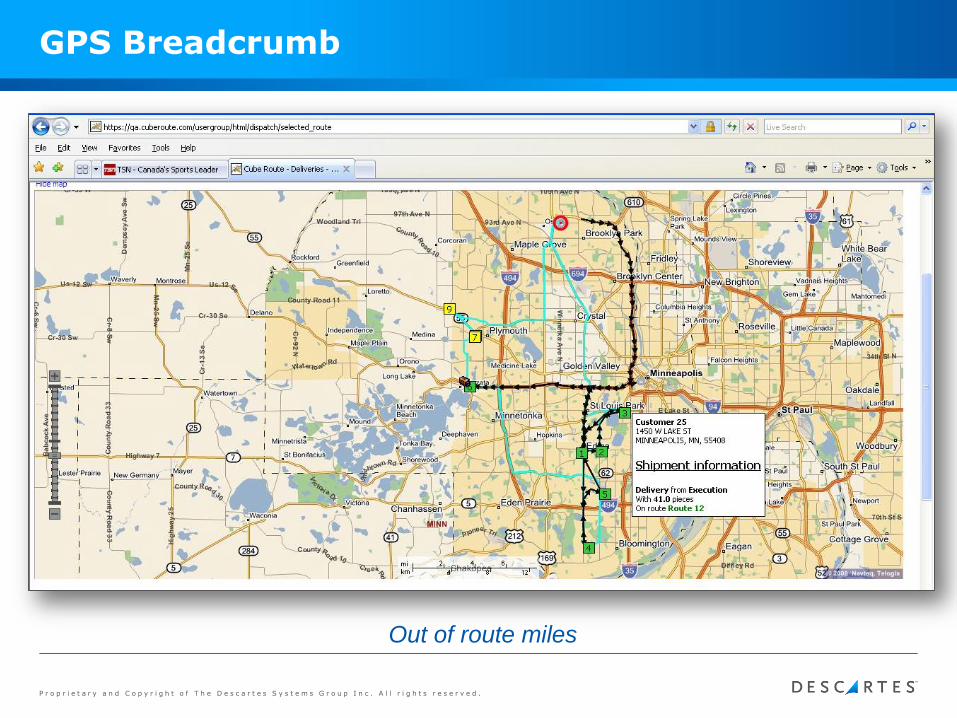
• Out of route miles account for 3% to 10% of a driver’s total mileage at $1 per mile
• Excessive speed is the largest single factor in reduced fuel mileage. Every mph increase
above 55 mph reduces fuel mileage by .1mpg
*Vehicles that average 7 mpg @ 55 mph will average less than 5 mpg @ 75 mph
*Most Class 8 tractors will consume 1.25 Gallons per hour when idling
P r o p r i e t a r y a n d C o p y r i g h t o f T h e D e s c a r t e s S y s t e m s G r o u p I n c . A l l r i g h t s r e s e r v e d .
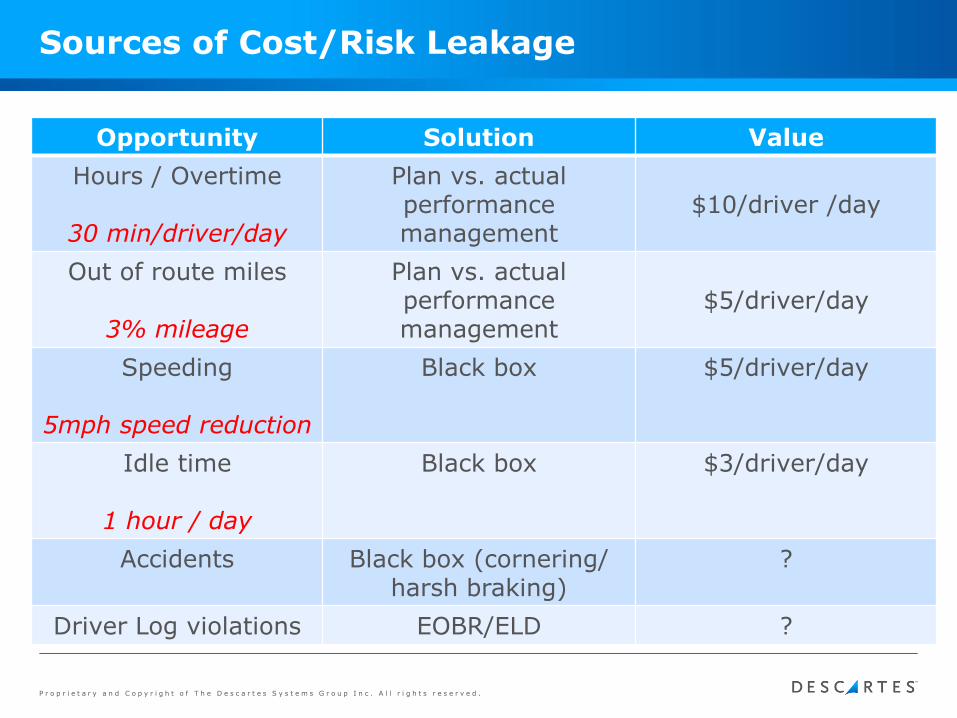
Sources of Cost/Risk Leakage
Opportunity Solution Value
Hours / Overtime
30 min/driver/day
Plan vs. actual performance management
$10/driver /day
Out of route miles
3% mileage
Plan vs. actual performance management
$5/driver/day
Speeding
5mph speed reduction
Black box $5/driver/day
Idle time
1 hour / day
Black box $3/driver/day
Accidents Black box (cornering/ harsh braking)
?
Driver Log violations EOBR/ELD ?
P r o p r i e t a r y a n d C o p y r i g h t o f T h e D e s c a r t e s S y s t e m s G r o u p I n c . A l l r i g h t s r e s e r v e d .
Data/Tools Available
P r o p r i e t a r y a n d C o p y r i g h t o f T h e D e s c a r t e s S y s t e m s G r o u p I n c . A l l r i g h t s r e s e r v e d .
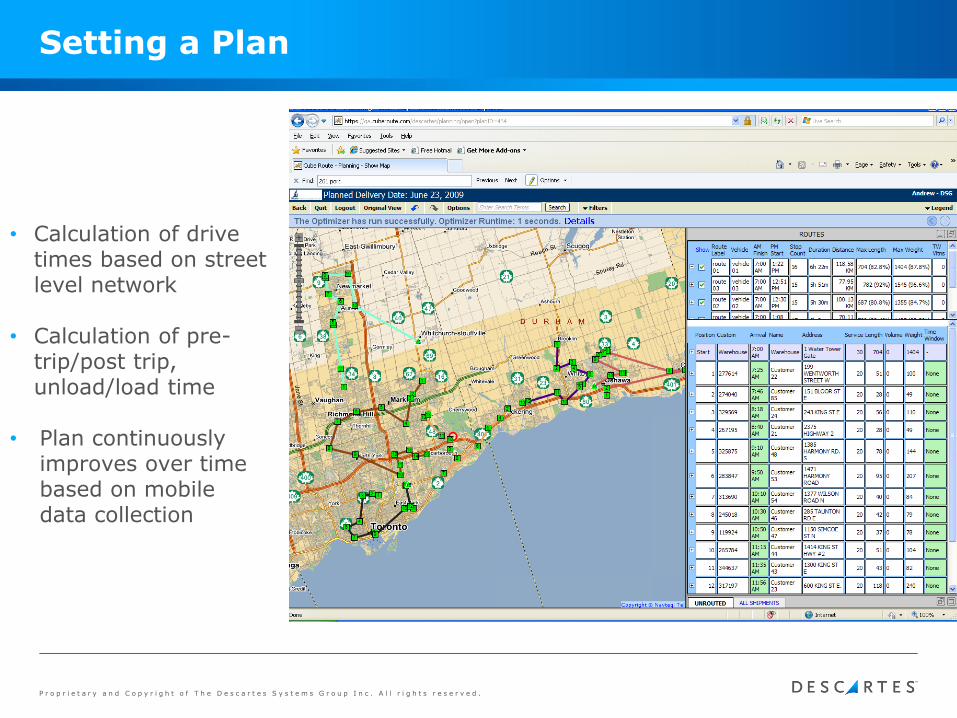
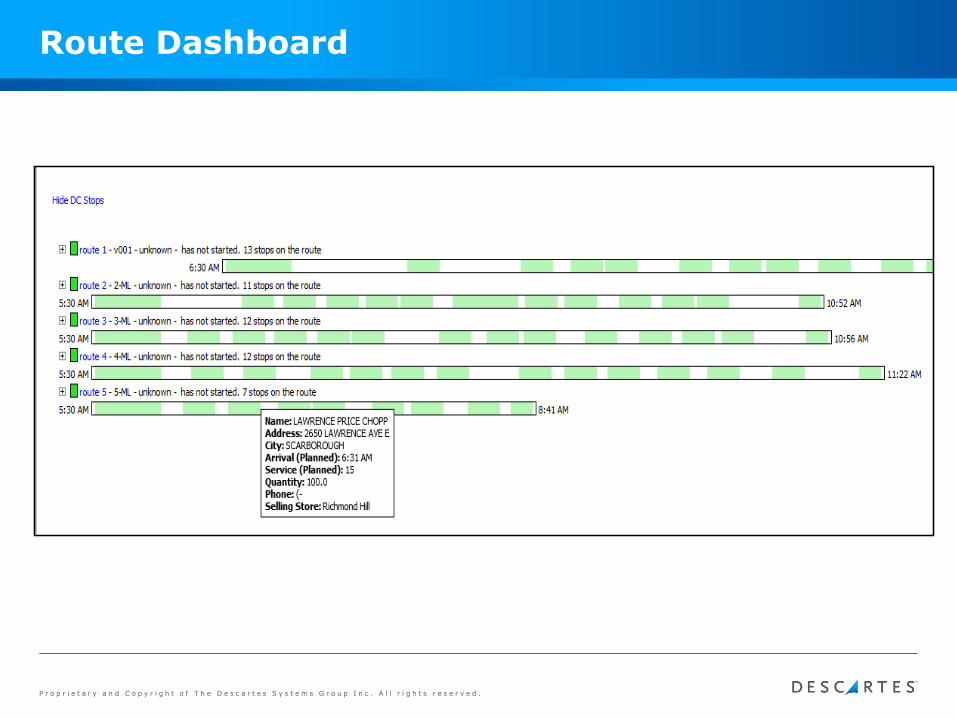
Setting a Plan
• Calculation of drive times based on street level network
• Calculation of pre-trip/post trip, unload/load time
• Plan continuously improves over time based on mobile data collection
P r o p r i e t a r y a n d C o p y r i g h t o f T h e D e s c a r t e s S y s t e m s G r o u p I n c . A l l r i g h t s r e s e r v e d .
Route Dashboard
P r o p r i e t a r y a n d C o p y r i g h t o f T h e D e s c a r t e s S y s t e m s G r o u p I n c . A l l r i g h t s r e s e r v e d .
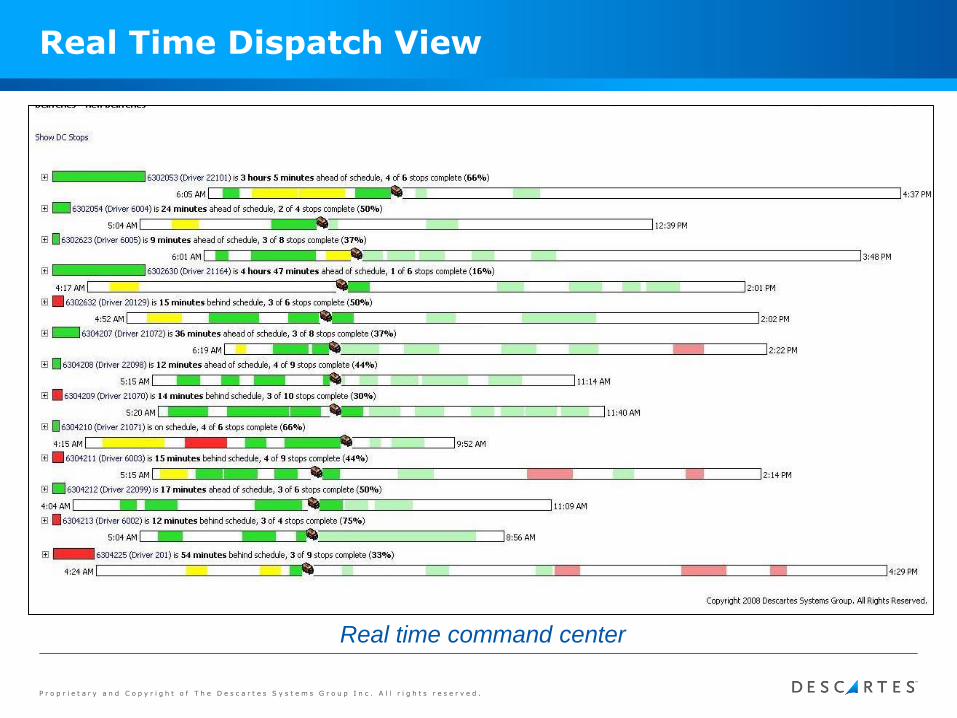
Real Time Dispatch View
Real time command center
P r o p r i e t a r y a n d C o p y r i g h t o f T h e D e s c a r t e s S y s t e m s G r o u p I n c . A l l r i g h t s r e s e r v e d .
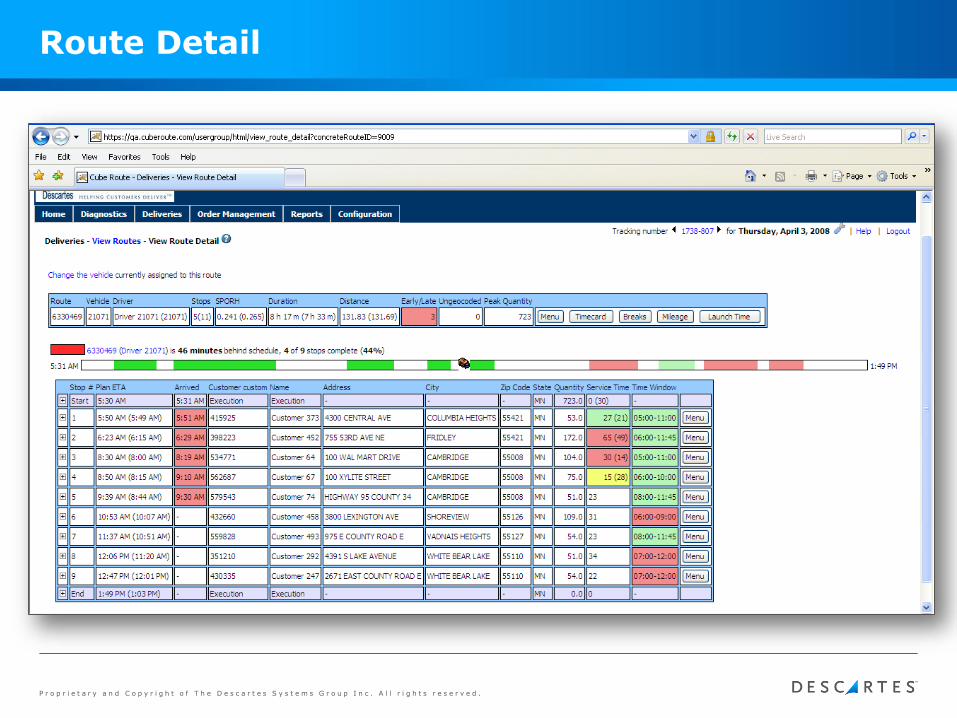
Route Detail
P r o p r i e t a r y a n d C o p y r i g h t o f T h e D e s c a r t e s S y s t e m s G r o u p I n c . A l l r i g h t s r e s e r v e d .
GPS Breadcrumb
Out of route miles
P r o p r i e t a r y a n d C o p y r i g h t o f T h e D e s c a r t e s S y s t e m s G r o u p I n c . A l l r i g h t s r e s e r v e d .
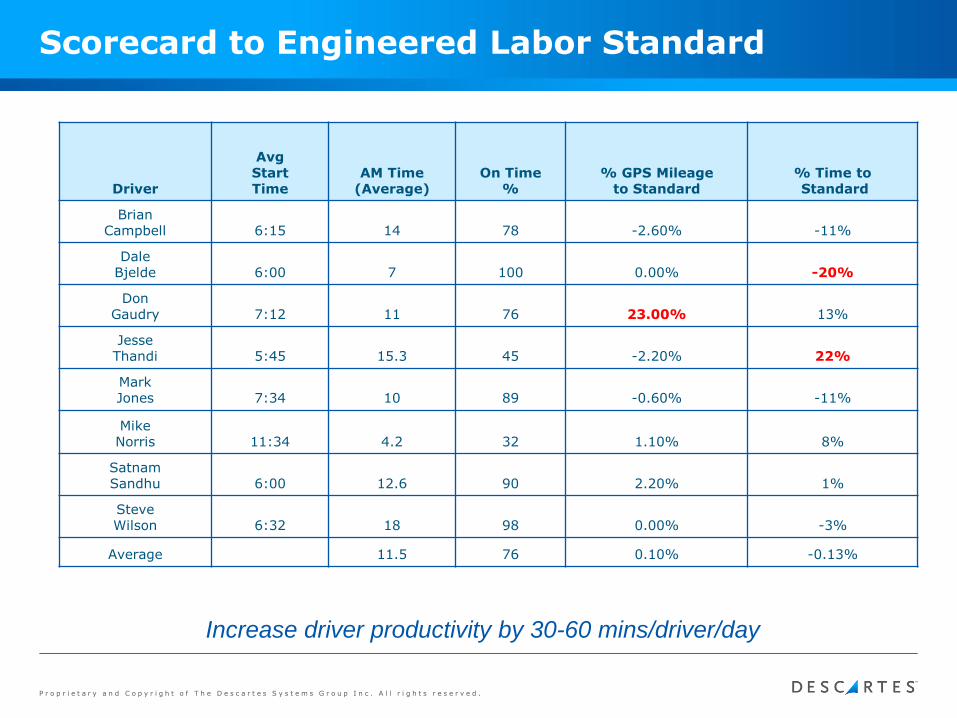
Scorecard to Engineered Labor Standard
Driver
Avg Start Time
AM Time(Average)
On Time%
% GPS Mileage to Standard
% Time toStandard
BrianCampbell 6:15 14 78 -2.60% -11%
Dale Bjelde 6:00 7 100 0.00% -20%
Don Gaudry 7:12 11 76 23.00% 13%
Jesse Thandi 5:45 15.3 45 -2.20% 22%
Mark Jones 7:34 10 89 -0.60% -11%
Mike Norris 11:34 4.2 32 1.10% 8%
Satnam Sandhu 6:00 12.6 90 2.20% 1%
Steve Wilson 6:32 18 98 0.00% -3%
Average 11.5 76 0.10% -0.13%
Increase driver productivity by 30-60 mins/driver/day
P r o p r i e t a r y a n d C o p y r i g h t o f T h e D e s c a r t e s S y s t e m s G r o u p I n c . A l l r i g h t s r e s e r v e d .
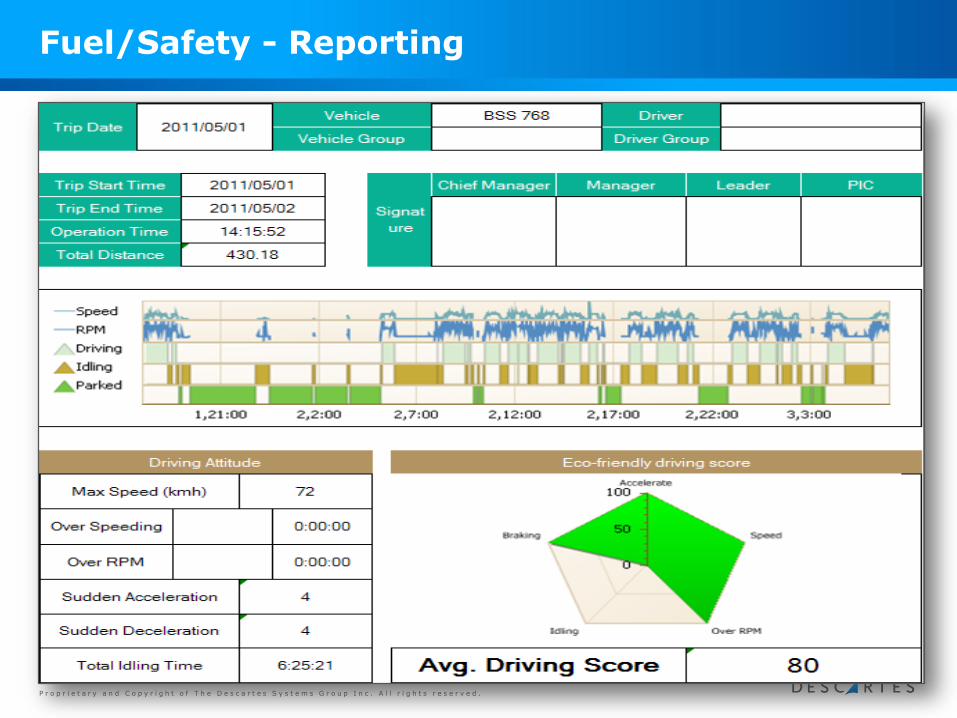
Fuel/Safety - Reporting
P r o p r i e t a r y a n d C o p y r i g h t o f T h e D e s c a r t e s S y s t e m s G r o u p I n c . A l l r i g h t s r e s e r v e d .
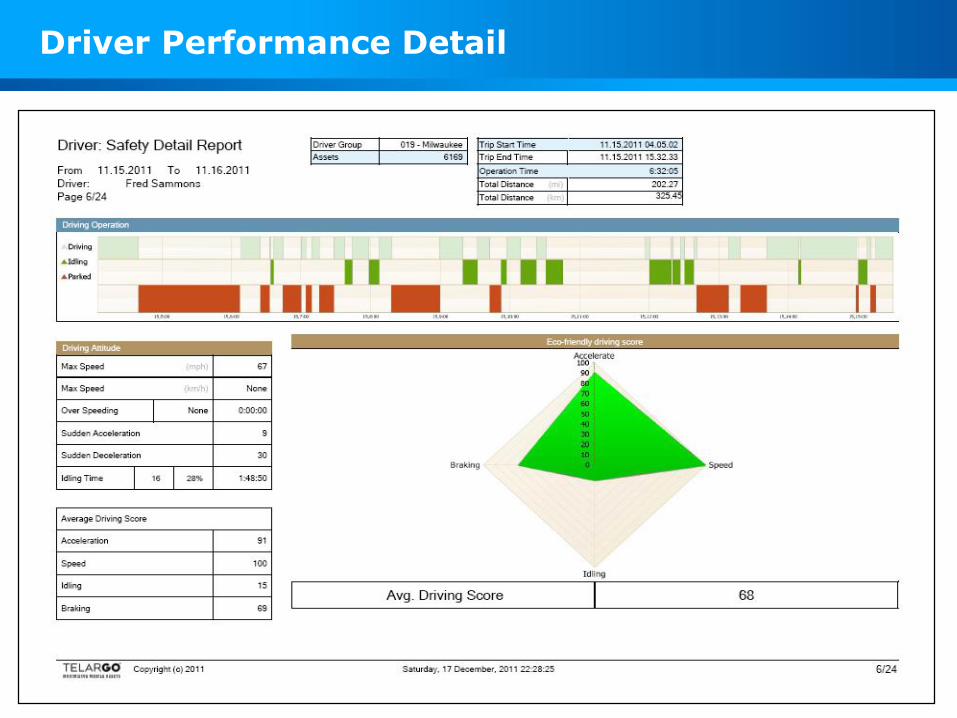
Driver Performance Detail
P r o p r i e t a r y a n d C o p y r i g h t o f T h e D e s c a r t e s S y s t e m s G r o u p I n c . A l l r i g h t s r e s e r v e d .
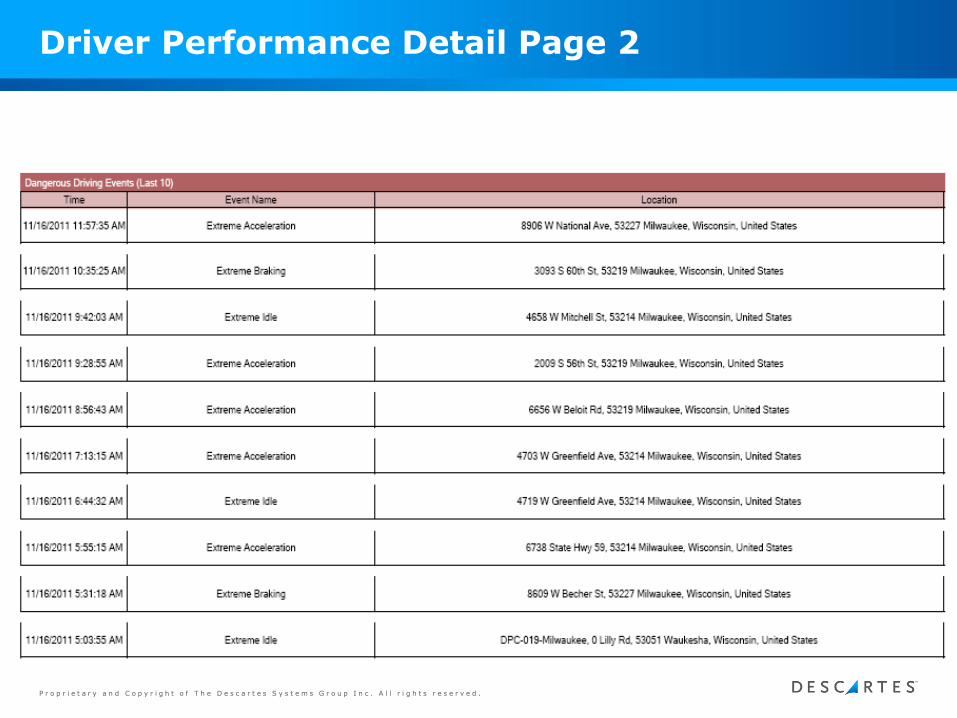
Driver Performance Detail Page 2
P r o p r i e t a r y a n d C o p y r i g h t o f T h e D e s c a r t e s S y s t e m s G r o u p I n c . A l l r i g h t s r e s e r v e d .
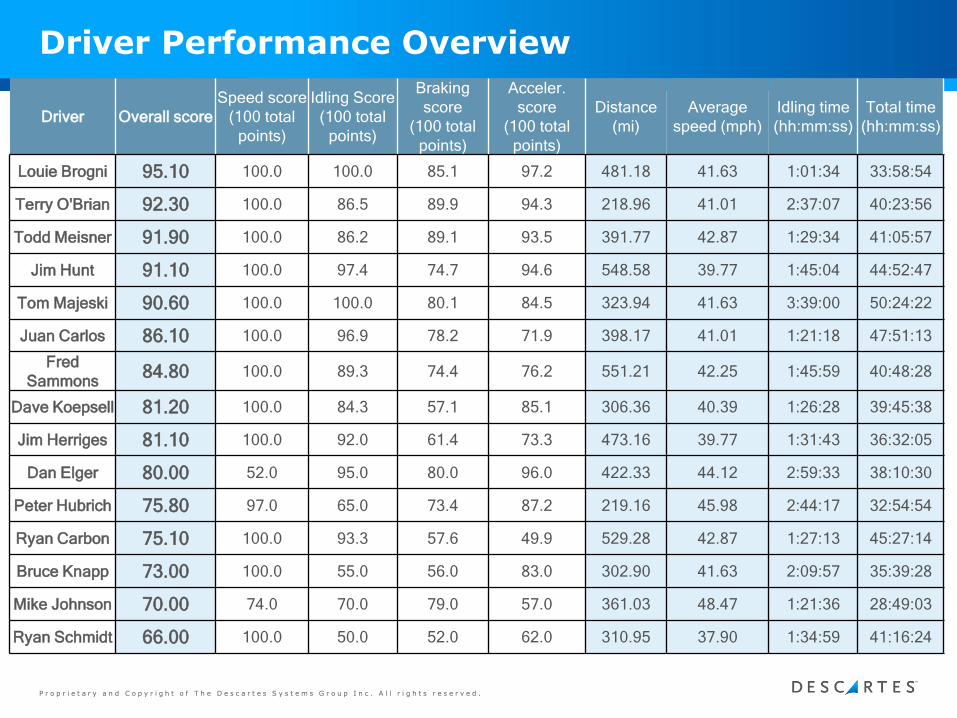
Driver Performance Overview
Driver Overall score
Speed score
(100 total
points)
Idling Score
(100 total
points)
Braking
score
(100 total
points)
Acceler.
score
(100 total
points)
Distance
(mi)
Average
speed (mph)
Idling time
(hh:mm:ss)
Total time
(hh:mm:ss)
Louie Brogni 95.10 100.0 100.0 85.1 97.2 481.18 41.63 1:01:34 33:58:54
Terry O'Brian 92.30 100.0 86.5 89.9 94.3 218.96 41.01 2:37:07 40:23:56
Todd Meisner 91.90 100.0 86.2 89.1 93.5 391.77 42.87 1:29:34 41:05:57
Jim Hunt 91.10 100.0 97.4 74.7 94.6 548.58 39.77 1:45:04 44:52:47
Tom Majeski 90.60 100.0 100.0 80.1 84.5 323.94 41.63 3:39:00 50:24:22
Juan Carlos 86.10 100.0 96.9 78.2 71.9 398.17 41.01 1:21:18 47:51:13
Fred
Sammons84.80 100.0 89.3 74.4 76.2 551.21 42.25 1:45:59 40:48:28
Dave Koepsell 81.20 100.0 84.3 57.1 85.1 306.36 40.39 1:26:28 39:45:38
Jim Herriges 81.10 100.0 92.0 61.4 73.3 473.16 39.77 1:31:43 36:32:05
Dan Elger 80.00 52.0 95.0 80.0 96.0 422.33 44.12 2:59:33 38:10:30
Peter Hubrich 75.80 97.0 65.0 73.4 87.2 219.16 45.98 2:44:17 32:54:54
Ryan Carbon 75.10 100.0 93.3 57.6 49.9 529.28 42.87 1:27:13 45:27:14
Bruce Knapp 73.00 100.0 55.0 56.0 83.0 302.90 41.63 2:09:57 35:39:28
Mike Johnson 70.00 74.0 70.0 79.0 57.0 361.03 48.47 1:21:36 28:49:03
Ryan Schmidt 66.00 100.0 50.0 52.0 62.0 310.95 37.90 1:34:59 41:16:24
P r o p r i e t a r y a n d C o p y r i g h t o f T h e D e s c a r t e s S y s t e m s G r o u p I n c . A l l r i g h t s r e s e r v e d .
Best Practices / Change Management
P r o p r i e t a r y a n d C o p y r i g h t o f T h e D e s c a r t e s S y s t e m s G r o u p I n c . A l l r i g h t s r e s e r v e d .
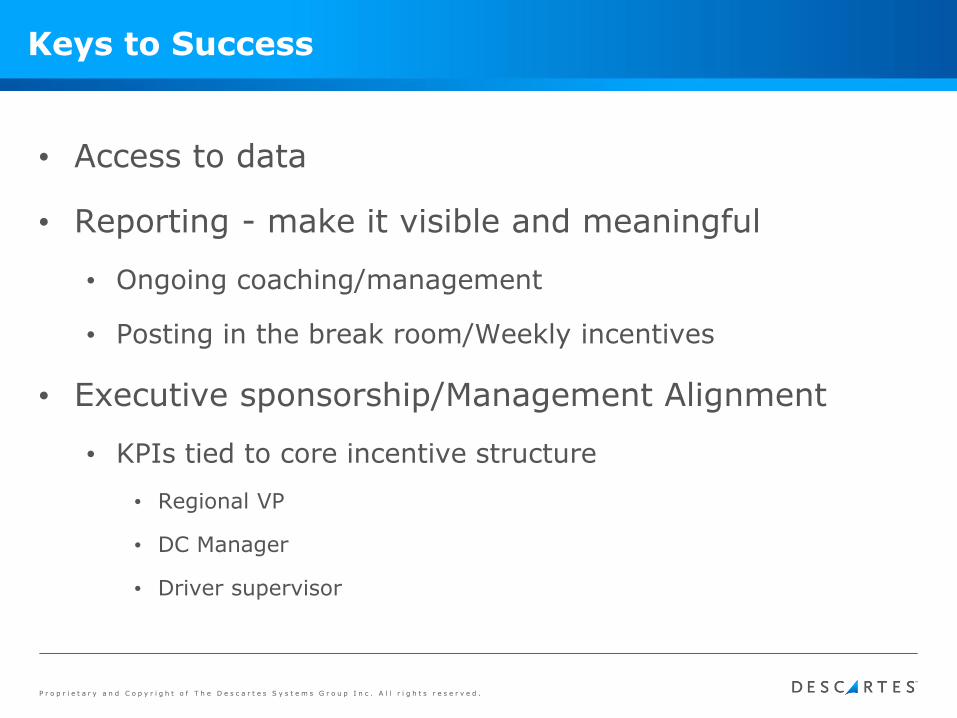
Keys to Success
• Access to data
• Reporting - make it visible and meaningful
• Ongoing coaching/management
• Posting in the break room/Weekly incentives
• Executive sponsorship/Management Alignment
• KPIs tied to core incentive structure
• Regional VP
• DC Manager
• Driver supervisor
P r o p r i e t a r y a n d C o p y r i g h t o f T h e D e s c a r t e s S y s t e m s G r o u p I n c . A l l r i g h t s r e s e r v e d .
Questions?
Thank you!
#SupplyChainGeek
James Wee
Descartes Systems Group
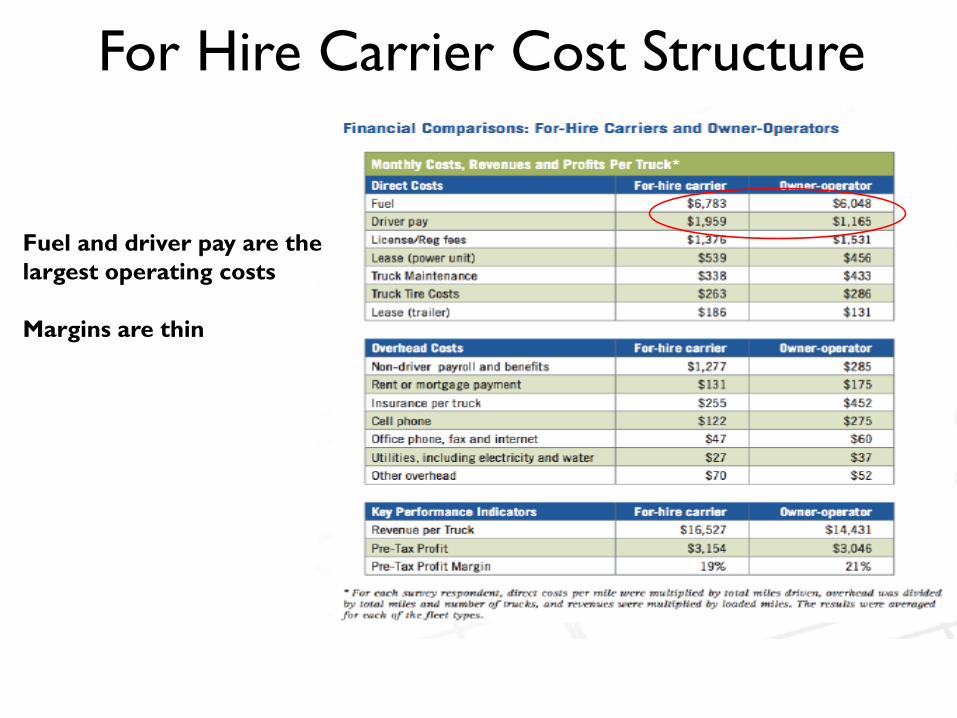
For Hire Carrier Cost Structure
Fuel and driver pay are the
largest operating costs
Margins are thin
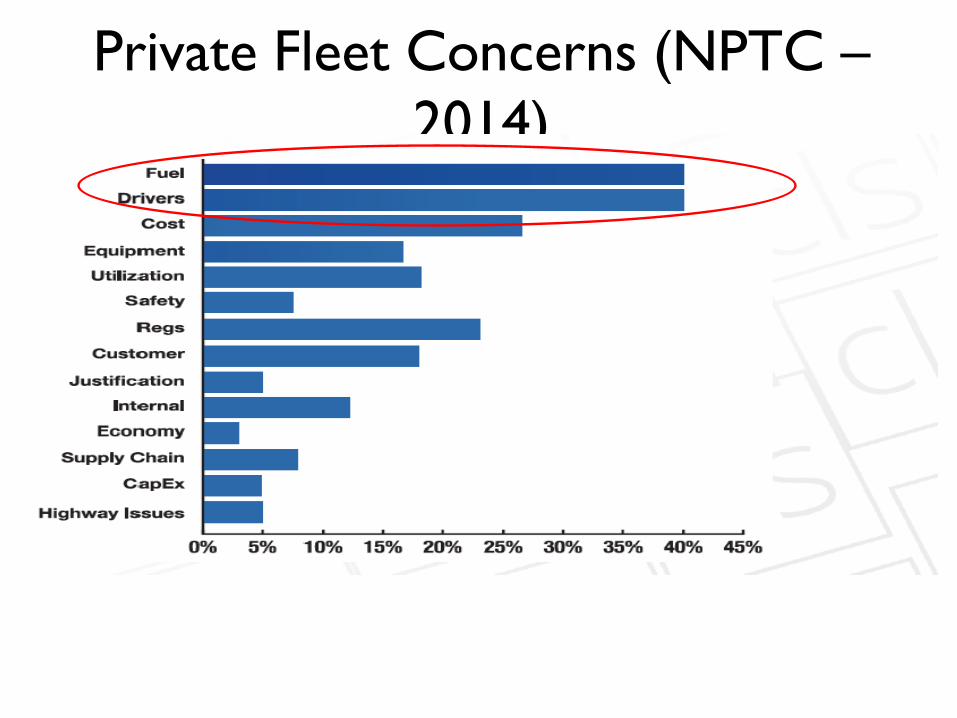
Private Fleet Concerns (NPTC –
2014)
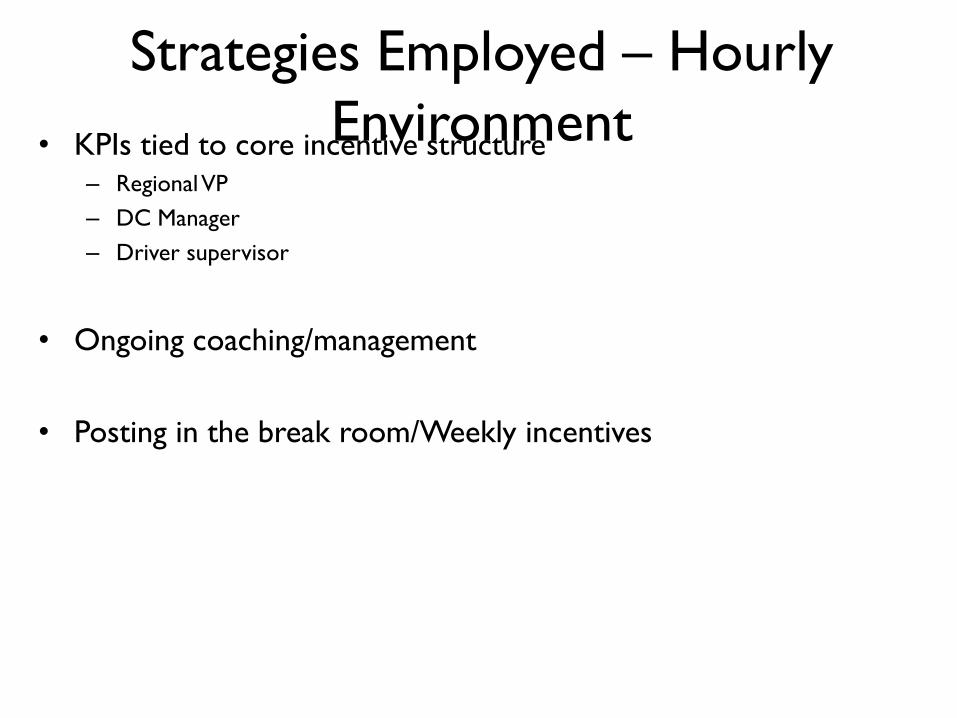
Strategies Employed – Hourly
Environment• KPIs tied to core incentive structure– Regional VP
– DC Manager
– Driver supervisor
• Ongoing coaching/management
• Posting in the break room/Weekly incentives
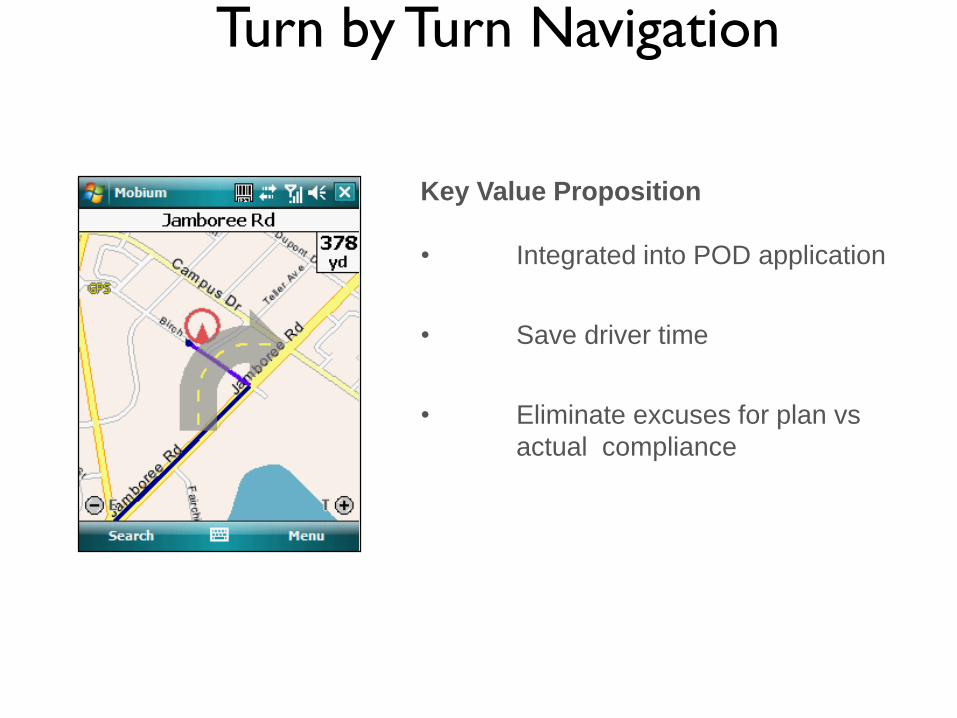
Turn by Turn Navigation
Key Value Proposition
• Integrated into POD application
• Save driver time
• Eliminate excuses for plan vs
actual compliance