Embed Size (px)
Citation preview
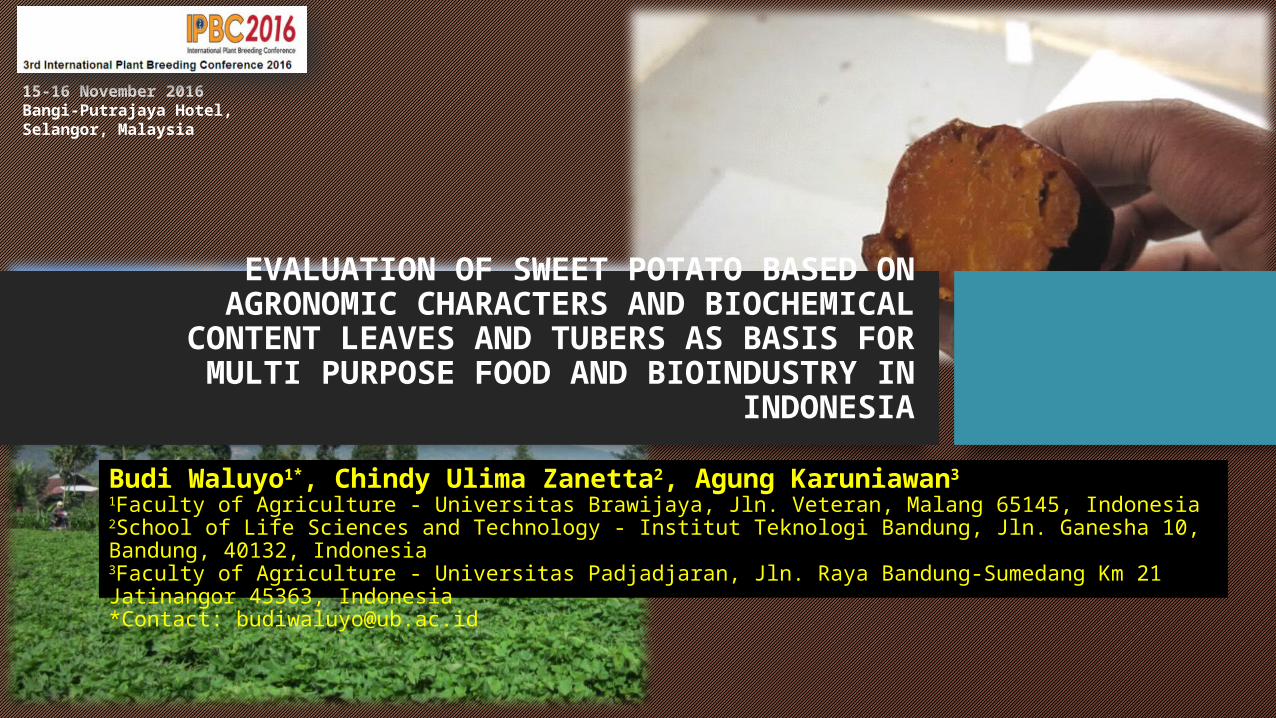
15-16 November 2016Bangi-Putrajaya Hotel,Selangor, Malaysia
EVALUATION OF SWEET POTATO BASED ON AGRONOMIC CHARACTERS AND BIOCHEMICAL CONTENT LEAVES AND TUBERS AS BASIS FOR
MULTI PURPOSE FOOD AND BIOINDUSTRY IN INDONESIA
Budi Waluyo1*, Chindy Ulima Zanetta2, Agung Karuniawan31Faculty of Agriculture - Universitas Brawijaya, Jln. Veteran, Malang 65145, Indonesia 2School of Life Sciences and Technology - Institut Teknologi Bandung, Jln. Ganesha 10, Bandung, 40132, Indonesia3Faculty of Agriculture - Universitas Padjadjaran, Jln. Raya Bandung-Sumedang Km 21 Jatinangor 45363, Indonesia*Contact: [email protected]

INTRODUCTION
• Sweet potato potentially be used as food, feed, and bioethanol industry • As a food source, the variation of the tuber flesh can be
directed at the source of carbohydrates with a low glycemic index, source of functional foods with high vitamin and mineral content, as well as a source of antioxidants • The content of starch and dry matter of sweet potato
tubers suitable to be used as industrial raw materials and bioethanol• Stems, petioles and leaves of sweet potato potentially be
used as a functional food ingredient source of antioxidants and antimutagenic. The leaves can also be used as a potential feed sources
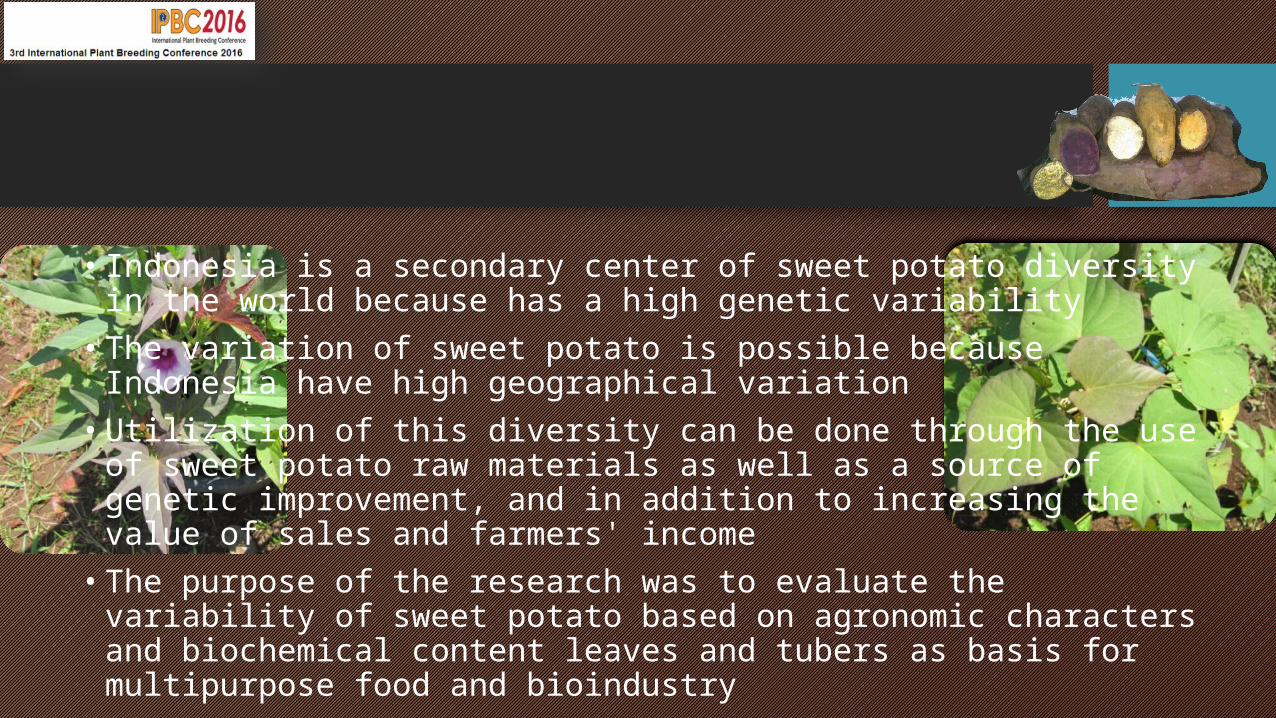
• Indonesia is a secondary center of sweet potato diversity in the world because has a high genetic variability• The variation of sweet potato is possible because Indonesia have
high geographical variation• Utilization of this diversity can be done through the use of sweet
potato raw materials as well as a source of genetic improvement, and in addition to increasing the value of sales and farmers' income• The purpose of the research was to evaluate the variability of sweet
potato based on agronomic characters and biochemical content leaves and tubers as basis for multipurpose food and bioindustry
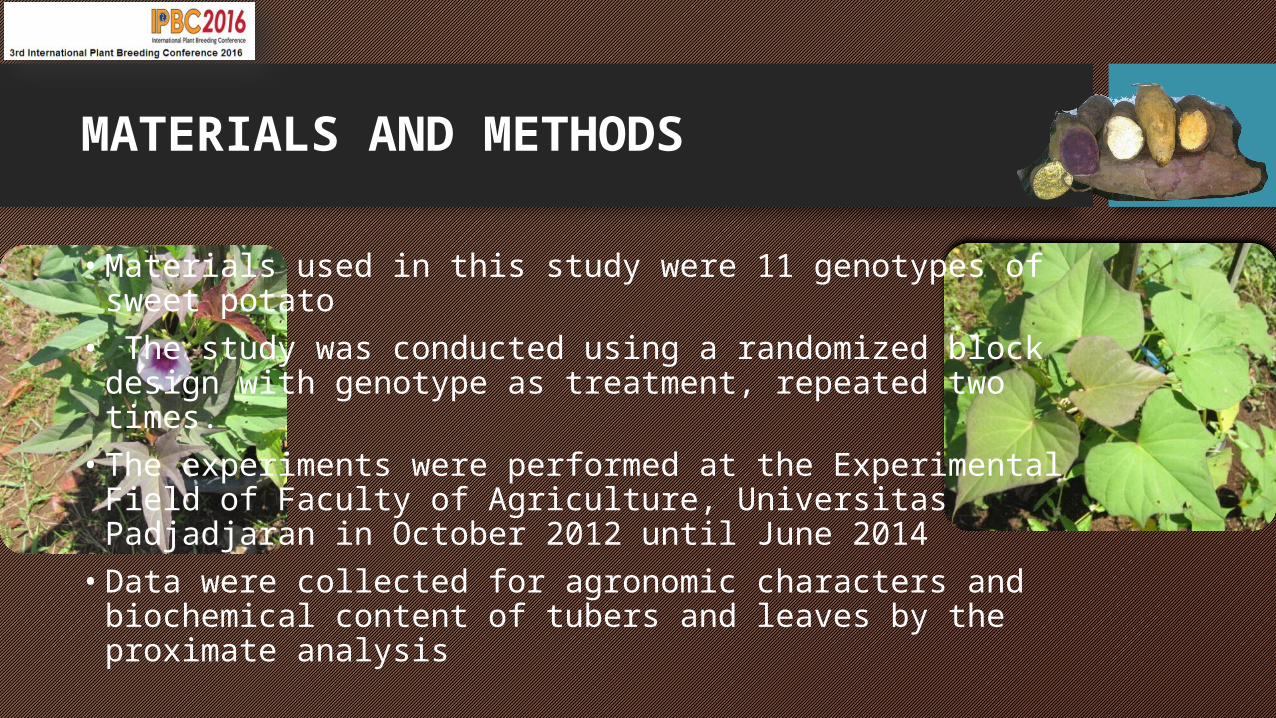
• Materials used in this study were 11 genotypes of sweet potato• The study was conducted using a randomized block design
with genotype as treatment, repeated two times.• The experiments were performed at the Experimental Field
of Faculty of Agriculture, Universitas Padjadjaran in October 2012 until June 2014• Data were collected for agronomic characters and
biochemical content of tubers and leaves by the proximate analysis
MATERIALS AND METHODS
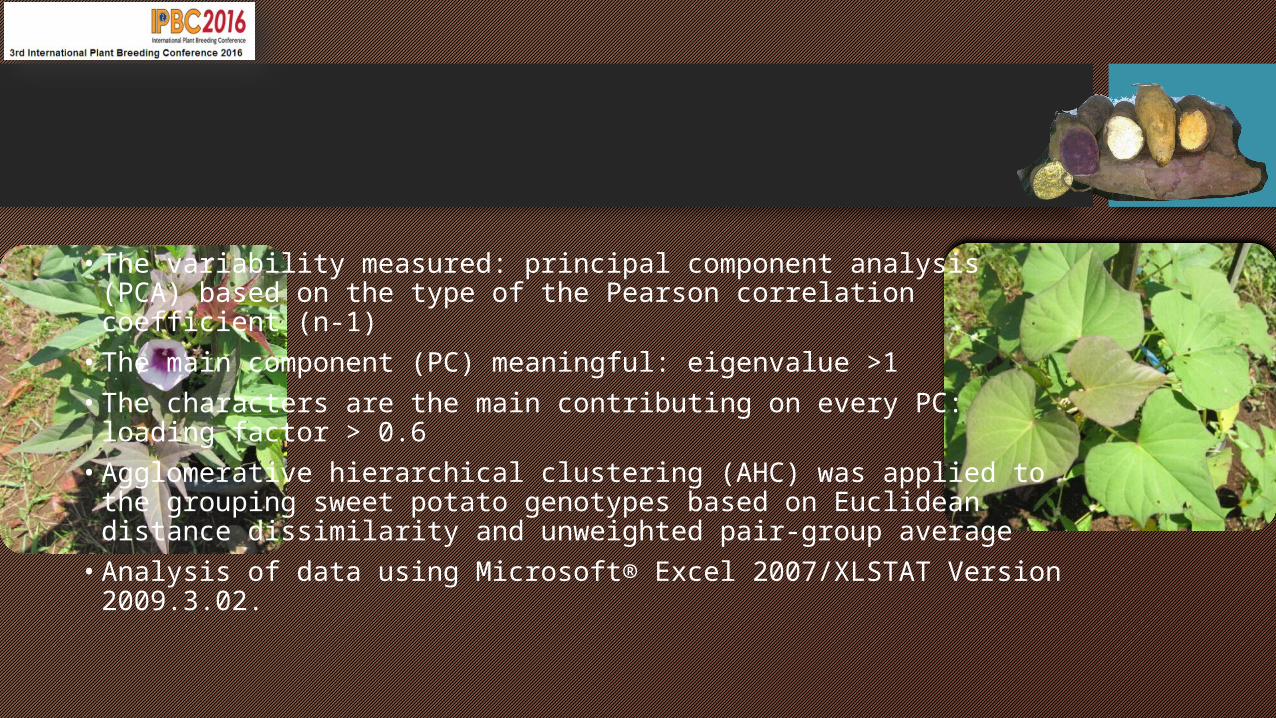
• The variability measured: principal component analysis (PCA) based on the type of the Pearson correlation coefficient (n-1)• The main component (PC) meaningful: eigenvalue >1 • The characters are the main contributing on every PC: loading
factor > 0.6• Agglomerative hierarchical clustering (AHC) was applied to the
grouping sweet potato genotypes based on Euclidean distance dissimilarity and unweighted pair-group average • Analysis of data using Microsoft® Excel 2007/XLSTAT Version
2009.3.02.
RESULTS AND DISCUSSION
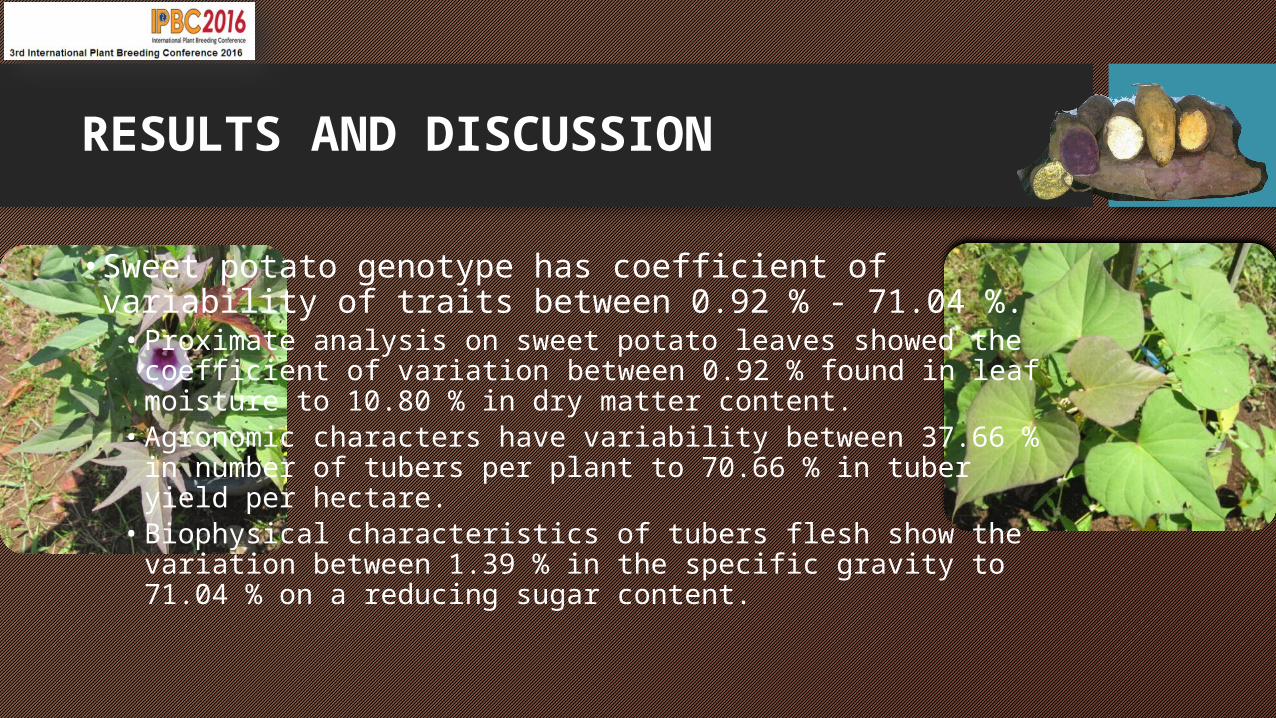
• Sweet potato genotype has coefficient of variability of traits between 0.92 % - 71.04 %. • Proximate analysis on sweet potato leaves showed the
coefficient of variation between 0.92 % found in leaf moisture to 10.80 % in dry matter content.
• Agronomic characters have variability between 37.66 % in number of tubers per plant to 70.66 % in tuber yield per hectare.
• Biophysical characteristics of tubers flesh show the variation between 1.39 % in the specific gravity to 71.04 % on a reducing sugar content.
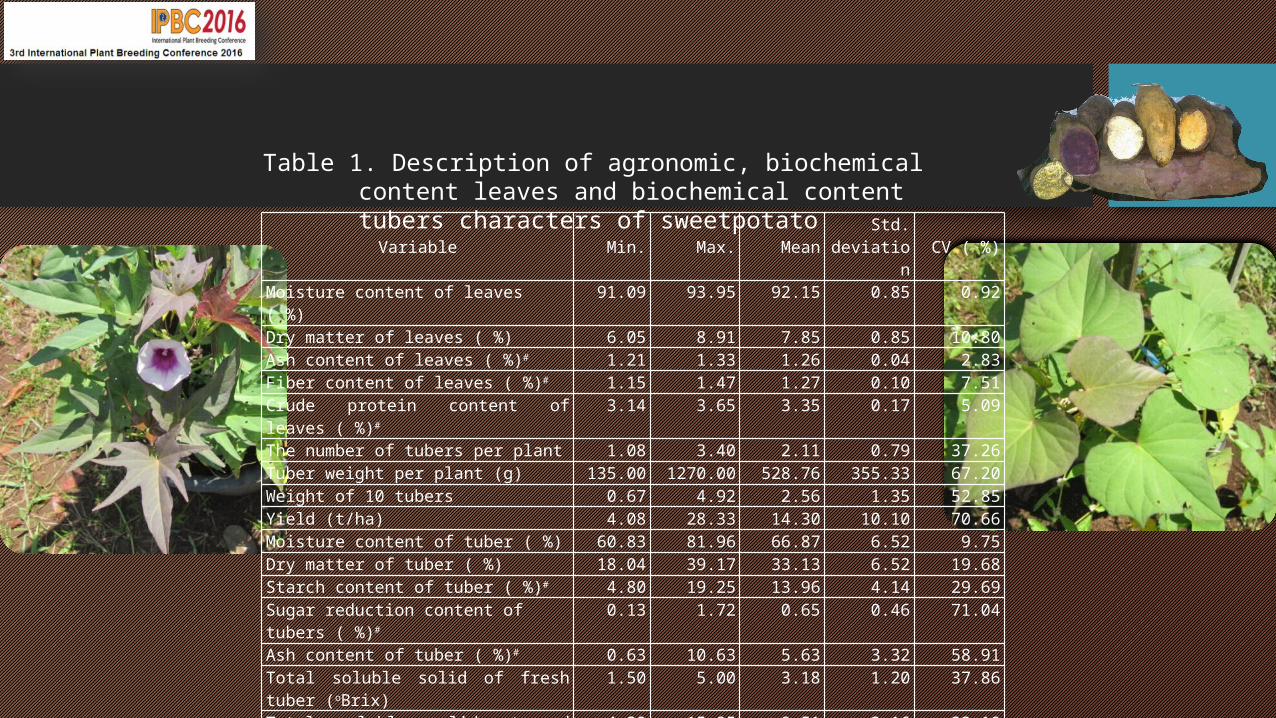
Variable Min. Max. Mean Std. deviation CV ( %)
Moisture content of leaves ( %) 91.09 93.95 92.15 0.85 0.92Dry matter of leaves ( %) 6.05 8.91 7.85 0.85 10.80Ash content of leaves ( %)# 1.21 1.33 1.26 0.04 2.83Fiber content of leaves ( %)# 1.15 1.47 1.27 0.10 7.51Crude protein content of leaves ( %)#
3.14 3.65 3.35 0.17 5.09
The number of tubers per plant 1.08 3.40 2.11 0.79 37.26Tuber weight per plant (g) 135.00 1270.00 528.76 355.33 67.20Weight of 10 tubers 0.67 4.92 2.56 1.35 52.85Yield (t/ha) 4.08 28.33 14.30 10.10 70.66Moisture content of tuber ( %) 60.83 81.96 66.87 6.52 9.75Dry matter of tuber ( %) 18.04 39.17 33.13 6.52 19.68Starch content of tuber ( %)# 4.80 19.25 13.96 4.14 29.69Sugar reduction content of tubers ( %)#
0.13 1.72 0.65 0.46 71.04
Ash content of tuber ( %)# 0.63 10.63 5.63 3.32 58.91Total soluble solid of fresh tuber (oBrix)
1.50 5.00 3.18 1.20 37.86
Total soluble solid steamed tuber (oBrix)
4.20 15.95 9.51 3.16 33.18
Total soluble solid baked tuber (oBrix)
6.00 14.90 11.12 2.49 22.41
Specific gravity 1.01 1.06 1.04 0.01 1.39Ethanol yield (l/ha) 618.72 5364.50 2269.62 1293.88 57.01
Table 1. Description of agronomic, biochemical content leaves and biochemical content tubers characters of sweetpotato
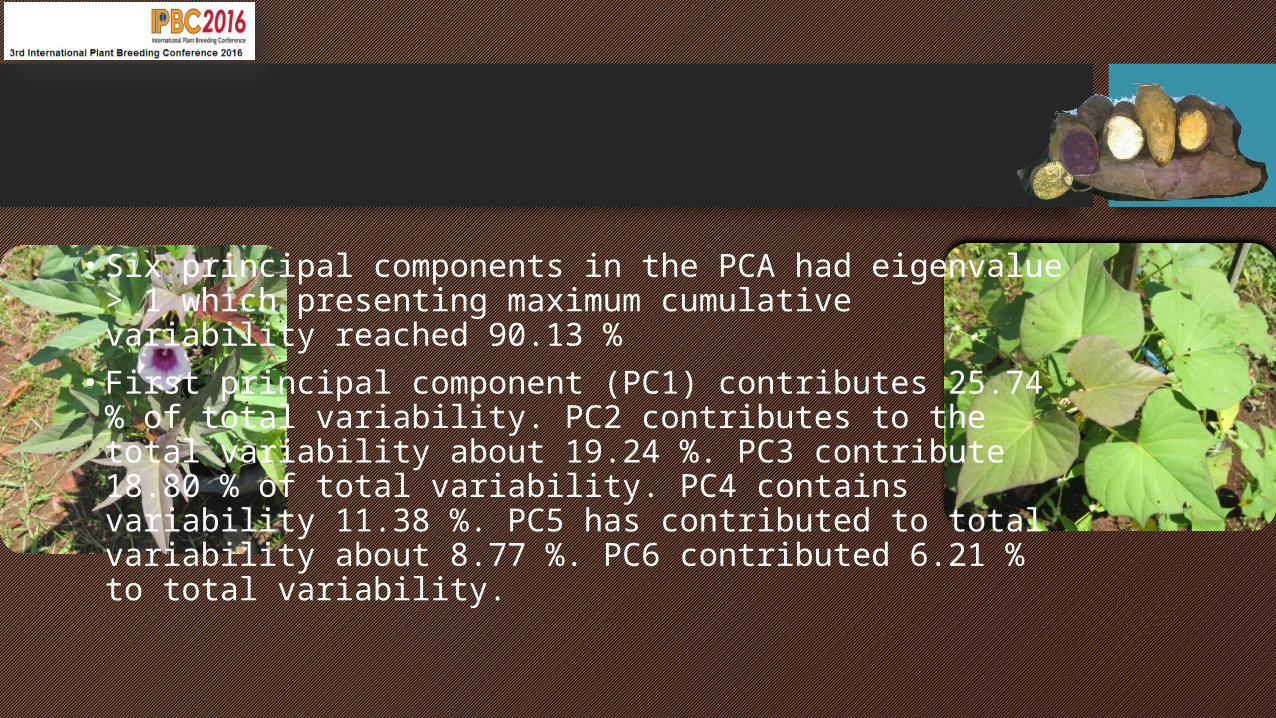
• Six principal components in the PCA had eigenvalue > 1 which presenting maximum cumulative variability reached 90.13 % • First principal component (PC1) contributes 25.74 % of total
variability. PC2 contributes to the total variability about 19.24 %. PC3 contribute 18.80 % of total variability. PC4 contains variability 11.38 %. PC5 has contributed to total variability about 8.77 %. PC6 contributed 6.21 % to total variability.
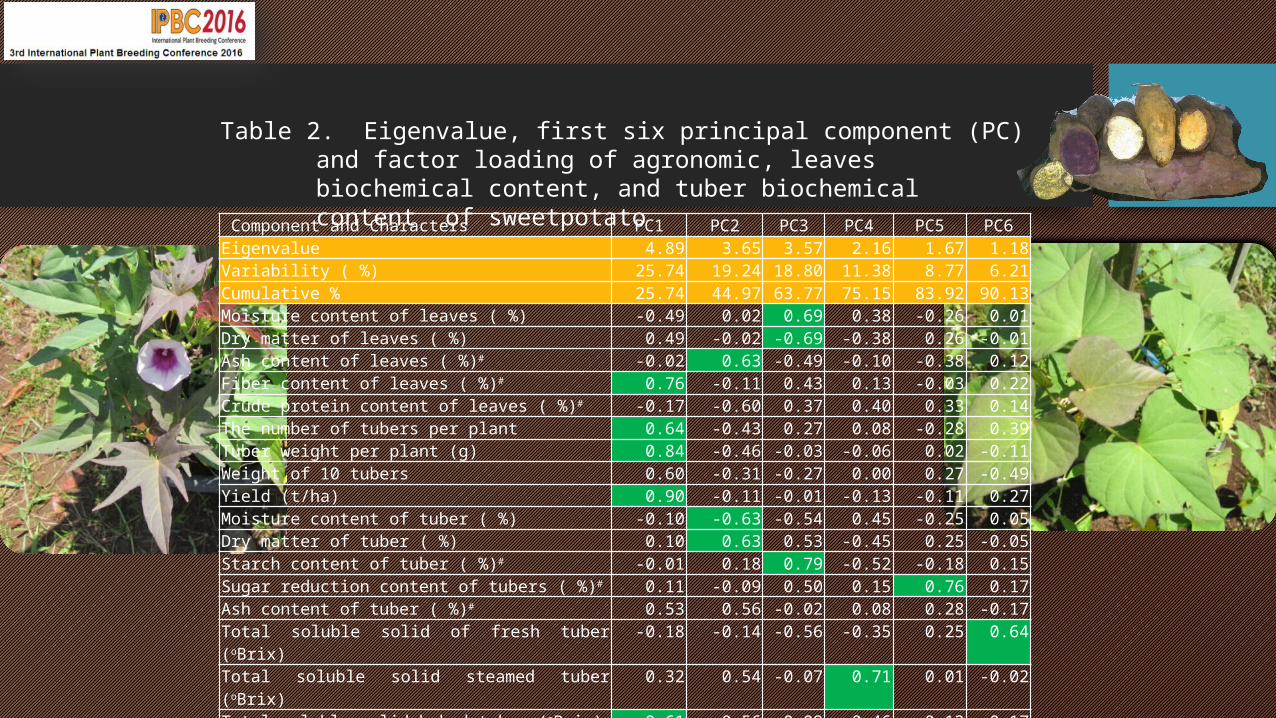
Component and Characters PC1 PC2 PC3 PC4 PC5 PC6Eigenvalue 4.89 3.65 3.57 2.16 1.67 1.18Variability ( %) 25.74 19.24 18.80 11.38 8.77 6.21Cumulative % 25.74 44.97 63.77 75.15 83.92 90.13Moisture content of leaves ( %) -0.49 0.02 0.69 0.38 -0.26 0.01Dry matter of leaves ( %) 0.49 -0.02 -0.69 -0.38 0.26 -0.01Ash content of leaves ( %)# -0.02 0.63 -0.49 -0.10 -0.38 0.12Fiber content of leaves ( %)# 0.76 -0.11 0.43 0.13 -0.03 0.22Crude protein content of leaves ( %)# -0.17 -0.60 0.37 0.40 0.33 0.14The number of tubers per plant 0.64 -0.43 0.27 0.08 -0.28 0.39Tuber weight per plant (g) 0.84 -0.46 -0.03 -0.06 0.02 -0.11Weight of 10 tubers 0.60 -0.31 -0.27 0.00 0.27 -0.49Yield (t/ha) 0.90 -0.11 -0.01 -0.13 -0.11 0.27Moisture content of tuber ( %) -0.10 -0.63 -0.54 0.45 -0.25 0.05Dry matter of tuber ( %) 0.10 0.63 0.53 -0.45 0.25 -0.05Starch content of tuber ( %)# -0.01 0.18 0.79 -0.52 -0.18 0.15Sugar reduction content of tubers ( %)# 0.11 -0.09 0.50 0.15 0.76 0.17Ash content of tuber ( %)# 0.53 0.56 -0.02 0.08 0.28 -0.17Total soluble solid of fresh tuber (oBrix) -0.18 -0.14 -0.56 -0.35 0.25 0.64Total soluble solid steamed tuber (oBrix) 0.32 0.54 -0.07 0.71 0.01 -0.02Total soluble solid baked tuber (oBrix) 0.61 0.56 -0.09 0.46 0.12 0.17Specific gravity -0.19 0.75 -0.30 0.32 0.12 0.28Ethanol yield (l/ha) 0.81 0.20 0.24 -0.02 -0.46 -0.10
Table 2. Eigenvalue, first six principal component (PC) and factor loading of agronomic, leaves biochemical content, and tuber biochemical content of sweetpotato
• That sweet potato has variability in characters that can be utilized by industry. • Genetic variability is the basis for an increase in
production capacity for the industry that is based on true varieties. • Opportunities for improvement in the character of
sweet potatoes to be used as industrial raw materials for food, feed and renewable energy sources is very large
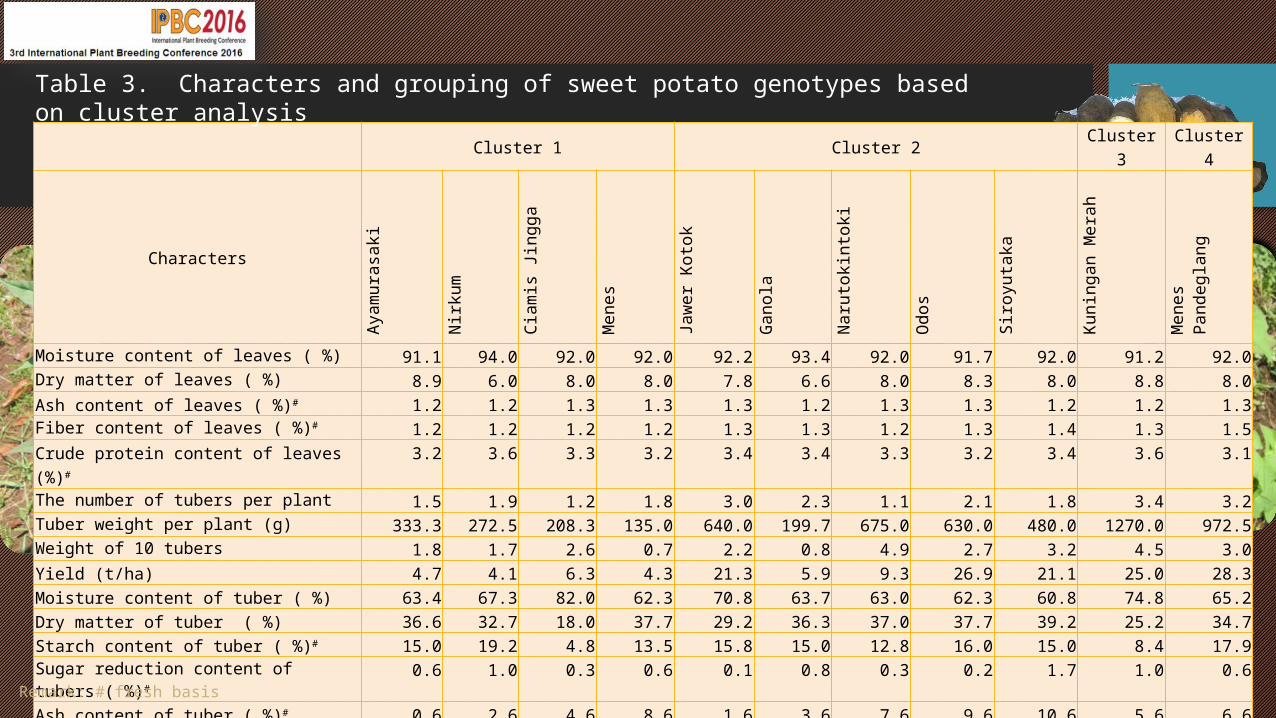
• The 11 sweetpotato genotypes based on 19 characters were classified in four groups • Cluster 1 contained four genotypes namely Ayamurasaki,
Nirkum, Ciamis Jingga, and Menes• Cluster 2 was composed five genotypes that were Jawer
Kotok, Ganola, Narutokintoki, Odos, and Shiroyutaka• Cluster 3 included one genotype, which is Kuningan Merah. • Cluster 4 has one genotype namely Menes Pandeglang.
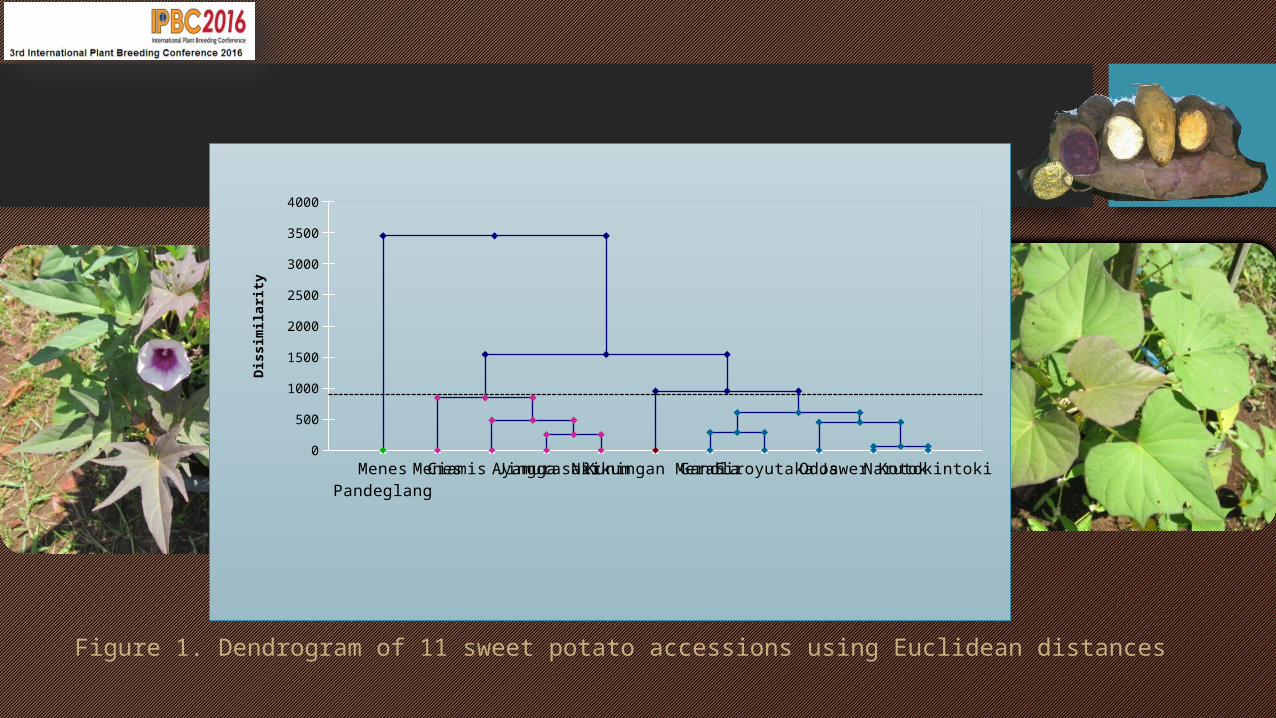
Figure 1. Dendrogram of 11 sweet potato accessions using Euclidean distances
0
500
1000
1500
2000
2500
3000
3500
4000
Menes PandeglangMenesCiamis JinggaAyamurasakiNirkumKuningan MerahGanolaSiroyutakaOdosJawer KotokNarutokintoki
Dis
sim
ilarit
y
Cluster 1 Cluster 2 Cluster 3 Cluster 4
CharactersAyamurasaki
Nirkum
Ciamis Jingga Menes
Jawer Kotok Ganola
Narutokintoki Odos
Siroyutaka
Kuningan Merah
Menes Pandeglang
Moisture content of leaves ( %) 91.1 94.0 92.0 92.0 92.2 93.4 92.0 91.7 92.0 91.2 92.0Dry matter of leaves ( %) 8.9 6.0 8.0 8.0 7.8 6.6 8.0 8.3 8.0 8.8 8.0Ash content of leaves ( %)# 1.2 1.2 1.3 1.3 1.3 1.2 1.3 1.3 1.2 1.2 1.3Fiber content of leaves ( %)# 1.2 1.2 1.2 1.2 1.3 1.3 1.2 1.3 1.4 1.3 1.5Crude protein content of leaves (%)# 3.2 3.6 3.3 3.2 3.4 3.4 3.3 3.2 3.4 3.6 3.1The number of tubers per plant 1.5 1.9 1.2 1.8 3.0 2.3 1.1 2.1 1.8 3.4 3.2Tuber weight per plant (g) 333.3 272.5 208.3 135.0 640.0 199.7 675.0 630.0 480.0 1270.0 972.5Weight of 10 tubers 1.8 1.7 2.6 0.7 2.2 0.8 4.9 2.7 3.2 4.5 3.0Yield (t/ha) 4.7 4.1 6.3 4.3 21.3 5.9 9.3 26.9 21.1 25.0 28.3Moisture content of tuber ( %) 63.4 67.3 82.0 62.3 70.8 63.7 63.0 62.3 60.8 74.8 65.2Dry matter of tuber ( %) 36.6 32.7 18.0 37.7 29.2 36.3 37.0 37.7 39.2 25.2 34.7Starch content of tuber ( %)# 15.0 19.2 4.8 13.5 15.8 15.0 12.8 16.0 15.0 8.4 17.9Sugar reduction content of tubers ( %)#
0.6 1.0 0.3 0.6 0.1 0.8 0.3 0.2 1.7 1.0 0.6
Ash content of tuber ( %)# 0.6 2.6 4.6 8.6 1.6 3.6 7.6 9.6 10.6 5.6 6.6Total soluble solid of fresh tuber (oBrix) 5.0 2.8 4.0 2.5 4.0 2.0 1.5 4.5 3.8 3.5 1.5Total soluble solid steamed tuber (oBrix)
5.9 4.2 10.5 10.8 6.2 16.0 10.2 10.5 9.7 10.8 10.0
Total soluble solid baked tuber (oBrix) 9.0 6.0 10.7 10.6 9.0 14.9 11.0 13.5 13.1 12.3 12.3Specific gravity 1.0 1.0 1.0 1.0 1.0 1.1 1.0 1.1 1.0 1.0 1.0Ethanol yield (l/ha) 618.7 861.8 1212.0 1730.7 2685.3 2349.0 2637.5 3108.9 2292.8 2104.6 5364.5
Table 3. Characters and grouping of sweet potato genotypes based on cluster analysis
Remark: # fresh basis
• Genotypes that are in the same cluster show the closeness of the relationship. • Genotypes that are in different clusters showed most of the
characters were observed to have a different appearance. • For industrial use, genotypes that are in the same cluster
can be used as a complement to meet the needs of industrial raw materials, sources of food, or feed. • Genotypes that are in different clusters demonstrate the
potential use of raw materials for different purposes, and can be used as the basis for new businesses based on the specific character identifier genotype.
• There was variability in fiber content of leaves, number of tuber per plant, tuber weight per plant, tuber yield, degree of sweetness baked tuber and bioethanol yield, ash content of leaves, protein content of leaves, moisture of tuber, dry matter of tuber and specific gravity of tuber, moisture of leaves, dry matter of leaves and starch content of tuber, sweetness of steamed tuber, reduction sugar content of tuber and degree of sweetness fresh tuber. Genotypes divided into four groups.
CONCLUSION
Thank You