Embed Size (px)
Citation preview
WP4 Webinar 17/03/2016 I page 1 www.grow-smarter.eu WP4 Webinar I 21/04/16 I page 1 www.grow-smarter.eu
THE GROWSMARTER PROJECT
2015-2019
Evaluation of the charging points installed in
Barcelona
Jaume Roca, CENIT
WP4 Webinar 17/03/2016 I page 2 www.grow-smarter.eu
1. Existing charging points in the city of Barcelona
2. Increase of the network of fast chargers
3. Evaluation of the increase of energy use
Index
WP4 Webinar 17/03/2016 I page 3 www.grow-smarter.eu
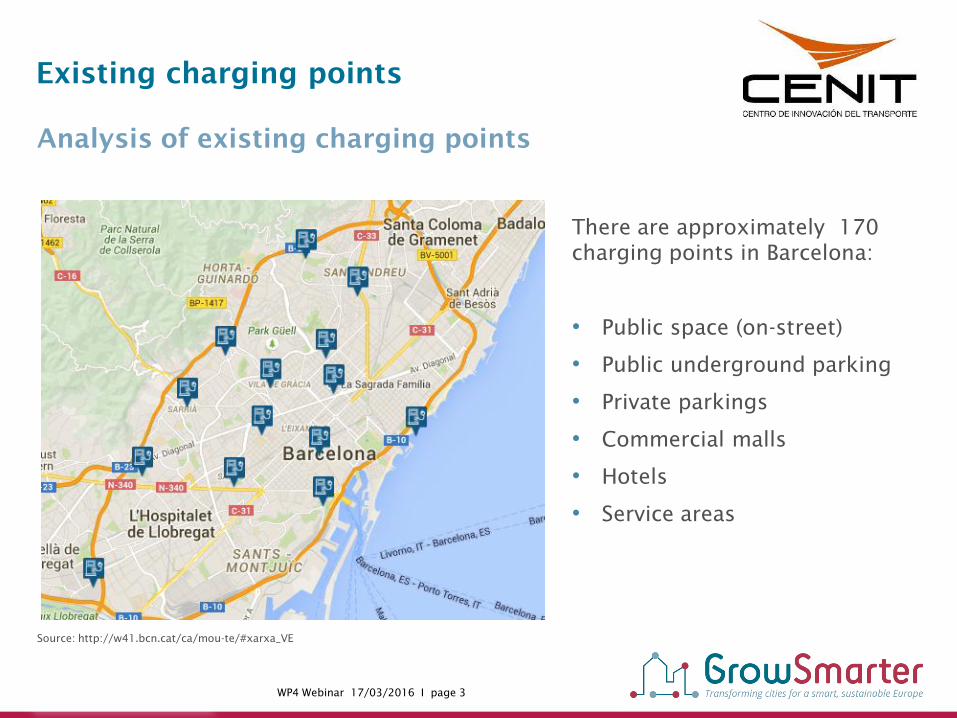
Existing charging points
Analysis of existing charging points
There are approximately 170
charging points in Barcelona:
• Public space (on-street)
• Public underground parking
• Private parkings
• Commercial malls
• Hotels
• Service areas
Source: http://w41.bcn.cat/ca/mou-te/#xarxa_VE
WP4 Webinar 17/03/2016 I page 4 www.grow-smarter.eu
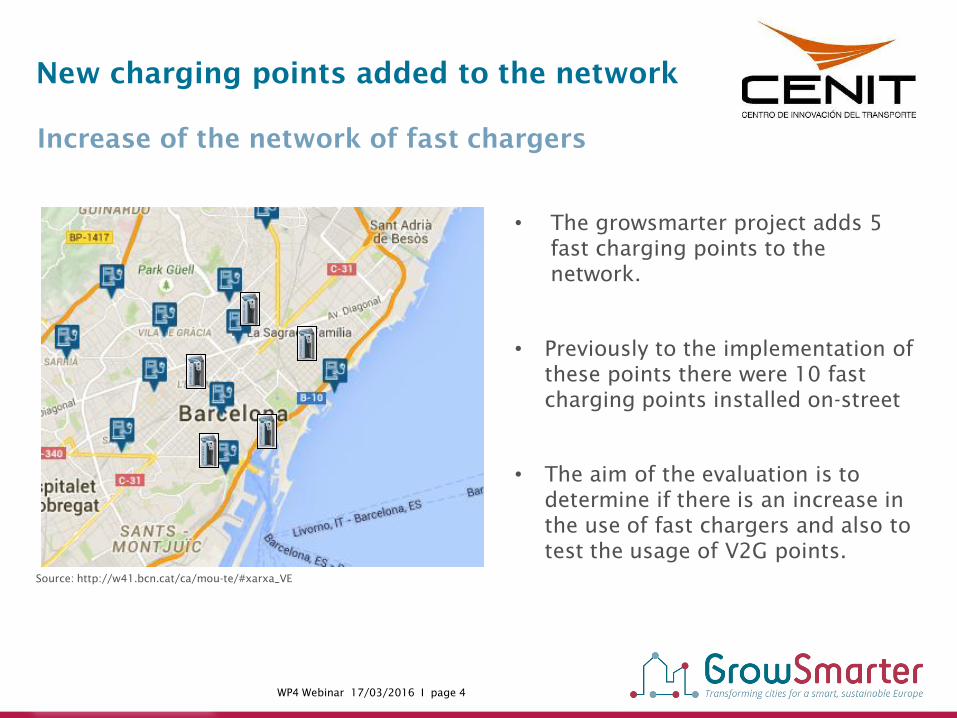
New charging points added to the network
• The growsmarter project adds 5
fast charging points to the
network.
• Previously to the implementation of
these points there were 10 fast
charging points installed on-street
• The aim of the evaluation is to
determine if there is an increase in
the use of fast chargers and also to
test the usage of V2G points.
Increase of the network of fast chargers
Source: http://w41.bcn.cat/ca/mou-te/#xarxa_VE

WP4 Webinar 17/03/2016 I page 5 www.grow-smarter.eu
Baseline indicators
Baseline indicators will be needed in order to have a reference to compare with
the data gathered during the project
• Number of EV users before the Growsmarter project started. This can be
known through the registration of EV’s at the municipality of Barcelona
• Number of existing charging points in the city, differentiating normal and
fast charging stations
• Number of charging events and energy charged before the Growsmarter
project
Evaluation of the increase of energy use
We will assume that all EV’s owners would have done the same trips with
fossil-fueled vehicles, so that this change has a direct impact on the
reduction of CO2 emissions
WP4 Webinar 17/03/2016 I page 6 www.grow-smarter.eu
Evaluation of the increase of energy use
In Growsmarter, we will evaluate if there is a real
increase in the use of the fast charging mode
Two types of indicators:
• Use of the charging points and EV users:
Number of EV users, number of charging points, charging events, daily average
charge and discharge (kWh per session), total charging time per day, daily
electricity charged. We will compare these indicators to the ones obtained from
the existing fast charging points.
• Reduction of CO2 at a city level:
Total estimated reduction of emissions.
To calculate the reduction of emissions, we will monitor the use of the
growsmarter charging points plus all existing fast charging points, to see if
there is a real increase in the use and therefore a decrease in the CO2 emissions.
This number will not be exact since we do not know if this increase is due to an
increase in use of EV’s or just a shift in the way of charging the vehicle.

WP4 Webinar 17/03/2016 I page 7 www.grow-smarter.eu
Get the latest updates by signing up online!
This project has received funding from the European Union’s Horizon 2020 research and innovation programme under grant
agreement no 646456. The sole responsibility for the content of this presentation lies with the GrowSmarter project and in no way
reflects the views of the European Union.
Jaume Roca
Thanks for your attention

WP4 Webinar 17/03/2016 I page 8 www.grow-smarter.eu