Embed Size (px)
Citation preview

1
2014/1393 Afghanistan Presidential Election Poll Methodology Report Wave 1
Overview
From November 27 through December 3, 2013, a team of 155 trained interviewers (74 women and 81
men) conducted face-to-face interviews with Afghans who are likely to vote in the presidential election
on April 5, 2014. The survey was planned to be conducted among 2500 respondents; after completing
the data cleaning process, 2148 interviews were included in the analysis. Fieldwork for the survey was
conducted by the Kabul-based, Afghan owned and managed Asia Innovative Research and
Communication (AIRC).
The questionnaire included 61 questions (including each item in batteries of questions) in addition to
demographic questions. The mean interview length was 27 minutes; the median length was 25 minutes.
Likely voters were determined by asking respondents three questions at the beginning of the survey.
These three questions are provided in the box below.
Questions Used to Determine Likely Voters
(Interviewer instructions are in capital letters and parentheses)
S1. First, do you currently have a voter registration card? 1. Yes 2. No 3. Not sure [DO NOT READ] 4. Prefer not to answer [DO NOT READ]
[IF S1=2, 3, OR 4, ASK:] S2. Do you plan to register to vote so that you can vote in the presidential election in April?
1. Yes 2. No 3. Don’t know/not sure [DO NOT READ] 4. Prefer not to answer [DO NOT READ]
[IF S2=2, DO NOT INTERVIEW]
S3. Will you definitely vote for president in April, probably vote, or will you not vote?
1. Definitely vote 2. Probably vote 3. Will not vote 4. Don’t know/not sure [DO NOT READ] 5. Prefer not to answer [DO NOT READ]
[IF S3=3, DO NOT INTERVIEW] [IF S1=3-4 &S2=3-4 &S3=4-5, DO NOT INTERVIEW]

2
The survey included both urban and village (rural) respondents in all provinces of Afghanistan. The
Sharwali (municipal administration in Afghanistan) defines the urban population as those living within
municipal limits. By default, the rural population comprises those who are living outside the municipal
limits.
The country consists of 34 provinces that have been divided into four regions as indicated below.
Provinces by Regions
North South East West
Badakshan Daykundi Bamyan Badghis
Baghlan Helmand Ghazni Farah Balkh Kandahar Kabul Ghor
Faryab Urozgan Kapisa Herat Jawzjan Zabul Khost Nimroz
Kunduz
Kunar
Samangan
Laghman
Sar-e-Pul
Logar
Takhar
Nangarhar
Nuristan
Paktika
Paktya
Panjsher
Parwan
Wardak
The sample was allocated by province proportionate to the country’s total population. Next, the sample
was distributed to district populations. Thenumberof districts hasfluctuated over theyears, but
therearecurrently402 districts.
The systematic sampling error is ±2.11%, based on a 95% confidence level. However, there is also an
additional random (stochastic) error owing to the high replacement of sampling points. This error is very
difficult to measure, and should take into account historical responses from replacement areas, which
are unavailable. Thus, the reader should note that the systematic error alone is an underestimation of
the true error.
Selection of sampling and starting points Each district represented a primary sampling unit (PSU). The number of districts selected in each
province was proportionate to the respective provincial population. The districts were then randomly
selected using “probability proportional to size” (PPS) so that each district or PSU, regardless of
population, has the same probability of being sampled. Approximately 10 interviews were attempted

3
per starting point. After data cleaning, the mean number of interviews in the final data set per sampling
point was nine.
The villages or settlements within districts were randomly selected from a list of villages developed (1)
from information available from the Afghan Central Statistics Office (CSO)1; (2) by the AIRC project
director using his extensive knowledge of the country; and, (3) from input from AIRC staff.A simple
random selection process was used to select villages. Population figures are not available to select the
villages proportionate to district populations.
The simple random selection process consisted of listing villages in each district and numbering them.
Using a random number chart, a random number was selected. The village that matched the random
number was the secondary sampling unit.
Within villages, starting points were determined depending on the village size. In villages with fewer
than 50 residences,2 the total number of residences was divided by the village sample size to determine
a sampling interval. The starting residence was determined by randomly selecting a number from a
random number chart. (Note that each interviewer possessed a random number chart and was trained
to use it.) This process was used to ensure that all residences in the village had a chance of random
selection including those that were, for example, on the outskirts of the village.
In villages with more than 50 residences, a list of at least three starting points was made. Starting points
were recognizable locations such as mosques, schools, or bazaarswithin the settlements selected for the
survey. The starting point was then randomly selected using the random number chart. The purpose of
random selection was to avoid using similar starting points, such as mosques, in each village.
Similarly, in urban areas, starting points were recognizable locations such as mosques, schools, or
bazaars.A list of starting points was developed by the AIRC project director and provided to
interviewers. Interviewers then randomly selected the starting point from the list using a random
number generator.
Gender issues
Each province was allocated approximately 60% male and 40% female respondents. This ratio was based
on the ratio of male to female registered votersas reported by the Afghanistan Independent Election
Commission (IEC) at the time of survey fielding. Although these registration numbers could be
inaccurate, previous election information indicates that males will vote in higher numbers than females.
Additionally, cultural practices in which women tend to have limited access to public discourse such as
voting also discourage women from voting. Thus, a higher proportion of males was sampled to avoid
over-sampling females.
1http://cso.gov.af/en/page/3897/6449
2 The number “50” was chosen because it is a manageable number for interviewers to use. Approximations were
made. When an interviewer was unsure, a village elder was consulted to ensure that all residences were considered.

4
Sample substitutions During the fieldwork of this survey, there were restrictions on the movement of some survey
researchers due to security concerns which made it impossible to reach some of the districts identified
through the random sampling process. This limitation and restriction forced the field administration to
replace sampling points from those insecure areas to more secure areas. Thus, 15% (36 of 236 sampling
points)were replaced by selecting other primary sampling units(PSUs) in the same region. The closest
secure PSUwas used.3 The replaced sampling points are provided on the chart below.
Replaced Sampling Points
Region Province Replaced
sampling point Sampling point replacement4
North Baghlan Pul-i-Hesar Andarab
North Baghlan Dehe Salah Khenjan
North Balkh Zaree ChaharKint
North Balkh Charbolak Kaldar
North Balkh Chamtal Khilam
North Faryab Dawlat Abad Andkhoy
North Faryab Balcheragh Dawlat Abad
North Faryab
Garziwan Khwaja Sabs PoshteWalit
North Faryab Almar Qaramqool
North Jawzjan Qarqin Aqcha
North Jawzjan Darzab Khanaqa
North Kunduz Qala-i-Zal Ali Abad
North Kunduz Char Darah Imam Sahib
North Sari Pul/Sar-e-Pul Balkhab Sayiad
South Helmand Nawzad RegeKhanshin
South Zabul Shinkai Ataghar
South Zabul Daichopan Qalat
East Bamyan Waras (2) Shibar (2)
East Ghazni Rashidan Jaghato
East Ghazni Ajrestam Khwaja Omari
East Khost Tanai Mandozi
East Kunar Nari Provincial Center
East Kunar Noor Gul Narang
East Kunar DarehPech Shigal
3 Details of security concerns in each substituted PSU will be recorded and reported in Wave 2. In Wave 1, AIRC’s
director determined which PSUs he felt uncomfortable sending interviewers for their safety. Glevum Associates has worked extensively with AIRC in the past five years and found his assessments reliable. However, this detailed information will be available in Wave 2.

5
East Laghman DawlatShah Alisheng
East Nangarhar Muhmanddara PachirWagan
East Paktya Zurmat Jaji
East Paktika Surubi Nika
West Badghis Jawand (2) Qalae (2)
West Farah Bakwa Posht Rod
West Ghor Tolak Charsada
West Ghor Pasaband Duleena
West Herat Kohsan Adreskan
West Herat Kishk-I-kahna Zendajan
Household Selection
In urban areas and in villages with more than 50 residences, interviewers stood north in front of the
given starting point. S/he then used the “spin the pen” method in which an interviewer spins a pen on a
flat surface to determine which direction to proceed. Looking in the direction in which the pen pointed,
the interviewer then selected the street/lane closest to his/her right. The interviewer then estimated
the number of residences on his/her route. The number of residences was then divided by 10 (the
number of interviews per sampling point) to determine the sample interval (the nth house that is
selected). Further, a random number chart was used to select the first contacted household. From then
on, the selected household was each nth inhabitable house (as determined by the interval) on the right
side of the interviewer route.
Interviewers followed the street on the right side until the assigned number of interviews were
obtained. If an inadequate number of houses was available on the route and the street ended, the
interviewer crossed the street. If the interviewer needed interviews after crossing the street and going
up the left hand side, s/he would re-select a direction at the starting point and follow the same
procedures.
In blocks-of-flats, the selection routine was each 5th apartment. Further, in buildings with more than
one household, no more than two households were interviewed.
In villages with 50 or fewer residences, interviewers counted the number of inhabitable houses starting
at the north end of the village. The interviewer determined the sampling interval – the number of
houses between each house selected for an interview –by dividing the number of residences by the
number of interviews needed. To determine which house with which to begin, interviewers used the
random number chart. The interviewer began at the north end of the village and counted houses until
s/he found the nth house as determined by the random number chart. If, for example, the number 10
was selected in a village with 40 houses, interviewers would count to the 10th house from the most
northern point in the village.

6
Respondent Selection
After selecting a household, interviewers were instructed to utilize a Kish-grid for randomizing the target
respondent within the household. Members of the household were listed with their names and age in
descending order. The Kishgrid provided a random selection criteria based on which visit the household
represents in his or her random walk and the number of inhabitants living in the household.
Respondent Substitution
Under no circumstances were interviewers allowed to substitute an alternate member of a household
for the selected respondent. If the respondent refused to participate or was not available after call-
backs, the interviewer then moved on to the next household according to the random walk.
Callbacks (rate, method, and results) Typically interviewers were required to make two call-backs before replacing the designated
respondent. These call-backs are made at different times of the same day or on different days of the
field period, in order to provide a broader schedule in which to engage the respondent. Due to security-
related concerns, the field workers have had difficulty meeting the requirement of two call-backs prior
to substitution in many rural areas.
In this survey, while interviewers were able to complete some call-backs, the majority of the interviews
were completed on the first attempt.
• First attempt = 94%,
• Second attempt = 5%
• Third attempt = 1%
Due to the high rate of unemployment, women being at home, and choosing the appropriate time of
day for interviewing, completion on the first attempt is common in Afghanistan.
Training Interviewers A team of 155 interviewers conducted the face-to-face interviews. Interviewers were selected by the
AIRC director primarily based on (1) prior work experience with AIRC and (2) his extensive personal
relationships.5
The first extensive training session with supervisors washeld in Kabul in earlyNovember with a core of 20
supervisors. At the end of the 3-day training session, each supervisor conducted a monitored mock
interview in the office and was further assigned to conduct a pilot interview in the field. The agenda for
this training session is provided in Appendix A.
5 Dr. Hafizullah Omar, AIRC Director, is a medical doctor who graduated from Kabul University. He has extensive
relationships with medical and public health professionals throughout the country in addition to a network of personal contacts as is customary among Afghans.

7
Another training session was held in Kabul in mid-November and supervisors then organized their own
training sessions with the interviewers. The briefings on the main questions of both Dari and Pashto field
questionnaires were conducted by Dr. Hafizullah Omar, AIRC research director.
Issues emphasized during training were:
• Purpose of the project
• Interviewer best practices
• Survey methodology (random selection)
• Record keeping
• Quality control
• Questionnaire content
• Screening for likely voters.
Mock interviews were conducted indoors amongst the interviewers themselves to get a better
understanding of the logic and concept of the questions. Field interviews were conducted outdoors with
randomly selected Afghans so the interviewers could learn how to interact with respondents and to
have the team receive hands-on experience of interviewing the respondents.
Refusals/Non-Contacts/Completed Interviews A summary of interview results is provided below. The “RR1” response rate as defined in the “Standard
Definitions” by the American Association of Public Opinion Researchers is 74%.RR1 by province,
interviewer, and village is provided in Appendix C.
Summary of Interview Results
Result Category Number % of Category
Eligible, partial interview
Respondent break-off 95 2.19%
Head of household break-off 20 0.46%
Language problem 1 0.02%
Other 6 0.14%
Sub-Total 122 2.81%
Unknown eligibility, non-interview
No one at home after three visits 110 2.3%
Unable to reach housing unit 42 0.97%
Respondent mentally or physically unable to be interviewed
5 0.12%
Language problem 3 0.07%
Respondent refused, eligibility unknown 288 6.64%
Head of household refused for respondent 184 4.24%
Sub-Total 632 14.56%

8
Ineligible
Was not a likely voter 1438 33.13%
Completed Interviews 2148 49.49%
Total Contact Attempts 4648 100.00%
Quality Control Methods
After the interviewers returned from the field with the questionnaires, the completed questionnaires
were checked for proper administration and the household and respondent selections were reviewed.
Seventy-seven survey team leaders, field supervisors and AIRC HQ staff observed the interviewers’ work
through direct or indirect supervision. When there was no opportunity for direct supervision, a
supervisor and assistant supervisor revisited selected houses after the completion of interviews or called
back, if there was a working telephone at the household.
Quality Control %
Checked at time of interview 18
Checked personally by supervisor 17
Checked at HQ 9
Interviews checked 44
Data cleaning Data cleaning is the process of removing cases with any irregularities from the final data file. An irregularity includes respondents who received more than two questions incorrectly or answered more than half of the survey questions as don’t know or prefer not to answer. The cleaned data file includes 2,148 cases.6
Data cleaning is particularly needed when in-person surveys are conducted on paper. This data collection method is more prone to error than, for example, a telephone survey in which interviewers use a computer. The survey total of 2,148 is well within the required minimum 2,050 cleaned cases.
Issues with specific interviewers and specific questions will be addressed during training for Wave 2. However, errors were not concentrated in a particular geographic area but were spread across the data which suggests normal error.
6Data cleaning is particularly needed when in-person surveys are conducted on paper. This data collection method
is more prone to error than, for example, a telephone survey in which interviewers use a computer. The survey total of 2,148 is well within the required minimum 2,050 cleaned cases.

9
Weighting The data set includes a weight to adjust for over-sampling and under-sampling at the provincial level.
The data was weighted to be representative of national population distribution according to the
population statistics available from the Afghan Central Statistics Office. A weighting report is provided in
Appendix B.

10
Geographicaldemographics (unweighted)
Region
N=2148 %
North 29
South 13
East 45
West 13
Total 100
Urban/rural
N=2148 %
Urban 25
Rural 75
Total 100
Gender
N= 2148 %
Male 60
Female 40
Total 100
Province
N= 2148 %
Kabul 14.9
Herat 6.2
Balkh 5.7
Nangarhar 4.9
Kandahar 4.6
Ghazni 4.1
Takhar 4.1
Baghlan 3.9
Faryab 3.8
Badakshan 3.6

11
Kunduz 3.3
Helmand 3.3
Parwan 2.7
Wardak 2.6
Ghor 2.5
Juzjan 2.3
Paktya 2.2
Farah 2.0
Daykundi 2.0
Khost 1.9
Laghman 1.9
Kunar 1.9
Kapisa 1.8
Paktika 1.7
Badghis 1.7
Logar 1.6
Sare-e-Pul 1.6
Urozgan 1.5
Bamyan 1.4
Samangan 1.2
Zabul 1.2
Nimroz 0.7
Nooristan 0.6
Panjsher 0.6
Total 100

12
Appendix A
Below is an agenda from a training session.
10 Nov. (Sunday)
9 am to 4 pm
Training Supervisors (Day 1)
9 am – 12 pm:
Project summary
Review questionnaire
12 pm – 1 pm: Lunch
1 pm- 4 pm:
Interviewing “best practices”
PROJECT SUMMARY
1. Overall project goals
a. To better understand the opinions of Afghans who are likely to vote in the 2014
presidential election.
b. To obtain a representative sample which means that if the selection of interviewees is
done correctly, we can closely predict the outcome of the election.
c. Data collection will begin soon after the list of candidates is provided by the Afghan
government (scheduled for 19 Nov). The second survey will be fielded in Jan 2014 and
the last one will be fielded in March 2014 and released just prior to the election.
d. To provide information or data collected from the surveys to the media to distribute to
the public.
i. These polls or surveys can be helpful to people during an election. Some people
say that they know how all Afghans think about a subject or issue. These people
can mislead others by convincing them they know the minds of Afghans. In fact,
they do not know and they are often incorrect. Polls provide information that is
collected in a specific manner or way and that accurately reflect Afghans’
opinions.
e. To provide data as quickly as possible.
i. In political campaigns, events happen quickly. For example, a candidate gives an
interview and says something very controversial in it. Or a candidate decides to
withdraw from the presidential race. (There are many possibilities.) This event
happens while we are entering data. The event could change opinions. Because

13
our data was collected before the event and the event could influence voters,
our data will not be relevant.
f. We will know how accurate we have been on Election Day. We want to closely reflect
the actual outcome of the election.
i. Two other research companies are also collecting data. Our data will be
compared to others.
ii. It is very important that we do the best job possible.
2. Specific project goals
a. To field 3 surveys also referred to as 3 waves.
i. The questionnaire will remain the same except:
1. How a person qualifies as a likely voter will change.
2. One or two questions could be added if events occur about which we
need to ask Afghans.
b. To collect 2,500 completed questionnaires from randomly selected, eligible respondents
for each survey or wave from throughout Afghanistan.
c. To collect 2,500 completed questionnaires from randomly selected, eligible respondents
with 5 days (also referred to as data fielding period).
d. To enter all data no more than 2 days after the data fielding period ends.
3. Eligible respondents
a. We are only interested in talking to eligible voters which means Afghans who will vote in
the election.
i. There are a lot of reasons why someone does not vote.
ii. We are not interested in why someone does not intend to vote. We are only
interested in whether someone is going to vote.
b. The first 3 questions ask interviewees about voting. Answers to these questions
determine whether someone is a “likely voter.”
4. Keys to good research
a. Many procedures are used to decide how to select people to interview for this project.
i. These procedures are a combination of mathematical calculations and practices
that have been developed and tested over the past 75 years.
b. It is important for the procedures to be followed, even if they do not make sense. There
are reasons why we are asking you to follow the steps to select interviewees.
c. The two main factors in good research are random selection (random= no
predetermined method or pattern of selection) and making samples sizes proportional
to populations.
REVIEW QUESTIONNAIRE
Review questionnaire question by question.

14
INTERVIEWING “BEST PRACTICES”
Top 10 “best practices” for interviewers:
1. Read questions as they are written on the questionnaire. All interviewees should be asked all
questions in the same way.
2. Remain neutral. Interviewers must not show or indicate their opinions to interviewees. An
interviewer’s word, gesture or facial expression can influence an interviewee’s response. Avoid
influencing an interviewee’s response.
3. Dress similar to the people they will interview. For example, some interviewees may not feel
comfortable answering questions from a richly dressed interviewer.
4. Only visit dwellings where people live. Do not visit businesses or offices in which people do not
sleep on a daily basis.
5. Make the interviewee feel comfortable. An interviewee who feels comfortable is more likely to
answer questions candidly.
6. Accurately record answers to questions on the questionnaire.
7. Record answers to verbatim questions exactly as they were said by interviewees.
8. Keep accurate records on who was interviewed and results of interviews as provided in training.
9. Follow sampling guidelines. Interview only people selected using the sampling guidelines. The
guidelines are designed to provide a sample that represents all of Afghans. It is based on
mathematical calculations.
10. Be very familiar with the questionnaire.
Interviewing rules
Probing
Probing refers to asking the interviewee to clarify an answer. Probing is needed whenever the interviewer is unsure of the interviewee’s answer. Example: An interviewer asks, “How certain areyou thatyou will vote in Aprilforthe
IMPORTANT!
It is very important to interview the person who is randomly selected using the steps described in this document.
Interviewers sometimes tend to want to choose a person who looks friendly or pleasant to interview. Or interviewers may want to approach a house that requires walking up steep stairs rather than a house that is easily to reach. However, choosing a house or person other than the one randomly selected biases the research results and makes them inaccurate or wrong.
The accuracy of the research results depends on interviewers following the steps outlined here to select whom to interview.

15
president?Areyou absolutelycertain, fairlycertain, ornot certain?” The interviewee answers, “I am certain.” The interviewer does not know whether the interviewee meant absolutely certain or fairly certain. The interviewer should clarify the answer by probing or asking, “Is that absolutely certain or fairly certain?” If an interviewee does not understand the question, do not explain it. If he or she asks what the question means, the interviewer should say, “What do you think it says?” The reason interviewers should not explain the questions is that all interviewees should hear the same question and the same explanations. This is very important.
Scripts
Interviewers will be provided with scripts with sentences and questions that should be used to determine whom to interview.
It is important for interviewers to be relaxed and pleasant. Interviewers can use their own words instead of these scripts if the questions are asked correctly and interviewees respond correctly.
Scripts differ from the questionnaire. Scripts are used to determine whom to ask questions on the questionnaire. Questions on the questionnaire must be asked exactly as they are written.
Refusals
If an interviewee seems reluctant to answer the questions on the questionnaire, be sure that he or she knows that:
Any information that identifies the interviewee will be detached from the questionnaire
answers. No one else will know any of the interviewee’s answers.
The answers from all Afghans will be combined and totaled.
The purpose of the questionnaire is to better understand how Afghans think about the
presidential election.
Afghans throughout the country are being asked these questions.
The interviewee was randomly selected.
We would really appreciate it if he or she could answer a few questions.
He or she can refuse to answer any specific question.
The idea is to gently convince the interviewee to answer the questions.
If the interviewee strongly refuses or refuses after hearing the above information, record the result of the interview (see the section on interview codes) and go to the next household.
Ineligible interviewees

16
Only Afghans who are likely to vote will be interviewed. These interviewees are called “likely voters.” The first three questions on the questionnaire determine if an interviewee is a likely voter.
Follow the instructions on the questionnaires to determine if a person is a likely voter and eligible to answer questions.
If an interviewee is not a likely voter and is ineligible to answer questions, politely indicate that the questions are only for Afghans who intend on voting in the election and that you would like to select another person in the household to interview.
Record that an interviewee was ineligible on the questionnaire.
If more than one other male or female age 18 or older is in the household, use the Kish grid to select whom to interview.
Don’t know
An interviewee may not know the answer to a question. Allow him or her a little time to answer. If he or she does not answer after a couple of minutes, mark the answer as “don’t know” and move on to the next question.
If the interviewee says they don’t know the answer, mark the answer as “don’t know” and move on to the next question.
“Don’t know” differs from “prefer not to answer.” “Don’t know” indicates that the interviewee does not know the answer or does not have an answer or does not know how to respond.
“Prefer not to answer” indicates the interviewee does not want to answer. He or she may have an answer but does not want to share it.
11 Nov. (Monday)
9 am to 4 pm
Training Supervisors (Day 2)
9 am to 12 pm:
Review sample selection steps
12 pm – 1 pm: Lunch
1 pm- 4 pm: Record-keeping requirements
Quality control

17
Sample selection steps
Supervisors will be provided a list of randomly selected landmarks in villages or cities. Interviewers will go to these places and decide specifically whom to interview using the following procedures:
1. Face the front of the landmark. If the front of the landmark cannot be determined, then face
north.
OR
2. Find a flat surface on the ground or on top of papers lying on or near the ground.
3. Place a pen on the flat surface, lying down.
4. Spin the pen and let it stop.
5. Find the first street, road or path with dwellings that is closest to where the tip of the pen is
pointing.
a. If the pen lands equal distance between two roads, select the road that is to your right
as you face the direction in which the pen is pointing.
b. If the pen points toward a large open space or toward a building or other object, choose
the nearest street to your right as you face the direction in which the pen is pointing.
6. As you approach the road that has been selected by spinning the pen, choose the side of the
road that is nearest you. Do not cross the road.
7. Drive or walk along the road, following it without crossing another road. Estimate the number
of dwellings on the road.
8. Approximately 10 interviews should be conducted for each landmark. You will be told the
specific number of interviews needed for your landmarks.
9. Use the random number chart to randomly select a number from 1 to the number of dwellings
counted. Example: If 20 dwellings are estimated to be on the road, choose a random number
between 1 and 20.

18
10. From the landmark, count the number of dwellings using the number that was randomly
selected. Example: The number “6” was randomly selected. Find the 6th house along the route
from the landmark. That dwelling or house will be the first location for interviewing.
11. Choose every other dwelling to approach for interviews as you move away from the landmark.
12. If the road ends or if too few dwellings are along it and more interviews are needed, cross the
street and choose every other dwelling.
13. If more interviews are needed after crossing the road, continue interviewing along the next
closest road. If two roads are about equal distance, choose the road to the north.

19
00000 10097 32533 76520 13586 34673 54876 80959 09117 39292 00001 37542 04805 64894 74296 24805 24037 20636 10402 00822 00002 08422 68953 19645 09303 23209 02560 15953 34764 35080 00003 99019 02529 09376 70715 38311 31165 88676 74397 04436 00004 12807 99970 80157 36147 64032 36653 98951 16877 12171 00005 66065 74717 34072 76850 36697 36170 65813 39885 11199 00006 31060 10805 45571 82406 35303 42614 86799 07439 23403 00007 85269 77602 02051 65692 68665 74818 73053 85247 18623 00008 63573 32135 05325 47048 90553 57548 28468 28709 83491 00009 73796 45753 03529 64778 35808 34282 60935 20344 35273 00010 98520 17767 14905 68607 22109 40558 60970 93433 50500 00011 11805 05431 39808 27732 50725 68248 29405 24201 52775 00012 83452 99634 06288 98083 13746 70078 18475 40610 68711 00013 88685 40200 86507 58401 36766 67951 90364 76493 29609 00014 99594 67348 87517 64969 91826 08928 93785 61368 23478 00015 65481 17674 17468 50950 58047 76974 73039 57186 40218 00016 80124 35635 17727 08015 45318 22374 21115 78253 14385 00017 74350 99817 77402 77214 43236 00210 45521 64237 96286 00018 69916 26803 66252 29148 36936 87203 76621 13990 94400 00019 09893 20505 14225 68514 46427 56788 96297 78822 54382 00020 91499 14523 68479 27686 46162 83554 94750 89923 37089 00021 80336 94598 26940 36858 70297 34135 53140 33340 42050 00022 44104 81949 85157 47954 32979 26575 57600 40881 22222 00023 12550 73742 11100 02040 12860 74697 96644 89439 28707 00024 63606 49329 16505 34484 40219 52563 43651 77082 07207 00025 61196 90446 26457 47774 51924 33729 65394 59593 42582 00026 15474 45266 95270 79953 59367 83848 82396 10118 33211 00027 94557 28573 67897 54387 54622 44431 91190 42592 92927 00028 42481 16213 97344 08721 16868 48767 03071 12059 25701 00029 23523 78317 73208 89837 68935 91416 26252 29663 05522 00030 04493 52494 75246 33824 45862 51025 61962 79335 65337 00031 00549 97654 64051 88159 96119 63896 54692 82391 23287 00032 35963 15307 26898 09354 33351 35462 77974 50024 90103 00033 59808 08391 45427 26842 83609 49700 13021 24892 78565 00034 46058 85236 01390 92286 77281 44077 93910 83647 70617 00035 32179 00597 87379 25241 05567 07007 86743 17157 85394 00036 69234 61406 20117 45204 15956 60000 18743 92423 97118 00037 19565 41430 01758 75379 40419 21585 66674 36806 84962 00038 45155 14938 19476 07246 43667 94543 59047 90033 20826 00039 94864 31994 36168 10851 34888 81553 01540 35456 05014 00040 98086 24826 45240 28404 44999 08896 39094 73407 35441 00041 33185 16232 41941 50949 89435 48581 88695 41994 37548 00042 80951 00406 96382 70774 20151 23387 25016 25298 94624

20
How to use the random number chart 1. Place the chart on a flat surface such as a tablet of paper. 2. Close your eyes and place your finger on a number 3. Open your eyes and look at the number
Example: There are 20 dwellings along a route. A random number is needed to select the house that will be the first interview. The interviewer points to the number “96” on the chart. However, the number must be between 1 and 20 because there are 20 dwellings on the route. Therefore, the number “6” is used because it is the last number in the two digits (“96”).

21
Choosing interviewees within households
After an interviewer has randomly chosen a house, dwelling or residence, the next step is to determine whom to interview within the household.
Only likely voters are being interviewed. The first questions on the questionnaire will determine if an interviewee is a likely voter. However, you must first determine which adult to interview.
We know that a person must be at least 18 years old by April 2014 to be eligible to vote. Do not interview anyone under age 18.
If there is only one person at least age 18 in the household, then that person is selected to be interviewed.
If more than one person at least age 18 is in the household, follow the steps below to determine which person to interview. (Note: The goal is to interview a wide variety of people who are likely to vote. Therefore, we want to select a wide variety of people to interview as opposed to only the heads of household, for example.)
1. Determine how many households reside at the dwelling or compound that was randomly
selected.
a. A household is defined as a family unit that consists of a husband and wife or wives and
unmarried children, if any.
i. Example: A household consists of a grandfather, adult son, son’s wife age 18,
and son’s infant, an unmarried daughter who is 20 years old, and a male,
unmarried nephew age 22 also lives in the house.
How many households in total? Three (3). (1) grandfather and unmarried daughter age 20, (2) adult son, son’s wife age 18, and son’s infant, and (3) male, unmarried nephew age 22. How many households if interviewing only males? Three (3). How many households if interviewing only females? Two (2). Unmarried daughter age 20 and son’s wife age 18.
2. Interview a maximum of two (2) households per residence, address or compound.
a. If there are more than two households at a residence, address, or compound:
i. List the households by assigning each a name.
ii. Number the households starting with “1.”
iii. Use the random number chart to choose two numbers.
iv. Interview members of the households with those two numbers.
3. Use a Kish grid to determine whom to interview in the households.
How to use a Kish grid
22
Every landmark is considered a “cluster.” Ten (10) interviews are typically needed for each cluster. Your supervisor will provide this information.
A Kish grid will be provided for all questionnaires.
1. List males/females living in the household age 18 or older. Include people who sleep there, but
are not there when you visit. Ignore anyone under age 18.
2. The youngest (excluding children under 18) is number 1, the second youngest is number 2, and
so on.
3. The first household where you do an interview is household 1, the second is household 2, and so
on, up to household 10 - the last in the cluster associated with the landmark.
4. Find the column for the household number (1 through 10) and the row for the number of
eligible people (1-10). The number in the cell where the column and row meet is the person to
interview.
a. Example: If household 2 has 3 adults, go to the column with the heading “2” and the
row with the number “3.” (The column and row are circled below) Find where the “3”
column and the “2” row meet. The number 1 is indicated. (Shown below in large, bold
type.) Number 1 should indicate the youngest person at least 18 years old in the
household. Number 1 is who you want to interview.
Respondent unavailable
Every effort must be made to interview the person who was selected using the Kish grid. If the person selected using the Kish grid is not at home or unavailable for an interview:
1. Interviewers should provide information about the visit on the Interviewer Record Form.
2. Interviewers should return to the residence at different times and on different days to try to
obtain an interview
a. Interviewers should visit up to three times to obtain an interview
After three visits, a person within the household can be substituted using the Kish grid.
If no one can be substituted and the respondent is not home after three visits:
1. Interviewers should indicate the reason why the interview was not conducted on the
Interviewer Record Form.
2. Interviewers should go to another household.
In remote areas, if the respondent selected using the Kish grid is not available and the respondent cannot be re-visited, the interviewer should:

23
1. Indicate the reason why the interview could not be conducted on the Interviewer Record Form
(including the respondent’s gender), and,
2. Go to the next household.

24
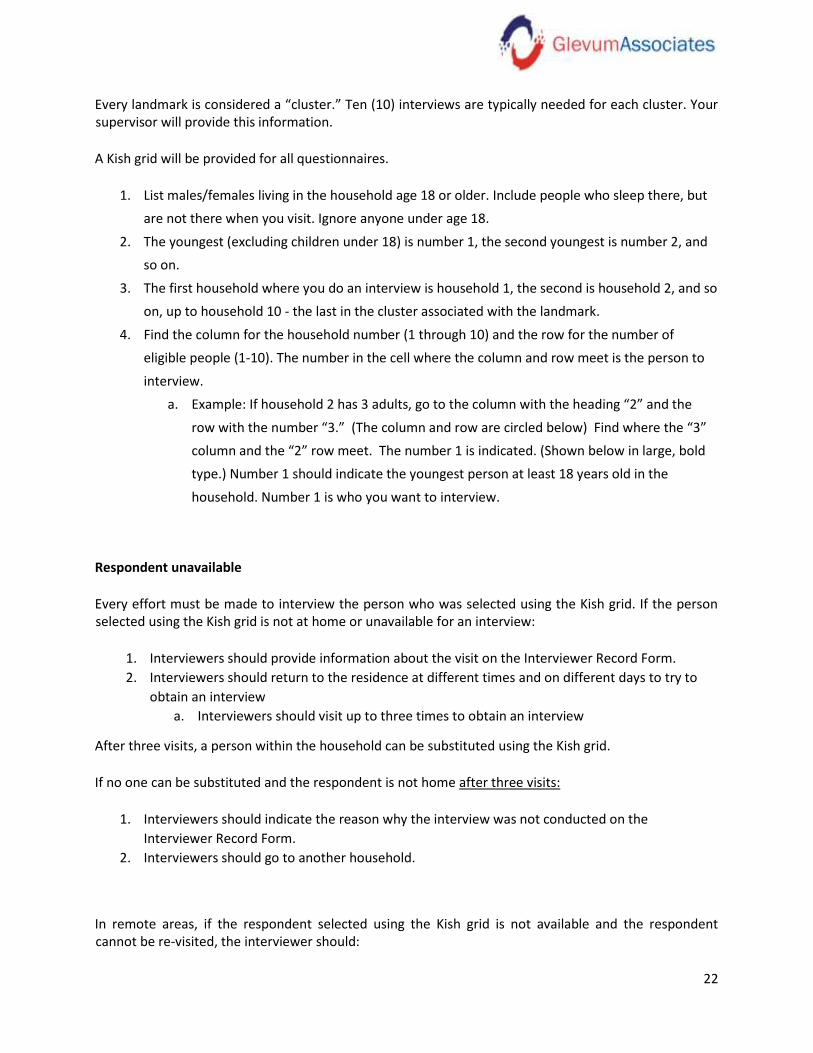
Number of males or females age 18 and older in household
Household number
1 ② 3 4 5 6 7 8 9 10
1 1 1 1 1 1 1 1 1 1 1
2 1 2 1 2 1 2 1 2 1 2
③ 3 1 2 3 1 2 3 1 2 3
4 1 2 3 4 1 2 3 4 1 2
5 1 2 3 4 5 1 2 3 4 5
6 6 1 2 3 4 5 6 1 2 3
7 5 6 7 1 2 3 4 5 6 7
8 1 2 3 4 5 6 7 8 1 2
9 8 9 1 2 3 4 5 6 7 8
10 9 10 1 2 3 4 5 6 7 8
Interviewer record form
Interviewers must keep records about every person they approach for an interview. This form should be attached to the questionnaires. It provides all of the information that is needed.
Review form.
Note: The gender, province, and district of each person who was asked to answer the questionnaire must be recorded.

25
Quality control
Supervisors must review all returned questionnaires including the Interviewer Record Form. If any errors are found, the supervisor must (1) correct mistakes if at all possible, and (2) instruct the interviewer on how to correctly complete the questionnaire and interviewer record form.
The interviewer record form includes interviewees’ addresses and, when available, phone numbers. Supervisors must randomly select 20 percent of interviews and verify that the interviews were conducted.
For example, if interviewers collect 100 surveys, supervisors must verify 20.
Supervisors will complete a Quality Control Form for each interview that is verified.
12 Nov. (Tuesday)
9 am to 4 pm
Training Supervisors (Day 3)
9 am – 12 pm:
Mock interviews: Supervisors will interview and critique each other providing positive feedback as well as items that need to be corrected.
12 pm – 1 pm: Lunch
1 pm – 4 pm:
Pretest: Total of 25 interviews
Supervisors will conduct 25 interviews and record data.

26
Appendix B
Overview of the weighting strategy
The sample was a multi-stage stratified cluster sample. Sample points were allocated in Stage 1 to provinces proportional to the population size of the province. In Stage 2, sample points were allocated to districts proportional to the population size of the district. Interviews were clustered within sampling points.
To accommodate this design, three sets of weights were calculated. One weight is the selection probability weight that used as the initial design weight for calculating non-response adjustment post fielding. It is called BASEWEIGHT on the data file. Another weight, WT1a, includes all respondents—likely voters and unlikely voters—and is a post-stratification weight used for both national and regional level estimates of the total population. The third weight, WT2a, is also a post-stratification weight and includes only likely voters and is used for both national and regional estimates of the likely voter population. Control totals for WT2a were derived from the full sample using WT1a.
The BASEWEIGHT is calculated:
,
= the initial weight for the jth sample member in district i
WT1a and WT2a were both calculated using an iterative proportional fitting algorithm (also known as raking) first proposed by Deming & Stephan (1940). It performs a stepwise adjustment of the BASEWEIGHT to achieve known population margins. The adjustment process was repeated until the difference between the weighted margins of respondents and the known population margins was less than two percentage points. The geo-demographic characteristics used for both post-stratification weights include:
Gender
Urban/rural
Province
Each region was raked separately and then scaled to the region’s proportion of the total population. The population margins for WT1awere taken from the Central Statistics Organization in Afghanistan (http://cso.gov.af/Content/files/Settled%20Population%20by%20Civil%20Division,.pdf). Population margins for WT2a were derived from the full sample using WT1a. The tables below show both the population margins and the resulting weighted margins within each region. Very little weighting was necessary due to the population proportional-to-size appropriation of sampling units and the quotas used for gender.

27
Region 1 Total Population Likely Voters
Population Margins
WT1a Weighted Margins
Population Margins
WT1a Weighted Margins
Gender Male Female
51.09 48.91
51.14 48.86
57.32 42.68
57.31 42.69
Urban/Rural Urban Rural
16.09 83.91
15.45 84.55
18.64 81.36
17.93 82.07
Provinces Badakhshan Baghlan Balkh Faryab Jawzjan Kunarha Samangan Sar-e-Pul Takhar
13.43 12.82 18.48 14.07
7.60 6.36 5.47 7.90
13.86
13.43 12.82 18.48 14.07
7.60 6.36 5.47 7.90
13.86
12.12 13.80 19.54 15.45
7.22 6.30 4.25 5.26
16.06
12.12 13.80 19.54 15.45
7.22 6.30 4.25 5.26
16.06
Region 2 Total Population Likely Voters
Population Margins
WT1a Weighted Margins
Population Margins
WT1a Weighted Margins
Gender Male Female
51.33 48.67
51.33 48.67
59.61 40.39
59.58 40.42
Urban/Rural Urban Rural
15.31 84.69
15.25 84.75
16.34 83.66
16.17 83.83
R2 Provinces Daykundi Helmand Kandahar Urozgan Zabul
14.82 28.45 37.23 10.77
9.36
14.18 28.45 37.23 10.79
9.36
19.09 27.78 33.03 10.17
9.93
19.09 27.78 33.03 10.17
9.93
Region 3 Total Population Likely Voters
Population Margins
WT1a Weighted Margins
Population Margins
WT1a Weighted Margins
Gender Male Female
51.22 48.78
51.22 48.78
55.31 44.69
55.31 44.69
Urban/Rural Urban Rural
32.47 67.53
34.26 65.74
38.29 61.71
40.08 59.92
Provinces Bamyan Ghazni
3.51 9.64
3.51 9.64
3.28 7.50
3.28 7.50

28
Kabul Kapisa Khost Kunduz Laghman Logar Nangarhar Nooristan Paktika Paktya Panjsher Parwan Wardak
32.58 3.46 4.51 7.87 3.50 3.08
11.85 1.16 3.41 4.33 1.21 5.21 4.68
32.58 3.46 4.51 7.87 3.50 3.08
11.85 1.16 3.41 4.33 1.21 5.21 4.68
37.16 3.22 4.18 6.3 4.25 3.45 9.61 1.31 3.73 4.66 1.7 4.88 4.78
37.16 3.22 4.18 6.30 4.25 3.45 9.61
13.1 3.73 4.66 1.70 4.88 4.78
Region 4 Total Population Likely Voters Population
Margins WT1a Weighted
Margins Population
Margins WT1a Weighted
Margins
Gender Male Female
50.90 49.10
50.89 49.11
56.61 43.39
56.61 43.39
Urban/Rural Urban Rural
16.36 83.64
16.49 83.51
18.06 81.94
18.17 81.83
Provinces Badghis Farah Ghor Heart Nimroz
13.30 13.60 18.52 50.17
4.41
13.30 13.60 18.52 50.17
4.41
13.41 17.61 15.45 48.66
4.87
13.41 17.61 15.45 48.66
4.87
Design Effect
Deviations from a simple random sample increase the variance of estimates obtained from the data. The Design Effect is the ratio of the actual variance, under the sampling method and weighting methods actually used, to the variance computed under the assumption of simple random sampling. It varies across characteristics in the survey and will be larger for characteristics where (1) the intraclass correlation increases and/or (2) the covariance between observations and the weights are smaller. The estimated average Design Effect across the screening questions for the full sample was 2.14, which results in an estimated Effective Sample Size of 2,116. The average estimated Design Effect across 5 study variables for the Likely Voters sample was 2.84, which results in an estimated Effective Sample Size of 756.

29
Appendix C
Response Rates
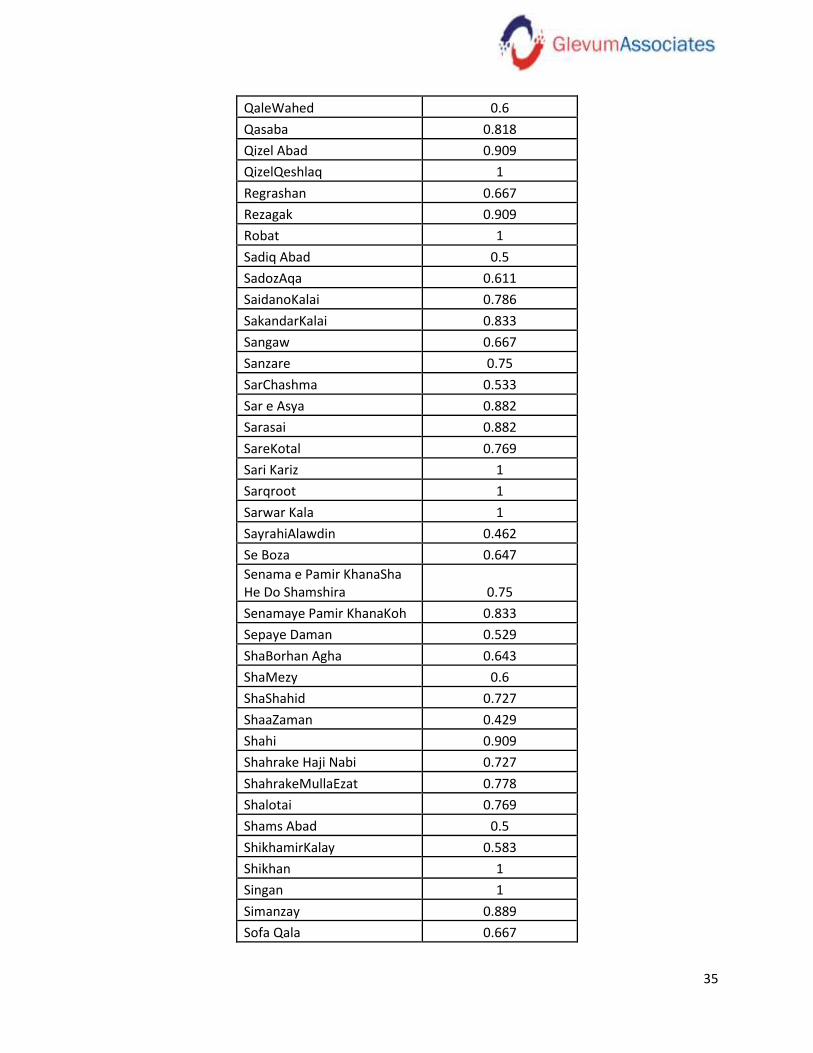
Using the AAPOR definition and RR1 formula for response rate calculations, the response rates for the country, all provinces, regions, villages and interviewers are presented in the following tables.
Afghanistan RR1
Country total 0.74
Provinces RR1
Badakhshan 0.670
Badghis 0.766
Baghlan 0.933
Balkh 0.819
Bamyan 0.554
Daykundi 0.811
Farah 1
Faryab 0.901
Ghazni 0.781
Ghor 0.692
Helmand 0.664
Herat 0.654
Juzjan 0.681
Kabul 0.745
Kandahar 0.632
Kapisa 0.672
Khost 0.755
Kunar 0.727
Kunduz 0.758
Laghman 0.854
Logar 0.85
Nangarhar 0.646
Nimroz 0.75
Nuristan 0.632
Paktia 0.889

30
Paktika 0.923
Panjshir 0.722
Parwan 0.707
Samangan 0.578
Sar-i-Pul 0.515
Takhar 0.978
Uruzghan 0.623
Wardak 0.747
Zabul 0.788
Region RR1
North 0.787
South 0.679
East 0.739
West 0.734
Villages RR1
Ab-e-barkaiGhulaman 0.7
Abdul Hakim 0.643
Abrasani 1
Ahmad Sha Baba Mena 0.778
Akbar Kalai 0.538
AkhawandZadaha 0.75
Ali Abad 0.667
Ali Abad Qala 0.727
Alibaka 0.667
AliliWatan 0.556
Alize 0.556
Andkhoy 1
AngoorBagh 1
Arad Qeshiaq 0.917
ArbabSarwar 1
Astana 0.818
AtarBashee 0.636
Atibolak 0.7

31
Azgari 0.909
Baba Yadgar 0.5
Babar 1
Baghak 1 0.909
Baghak 2 0.769
Baghi 0.737
BagorKhil 0.833
Bahram 0.917
Baland Gar 0.364
Baraky 0.769
Barjak 0.733
Barawaz 1
Bazar 0.667
Bazar-e-Wahdat 0.818
Bazaragay 1
Bazarak 0.722
Changhar 0.692
Char Bacha 0.545
Charahi-e-Qamber 0.909
Charbagh 1
Charmaghzar 0.833
Chena 0.769
Chenargai 0.9
Company Abrasany 0.9
DahaneKaras 1
Dam Kalai 0.625
Dana-e-Koh 0.833
Dar Khan 1
Dara 0.444
Dara-e-Iam 0.786
Darbaw 1
Dargak 1
DarullamanSanatoryam 0.8
DashteBarchi 0.625
DawlatShaKalai 0.818
Day Kalan 0.636
Day Payan 0.625
DedanayeDarlaman 0.444
DehKhodayda 0.6
DehShafee 0.727

32
Dehmazang 0.667
Dehnaw 0.692
Dewanbigi 0.6
DeyKepak 0.909
DhaGowoChak 0.733
District Center 0.8
District Center (JangalKalay) 0.7
Doghabad 0.778
Dogi 1
Donya 0.643
EbrahimKhiel 0.769
EspiZarak 0.867
Etefaq Family 0.643
Gabri 0.6
Gari 0.667
Ghandak 0.462
Ghazya 1
Ghodfan 0.857
Grish Ada 0.769
GulQashlaq 0.667
Gulghunday 0.8
Gulmish 1
Haji Pahlawan 0.5
Haroki 0.476
Hasanak 0.789
Hasanzai 0.636
Hawza Bazar 0.769
HazaraBaghal 0.769
Islam Qala 0.8
JoiJadid 1
Kabry 0.7
Kabul Comp 0.692
Kabulyan 0.615
Kaezak 0.688
Kakaran 0.643
KalloKhil 0.5
KamaluddinKhil 1
KampaniLabi Darya 0.875
Kandrak 0.769
Karte Char 0.769

33
KarteNegah 0.5
Karte Now 0.846
KarteSakhy 0.75
Karte 3 0.778
KartiParwan 0.875
Katak-e-Payen 1 0.714
Katak-e-Payen 2 0.8
KazehKalay 0.9
KeshlakBeesha 0.6
KhajaBoghra 0.818
Khar Jan 0.5
Kharbad 0.593
Khari 0.8
Khoja Amin Ulla 0.553
Khojah Noh 0.538
Khomadkhiel 0.75
Khwaja 0.692
KhwajaChinar 1
Kishtaki 0.632
Kmarak 0.667
KocheKhairKhana 0.643
KohnaQala 0.667
Kolangr 0.786
Kolokh 0.909
Kookchyal 1
Kor-i-Baqi 0.8
Korok 1
Kotakai 0.667
KoteSangi 0.7
KuzKalai 0.692
La Hosain 0.909
Lakan 1
Lalmaydan 0.667
Larkhabi 0.909
Lase ZakoreAqcha 0.769
LoiKalai 0.5
Malkhan 0.909
Mamoda 0.545
Marbat 0.647
MeerwaisMaidan 0.667

34
MerzaKhel 0.917
Mirkroryan 0.8
MirzaQasim 0.667
MolaKhil 0.8
Mosakhan 0.75
Mosazai 0.667
Mullah Khan 0.818
Nagahan 0.556
NahriShahi 1
Nahye 3 0.818
Nahye 4 0.818
NahyeAwal 0.625
Nak 0.909
Nawabad 0.783
NewaySarak 0.818
NgharaTefa 1
Noghee 0.769
Omerkhil 0.778
Omid Abad 0.818
Pandak 0.75
ParcheHaftum 0.643
ParcheHashtum 0.632
Patak 0.714
Peach Kandool 0.6
Petwa 0.583
PishamyanDara 0.9
QadizKalay 1
Qaisarkhil 0.926
Qala Cha 0.692
Qala e Najara 0.727
Qala e Abas 0.667
Qala e Darwest 0.563
Qala e Dasht 0.563
Qala e Fathullah 1
Qala e Topkhana 0.833
Qala e Wazir 0.75
Qala I Ajiri 0.8
QalaeQazi 0.643
QalaeYazBashi 0.667
Qalai Jamal 0.583
35
QaleWahed 0.6
Qasaba 0.818
Qizel Abad 0.909
QizelQeshlaq 1
Regrashan 0.667
Rezagak 0.909
Robat 1
Sadiq Abad 0.5
SadozAqa 0.611
SaidanoKalai 0.786
SakandarKalai 0.833
Sangaw 0.667
Sanzare 0.75
SarChashma 0.533
Sar e Asya 0.882
Sarasai 0.882
SareKotal 0.769
Sari Kariz 1
Sarqroot 1
Sarwar Kala 1
SayrahiAlawdin 0.462
Se Boza 0.647
Senama e Pamir KhanaSha He Do Shamshira 0.75
Senamaye Pamir KhanaKoh 0.833
Sepaye Daman 0.529
ShaBorhan Agha 0.643
ShaMezy 0.6
ShaShahid 0.727
ShaaZaman 0.429
Shahi 0.909
Shahrake Haji Nabi 0.727
ShahrakeMullaEzat 0.778
Shalotai 0.769
Shams Abad 0.5
ShikhamirKalay 0.583
Shikhan 1
Singan 1
Simanzay 0.889
Sofa Qala 0.667

36
Soorkh Abad 0.75
SoriKhil 1
SpinaGhbarga 0.75
SraQala 0.733
Sya Sang 0.667
Syah Chow 0.611
Takhet Safar 0.917
TakliKhana 0.7
Talqislaq 1
TangiKajaki 0.7
Tanoor 0.75
Taqche 0.533
TashJawor 0.583
Temoryan 0.571
Teyoti 0.5
Waisal Abad 0.727
Yaka Tut 0.8
Yakab 1
ZafranKheil 0.9
Zamuchak 1
Interviewers (by ID #) RR1
1 1
2 0.765
3 0.765
4 0.667
5 0.583
6 1
7 1
8 0.4
9 0.762
10 0.636
11 0.444
12 0.328
13 0.76
14 0.96
15 0.667
16 0.706

37
17 0.824
18 0.947
19 0.567
20 0.688
21 0.6
22 0.636
23 0.727
24 0.667
25 0.889
26 0.68
27 1
28 0.563
29 0.769
30 0.833
31 0.571
32 0.583
33 0.889
34 0.75
35 0.885
36 0.4
37 0.808
38 1
39 0.84
40 0.517
41 0.643
42 0.667
43 1
44 0.917
45 0.917
46 0.81
47 0.75
48 0.81
49 0.625
50 0.692
51 0.76
52 0.5
53 0.9
54 0.813
55 0.548
56 1

38
57 0.773
58 0.741
59 0.5
60 0.769
61 0.6
62 1
63 0.73
64 0.8
65 0.889
66 0.815
67 0.923
68 0.742
69 0.529
70 0.648
71 0.742
72 0.667
73 0.733
74 0.759
75 0.571
76 0.538
77 0.63
78 0.941
79 0.75
80 0.955
81 0.765
82 0.75
83 0.889
84 0.824
85 0.824
86 1
87 0.719
88 0.833
89 0.789
90 0.667
91 0.818
92 0.857
93 0.774
94 0.821
95 0.714
96 0.792

39
97 0.783
98 0.8
99 0.765
100 0.667
101 0.778
102 0.579
103 1
104 0.667
105 0.667
106 0.529
107 0.5
108 0.75
109 0.571
110 0.571
111 0.5
112 0.714
113 0.632
114 0.667
115 0.571
116 0.595
117 1
118 0.792
119 0.75
120 0.947
121 0.625
122 1
123 0.722
124 0.577
125 0.545
126 0.75
127 0.583
128 0.4
129 0.667
130 0.889
131 0.65
132 0.944
133 1
134 0.8
135 0.789
136 0.714

40
137 0.742
138 0.571
139 0.545
140 0.7
141 0.632
142 0.722
143 0.783
144 0.875
145 0.6
146 0.688
147 0.615
148 0.833
149 0.722
150 0.741
151 0.933
152 0.95
153 1
154 0.676
155 0.684