Embed Size (px)
Citation preview
Department of Earth SciencesKFUPM
Gravity Modeling 2
Introduction to GeophysicsIn
trod
uct
ion t
o G
eop
hysi
cs-K
FUPM
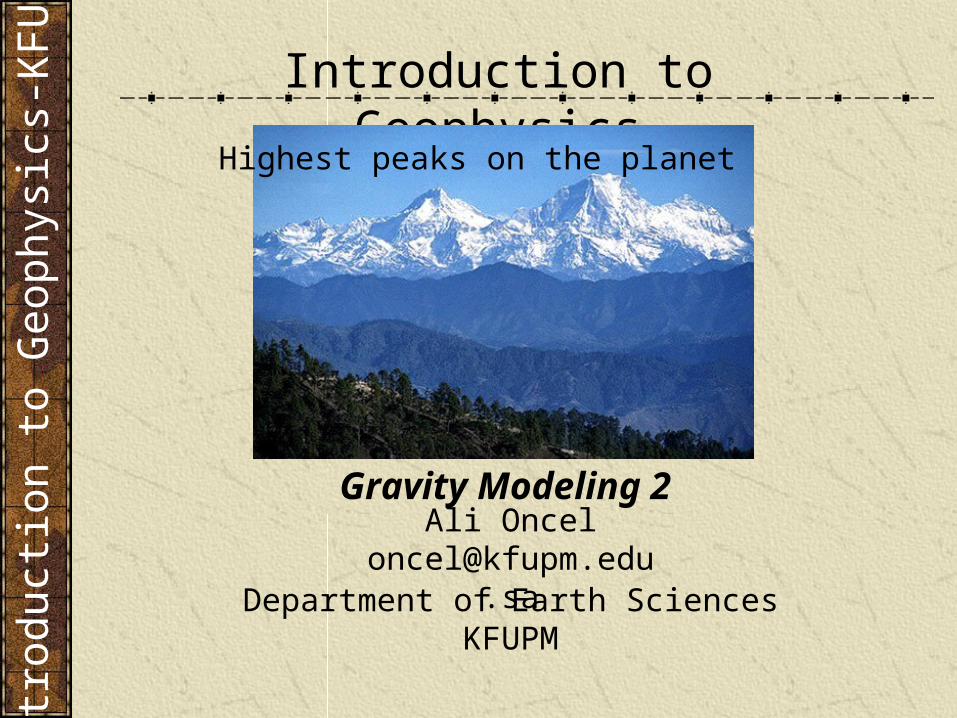
Highest peaks on the planet
Previous Lecture
2D Gravity ModelingGravitational effect of a buried sphere
Size Effect Gravity Contrast Depth Effect
Intr
od
uct
ion t
o G
eop
hysi
cs-K
FUPM
Intr
od
uct
ion t
o G
eop
hysi
cs-K
FUPM
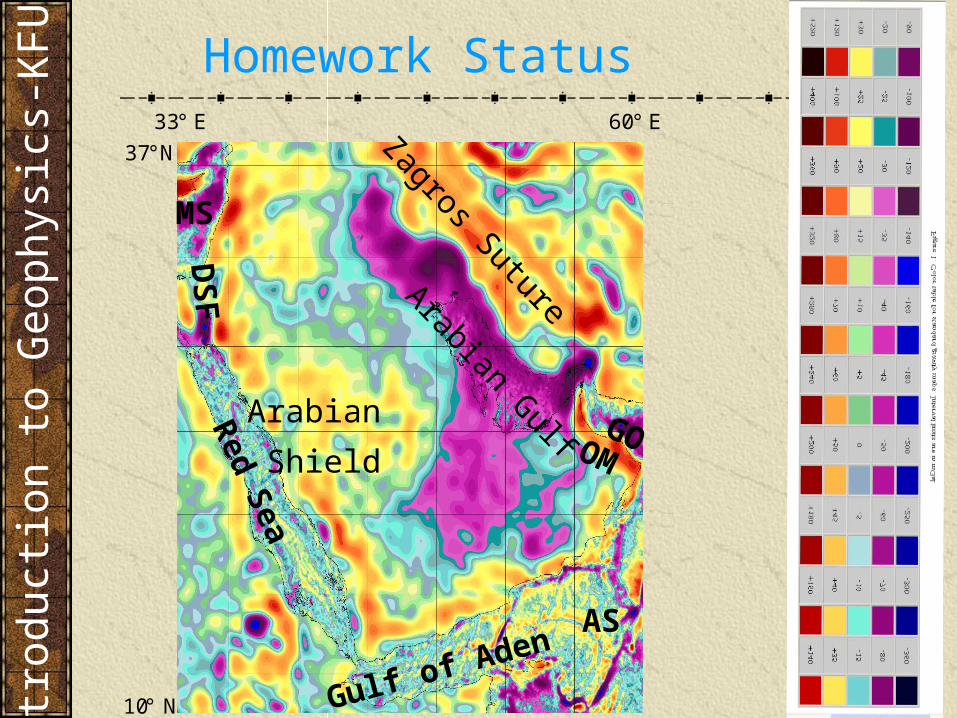
Red S
ea
Arabian Gulf
DS
F
Arabian
Shield
Gulf of Aden
Zagros SutureGO
AS
MS
OM
33° E 60° E
10° N
37°N
Homework Status
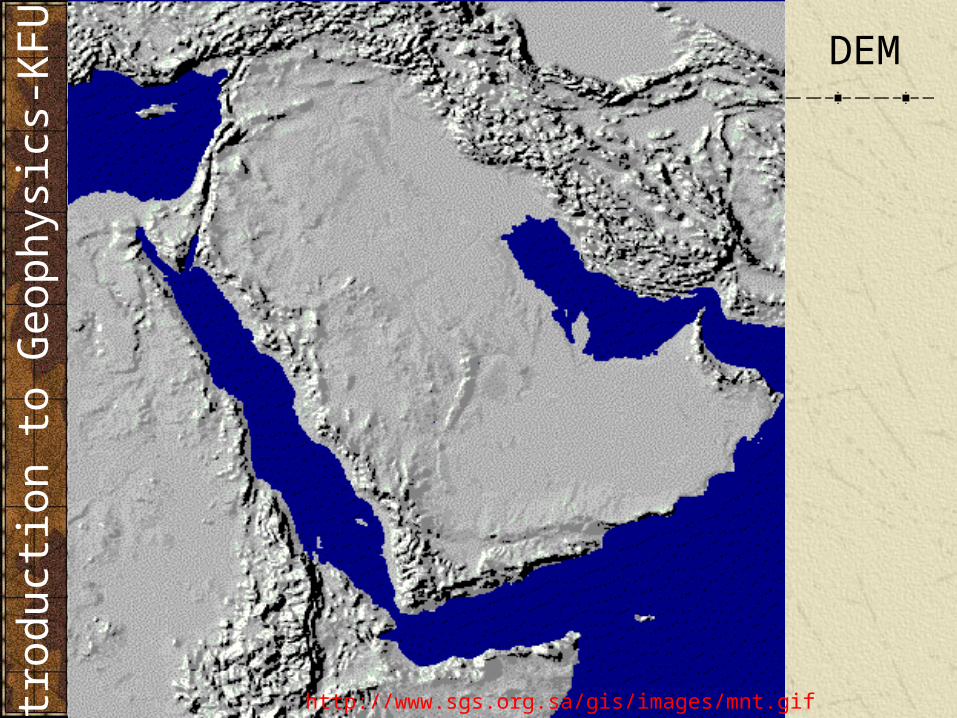
DEM
http://www.sgs.org.sa/gis/images/mnt.gifIntr
od
uct
ion t
o G
eop
hysi
cs-K
FUPM
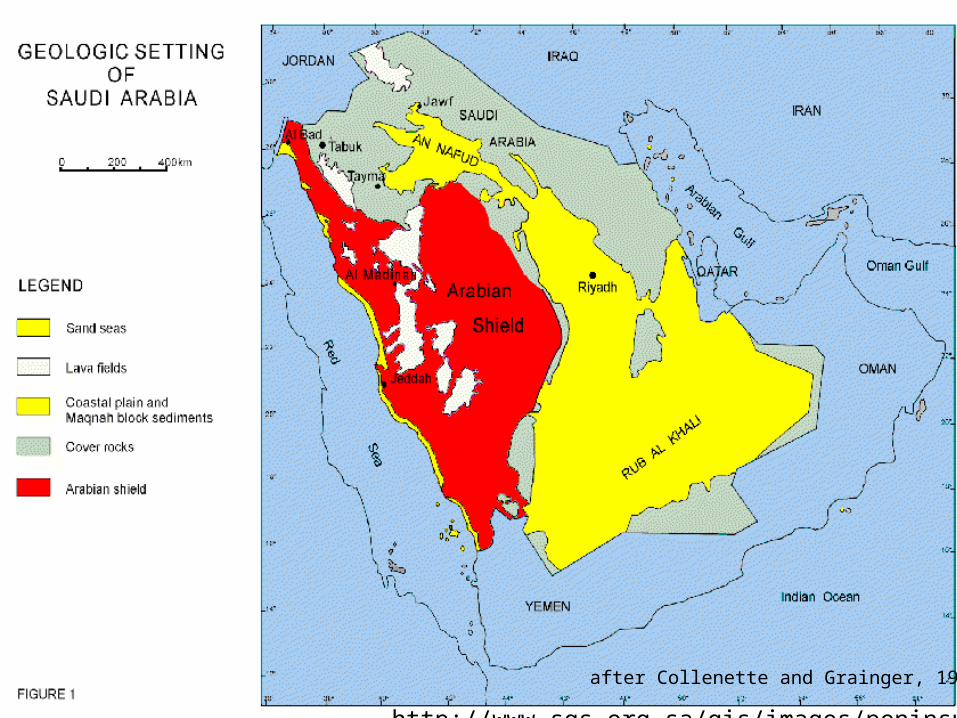
http://www.sgs.org.sa/gis/images/peninsul.gif
after Collenette and Grainger, 1994
Gravity Modeling
Intr
od
uct
ion t
o G
eop
hysi
cs-K
FUPM
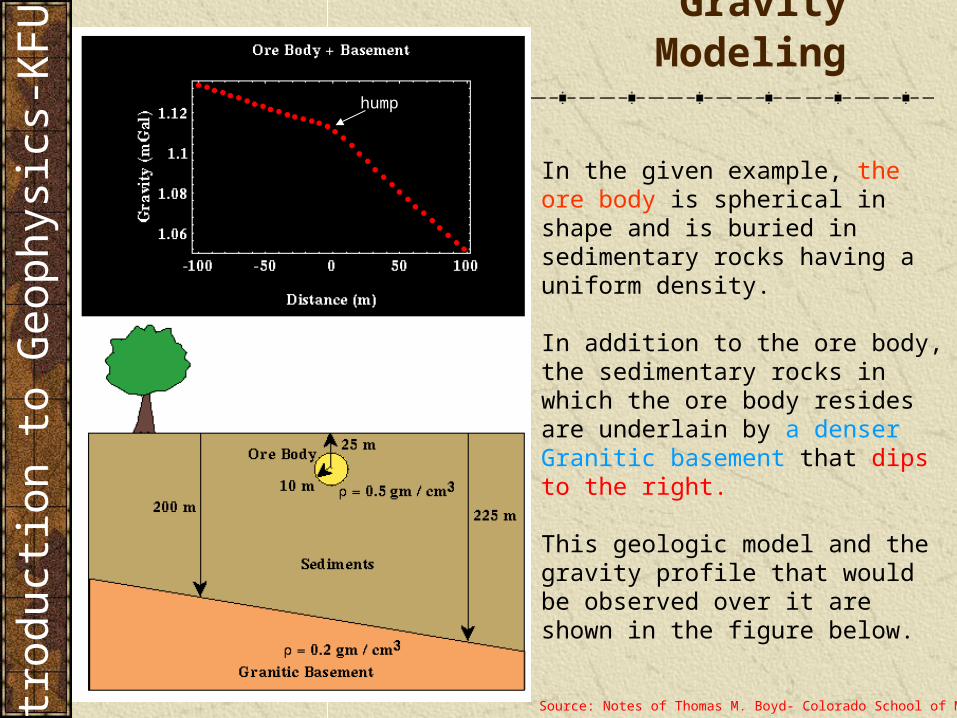
In the given example, the ore body is spherical in shape and is buried in sedimentary rocks having a uniform density.
In addition to the ore body, the sedimentary rocks in which the ore body resides are underlain by a denser Granitic basement that dips to the right.
This geologic model and the gravity profile that would be observed over it are shown in the figure below.
Source: Notes of Thomas M. Boyd- Colorado School of Mine
hump
Source: Notes of Thomas M. Boyd- Colorado School of Mine
Regional Gravity due to dipping Layer
Intr
od
uct
ion t
o G
eop
hysi
cs-K
FUPM
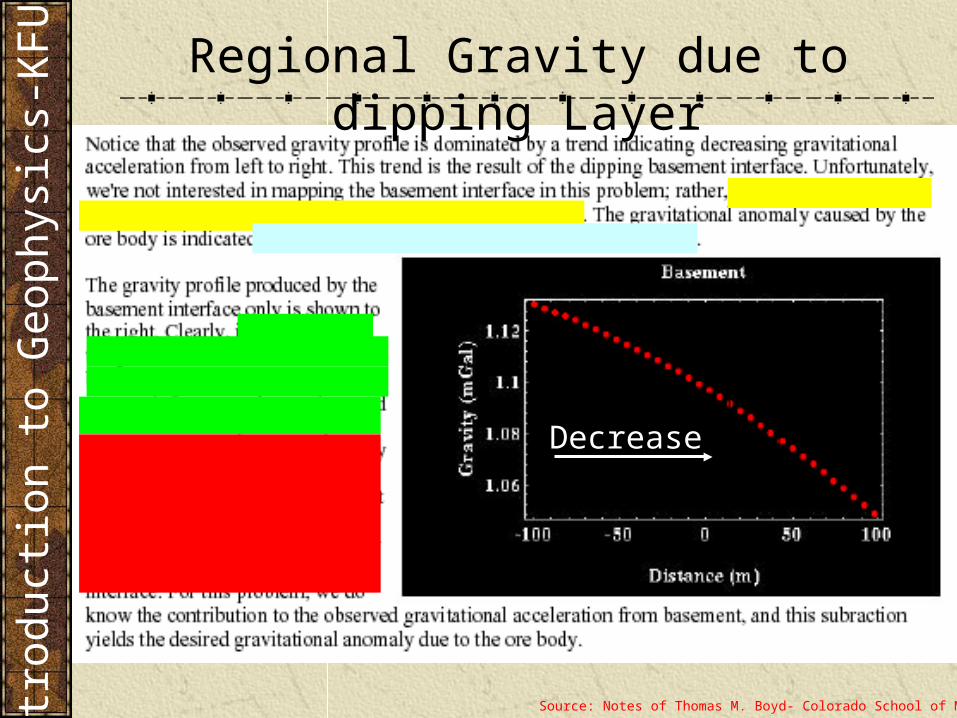
Decrease
Intr
od
uct
ion t
o G
eop
hysi
cs-K
FUPM
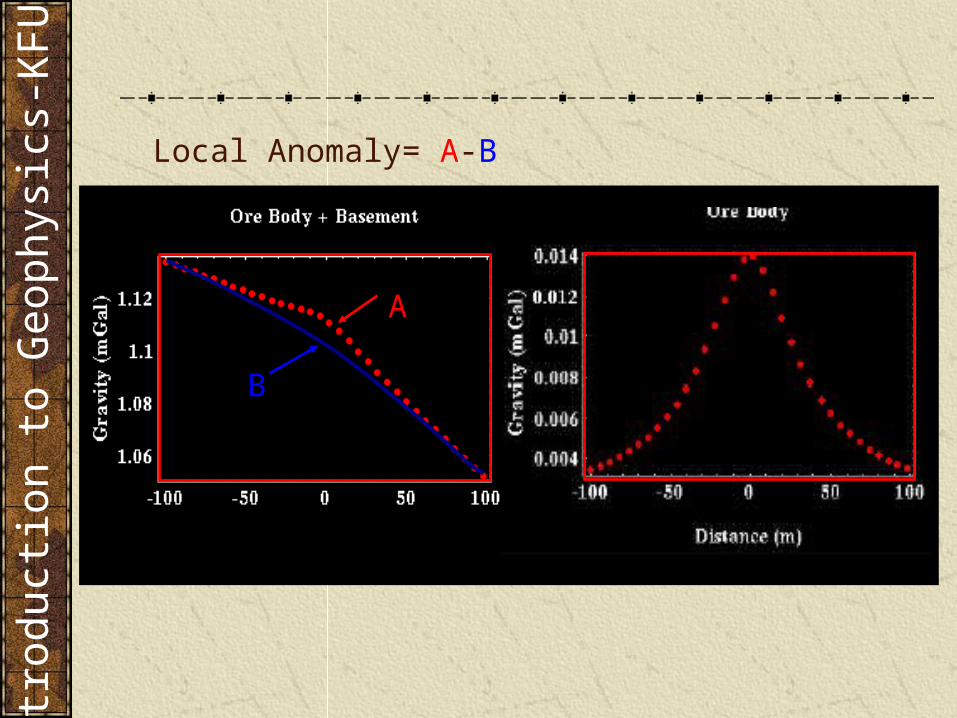
A
B
Local Anomaly= A-B
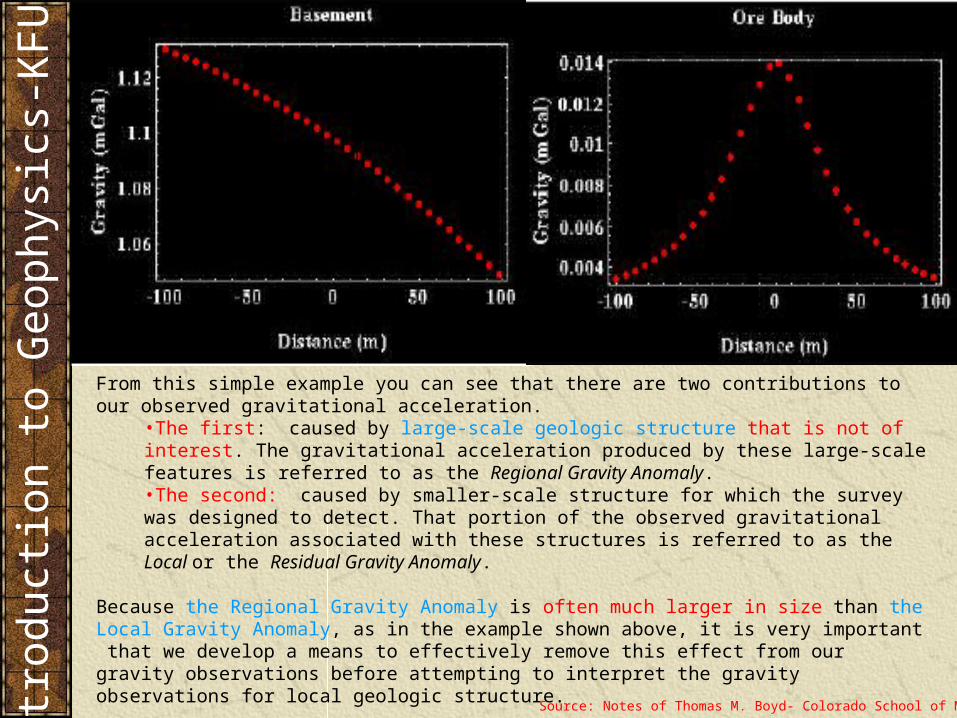
From this simple example you can see that there are two contributions to our observed gravitational acceleration.
•The first: caused by large-scale geologic structure that is not of interest. The gravitational acceleration produced by these large-scale features is referred to as the Regional Gravity Anomaly. •The second: caused by smaller-scale structure for which the survey was designed to detect. That portion of the observed gravitational acceleration associated with these structures is referred to as the Local or the Residual Gravity Anomaly.
Because the Regional Gravity Anomaly is often much larger in size than the Local Gravity Anomaly, as in the example shown above, it is very important that we develop a means to effectively remove this effect from our gravity observations before attempting to interpret the gravity observations for local geologic structure.
Source: Notes of Thomas M. Boyd- Colorado School of MineIntr
od
uct
ion t
o G
eop
hysi
cs-K
FUPM
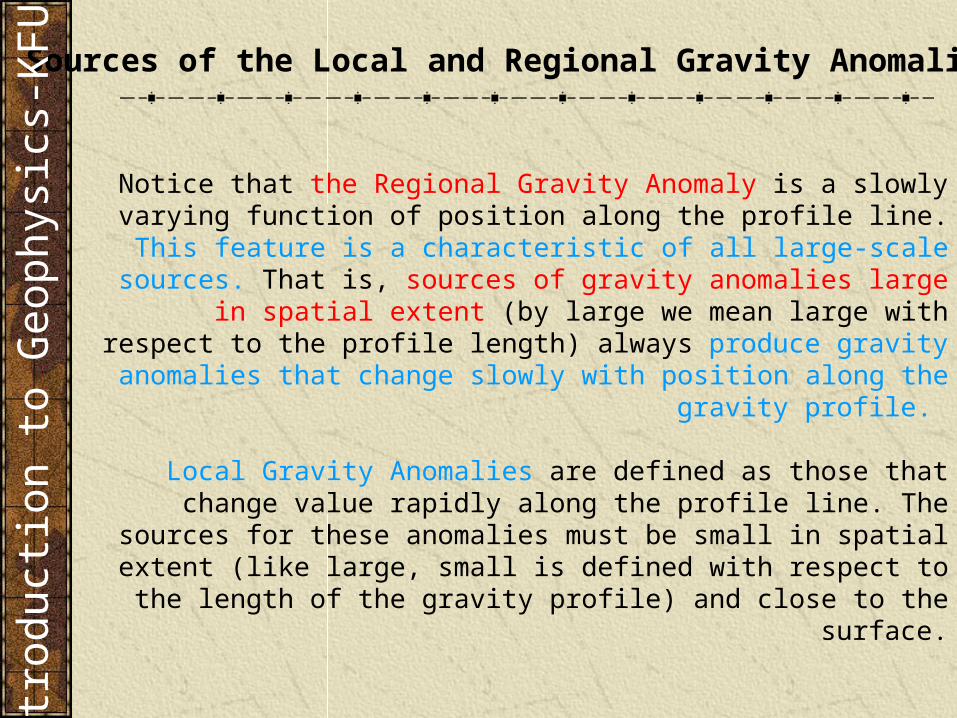
Notice that the Regional Gravity Anomaly is a slowly varying function of position along the profile line. This feature is a
characteristic of all large-scale sources. That is, sources of gravity anomalies large in spatial extent (by large we mean
large with respect to the profile length) always produce gravity anomalies that change slowly with position along the gravity
profile.
Local Gravity Anomalies are defined as those that change value rapidly along the profile line. The sources for these
anomalies must be small in spatial extent (like large, small is defined with respect to the length of the gravity profile) and
close to the surface.
Sources of the Local and Regional Gravity AnomaliesIn
trod
uct
ion t
o G
eop
hysi
cs-K
FUPM
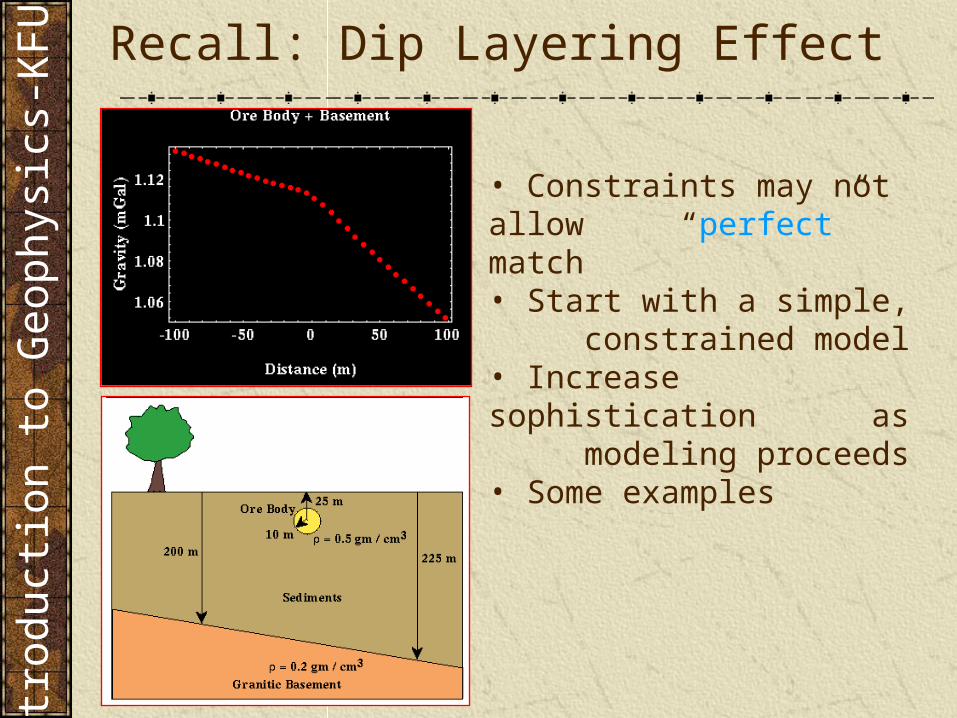
• Constraints may not allow “perfect” match
• Start with a simple, constrained model• Increase sophistication
as modeling proceeds• Some examples
Recall: Dip Layering EffectIn
trod
uct
ion t
o G
eop
hysi
cs-K
FUPM
Symmetry
Intr
od
uct
ion t
o G
eop
hysi
cs-K
FUPM Local Gravity
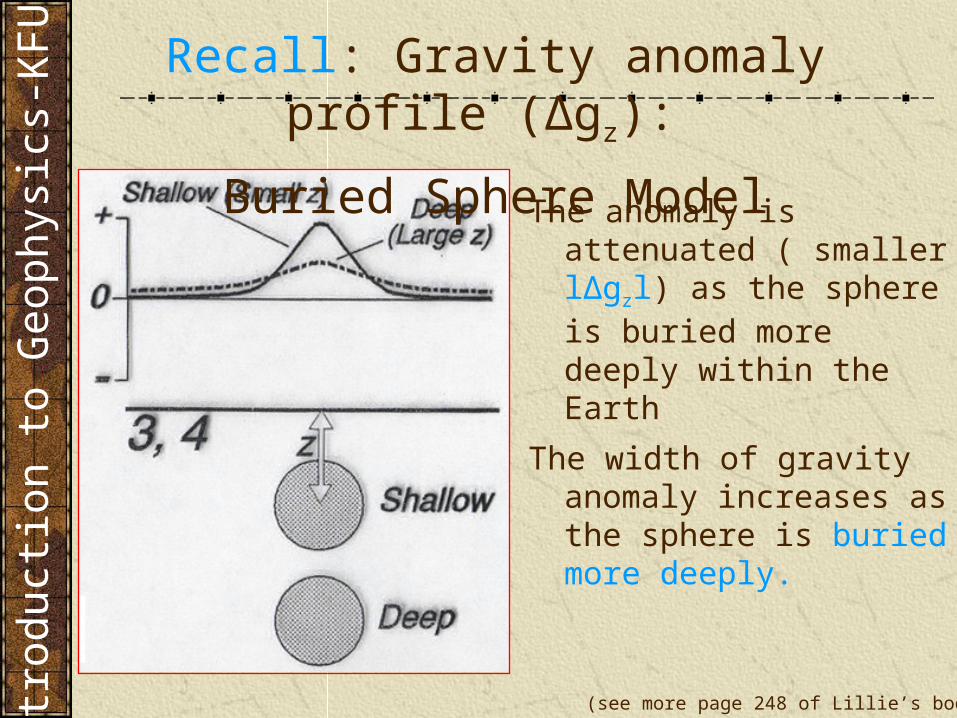
The anomaly is attenuated ( smaller lΔgzl) as the sphere is buried more deeply within the Earth
The width of gravity anomaly increases as the sphere is buried more deeply.
Recall: Gravity anomaly profile (Δgz):
Buried Sphere Model
Intr
od
uct
ion t
o G
eop
hysi
cs-K
FUPM
(see more page 248 of Lillie’s book).
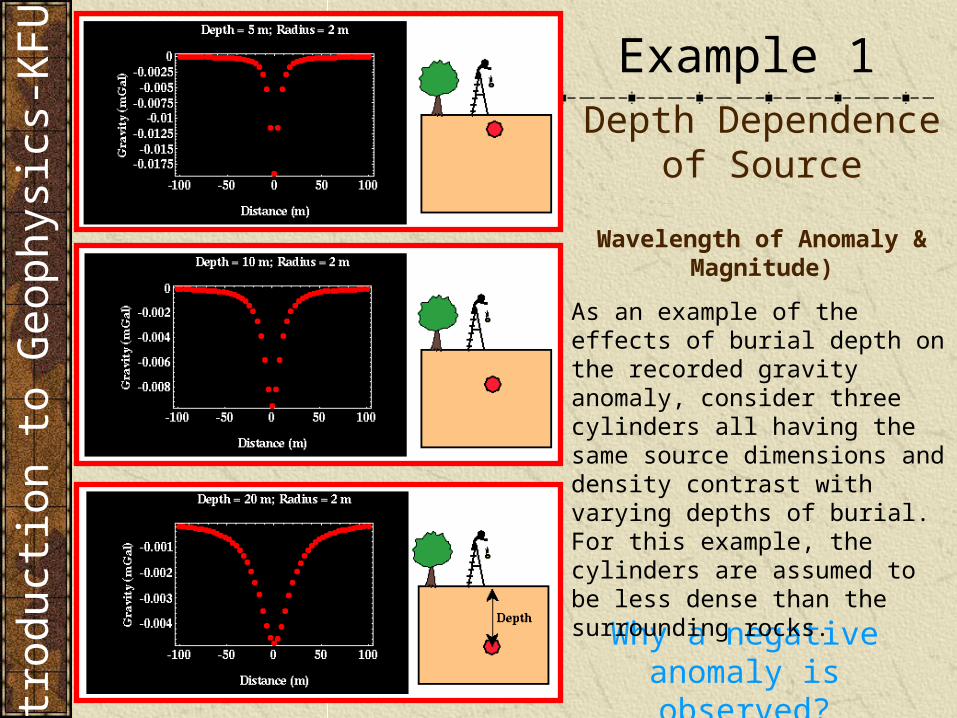
Depth Dependenceof Source
Wavelength of Anomaly & Magnitude)
Intr
od
uct
ion t
o G
eop
hysi
cs-K
FUPM
Why a negative anomaly is observed?
Example 1
As an example of the effects of burial depth on the recorded gravity anomaly, consider three cylinders all having the same source dimensions and density contrast with varying depths of burial. For this example, the cylinders are assumed to be less dense than the surrounding rocks.
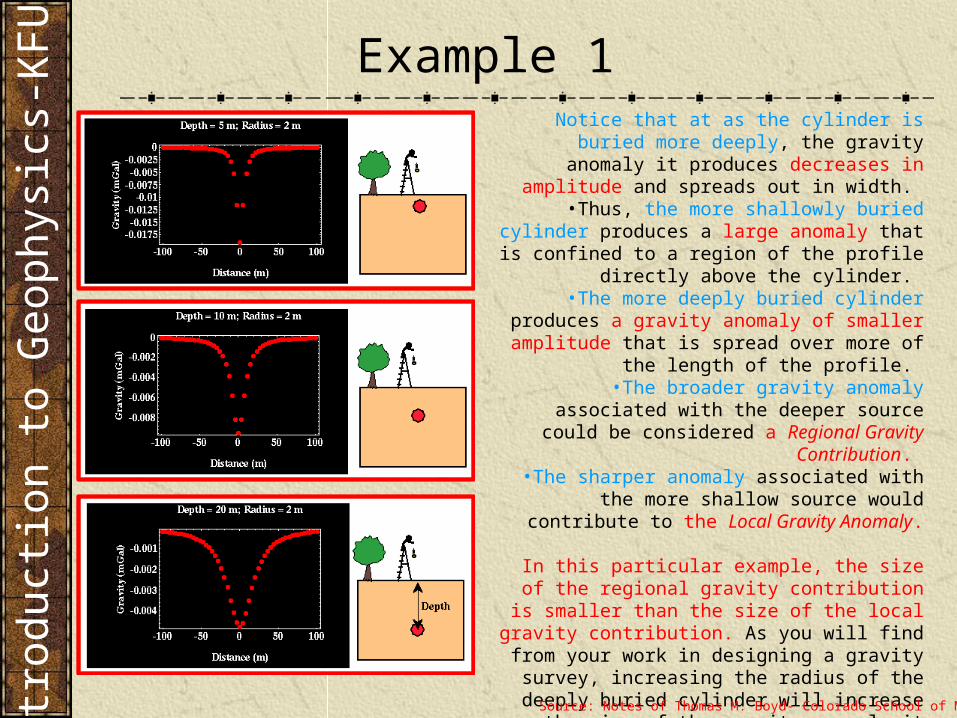
Notice that at as the cylinder is buried more deeply, the gravity anomaly it produces decreases in amplitude and
spreads out in width. •Thus, the more shallowly buried cylinder produces a
large anomaly that is confined to a region of the profile directly above the cylinder.
•The more deeply buried cylinder produces a gravity anomaly of smaller amplitude that is spread over more
of the length of the profile. •The broader gravity anomaly associated with the deeper
source could be considered a Regional Gravity Contribution.
•The sharper anomaly associated with the more shallow source would contribute to the Local Gravity Anomaly.
In this particular example, the size of the regional gravity contribution is smaller than the size of the local
gravity contribution. As you will find from your work in designing a gravity survey, increasing the radius of the
deeply buried cylinder will increase the size of the gravity anomaly it produces without changing the
breadth of the anomaly. Thus, regional contributions to the observed gravity field that are large in amplitude and
broad in shape are assumed to be deep (producing the large breadth in shape) and large in aerial extent
(producing a large amplitude).
Source: Notes of Thomas M. Boyd- Colorado School of Mine
Example 1In
trod
uct
ion t
o G
eop
hysi
cs-K
FUPM
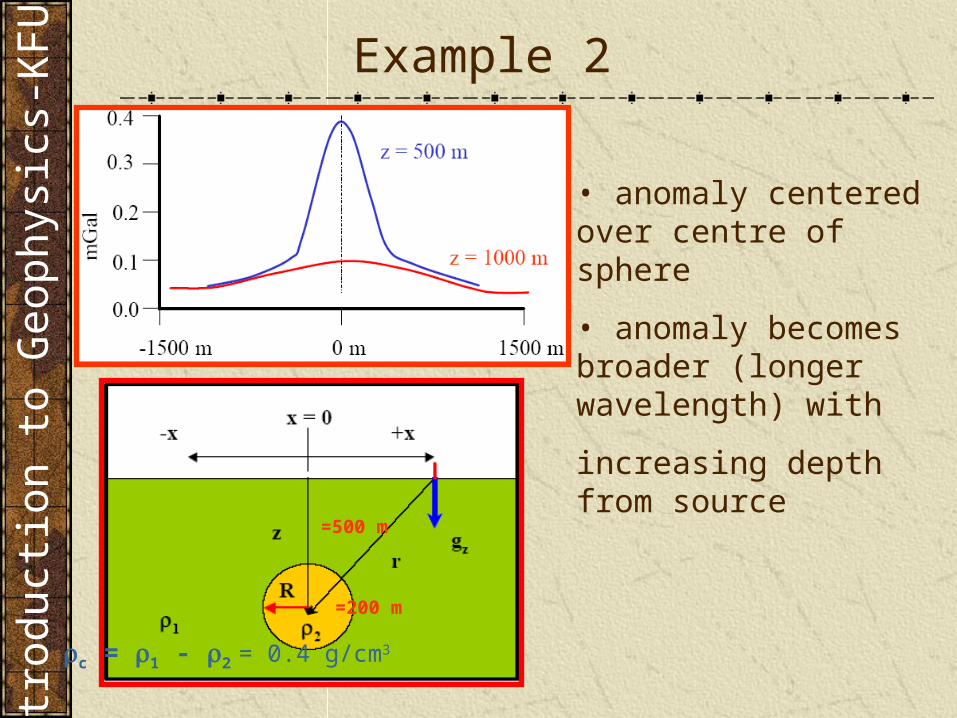
Example 2
• anomaly centered over centre of sphere
• anomaly becomes broader (longer wavelength) with
increasing depth from source
=200 m
c = 1 - 2 = 0.4 g/cm3
=500 m
Intr
od
uct
ion t
o G
eop
hysi
cs-K
FUPM
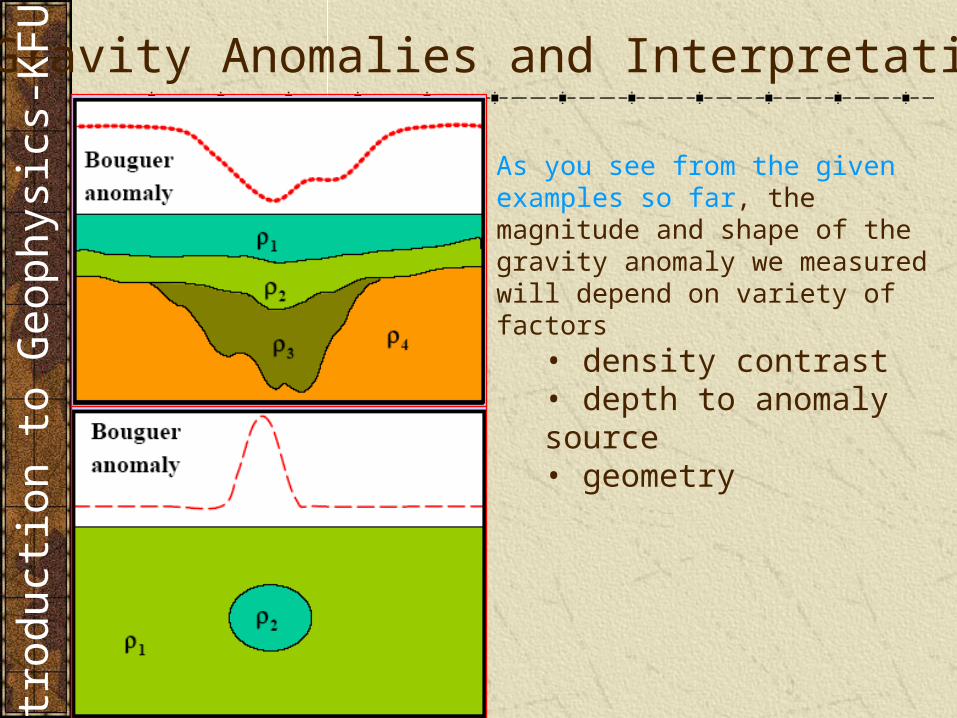
Gravity Anomalies and Interpretation
As you see from the given examples so far, the magnitude and shape of the gravity anomaly we measured will depend on variety of factors
• density contrast• depth to anomaly source• geometry
Intr
od
uct
ion t
o G
eop
hysi
cs-K
FUPM
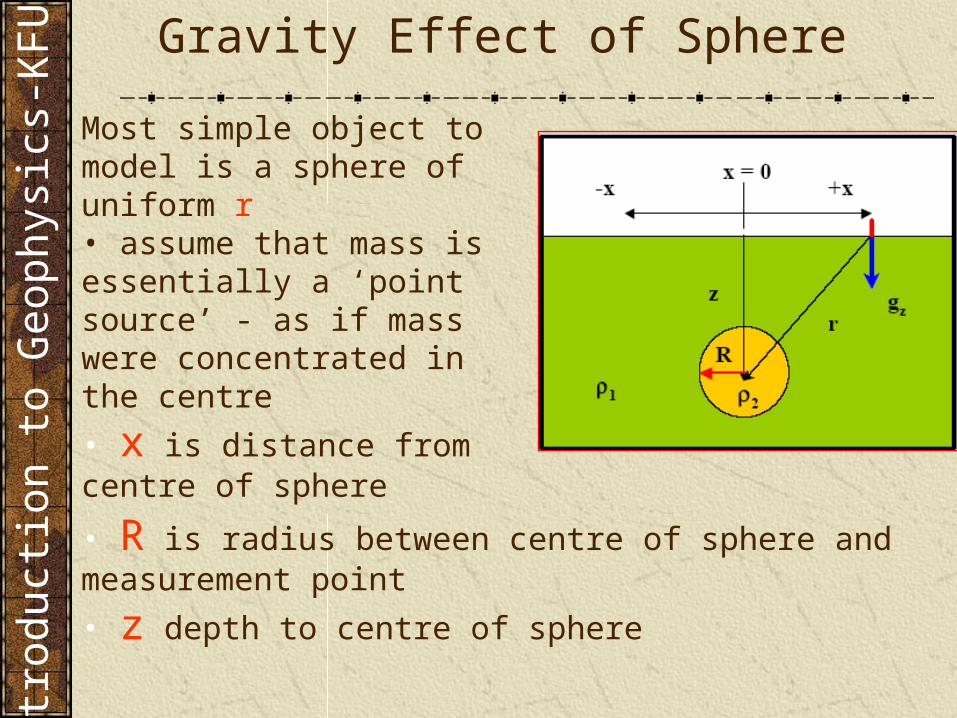
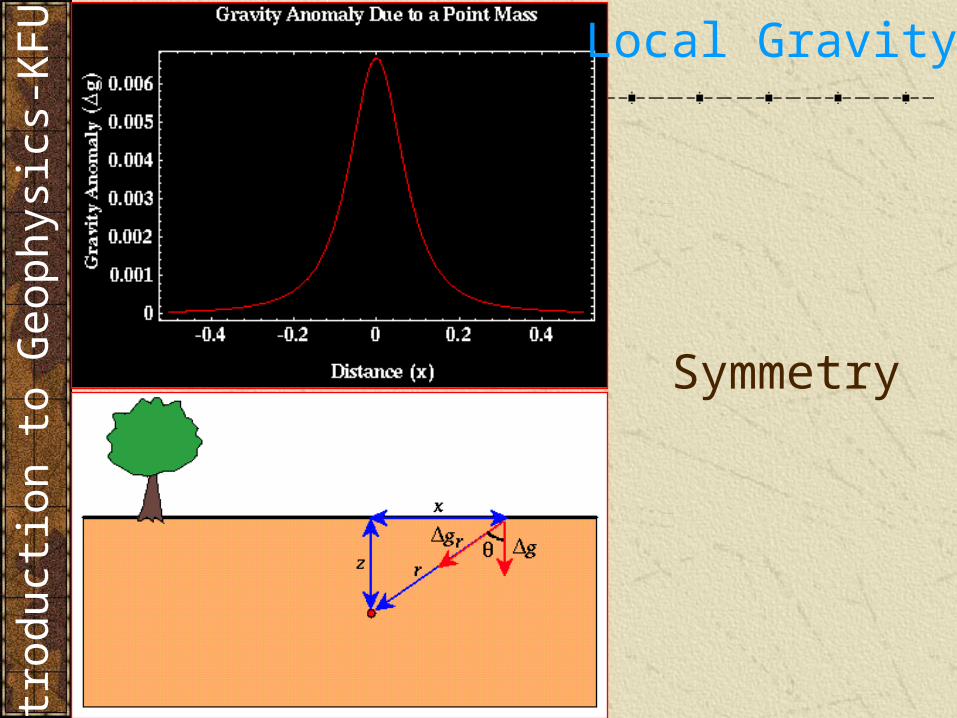
Gravity Effect of Sphere
Most simple object to model is a sphere of uniform r• assume that mass is essentially a ‘point source’ - as if mass were concentrated in the centre
• x is distance from centre of sphere
• R is radius between centre of sphere and measurement point
• z depth to centre of sphere
Intr
od
uct
ion t
o G
eop
hysi
cs-K
FUPM
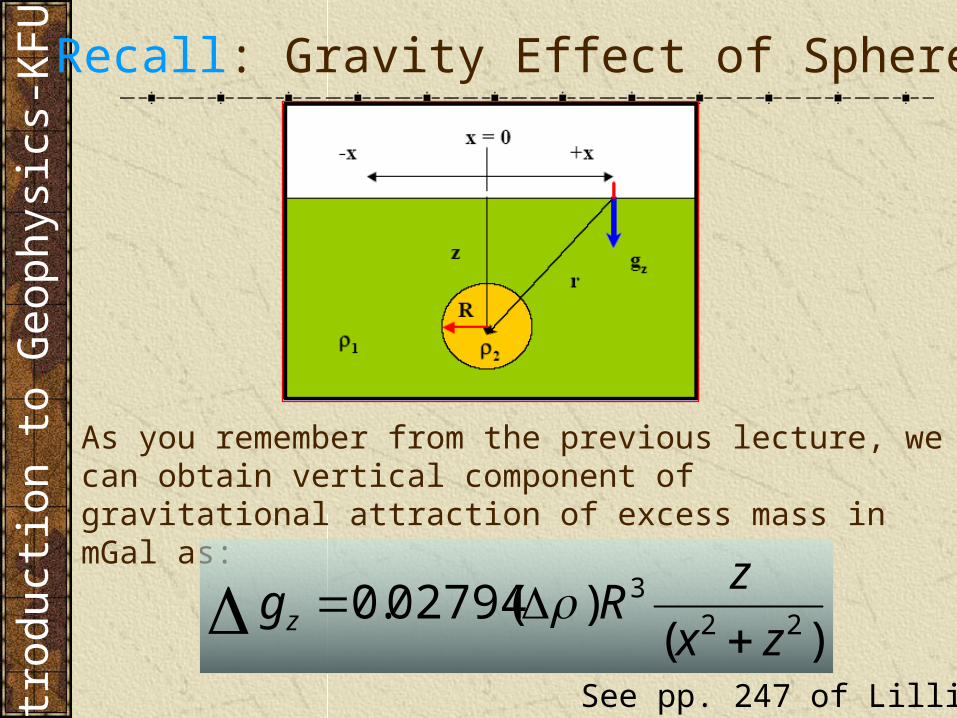
As you remember from the previous lecture, we can obtain vertical component of gravitational attraction of excess mass in mGal as:
Recall: Gravity Effect of SphereIn
trod
uct
ion t
o G
eop
hysi
cs-K
FUPM
)()(02794.0
223
zx
zRg z
See pp. 247 of Lillie
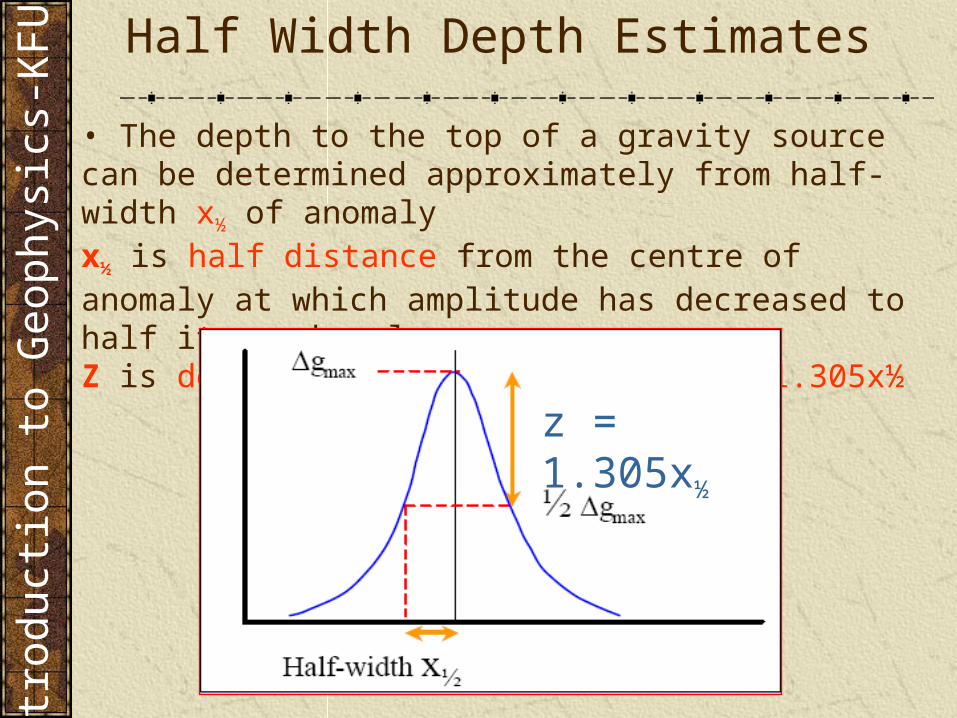
Half Width Depth Estimates
• The depth to the top of a gravity source can be determined approximately from half-width x½ of anomaly x½ is half distance from the centre of anomaly at which amplitude has decreased to half its peak value Z is depth for spherical object z = 1.305x½
z = 1.305x½
Intr
od
uct
ion t
o G
eop
hysi
cs-K
FUPM