Embed Size (px)
Citation preview
Troubleshooting with Serviceability and the New Runtime Monitoring Tool:
HeapStats JavaOne 2014 BOF3018
Yuji KUBOTA (@sugarlife) / Shinji TAKAO Nippon Telegraph and Telephone Corp.
Copyright(c)2014 NTT Corp. All Rights Reserved.
Questions and comments #heapstats
Questions on twitter are appreciated!
We will response correctly than via hearing-loss :)
Copyright(c)2014 NTT Corp. All Rights Reserved.
What will we talk about?
2
Troubleshooting of Java systems especially : • in operating phase • using free / open source tools for
OracleJDK and OpenJDK on Linux for x86 (32/64)
Copyright(c)2014 NTT Corp. All Rights Reserved.
Who are we? • Yuji Kubota (hearing impaired, @sugarlife) Shinji Takao (me)
• IcedTea committers • OpenJDK technical support engineers at Nippon Telegraph and Telephone Corp. (NTT) Open Source Software Center (OSSC) , Tokyo, Japan
3
Copyright(c)2014 NTT Corp. All Rights Reserved.
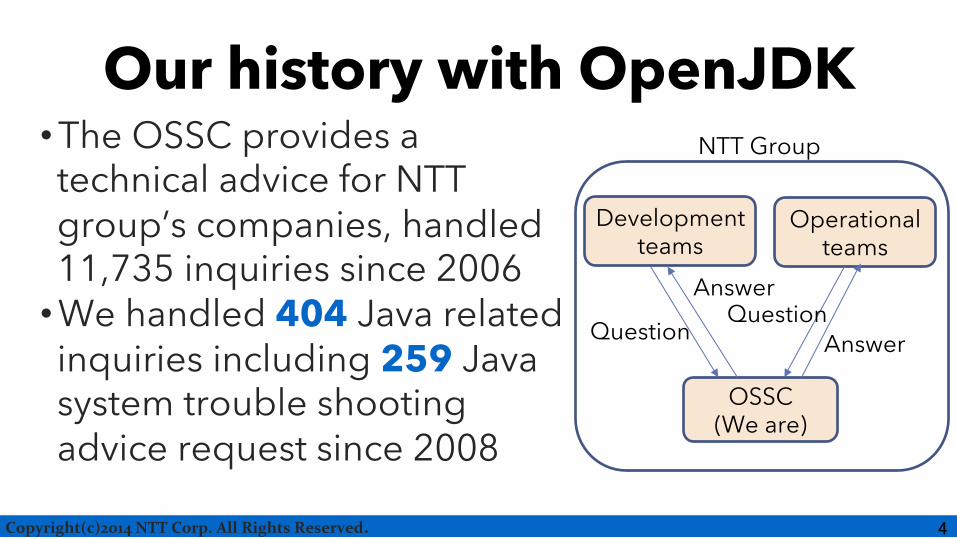
• The OSSC provides a technical advice for NTT group’s companies, handled 11,735 inquiries since 2006
• We handled 404 Java related inquiries including 259 Java system trouble shooting advice request since 2008
Our history with OpenJDK
4
Development teams
OSSC (We are)
Operational teams
Question Question
Answer
Answer
NTT Group
Copyright(c)2014 NTT Corp. All Rights Reserved.
Topics • Troubleshooting
• Categorizing • Problems of current trouble shootings
• HeapStats • Design for “Good” troubleshooting tool • Demonstration with use-cases
5
Copyright(c)2014 NTT Corp. All Rights Reserved.
Troubleshooting
6
Copyright(c)2014 NTT Corp. All Rights Reserved.
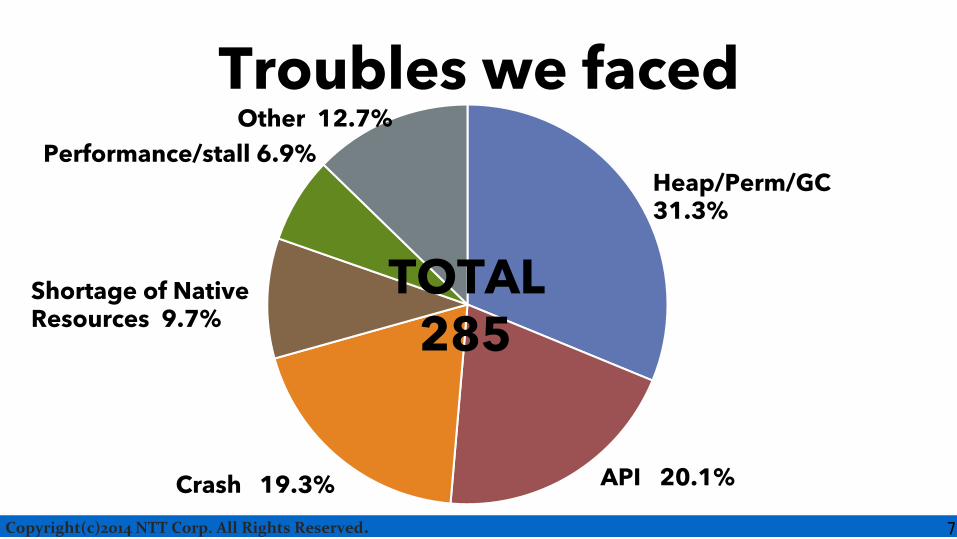
Shortage of Native Resources 9.7%
Heap/Perm/GC 31.3%
API 20.1%
Performance/stall 6.9%
Crash 19.3%
Other 12.7%
TOTAL 285
Troubles we faced
7
Copyright(c)2014 NTT Corp. All Rights Reserved.
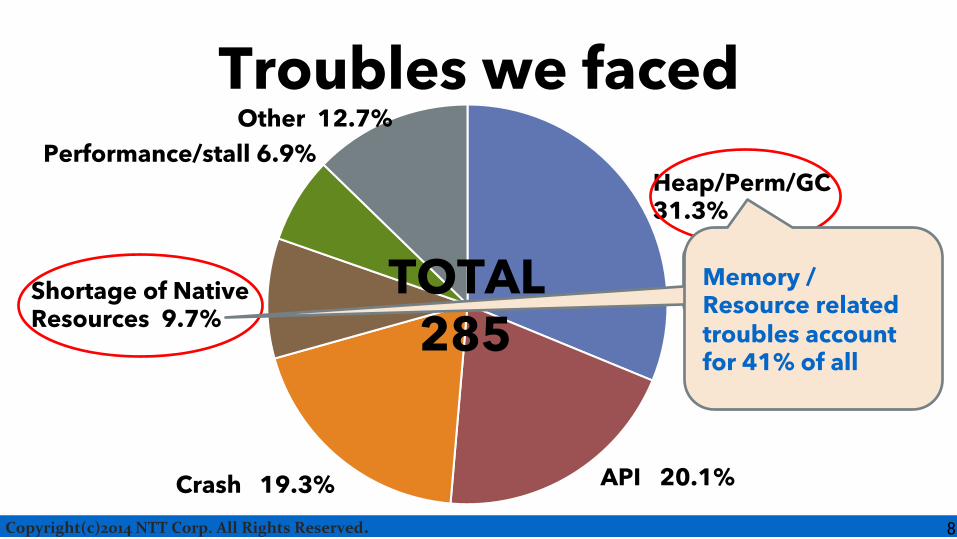
Shortage of Native Resources 9.7%
Heap/Perm/GC 31.3%
API 20.1%
Performance/stall 6.9%
Crash 19.3%
Other 12.7%
TOTAL 285
Troubles we faced
8
Memory / Resource related troubles account for 41% of all
Copyright(c)2014 NTT Corp. All Rights Reserved.
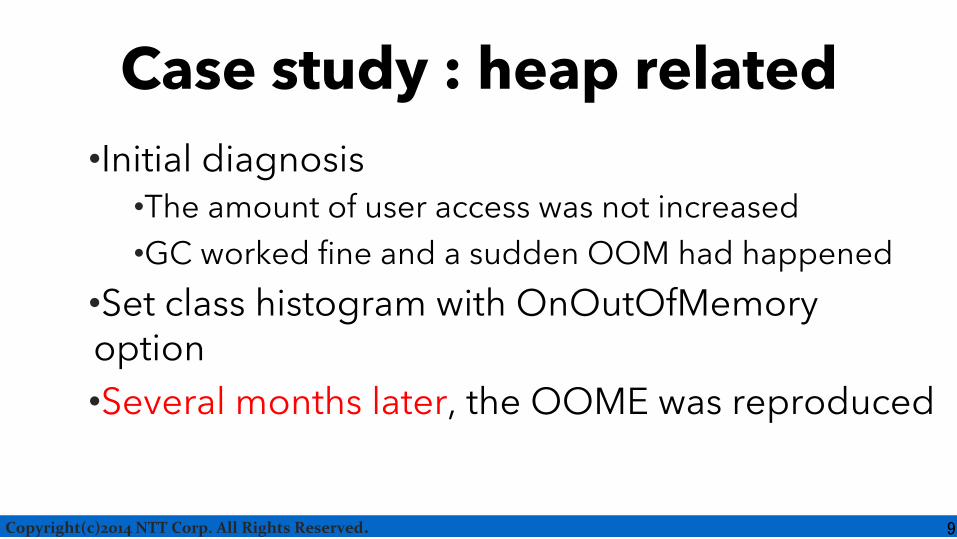
Case study : heap related • Initial diagnosis
• The amount of user access was not increased • GC worked fine and a sudden OOM had happened
• Set class histogram with OnOutOfMemory option • Several months later, the OOME was reproduced
9
Copyright(c)2014 NTT Corp. All Rights Reserved.
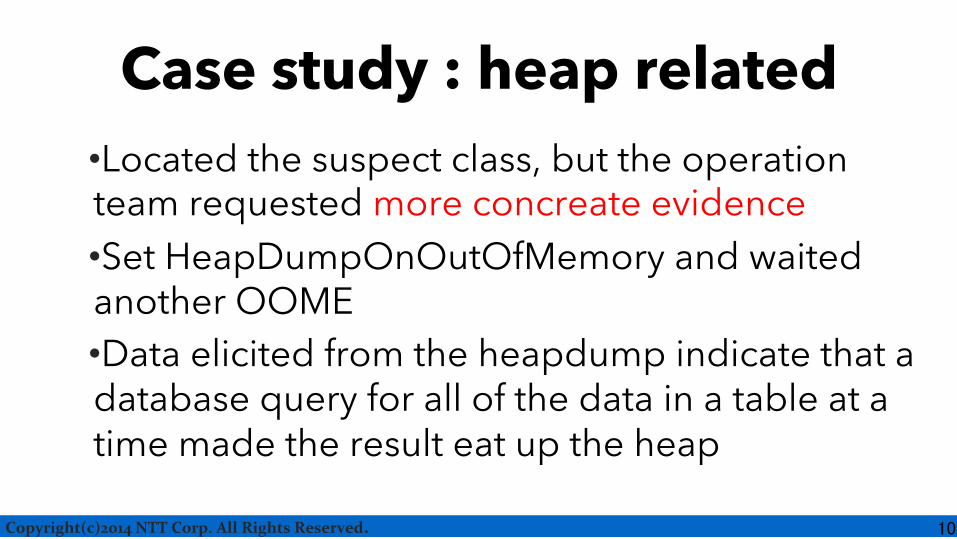
Case study : heap related • Located the suspect class, but the operation team requested more concreate evidence • Set HeapDumpOnOutOfMemory and waited another OOME • Data elicited from the heapdump indicate that a database query for all of the data in a table at a time made the result eat up the heap
10
Copyright(c)2014 NTT Corp. All Rights Reserved.
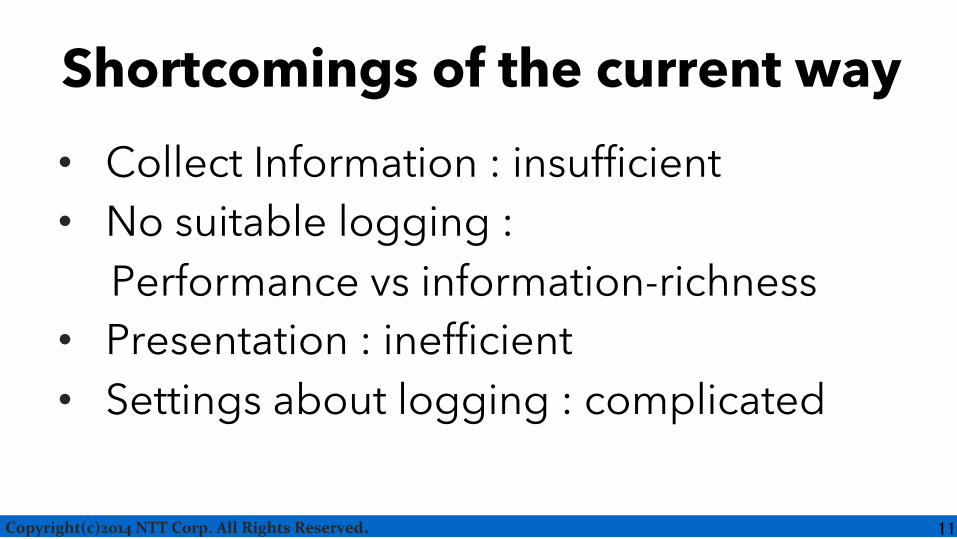
Shortcomings of the current way • Collect Information : insufficient • No suitable logging : Performance vs information-richness • Presentation : inefficient • Settings about logging : complicated
11
Copyright(c)2014 NTT Corp. All Rights Reserved.
OK, so, what do I have to do?
12
Copyright(c)2014 NTT Corp. All Rights Reserved. 13
Copyright(c)2014 NTT Corp. All Rights Reserved.
• Open source Java tooling project in IcedTea community that aimed to better monitoring and after-the-fact analysis.
• This project provides a lightweight JVMTI agent which attaches HotSpot VM to collect clues, and a GUI analyzer.
14
Copyright(c)2014 NTT Corp. All Rights Reserved.
What is “Good” troubleshooting tool?
#1 Collect required information. #2 Lightweight. #3 Visualization. #4 Ease of use.
15
Copyright(c)2014 NTT Corp. All Rights Reserved.
#1 Collect required information. Avoid the lack of information to troubleshoot
even if a java expert is not assigned.
16
Copyright(c)2014 NTT Corp. All Rights Reserved.
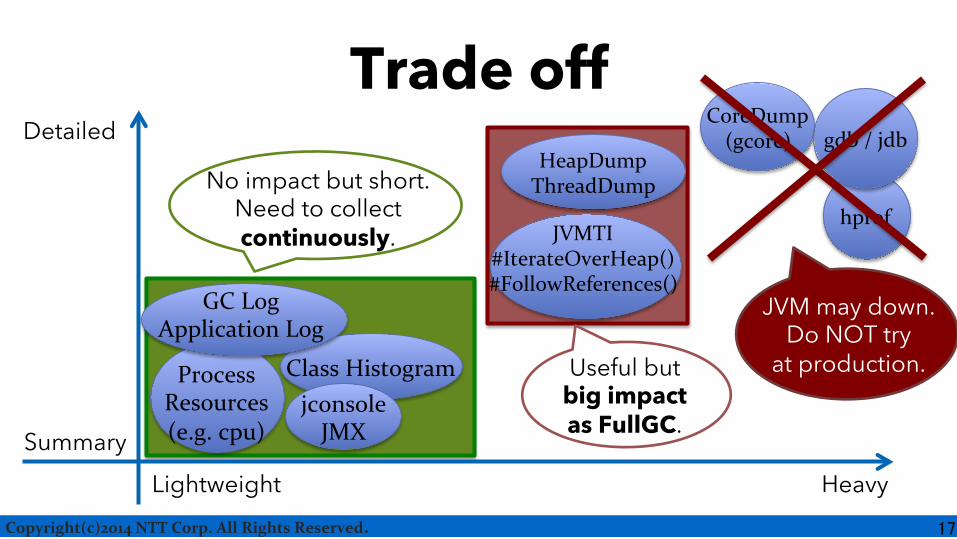
Trade off
Lightweight Heavy
Detailed
Summary
Class Histogram
HeapDump ThreadDump
CoreDump (gcore)
hprof
gdb / jdb
No impact but short. Need to collect continuously.
Useful but big impact as FullGC.
JVM may down. Do NOT try
at production. Process Resources (e.g. cpu)
GC Log Application Log
17
jconsole JMX
JVMTI #IterateOverHeap() #FollowReferences()
Copyright(c)2014 NTT Corp. All Rights Reserved.
Our strategy • Continuously collected resource data
during JVM alives. • Process resources (OS / JVM). • Heap and GC statistics.
• Detailed dump with stop-the-world when JVM will die or face troubles. • Heap snapshots, Thread dump • Other os log (syslog / journald, etc)
18
Copyright(c)2014 NTT Corp. All Rights Reserved.
#2 Lightweight. Do not stop your application.
19
Copyright(c)2014 NTT Corp. All Rights Reserved.
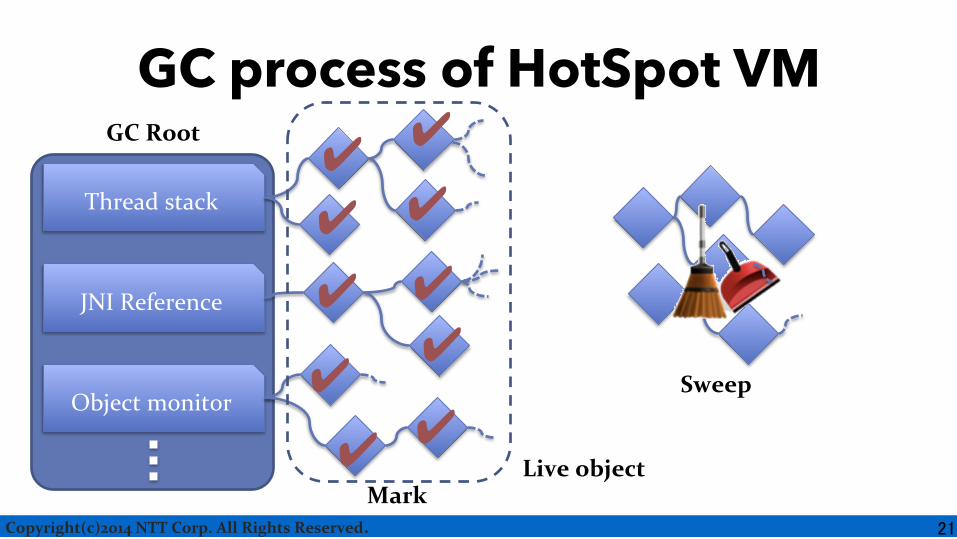
HeapStats collect data per Major GC. • HeapStats agent hooks the
marking or sweep phases of the garbage collector to collect java runtime information by oop (ordinary object pointer) without extra stop the world.
20
Copyright(c)2014 NTT Corp. All Rights Reserved.
GC process of HotSpot VM
Thread stack
Object monitor
JNI Reference
GC Root
21
✔ ✔ ✔
✔ ✔
✔ ✔ ✔ ✔
✔ Sweep
Live object Mark
Copyright(c)2014 NTT Corp. All Rights Reserved.
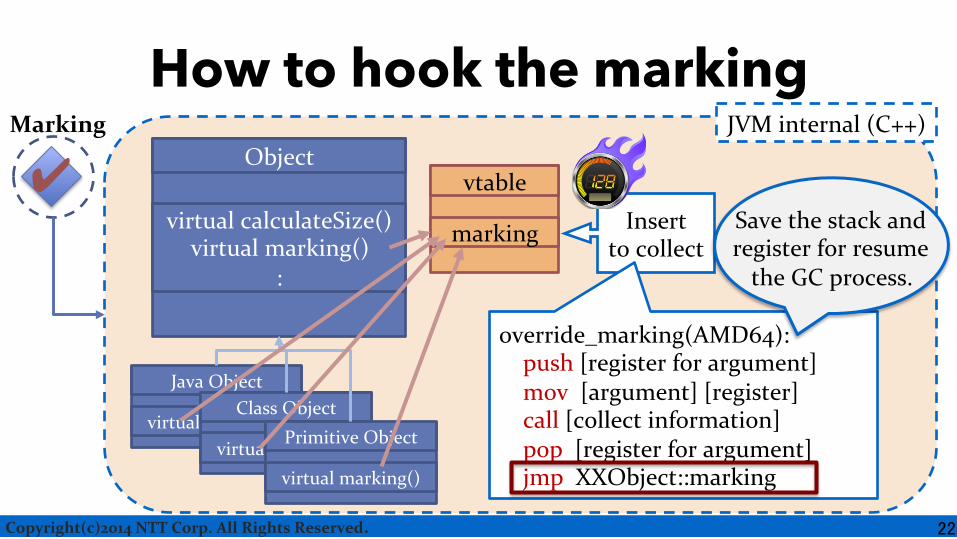
How to hook the marking
22
✔ Object
virtual calculateSize() :
JVM internal (C++)
Java Object
virtual marking() Class Object
virtual marking() Primitive Object
virtual marking()
vtable
marking virtual marking() Insert
to collect
override_marking(AMD64): push [register for argument] mov [argument] [register] call [collect information] pop [register for argument] jmp XXObject::marking
Marking
Save the stack and register for resume the GC process.
Copyright(c)2014 NTT Corp. All Rights Reserved.
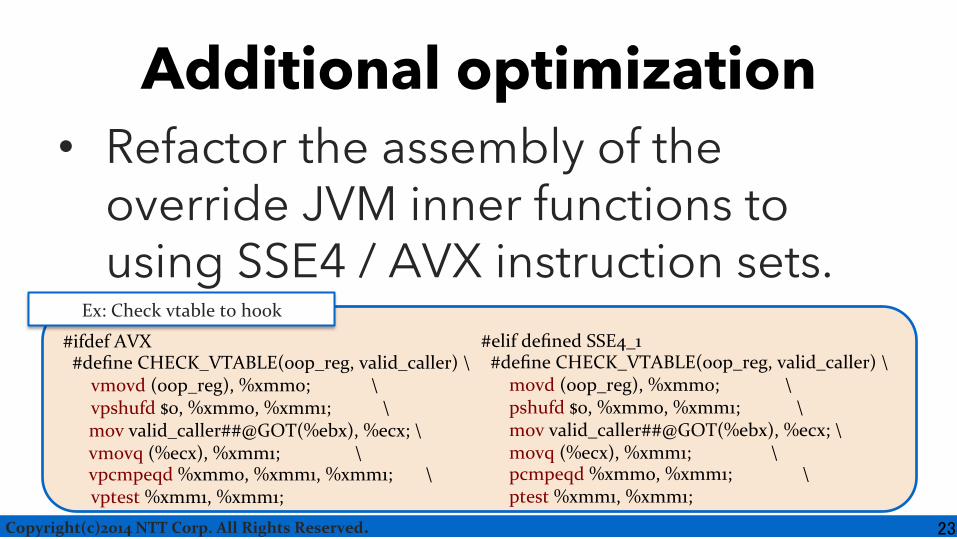
Additional optimization • Refactor the assembly of the
override JVM inner functions to using SSE4 / AVX instruction sets.
#ifdef AVX #define CHECK_VTABLE(oop_reg, valid_caller) \ vmovd (oop_reg), %xmm0; \ vpshufd $0, %xmm0, %xmm1; \ mov valid_caller##@GOT(%ebx), %ecx; \ vmovq (%ecx), %xmm1; \ vpcmpeqd %xmm0, %xmm1, %xmm1; \ vptest %xmm1, %xmm1;
#elif defined SSE4_1 #define CHECK_VTABLE(oop_reg, valid_caller) \ movd (oop_reg), %xmm0; \ pshufd $0, %xmm0, %xmm1; \ mov valid_caller##@GOT(%ebx), %ecx; \ movq (%ecx), %xmm1; \ pcmpeqd %xmm0, %xmm1; \ ptest %xmm1, %xmm1;
Ex: Check vtable to hook
23
Copyright(c)2014 NTT Corp. All Rights Reserved.
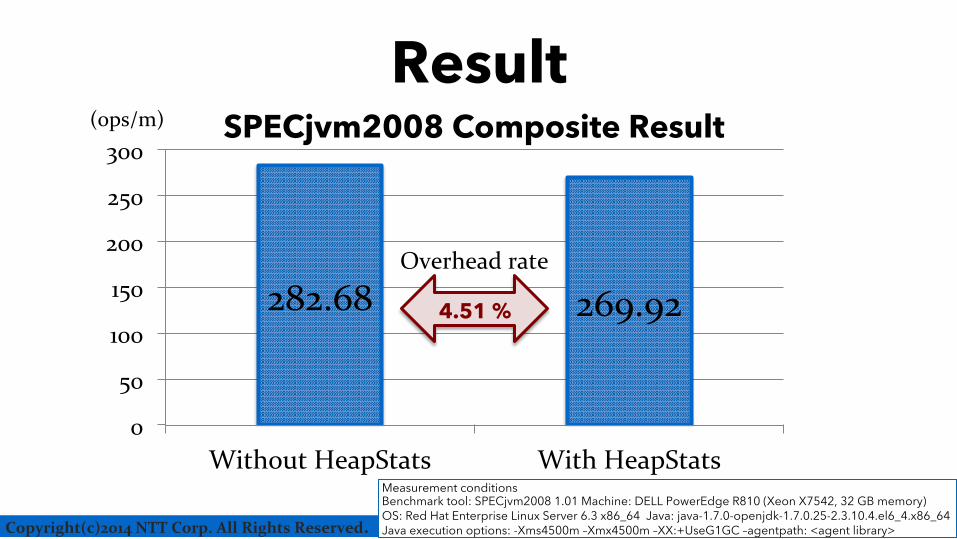
Result
282.68 269.92
0
50
100
150
200
250
300
Without HeapStats With HeapStats
4.51 %
Overhead rate
(ops/m) SPECjvm2008 Composite Result
Measurement conditions Benchmark tool: SPECjvm2008 1.01 Machine: DELL PowerEdge R810 (Xeon X7542, 32 GB memory) OS: Red Hat Enterprise Linux Server 6.3 x86_64 Java: java-1.7.0-openjdk-1.7.0.25-2.3.10.4.el6_4.x86_64 Java execution options: -Xms4500m –Xmx4500m –XX:+UseG1GC –agentpath: <agent library>
Copyright(c)2014 NTT Corp. All Rights Reserved.
#3 Visualization. We do not need to hunt for treasure
from noisy and huge log.
25
Copyright(c)2014 NTT Corp. All Rights Reserved.
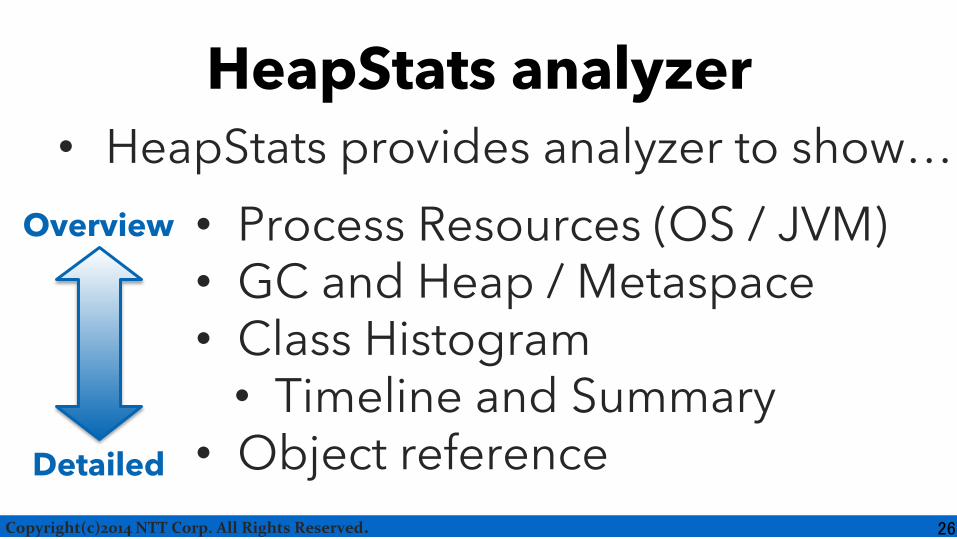
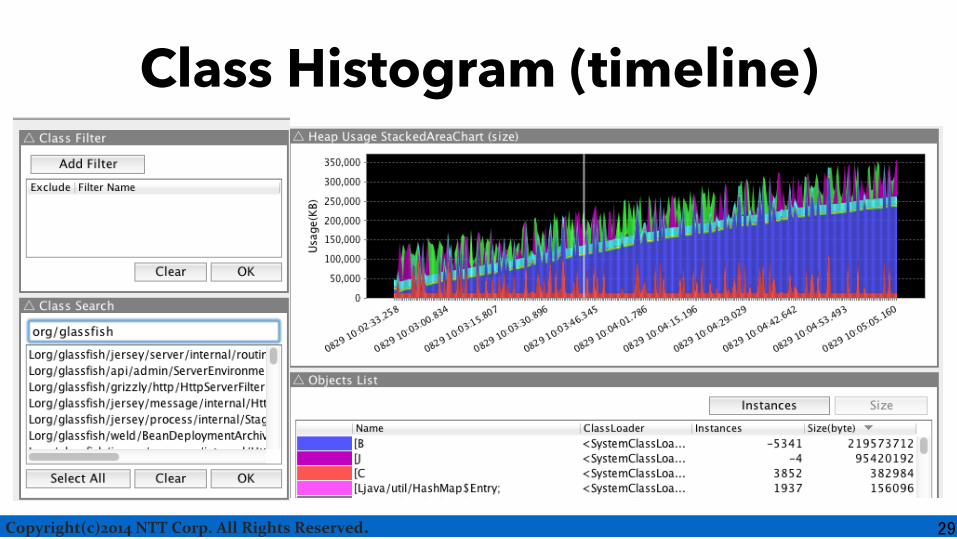
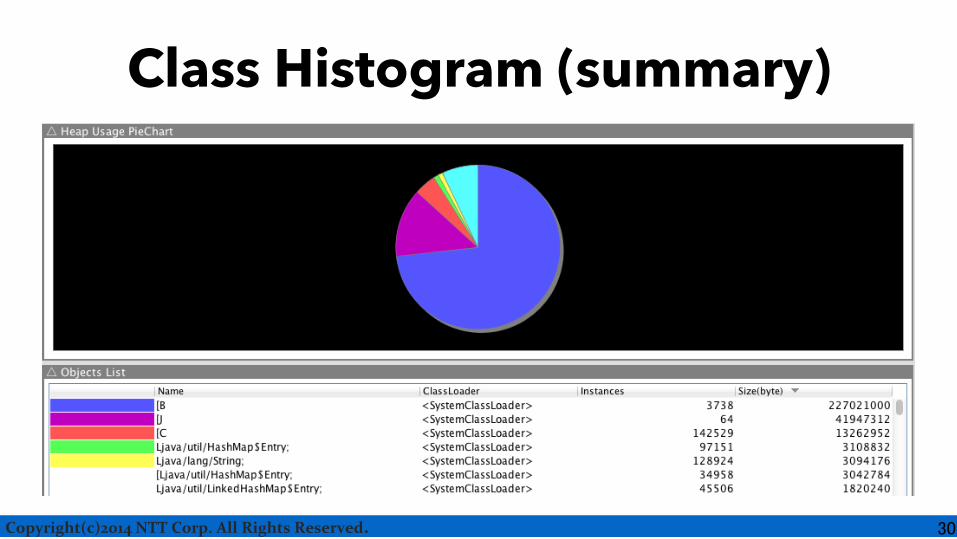
HeapStats analyzer • HeapStats provides analyzer to show…
• Process Resources (OS / JVM) • GC and Heap / Metaspace • Class Histogram
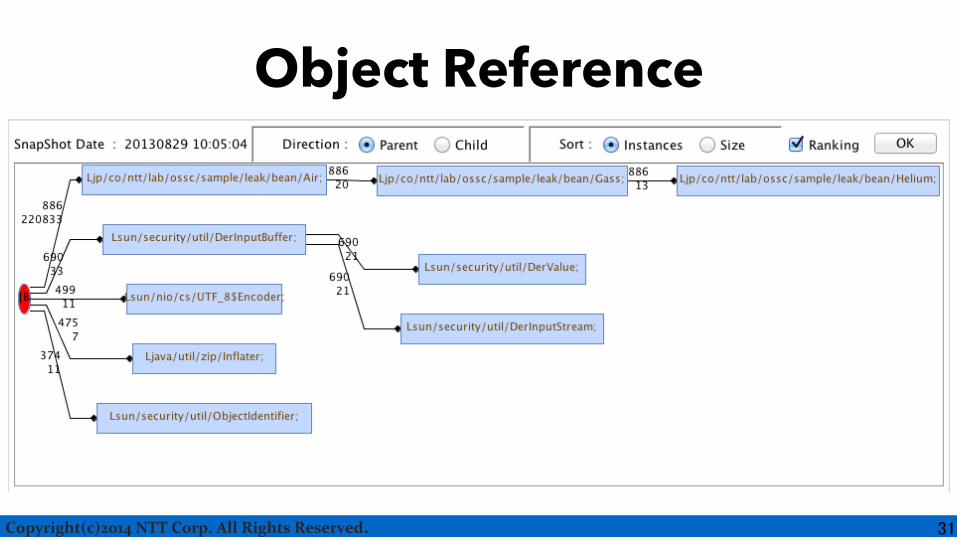
• Timeline and Summary • Object reference
Overview
Detailed
26
Copyright(c)2014 NTT Corp. All Rights Reserved.
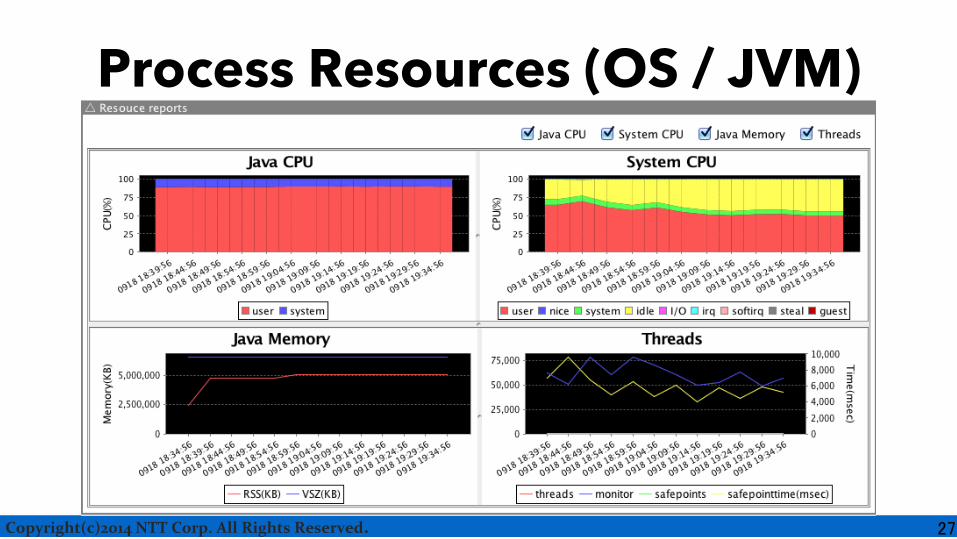
Process Resources (OS / JVM)
27
Copyright(c)2014 NTT Corp. All Rights Reserved.
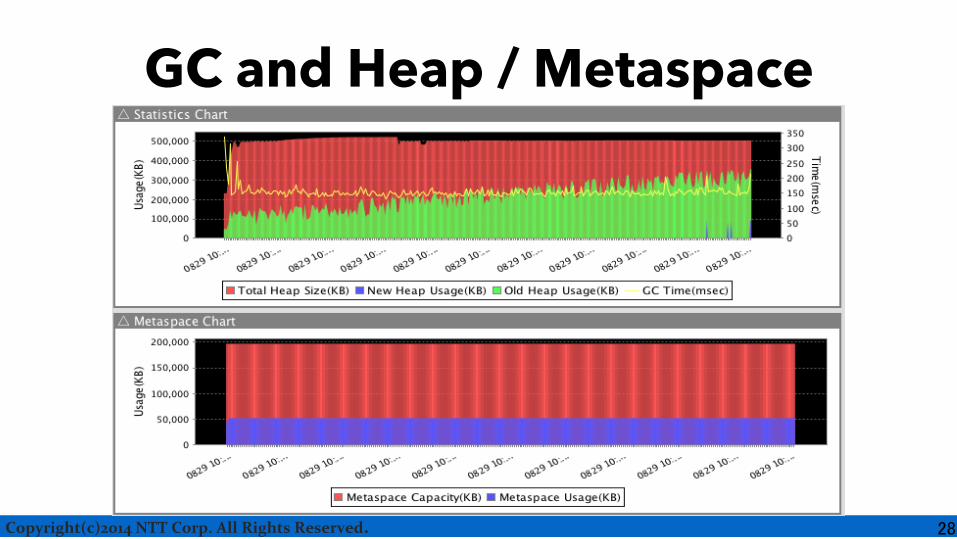
GC and Heap / Metaspace
28
Copyright(c)2014 NTT Corp. All Rights Reserved.
Class Histogram (timeline)
29
Copyright(c)2014 NTT Corp. All Rights Reserved.
Class Histogram (summary)
30
Copyright(c)2014 NTT Corp. All Rights Reserved.
Object Reference
31
Copyright(c)2014 NTT Corp. All Rights Reserved.
#4 Ease of use. Keep it simple, stupid
32
Copyright(c)2014 NTT Corp. All Rights Reserved.
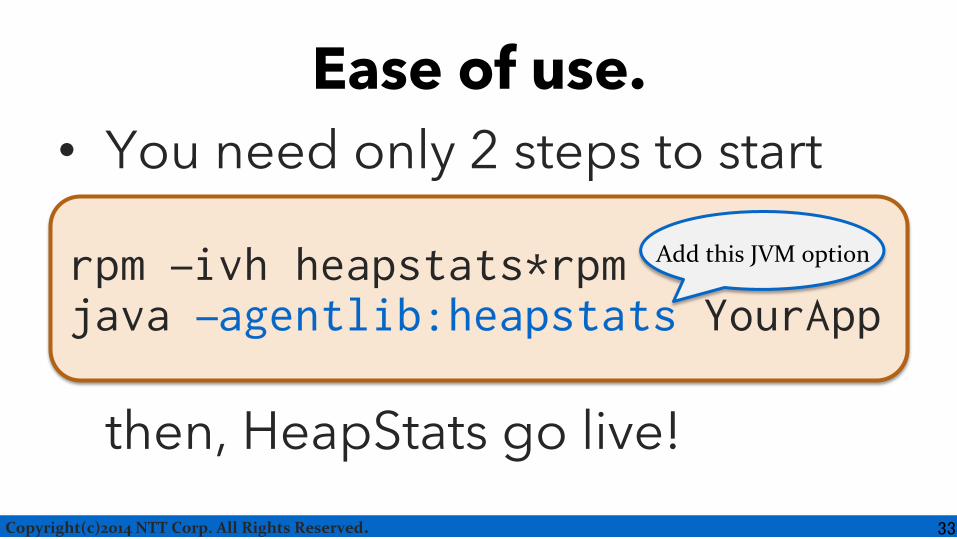
Ease of use. • You need only 2 steps to start
then, HeapStats go live!
rpm ‒ivh heapstats*rpm java ‒agentlib:heapstats YourApp
33
Add this JVM option
Copyright(c)2014 NTT Corp. All Rights Reserved.
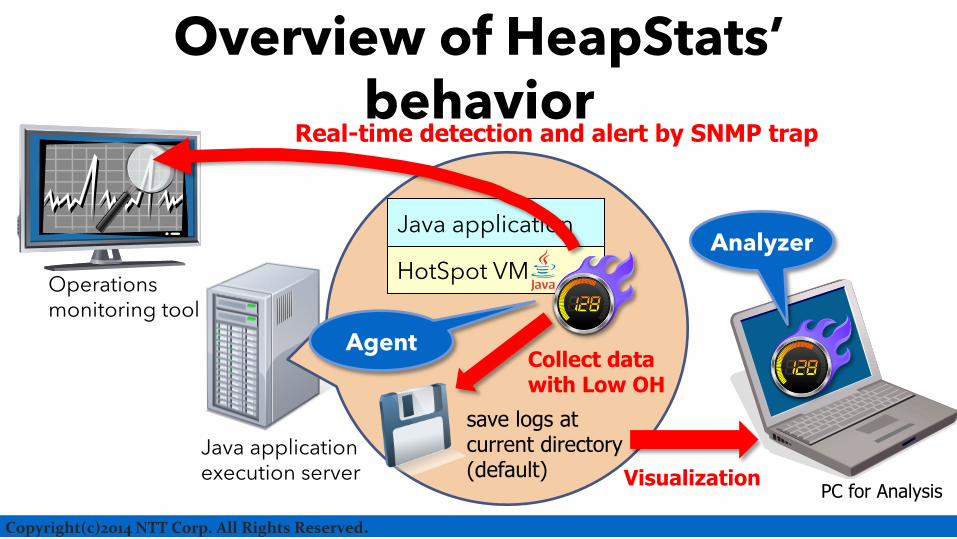
Overview of HeapStats’ behavior
Java application execution server
Operations monitoring tool
HotSpot VM
Java application
save logs at current directory (default)
Real-time detection and alert by SNMP trap �
Collect data with Low OH �
Agent
Visualization �PC for Analysis
Analyzer
Copyright(c)2014 NTT Corp. All Rights Reserved.
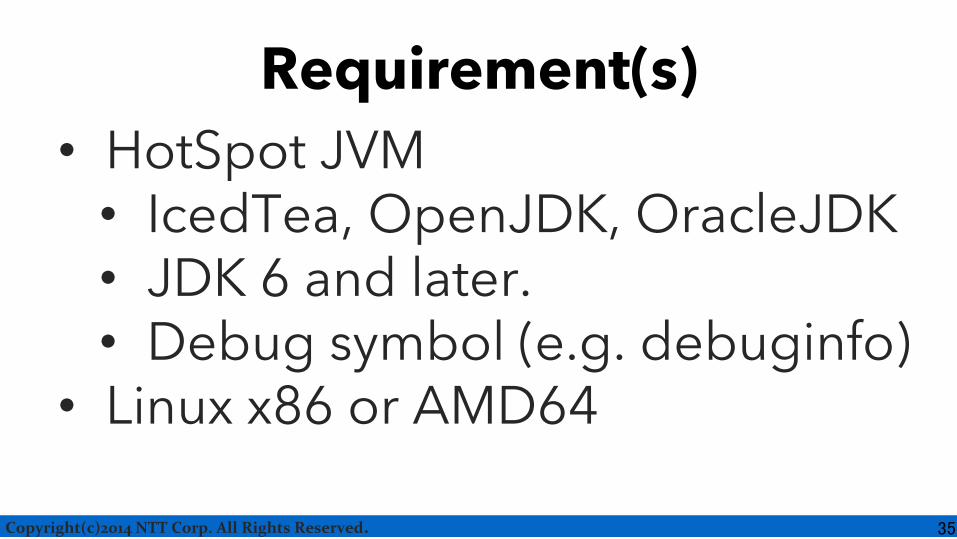
Requirement(s) • HotSpot JVM
• IcedTea, OpenJDK, OracleJDK • JDK 6 and later. • Debug symbol (e.g. debuginfo)
• Linux x86 or AMD64
35
Copyright(c)2014 NTT Corp. All Rights Reserved.
Troubleshoot with HeapStats
36
Demonstration
Copyright(c)2014 NTT Corp. All Rights Reserved.
One fine day • Customer 「Please teach us why our
application got Out of Memory. 」 • We must answer…
• What happen?: leak or shortage or… • If leak happened, what object is the
cause and how to solve it. • Let’s try troubleshoot with HeapStats.
37
Copyright(c)2014 NTT Corp. All Rights Reserved.
Demonstration
38
Copyright(c)2014 NTT Corp. All Rights Reserved.
Future Work • Collect thread statistic as GC/Heap. • More simple to install by yum/apt. • More rich interface of analyzer.
• Remake analyzer by JavaFX. • Adapt JDK9 and new pause less GC
“Shenandoah”. (in review)
39
Copyright(c)2014 NTT Corp. All Rights Reserved.
Join us! • HeapStats:
http://icedtea.classpath.org/wiki/HeapStats • Mailing List: [email protected]
http://icedtea.classpath.org/mailman/listinfo/heapstats
• Repository: hg clone http://icedtea.classpath/hg/heapstats
• Exhibition: 5013
40